Fuzzer Development 3: Building Bochs, MMU, and File I/0
Background
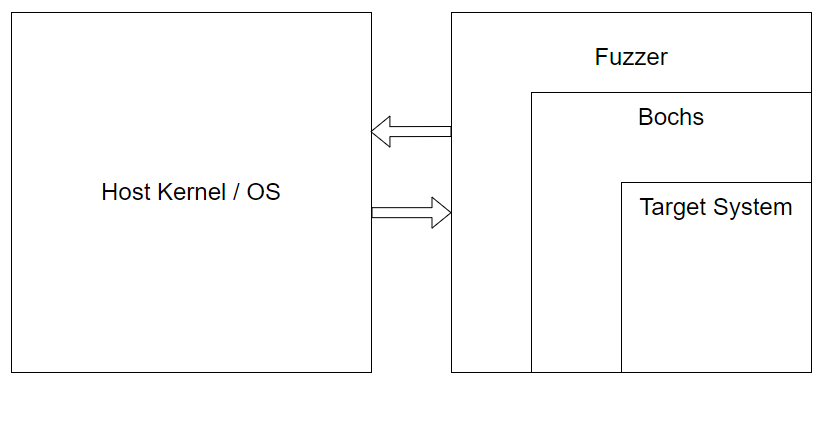
This is the next installment in a series of blogposts detailing the development process of a snapshot fuzzer that aims to utilize Bochs as a target execution engine. You can find the fuzzer and code in the Lucid repository
Introduction
We’re continuing today on our journey to develop our fuzzer. Last time we left off, we had developed the beginnings of a context-switching infrastructure so that we could sandbox Bochs (really a test program) from touching the OS kernel during syscalls.
In this post, we’re going to go over some changes and advancements we’ve made to the fuzzer and also document some progress related to Bochs itself.
Syscall Infrastructure Update
After putting out the last blogpost, I got some really good feedback and suggestions by Fuzzing discord legend WorksButNotTested, who informed me that we could cut down on a lot of complexity if we scrapped the full context-switching/C-ABI-to-Syscall-ABI-Register-Translation routines all together and simply had Bochs call a Rust function from C for syscalls. This is very intuitive and obvious in hindsight and I’m admittedly a little embarrassed to have overlooked this possibility.
Previously, in our custom Musl code, we would have a C function call like so:
static __inline long __syscall6(long n, long a1, long a2, long a3, long a4, long a5, long a6)
{
	unsigned long ret;
	register long r10 __asm__("r10") = a4;
	register long r8 __asm__("r8") = a5;
	register long r9 __asm__("r9") = a6;
	__asm__ __volatile__ ("syscall" : "=a"(ret) : "a"(n), "D"(a1), "S"(a2),
						  "d"(a3), "r"(r10), "r"(r8), "r"(r9) : "rcx", "r11", "memory");
	return ret;
}
This is the function that is called when the program needs to make a syscall with 6 arguments. In the previous blog, we changed this function to be an if/else such that if the program was running under Lucid, we would instead call into Lucid’s context-switch function after shuffling the C ABI registers to Syscall registers like so:
static __inline long __syscall6_original(long n, long a1, long a2, long a3, long a4, long a5, long a6)
{
	unsigned long ret;
	register long r10 __asm__("r10") = a4;
	register long r8  __asm__("r8")  = a5;
	register long r9  __asm__("r9")  = a6;
	__asm__ __volatile__ ("syscall" : "=a"(ret) : "a"(n), "D"(a1), "S"(a2), "d"(a3), "r"(r10),
							"r"(r8), "r"(r9) : "rcx", "r11", "memory");

	return ret;
}

static __inline long __syscall6(long n, long a1, long a2, long a3, long a4, long a5, long a6)
{
    if (!g_lucid_ctx) { return __syscall6_original(n, a1, a2, a3, a4, a5, a6); }

    register long ret;
    register long r12 __asm__("r12") = (size_t)(g_lucid_ctx->exit_handler);
    register long r13 __asm__("r13") = (size_t)(&g_lucid_ctx->register_bank);
    register long r14 __asm__("r14") = SYSCALL;
    register long r15 __asm__("r15") = (size_t)(g_lucid_ctx);

    __asm__ __volatile__ (
        "mov %1, %%rax\n\t"
	"mov %2, %%rdi\n\t"
	"mov %3, %%rsi\n\t"
	"mov %4, %%rdx\n\t"
	"mov %5, %%r10\n\t"
	"mov %6, %%r8\n\t"
	"mov %7, %%r9\n\t"
        "call *%%r12\n\t"
        "mov %%rax, %0\n\t"
        : "=r" (ret)
        : "r" (n), "r" (a1), "r" (a2), "r" (a3), "r" (a4), "r" (a5), "r" (a6),
		  "r" (r12), "r" (r13), "r" (r14), "r" (r15)
        : "rax", "rcx", "r11", "memory"
    );

	return ret;
}
So this was quite involved. I was very fixated on the idea that “Lucid has to be the kernel. And when userland programs execute a syscall, their state is saved and execution is started in the kernel”. This proved to lead me astray since such a complicated routine is not needed for our purposes, we are not actually a kernel, we just want to sandbox away syscalls for one specific program who behaves pretty well. WorksButNotTested instead suggested just calling a Rust function like so:
static __inline long __syscall6(long n, long a1, long a2, long a3, long a4, long a5, long a6)
{
	if (g_lucid_syscall)
		return g_lucid_syscall(g_lucid_ctx, n, a1, a2, a3, a4, a5, a6);

	unsigned long ret;
	register long r10 __asm__("r10") = a4;
	register long r8 __asm__("r8") = a5;
	register long r9 __asm__("r9") = a6;
	__asm__ __volatile__ ("syscall" : "=a"(ret) : "a"(n), "D"(a1), "S"(a2),
						  "d"(a3), "r"(r10), "r"(r8), "r"(r9) : "rcx", "r11", "memory");
	return ret;
}
Obviously this is a much simpler solution and we get to avoid scrambling registers/saving state/inline-assembly and the rest of it. To set this function up, we just simply created a new function pointer global variable in lucid.h in Musl and gave it a definition in src/lucid.c which can you see in the Musl patches in the repo. g_lucid_syscall looks like this on the Rust side:
pub extern "C" fn lucid_syscall(contextp: *mut LucidContext, n: usize,
    a1: usize, a2: usize, a3: usize, a4: usize, a5: usize, a6: usize)
    -> u64
We get to use the C ABI to our advantage and maintain the semantics of how a program would normally use Musl, and it’s just a very much appreciated suggestion and I couldn’t be happier with how it turned out.
Calling Convention Changes
During this refactoring for syscalls, I also simplified the way our context-switching calling convention would work. Instead of using 4 separate registers for the calling convention, I decided it was doable by just passing a pointer to the Lucid execution context and having the context_switch function itself work out how it should behave based on the context’s values. In essence, we’re moving complexity from the caller-side to the callee-side. This means that the complexity doesn’t keep recurring throughout the codebase, it is encapsulated one time, in the context_switch logic itself. This does require some hacky/brittle code however, for instance we have to hardcode some struct offsets for the Lucid execution data structure, but that is a small price to pay in my opinion for drastically reduced complexity. The context_switch code has been changed to the following
extern "C" { fn context_switch(); }
global_asm!(
    ".global context_switch",
    "context_switch:",

    // Save the CPU flags before we do any operations
    "pushfq",

    // Save registers we use for scratch
    "push r14",
    "push r13",

    // Determine what execution mode we're in
    "mov r14, r15",
    "add r14, 0x8",     // mode is at offset 0x8 from base
    "mov r14, [r14]",
    "cmp r14d, 0x0",
    "je save_bochs",

    // We're in Lucid mode so save Lucid GPRs
    "save_lucid: ",
    "mov r14, r15",
    "add r14, 0x10",    // lucid_regs is at offset 0x10 from base
    "jmp save_gprs",

    // We're in Bochs mode so save Bochs GPRs
    "save_bochs: ",
    "mov r14, r15",
    "add r14, 0x90",    // bochs_regs is at offset 0x90 from base
    "jmp save_gprs",
You can see that once we hit the context_switch function we save the CPU flags before we do anything that would affect them, then we save a couple of registers that we use as scratch registers. Then we’re free to check the value of context->mode in order to determine what mode of execution we’re in. Based on that value, we are able to know what register bank to use to save our general-purpose registers. So yes, we do have to hardcode some offsets, but I believe overall this is a much better API and system for context-switching callees and the data-structure itself should be relatively stable at this point and not require massive refactoring.
Introducing Faults
Since the last blog-post, I’ve introduced the concept of Fault which is an error class that is reserved for instances when some sort of error is encountered during either context-switching code or syscall-handling. This error is distinct from our highest-level error LucidErr. Ultimately, these faults are plumbed back up to Lucid when they are encountered so that Lucid can handle them. As of this moment, Lucid calls any Fault fatal.
We are able to plumb these back up to Lucid because before starting Bochs execution we now save Lucid’s state and context-switch into starting Bochs:
#[inline(never)]
pub fn start_bochs(context: &mut LucidContext) {
    // Set the execution mode and the reason why we're exiting the Lucid VM
    context.mode = ExecMode::Lucid;
    context.exit_reason = VmExit::StartBochs;

    // Set up the calling convention and then start Bochs by context switching
    unsafe {
        asm!(
            "push r15", // Callee-saved register we have to preserve
            "mov r15, {0}", // Move context into R15
            "call qword ptr [r15]", // Call context_switch
            "pop r15",  // Restore callee-saved register
            in(reg) context as *mut LucidContext,
        );
    }
}
We make some changes to the execution context, namely marking the execution mode (Lucid-mode) and setting the reason why we’re context-switching (to start Bochs). Then in the inline assembly, we call the function pointer at offset 0 in the execution context structure:
// Execution context that is passed between Lucid and Bochs that tracks
// all of the mutable state information we need to do context-switching
#[repr(C)]
#[derive(Clone)]
pub struct LucidContext {
    pub context_switch: usize,  // Address of context_switch()
So then our Lucid state is saved in the context_switch routine and we are then passed to this logic:
// Handle Lucid context switches here
    if LucidContext::is_lucid_mode(context) {
        match exit_reason {
            // Dispatch to Bochs entry point
            VmExit::StartBochs => {
                jump_to_bochs(context);
            },
            _ => {
                fault!(context, Fault::BadLucidExit);
            }
        }
    }
Finally, we call jump_to_bochs:
// Standalone function to literally jump to Bochs entry and provide the stack
// address to Bochs
fn jump_to_bochs(context: *mut LucidContext) {
    // RDX: we have to clear this register as the ABI specifies that exit
    // hooks are set when rdx is non-null at program start
    //
    // RAX: arbitrarily used as a jump target to the program entry
    //
    // RSP: Rust does not allow you to use 'rsp' explicitly with in(), so we
    // have to manually set it with a `mov`
    //
    // R15: holds a pointer to the execution context, if this value is non-
    // null, then Bochs learns at start time that it is running under Lucid
    //
    // We don't really care about execution order as long as we specify clobbers
    // with out/lateout, that way the compiler doesn't allocate a register we
    // then immediately clobber
    unsafe {
        asm!(
            "xor rdx, rdx",
            "mov rsp, {0}",
            "mov r15, {1}",
            "jmp rax",
            in(reg) (*context).bochs_rsp,
            in(reg) context,
            in("rax") (*context).bochs_entry,
            lateout("rax") _,   // Clobber (inout so no conflict with in)
            out("rdx") _,       // Clobber
            out("r15") _,       // Clobber
        );
    }
}
Full-blown context-switching like this, allows us to encounter a Fault and then pass that error back to Lucid for handling. In the fault_handler, we set the Fault type in the execution context, and then we attempt to restore execution back to Lucid:
// Where we handle faults that may occur when context-switching from Bochs. We
// just want to make the fault visible to Lucid so we set it in the context,
// then we try to restore Lucid execution from its last-known good state
pub fn fault_handler(contextp: *mut LucidContext, fault: Fault) {
    let context = unsafe { &mut *contextp };
    match fault {
        Fault::Success => context.fault = Fault::Success,
        ...
    }

    // Attempt to restore Lucid execution
    restore_lucid_execution(contextp);
}
// We use this function to restore Lucid execution to its last known good state
// This is just really trying to plumb up a fault to a level that is capable of
// discerning what action to take. Right now, we probably just call it fatal.
// We don't really deal with double-faults, it doesn't make much sense at the
// moment when a single-fault will likely be fatal already. Maybe later?
fn restore_lucid_execution(contextp: *mut LucidContext) {
    let context = unsafe { &mut *contextp };

    // Fault should be set, but change the execution mode now since we're
    // jumping back to Lucid
    context.mode = ExecMode::Lucid;

    // Restore extended state
    let save_area = context.lucid_save_area;
    let save_inst = context.save_inst;
    match save_inst {
        SaveInst::XSave64 => {
            // Retrieve XCR0 value, this will serve as our save mask
            let xcr0 = unsafe { _xgetbv(0) };

            // Call xrstor to restore the extended state from Bochs save area
            unsafe { _xrstor64(save_area as *const u8, xcr0); }
        },
        SaveInst::FxSave64 => {
            // Call fxrstor to restore the extended state from Bochs save area
            unsafe { _fxrstor64(save_area as *const u8); }
        },
        _ => (), // NoSave
    }

    // Next, we need to restore our GPRs. This is kind of different order than
    // returning from a successful context switch since normally we'd still be
    // using our own stack; however right now, we still have Bochs' stack, so
    // we need to recover our own Lucid stack which is saved as RSP in our
    // register bank
    let lucid_regsp = &context.lucid_regs as *const _;

    // Move that pointer into R14 and restore our GPRs. After that we have the
    // RSP value that we saved when we called into context_switch, this RSP was
    // then subtracted from by 0x8 for the pushfq operation that comes right
    // after. So in order to recover our CPU flags, we need to manually sub
    // 0x8 from the stack pointer. Pop the CPU flags back into place, and then
    // return to the last known good Lucid state
    unsafe {
        asm!(
            "mov r14, {0}",
            "mov rax, [r14 + 0x0]",
            "mov rbx, [r14 + 0x8]",
            "mov rcx, [r14 + 0x10]",
            "mov rdx, [r14 + 0x18]",
            "mov rsi, [r14 + 0x20]",
            "mov rdi, [r14 + 0x28]",
            "mov rbp, [r14 + 0x30]",
            "mov rsp, [r14 + 0x38]",
            "mov r8, [r14 + 0x40]",
            "mov r9, [r14 + 0x48]",
            "mov r10, [r14 + 0x50]",
            "mov r11, [r14 + 0x58]",
            "mov r12, [r14 + 0x60]",
            "mov r13, [r14 + 0x68]",
            "mov r15, [r14 + 0x78]",
            "mov r14, [r14 + 0x70]",
            "sub rsp, 0x8",
            "popfq",
            "ret",
            in(reg) lucid_regsp,
        );
    }
}
As you can see, restoring Lucid state and resuming execution is quite involved, One tricky thing we had to deal with was the fact that right now, when a Fault occurs, we are likely operating in Bochs mode which means that our stack is Bochs’ stack and not Lucid’s. So even though this is technically just a context-switch, we had to change the order around a little bit to pop Lucid’s saved state into our current state and resume execution. Now when Lucid calls functions that context-switch, it can simply check the “return” value of such functions by checking if there was a Fault noted in the execution context like so:
	// Start executing Bochs
    prompt!("Starting Bochs...");
    start_bochs(&mut lucid_context);

    // Check to see if any faults occurred during Bochs execution
    if !matches!(lucid_context.fault, Fault::Success) {
        fatal!(LucidErr::from_fault(lucid_context.fault));
    }
Pretty neat imo!
Sandboxing Thread-Local-Storage
Coming into this project, I honestly didn’t know much about thread-local-storage (TLS) except that it was some magic per-thread area of memory that did stuff. That is still the entirety of my knowledge really, except now I’ve seen some code that allocates that memory and initializes it, which helps me appreciate what is really going on.
Once I implemented the Fault system discussed above, I noticed that Lucid would segfault when exiting. After some debugging, I realized it was calling a function pointer that was a bogus address. How could this have happened? Well, after some digging, I noticed that right before that function call, an offset of the fs register was used to load the address from memory. Typically, fs is used to access TLS. So at that point, I had a strong suspicion that Bochs had somehow corrupted the value of my fs register. So I did a quick grep through Musl looking for fs register access and found the following:
/* Copyright 2011-2012 Nicholas J. Kain, licensed under standard MIT license */
.text
.global __set_thread_area
.hidden __set_thread_area
.type __set_thread_area,@function
__set_thread_area:
	mov %rdi,%rsi           /* shift for syscall */
	movl $0x1002,%edi       /* SET_FS register */
	movl $158,%eax          /* set fs segment to */
	syscall                 /* arch_prctl(SET_FS, arg)*/
	ret
So this function, __set_thread_area uses an inline syscall instruction to call arch_prctl to directly manipulate the fs register. This made a lot of sense because, if the syscall instruction was indeed called, we wouldn’t intercept this with our syscall sandboxing infrastructure because we never instrumented this, we’ve only instrumented what boils down to the syscall() function wrapper in Musl. So this would escape our sandbox and directly manipulate fs. Sure enough, I discovered that this function is called during TLS initialization in src/env/__init_tls.c:
int __init_tp(void *p)
{
	pthread_t td = p;
	td->self = td;
	int r = __set_thread_area(TP_ADJ(p));
	if (r < 0) return -1;
	if (!r) libc.can_do_threads = 1;
	td->detach_state = DT_JOINABLE;
	td->tid = __syscall(SYS_set_tid_address, &__thread_list_lock);
	td->locale = &libc.global_locale;
	td->robust_list.head = &td->robust_list.head;
	td->sysinfo = __sysinfo;
	td->next = td->prev = td;
	return 0;
}
So in this __init_tp function, we’re given a pointer and then we call TP_ADJ macro to do some arithmetic on the pointer and pass that value to __set_thread_area so that fs is manipulated. Great, now how do we sandbox this? I wanted to avoid messing with the inline assembly in __set_thread_area itself, so I just changed the source so that Musl would instead just utilize the syscall() wrapper function which calls our instrumented syscall functions under the hood, like so:
#ifndef ARCH_SET_FS
#define ARCH_SET_FS 0x1002
#endif /* ARCH_SET_FS */

int __init_tp(void *p)
{
	pthread_t td = p;
	td->self = td;
	int r = syscall(SYS_arch_prctl, ARCH_SET_FS, TP_ADJ(p));
	//int r = __set_thread_area(TP_ADJ(p));
Now, we can intercept this syscall in Lucid and effectively do nothing really. As long as there are not other direct accesses to fs (and there might be still!), we should be fine here. I also adjusted the Musl code so that if we’re running under Lucid, we provide a TLS-area via the execution context by just creating a mock area of what Musl calls the builtin_tls:
static struct builtin_tls {
	char c;
	struct pthread pt;
	void *space[16];
} builtin_tls[1];
So now, when __init_tp is called, the pointer it is giving points to our own TLS block of memory we’ve created in the execution context so that we now have access to things like errno in Lucid:
if (libc.tls_size > sizeof builtin_tls) {
#ifndef SYS_mmap2
#define SYS_mmap2 SYS_mmap
#endif
		__asm__ __volatile__ ("int3"); // Added by me just in case
		mem = (void *)__syscall(
			SYS_mmap2,
			0, libc.tls_size, PROT_READ|PROT_WRITE,
			MAP_ANONYMOUS|MAP_PRIVATE, -1, 0);
		/* -4095...-1 cast to void * will crash on dereference anyway,
		 * so don't bloat the init code checking for error codes and
		 * explicitly calling a_crash(). */
	} else {
		// Check to see if we're running under Lucid or not
		if (!g_lucid_ctx) { mem = builtin_tls; }
		else { mem = &g_lucid_ctx->tls; }
	}

	/* Failure to initialize thread pointer is always fatal. */
	if (__init_tp(__copy_tls(mem)) < 0)
		a_crash();
#[repr(C)]
#[derive(Clone)]
pub struct Tls {
    padding0: [u8; 8], // char c
    padding1: [u8; 52], // Padding to offset of errno which is 52-bytes
    pub errno: i32,
    padding2: [u8; 144], // Additional padding to get to 200-bytes total
    padding3: [u8; 128], // 16 void * values
}
So now for example, if during a read syscall, we get passed a NULL buffer, we can return an error code and set errno appropriately from the syscall handler in Lucid:
            // Now we need to make sure the buffer passed to read isn't NULL
            let buf_p = a2 as *mut u8;
            if buf_p.is_null() {
                context.tls.errno = libc::EINVAL;
                return -1_i64 as u64;
            }
There may still be other accesses to fs and gs that I’m not currently sandboxing, but we haven’t reached that part of development yet.
Building Bochs
I put off building and loading Bochs for a long time because I wanted to make sure I had the foundations of context-switching and syscall-sandboxing built. I also was worried that it would be difficult since getting vanilla Bochs built --static-pie was difficult for me initially. To complicate building Bochs in general, we need to build Bochs against our custom Musl. This means that we’ll need to have a compiler that we can tell to ignore whatever standard C library it normally uses and use our custom Musl libc instead. This proved quite tedious and difficult for me. Once I was successful, I came to realize that wasn’t enough. Bochs, being a C++ code base, also required access to standard C++ library functions. This simply could not work as I had done previously with the test program because I didn’t have a C++ library that we could use that had been built against our custom Musl.
Luckily, there is an awesome project called the musl-cross-make project, which aims to help people build their own Musl toolchains from scratch. This is perfect for what we need because we require a complete toolchain. We need to support the C++ standard library and it needs to be built with our custom Musl. So to do this, we use the The GNU C++ Library, libstdc++, that is part of the gcc project.
musl-cross-make will pull down all of constituent tool-chain components and create a from scratch tool chain that will utilize a Musl libc and a libstdc++ built against that Musl. Then all we have to do for our purposes, is recompile that Musl libc with our custom patches that we make with Lucid, and then use the tool chain to compile Bochs as --static-pie. It really was as simple as:
- git clone musl-cross-make
- configure an x86_64 tool chain target
- build the tool chain
- go into its Musl directory, apply our Musl patches
- configure Musl to build/install into the musl-cross-make output directory
- re-build Musl libc
- configure Bochs to use the new toolchain and set the
--static-pieflag
This is the Bochs configuration file that I used to build Bochs:
#!/bin/sh

CC="/home/h0mbre/musl_stuff/musl-cross-make/output/bin/x86_64-linux-musl-gcc"
CXX="/home/h0mbre/musl_stuff/musl-cross-make/output/bin/x86_64-linux-musl-g++"
CFLAGS="-Wall --static-pie -fPIE"
CXXFLAGS="$CFLAGS"

export CC
export CXX
export CFLAGS
export CXXFLAGS

./configure --enable-sb16 \
                --enable-all-optimizations \
                --enable-long-phy-address \
                --enable-a20-pin \
                --enable-cpu-level=6 \
                --enable-x86-64 \
                --enable-vmx=2 \
                --enable-pci \
                --enable-usb \
                --enable-usb-ohci \
                --enable-usb-ehci \
                --enable-usb-xhci \
                --enable-busmouse \
                --enable-e1000 \
                --enable-show-ips \
                --enable-avx \
                --with-nogui
This was enough to get the Bochs binary I wanted to begin testing with. In the future we will likely need to change this configuration file, but for now this works. The repository should have more detailed build instructions and also will include already built Bochs binary.
Implementing a Simple MMU
Now that we are loading and executing Bochs and sandboxing it from syscalls, there are several new syscalls that we need to implement such as brk, mmap, and munmap. Our test program was very simple and we hadn’t come across these syscalls yet.
These three syscalls all manipulate memory in some way, so I decided that we needed to implement some sort of Memory-Manager (MMU). To keep things as simple as possible, I decided that, at least for now, we will not be worrying about freeing memory, re-using memory, or unmapping memory. We will simply pre-allocate a pool of memory for both brk calls to use and mmap calls to use, so two pre-allocated pools of memory. We can also just hang the MMU structure off of the execution context so that we always have access to it during syscalls and context-switches.
So far, Bochs really only cares to map memory in that is READ/WRITE, so that works in our favor in terms of simplicity. So to pre-allocate the memory pools, we just do a fairly large mmap call ourselves when we set up the MMU as part of the execution context initialization routine:
// Structure to track memory usage in Bochs
#[derive(Clone)]
pub struct Mmu {
    pub brk_base: usize,        // Base address of brk region, never changes
    pub brk_size: usize,        // Size of the program break region
    pub curr_brk: usize,        // The current program break

    pub mmap_base: usize,       // Base address of the `mmap` pool
    pub mmap_size: usize,       // Size of the `mmap` pool
    pub curr_mmap: usize,       // The current `mmap` page base
    pub next_mmap: usize,       // The next allocation base address
}

impl Mmu {
    pub fn new() -> Result<Self, LucidErr> {
        // We don't care where it's mapped
        let addr = std::ptr::null_mut::<libc::c_void>();

        // Straight-forward
        let length = (DEFAULT_BRK_SIZE + DEFAULT_MMAP_SIZE) as libc::size_t;

        // This is normal
        let prot = libc::PROT_WRITE | libc::PROT_READ;

        // This might change at some point?
        let flags = libc::MAP_ANONYMOUS | libc::MAP_PRIVATE;

        // No file backing
        let fd = -1 as libc::c_int;

        // No offset
        let offset = 0 as libc::off_t;

        // Try to `mmap` this block
        let result = unsafe {
            libc::mmap(
                addr,
                length,
                prot,
                flags,
                fd,
                offset
            )
        };

        if result == libc::MAP_FAILED {
            return Err(LucidErr::from("Failed `mmap` memory for MMU"));
        }

        // Create MMU
        Ok(Mmu {
            brk_base: result as usize,
            brk_size: DEFAULT_BRK_SIZE,
            curr_brk: result as usize,
            mmap_base: result as usize + DEFAULT_BRK_SIZE,
            mmap_size: DEFAULT_MMAP_SIZE,
            curr_mmap: result as usize + DEFAULT_BRK_SIZE,
            next_mmap: result as usize + DEFAULT_BRK_SIZE,
        })
    }
Handling memory-management syscalls actually wasn’t too difficult, there were some gotcha’s early on but we managed to get something working fairly quickly.
Handling brk
brk is a syscall used to increase the size of the data segment in your program. So a typical pattern you’ll see is that the program will call brk(0), which will return the current program break address, and then if the program wants 2 pages of extra memory, it will then call brk(base + 0x2000), and you can see that in the Bochs strace output:
[devbox:~/bochs/bochs-2.7]$ strace ./bochs
execve("./bochs", ["./bochs"], 0x7ffda7f39ad0 /* 45 vars */) = 0
arch_prctl(ARCH_SET_FS, 0x7fd071a738a8) = 0
set_tid_address(0x7fd071a739d0)         = 289704
brk(NULL)                               = 0x555555d7c000
brk(0x555555d7e000)                     = 0x555555d7e000
So in our syscall handler, I have the following logic for brk:
// brk
        0xC => {
            // Try to update the program break
            if context.mmu.update_brk(a1).is_err() {
                fault!(contextp, Fault::InvalidBrk);
            }

            // Return the program break
            context.mmu.curr_brk as u64
        },
This is effectively a wrapper around the update_brk method we’ve implemented for Mmu, so let’s look at that:
// Logic for handling a `brk` syscall
    pub fn update_brk(&mut self, addr: usize) -> Result<(), ()> {
        // If addr is NULL, just return nothing to do
        if addr == 0 { return Ok(()); }

        // Check to see that the new address is in a valid range
        let limit = self.brk_base + self.brk_size;
        if !(self.curr_brk..limit).contains(&addr) { return Err(()); }

        // So we have a valid program break address, update the current break
        self.curr_brk = addr;

        Ok(())
    }
So if we get a NULL argument in a1, we have nothing to do, nothing in the current MMU state needs adjusting, we just simply return the current program break. If we get a non-NULL argument, we do a sanity check to make sure that our pool of brk memory is large enough to accomodate the request and if it is, we adjust the current program break and return that to the caller.
Remember, this is so simple because we’ve already pre-allocated all of the memory, so we don’t need to actually do much here besides adjust what amounts to an offset indicating what memory is valid.
Handling mmap and munmap
mmap is a bit more involved, but still easy to track through. For mmap calls, theres more state we need to track because there are essentially “allocations” taking place that we need to keep in mind. Most mmap calls will have a NULL argument for address because they don’t care where the memory mapping takes place in virtual memory, in that case, we default to our main method do_mmap that we’ve implemented for Mmu:
// If a1 is NULL, we just do a normal mmap
            if a1 == 0 {
                if context.mmu.do_mmap(a2, a3, a4, a5, a6).is_err() {
                    fault!(contextp, Fault::InvalidMmap);
                }

                // Succesful regular mmap
                return context.mmu.curr_mmap as u64;
            }
// Logic for handling a `mmap` syscall with no fixed address support
    pub fn do_mmap(
        &mut self,
        len: usize,
        prot: usize,
        flags: usize,
        fd: usize,
        offset: usize
    ) -> Result<(), ()> {
        // Page-align the len
        let len = (len + PAGE_SIZE - 1) & !(PAGE_SIZE - 1);

        // Make sure we have capacity left to satisfy this request
        if len + self.next_mmap > self.mmap_base + self.mmap_size {
            return Err(());
        }

        // Sanity-check that we don't have any weird `mmap` arguments
        if prot as i32 != libc::PROT_READ | libc::PROT_WRITE {
            return Err(())
        }

        if flags as i32 != libc::MAP_PRIVATE | libc::MAP_ANONYMOUS {
            return Err(())
        }

        if fd as i64 != -1 {
            return Err(())
        }

        if offset != 0 {
            return Err(())
        }

        // Set current to next, and set next to current + len
        self.curr_mmap = self.next_mmap;
        self.next_mmap = self.curr_mmap + len;

        // curr_mmap now represents the base of the new requested allocation
        Ok(())
    }
Very simply, we do some sanity checks to make sure we have enough capacity to satisfy the allocation in our mmap memory pool, we check to make sure the other arguments are what we’re anticipating, and then we simply update the current offset and the next offset. This way we know next time where to allocate from while also being able to return the current allocation base back to the caller.
There is also a case where mmap will be called with a non-NULL address and MAP_FIXED flags meaning that the address matters to the caller and the mapping should take place at the provided virtual address. Right now, this occurs early on in the Bochs process:
[devbox:~/bochs/bochs-2.7]$ strace ./bochs
execve("./bochs", ["./bochs"], 0x7ffda7f39ad0 /* 45 vars */) = 0
arch_prctl(ARCH_SET_FS, 0x7fd071a738a8) = 0
set_tid_address(0x7fd071a739d0)         = 289704
brk(NULL)                               = 0x555555d7c000
brk(0x555555d7e000)                     = 0x555555d7e000
mmap(0x555555d7c000, 4096, PROT_NONE, MAP_PRIVATE|MAP_FIXED|MAP_ANONYMOUS, -1, 0) = 0x555555d7c000
For this special case, there is really nothing for us to do since that address is in the brk pool. We already know about that memory, we’ve already created it, so this last mmap call you see above amounts to a NOP for us, there is nothing to do but return the address back to the caller.
At this time, we don’t support MAP_FIXED calls for non-brk pool memory.
For munmap, we also treat this operation as a NOP and return success to the user because we’re not concerned with freeing or re-using memory at this time.
You can see that Bochs does quite a bit of brk and mmap calls and our fuzzer is now capable of handling them all via our MMU:
...
brk(NULL)                               = 0x555555d7c000
brk(0x555555d7e000)                     = 0x555555d7e000
mmap(0x555555d7c000, 4096, PROT_NONE, MAP_PRIVATE|MAP_FIXED|MAP_ANONYMOUS, -1, 0) = 0x555555d7c000
mmap(NULL, 4096, PROT_READ|PROT_WRITE, MAP_PRIVATE|MAP_ANONYMOUS, -1, 0) = 0x7fd071bde000
mmap(NULL, 16384, PROT_READ|PROT_WRITE, MAP_PRIVATE|MAP_ANONYMOUS, -1, 0) = 0x7fd071bda000
mmap(NULL, 4194324, PROT_READ|PROT_WRITE, MAP_PRIVATE|MAP_ANONYMOUS, -1, 0) = 0x7fd06f7ff000
mmap(NULL, 73728, PROT_READ|PROT_WRITE, MAP_PRIVATE|MAP_ANONYMOUS, -1, 0) = 0x7fd071bc8000
mmap(NULL, 4096, PROT_READ|PROT_WRITE, MAP_PRIVATE|MAP_ANONYMOUS, -1, 0) = 0x7fd071bc7000
mmap(NULL, 4096, PROT_READ|PROT_WRITE, MAP_PRIVATE|MAP_ANONYMOUS, -1, 0) = 0x7fd071bc6000
mmap(NULL, 4096, PROT_READ|PROT_WRITE, MAP_PRIVATE|MAP_ANONYMOUS, -1, 0) = 0x7fd071bc5000
mmap(NULL, 4096, PROT_READ|PROT_WRITE, MAP_PRIVATE|MAP_ANONYMOUS, -1, 0) = 0x7fd071bc4000
mmap(NULL, 4096, PROT_READ|PROT_WRITE, MAP_PRIVATE|MAP_ANONYMOUS, -1, 0) = 0x7fd071bc3000
mmap(NULL, 4096, PROT_READ|PROT_WRITE, MAP_PRIVATE|MAP_ANONYMOUS, -1, 0) = 0x7fd071bc2000
mmap(NULL, 4096, PROT_READ|PROT_WRITE, MAP_PRIVATE|MAP_ANONYMOUS, -1, 0) = 0x7fd071bc1000
mmap(NULL, 4096, PROT_READ|PROT_WRITE, MAP_PRIVATE|MAP_ANONYMOUS, -1, 0) = 0x7fd071bc0000
mmap(NULL, 8192, PROT_READ|PROT_WRITE, MAP_PRIVATE|MAP_ANONYMOUS, -1, 0) = 0x7fd071bbe000
mmap(NULL, 4096, PROT_READ|PROT_WRITE, MAP_PRIVATE|MAP_ANONYMOUS, -1, 0) = 0x7fd071bbd000
mmap(NULL, 4096, PROT_READ|PROT_WRITE, MAP_PRIVATE|MAP_ANONYMOUS, -1, 0) = 0x7fd071bbc000
mmap(NULL, 4096, PROT_READ|PROT_WRITE, MAP_PRIVATE|MAP_ANONYMOUS, -1, 0) = 0x7fd071bbb000
munmap(0x7fd071bbb000, 4096)            = 0
mmap(NULL, 4096, PROT_READ|PROT_WRITE, MAP_PRIVATE|MAP_ANONYMOUS, -1, 0) = 0x7fd071bbb000
mmap(NULL, 4096, PROT_READ|PROT_WRITE, MAP_PRIVATE|MAP_ANONYMOUS, -1, 0) = 0x7fd071bba000
mmap(NULL, 4096, PROT_READ|PROT_WRITE, MAP_PRIVATE|MAP_ANONYMOUS, -1, 0) = 0x7fd071bb9000
mmap(NULL, 4096, PROT_READ|PROT_WRITE, MAP_PRIVATE|MAP_ANONYMOUS, -1, 0) = 0x7fd071bb8000
brk(0x555555d7f000)                     = 0x555555d7f000
mmap(NULL, 8192, PROT_READ|PROT_WRITE, MAP_PRIVATE|MAP_ANONYMOUS, -1, 0) = 0x7fd071bb6000
mmap(NULL, 4096, PROT_READ|PROT_WRITE, MAP_PRIVATE|MAP_ANONYMOUS, -1, 0) = 0x7fd071bb5000
munmap(0x7fd071bb5000, 4096)            = 0
mmap(NULL, 4096, PROT_READ|PROT_WRITE, MAP_PRIVATE|MAP_ANONYMOUS, -1, 0) = 0x7fd071bb5000
mmap(NULL, 4096, PROT_READ|PROT_WRITE, MAP_PRIVATE|MAP_ANONYMOUS, -1, 0) = 0x7fd071bb4000
mmap(NULL, 4096, PROT_READ|PROT_WRITE, MAP_PRIVATE|MAP_ANONYMOUS, -1, 0) = 0x7fd071bb3000
mmap(NULL, 4096, PROT_READ|PROT_WRITE, MAP_PRIVATE|MAP_ANONYMOUS, -1, 0) = 0x7fd071bb2000
mmap(NULL, 4096, PROT_READ|PROT_WRITE, MAP_PRIVATE|MAP_ANONYMOUS, -1, 0) = 0x7fd071bb1000
mmap(NULL, 4096, PROT_READ|PROT_WRITE, MAP_PRIVATE|MAP_ANONYMOUS, -1, 0) = 0x7fd071bb0000
mmap(NULL, 4096, PROT_READ|PROT_WRITE, MAP_PRIVATE|MAP_ANONYMOUS, -1, 0) = 0x7fd071baf000
mmap(NULL, 4096, PROT_READ|PROT_WRITE, MAP_PRIVATE|MAP_ANONYMOUS, -1, 0) = 0x7fd071bae000
munmap(0x7fd071bae000, 4096)            = 0
mmap(NULL, 4096, PROT_READ|PROT_WRITE, MAP_PRIVATE|MAP_ANONYMOUS, -1, 0) = 0x7fd071bae000
munmap(0x7fd071bae000, 4096)            = 0
mmap(NULL, 4096, PROT_READ|PROT_WRITE, MAP_PRIVATE|MAP_ANONYMOUS, -1, 0) = 0x7fd071bae000
mmap(NULL, 4096, PROT_READ|PROT_WRITE, MAP_PRIVATE|MAP_ANONYMOUS, -1, 0) = 0x7fd071bad000
mmap(NULL, 8192, PROT_READ|PROT_WRITE, MAP_PRIVATE|MAP_ANONYMOUS, -1, 0) = 0x7fd071bab000
mmap(NULL, 4096, PROT_READ|PROT_WRITE, MAP_PRIVATE|MAP_ANONYMOUS, -1, 0) = 0x7fd071baa000
mmap(NULL, 8192, PROT_READ|PROT_WRITE, MAP_PRIVATE|MAP_ANONYMOUS, -1, 0) = 0x7fd071ba8000
mmap(NULL, 4096, PROT_READ|PROT_WRITE, MAP_PRIVATE|MAP_ANONYMOUS, -1, 0) = 0x7fd071ba7000
mmap(NULL, 4096, PROT_READ|PROT_WRITE, MAP_PRIVATE|MAP_ANONYMOUS, -1, 0) = 0x7fd071ba6000
mmap(NULL, 4096, PROT_READ|PROT_WRITE, MAP_PRIVATE|MAP_ANONYMOUS, -1, 0) = 0x7fd071ba5000
munmap(0x7fd071ba5000, 4096)            = 0
mmap(NULL, 4096, PROT_READ|PROT_WRITE, MAP_PRIVATE|MAP_ANONYMOUS, -1, 0) = 0x7fd071ba5000
mmap(NULL, 8192, PROT_READ|PROT_WRITE, MAP_PRIVATE|MAP_ANONYMOUS, -1, 0) = 0x7fd071ba3000
mmap(NULL, 8192, PROT_READ|PROT_WRITE, MAP_PRIVATE|MAP_ANONYMOUS, -1, 0) = 0x7fd071ba1000
mmap(NULL, 4096, PROT_READ|PROT_WRITE, MAP_PRIVATE|MAP_ANONYMOUS, -1, 0) = 0x7fd071ba0000
mmap(NULL, 8192, PROT_READ|PROT_WRITE, MAP_PRIVATE|MAP_ANONYMOUS, -1, 0) = 0x7fd071b9e000
mmap(NULL, 4096, PROT_READ|PROT_WRITE, MAP_PRIVATE|MAP_ANONYMOUS, -1, 0) = 0x7fd071b9d000
mmap(NULL, 8192, PROT_READ|PROT_WRITE, MAP_PRIVATE|MAP_ANONYMOUS, -1, 0) = 0x7fd071b9b000
mmap(NULL, 8192, PROT_READ|PROT_WRITE, MAP_PRIVATE|MAP_ANONYMOUS, -1, 0) = 0x7fd071b99000
munmap(0x7fd071b99000, 8192)            = 0
mmap(NULL, 8192, PROT_READ|PROT_WRITE, MAP_PRIVATE|MAP_ANONYMOUS, -1, 0) = 0x7fd071b99000
mmap(NULL, 8192, PROT_READ|PROT_WRITE, MAP_PRIVATE|MAP_ANONYMOUS, -1, 0) = 0x7fd071b97000
mmap(NULL, 4096, PROT_READ|PROT_WRITE, MAP_PRIVATE|MAP_ANONYMOUS, -1, 0) = 0x7fd071b96000
mmap(NULL, 8192, PROT_READ|PROT_WRITE, MAP_PRIVATE|MAP_ANONYMOUS, -1, 0) = 0x7fd071b94000
munmap(0x7fd071b94000, 8192)            = 0
mmap(NULL, 8192, PROT_READ|PROT_WRITE, MAP_PRIVATE|MAP_ANONYMOUS, -1, 0) = 0x7fd071b94000
...
File I/O
With the MMU out of the way, we needed a way to do file input and output. Bochs is trying to open its configuration file:
open(".bochsrc", O_RDONLY|O_LARGEFILE)  = 3
close(3)                                = 0
writev(2, [{iov_base="00000000000i[      ] ", iov_len=21}, {iov_base=NULL, iov_len=0}], 200000000000i[      ] ) = 21
writev(2, [{iov_base="reading configuration from .boch"..., iov_len=36}, {iov_base=NULL, iov_len=0}], 2reading configuration from .bochsrc
) = 36
open(".bochsrc", O_RDONLY|O_LARGEFILE)  = 3
read(3, "# You may now use double quotes "..., 1024) = 1024
read(3, "================================"..., 1024) = 1024
read(3, "ig_interface: win32config\n#confi"..., 1024) = 1024
read(3, "ace to AT&T's VNC viewer, cross "..., 1024) = 1024
The way I’ve approached this for now is to pre-read and store the contents of required files in memory when I initialize the Bochs execution context. This has some advantages, because I can imagine a future when we’re fuzzing something and Bochs needs to do file I/O on a disk image file or something else, and it’d be nice to just already have that file read into memory and waiting for usage. Emulating the file I/O syscalls then becomes very straightforward, we really only need to keep a few metadata and the file contents themselves:
#[derive(Clone)]
pub struct FileTable {
    files: Vec<File>,
}

impl FileTable {
    // We will attempt to open and read all of our required files ahead of time
    pub fn new() -> Result<Self, LucidErr> {
        // Retrieve .bochsrc
        let args: Vec<String> = std::env::args().collect();

        // Check to see if we have a "--bochsrc-path" argument
        if args.len() < 3 || !args.contains(&"--bochsrc-path".to_string()) {
            return Err(LucidErr::from("No `--bochsrc-path` argument"));
        }

        // Search for the value
        let mut bochsrc = None;
        for (i, arg) in args.iter().enumerate() {
            if arg == "--bochsrc-path" {
                if i >= args.len() - 1 {
                    return Err(
                        LucidErr::from("Invalid `--bochsrc-path` value"));
                }

                bochsrc = Some(args[i + 1].clone());
                break;
            }
        }

        if bochsrc.is_none() { return Err(
            LucidErr::from("No `--bochsrc-path` value provided")); }
        let bochsrc = bochsrc.unwrap();

        // Try to read the file
        let Ok(data) = read(&bochsrc) else {
            return Err(LucidErr::from(
                &format!("Unable to read data BLEGH from '{}'", bochsrc)));
        };

        // Create a file now for .bochsrc
        let bochsrc_file = File {
            fd: 3,
            path: ".bochsrc".to_string(),
            contents: data.clone(),
            cursor: 0,
        };

        // Insert the file into the FileTable
        Ok(FileTable {
            files: vec![bochsrc_file],
        })
    }

    // Attempt to open a file
    pub fn open(&mut self, path: &str) -> Result<i32, ()> {
        // Try to find the requested path
        for file in self.files.iter() {
            if file.path == path {
                return Ok(file.fd);
            }
        }

        // We didn't find the file, this really should never happen?
        Err(())
    }

    // Look a file up by fd and then return a mutable reference to it
    pub fn get_file(&mut self, fd: i32) -> Option<&mut File> {
        self.files.iter_mut().find(|file| file.fd == fd)
    }
}

#[derive(Clone)]
pub struct File {
    pub fd: i32,            // The file-descriptor Bochs has for this file
    pub path: String,       // The file-path for this file
    pub contents: Vec<u8>,  // The actual file contents
    pub cursor: usize,      // The current cursor in the file
}
So when Bochs asks to read a file and provides the fd, we just check the FileTable for the correct file and then read its contents from the File::contents buffer and then update the cursor struct member to keep track of where in the file our current offset is.
// read
        0x0 => {
            // Check to make sure we have the requested file-descriptor
            let Some(file) = context.files.get_file(a1 as i32) else {
                println!("Non-existent file fd: {}", a1);
                fault!(contextp, Fault::NoFile);
            };

            // Now we need to make sure the buffer passed to read isn't NULL
            let buf_p = a2 as *mut u8;
            if buf_p.is_null() {
                context.tls.errno = libc::EINVAL;
                return -1_i64 as u64;
            }

            // Adjust read size if necessary
            let length = std::cmp::min(a3, file.contents.len() - file.cursor);

            // Copy the contents over to the buffer
            unsafe {
                std::ptr::copy(
                    file.contents.as_ptr().add(file.cursor),    // src
                    buf_p,                                      // dst
                    length);                                    // len
            }

            // Adjust the file cursor
            file.cursor += length;

            // Success
            length as u64
        },
open calls are basically just handled as sanity checks at this point to make sure we know what Bochs is trying to access:
// open
        0x2 => {
            // Get pointer to path string we're trying to open
            let path_p = a1 as *const libc::c_char;

            // Make sure it's not NULL
            if path_p.is_null() {
                fault!(contextp, Fault::NullPath);
            }

            // Create c_str from pointer
            let c_str = unsafe { std::ffi::CStr::from_ptr(path_p) };

            // Create Rust str from c_str
            let Ok(path_str) = c_str.to_str() else {
                fault!(contextp, Fault::InvalidPathStr);
            };

            // Validate permissions
            if a2 as i32 != 32768 {
                println!("Unhandled file permissions: {}", a2);
                fault!(contextp, Fault::Syscall);
            }

            // Open the file
            let fd = context.files.open(path_str);
            if fd.is_err() {
                println!("Non-existent file path: {}", path_str);
                fault!(contextp, Fault::NoFile);
            }

            // Success
            fd.unwrap() as u64
        },
// Attempt to open a file
    pub fn open(&mut self, path: &str) -> Result<i32, ()> {
        // Try to find the requested path
        for file in self.files.iter() {
            if file.path == path {
                return Ok(file.fd);
            }
        }

        // We didn't find the file
        Err(())
    }
And that’s really the whole of file I/O right now. Down the line, we’ll need to keep these in mind when we’re doing snapshots and resetting snapshots because the file state will need to be restored differentially, but this is a problem for another day.
Conclusion
The work continues on the fuzzer, I’m still having a blast implementing it, special thanks to everyone mentioned in the repository for their help! Next, we’ll have to pick a fuzzing target and it get it running in Bochs. We’ll have to lobotomize the system Bochs is emulating so that it runs our target program such that we can snapshot and fuzz appropriately, that should be really fun, until then!