Abusing .NET Core CLR Diagnostic Features (+ CVE-2023-33127)
Introduction
Background
.NET is an ecosystem of frameworks, runtimes, and languages for building and running a wide range of applications on a variety of platforms and devices. The .NET Framework was initially released in the early 2000s as Microsoft’s implementation of the Common Language Infrastructure (CLI) specification. In 2016, Microsoft released .NET Core, the first truly open-source, cross platform version of the .NET Platform.
All flavors of .NET rely on a runtime component called the Common Language Runtime (CLR). The CLR is responsible for executing managed programs (e.g. assemblies) and handling other tasks such as memory management, garbage collection, and just-in-time (JIT) compilation of manage-to-unmanaged code. In open-source .NET, the CLR is implemented as the Core CLR (e.g. coreclr.dll).
Although the .NET Framework will be referenced frequently, this blog will focus on abusing several runtime diagnostic features that are mostly specific to open-source .NET on modern Microsoft Windows client operating systems (e.g. .NET, formerly called .NET Core, since version 5).
Of note, the content provided in this blog was first presented in my MCTTP 2023 Conference talk – Dotnet: Not Dead…Yet. Defensive considerations, SIGMA rules, and mitigation guidance are located at the end of the post.
.NET Native Inclusion
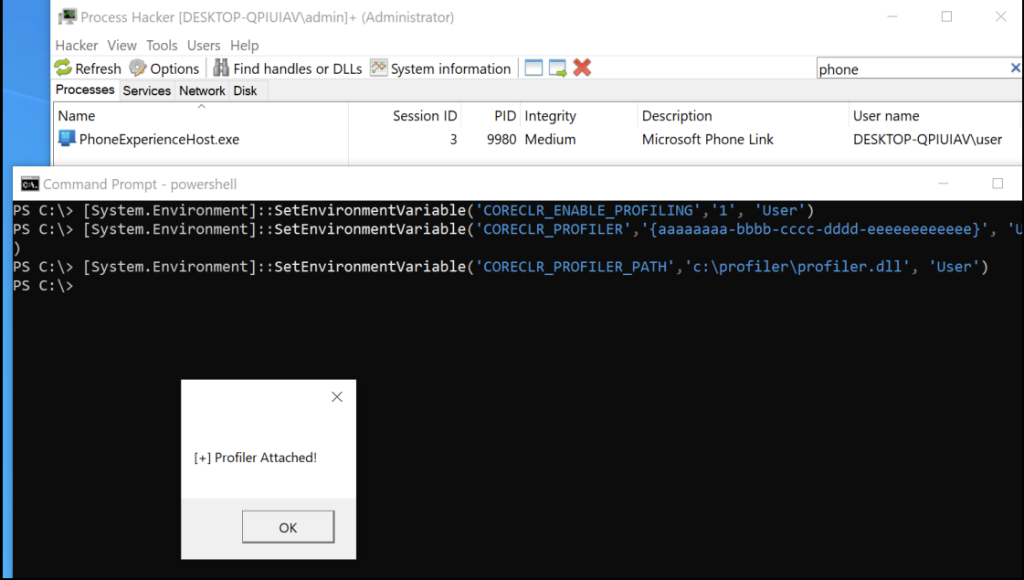
Although it may be a surprise to a few, .NET Framework (4.8.x) is still the default “system wide” .NET implementation on Microsoft Windows. However, Windows ships with several Universal Windows Platform (UWP) applications (“apps”) that rely on .NET Native, a .NET pre-compilation technology that contains an instance of the Core CLR runtime. An example UWP app that leverages .NET Native is the Phone Link app (PhoneExperienceHost.exe).

Note: Visual Studio components and Azure DevOps Pipeline Agents leverage the open-source .NET runtime. Most recently, .NET version 8 was released.
Runtime Configuration & Diagnostics
Over the last few years, I’ve blogged about several ways to abuse the .NET Framework by leveraging CLR Configuration Knobs. Adjusting knobs allow for controlling the behavior of the .NET Common Language Runtime (CLR) for development, debugging, and diagnostic purposes. The Core CLR is no exception and includes many similar and unique knobs that can be configured in the registry, environment variables, and configuration files.
A very interesting and well supported diagnostic extension for the .NET Framework CLR is the profiling API. As stated by Microsoft, a profiler is a “tool that monitors the execution of another application. [It] is a dynamic link library (DLL) that consists of functions that receive messages from, and send messages to, the CLR by using the profiling API. The profiler DLL is loaded by the CLR at run time.” Messaging to and from the profiler DLL and the CLR are implemented through the ICorProfilerCallback/2 interface for event notification and the ICorProfilerInfo/2 interface for profiled application state information. Profiling a .NET application could reveal event(ing) information such as assembly loading, module loading, and thread creation (Source: Microsoft Docs).
Interestingly, open-source .NET includes a rich set of troubleshooting diagnostic features, tools, and APIs that can be leveraged to interface with the Core CLR without the need of a profiler, though profiling is also supported (which we’ll dive into shortly). Of note, Microsoft documentation for Core runtime diagnostics is very robust and well worth reviewing.
CLR Profiler Abuse
.NET Framework CLR Profiler Loading
At .NET application start, configuration knobs adjust the CLR/runtime behavior. As documented by Casey Smith (@subTee) in 2017, the following .NET Framework profiler knobs are configured as environment variables to load an unmanaged “profiler” DLL:
- COR_ENABLE_PROFILING – Set to 1 to enable profiler loading
- COR_PROFILER – Set a target CLSID or arbitrary GUID value (Note: Not necessarily required for the .NET Framework)
- COR_PROFILER_PATH – Set path to the profiler DLL
If an arbitrary DLL is loaded into the CLR that does not meet the requirements and structure for a profiler DLL, the CLR will effectively unload the library. Depending on the offensive use case, this may or may not be important. Additionally, this technique is documented in Mitre ATT&CK as sub-technique: T1574.012.
.NET Core CLR Profiler Loading
The Core CLR profiler in open-source .NET acts in a similar way but leverages the following knobs to load a “profiler” DLL:
- CORECLR_ENABLE_PROFILING – Set to 1 to enable profiler loading
- CORECLR_PROFILER – Set an arbitrary GUID value (Note: Required for open-source .NET)
- CORECLR_PROFILER_PATH – Set path to the profiler DLL (Note: knob names may also be CORECLR_PROFILER_PATH_32 or CORECLR_PROFILER_PATH_64 depending on architecture)
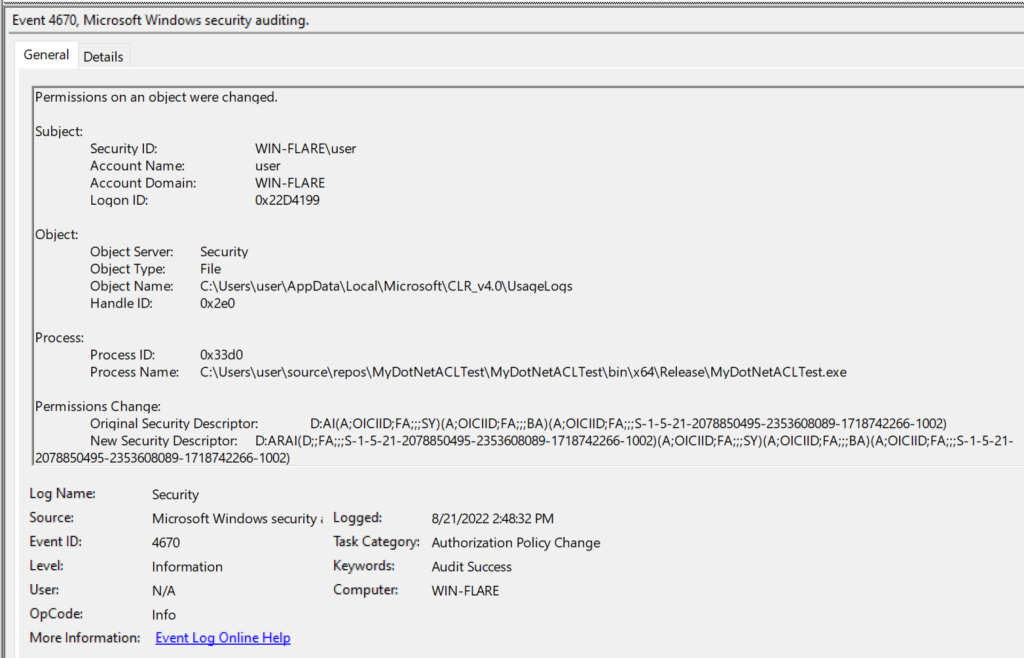
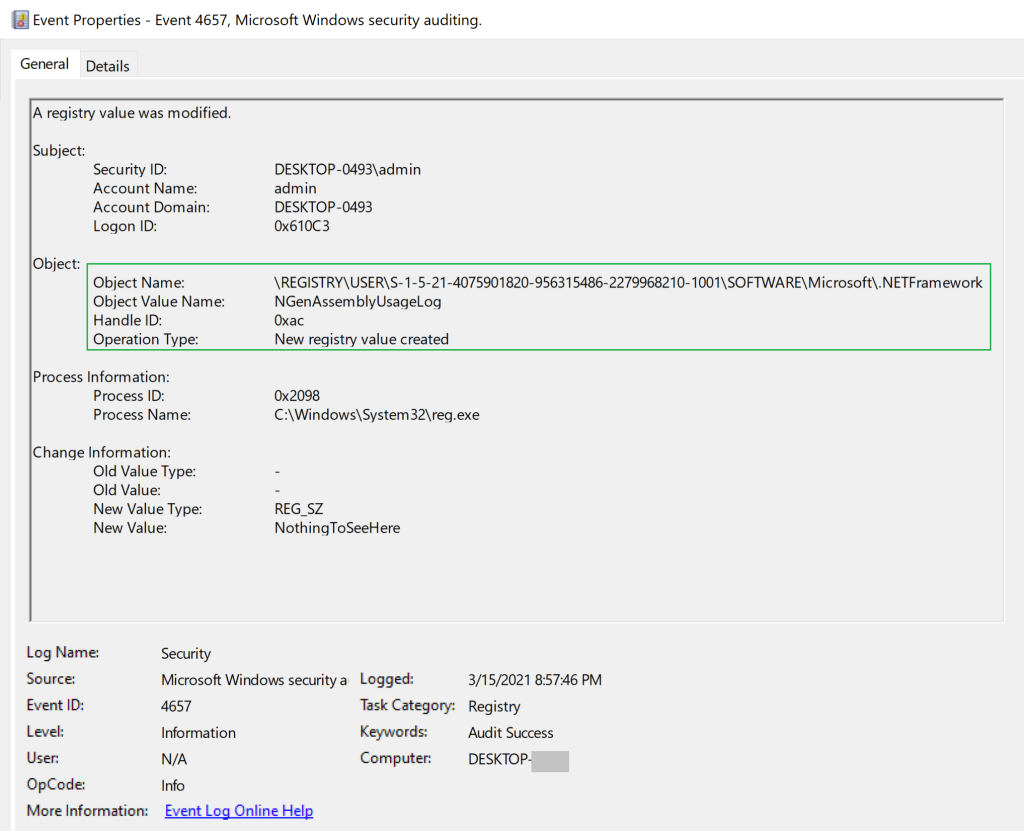
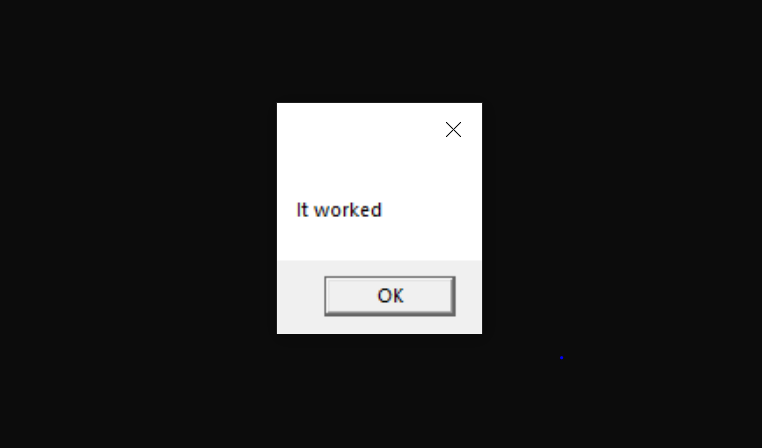
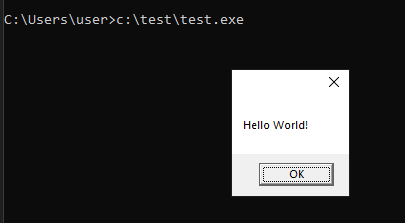
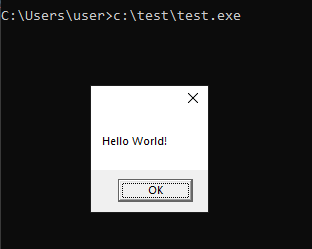
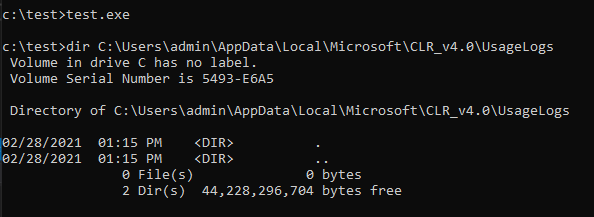
When set as environment variables in the registry, the .NET application Core CLR loads the DLL for execution and persistence:
.NET Core CLR Diagnostics
CLR Diagnostic Port
As mentioned prior, the .NET Core CLR diagnostic analysis can be performed without the use of a CLR profiler. By default, the Core CLR enables an Interprocess Communication (IPC) diagnostic endpoint called a diagnostic port. On Linux and MAC, the IPC occurs over Unix domain sockets by default. On Windows, IPC occurs over a named pipe, which follows this naming convention:
\.\pipe\dotnet-diagnostic-{Process ID (PID) of .NET application}
Diagnostic applications interface and communicate with a target application’s CLR diagnostic port to send commands and receive responses. Graciously, Microsoft has released a suite of diagnostic tools and an API for interfacing with the diagnostic port.
Diagnostic Applications & Tools
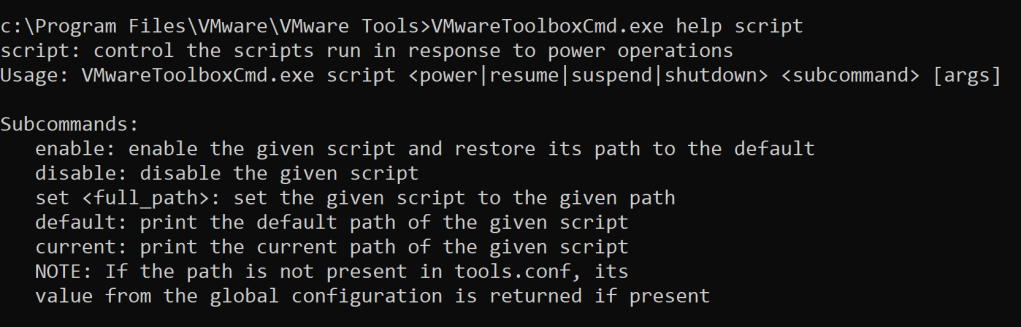
The following Microsoft signed command line applications are available to diagnose .NET application issues:
- dotnet-counters
- dotnet-dump
- dotnet-monitor
- dotnet-trace
- …and more
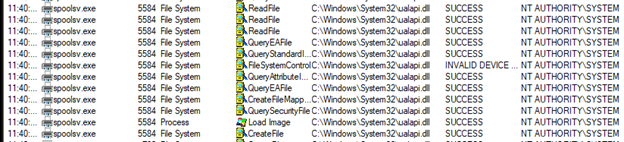
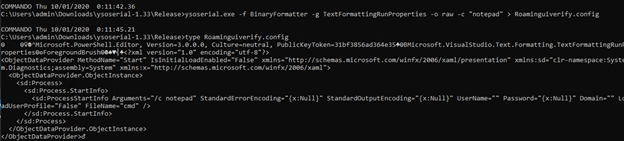
As you can imagine, some of these utilities can be used for living-off-the-land/lolbin scenarios. For instance, dotnet-dump instructs the CLR of a target .NET application to dump its process memory. Dotnet-dump also implements MiniDumpWriteDump, which can be used to create process minidumps of non-.NET processes (e.g. such as LSASS):

Diagnostic API
Although command-line diagnostic tools provide a turnkey approach for diagnosing .NET applications, Microsoft makes available the Microsoft.Diagnostics.NETCore.Client API to interact with the diagnostic port of .NET applications for deeper use cases. The API is relatively straight forward to use and includes a diagnostic class and several methods for:
- Setting environment variables
- Dumping the .NET process
- Setting a startup CLR profiler
- Attaching a CLR profiler…
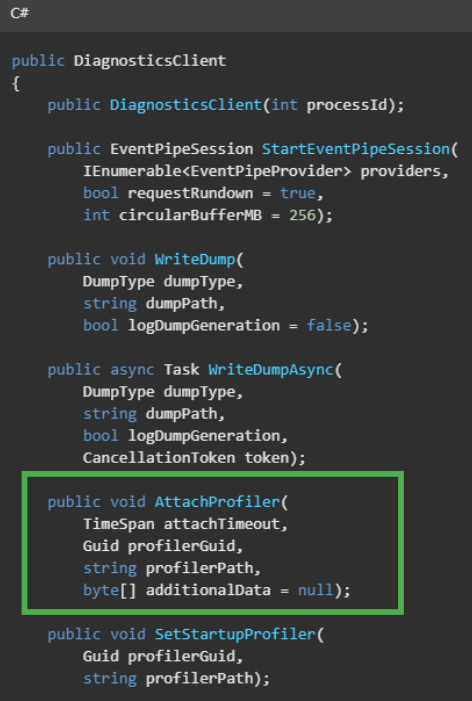
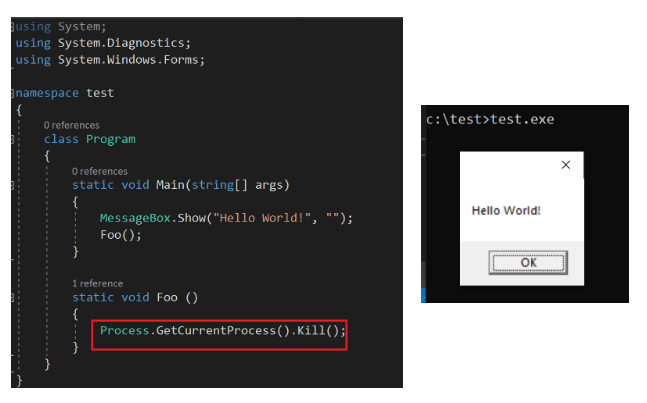
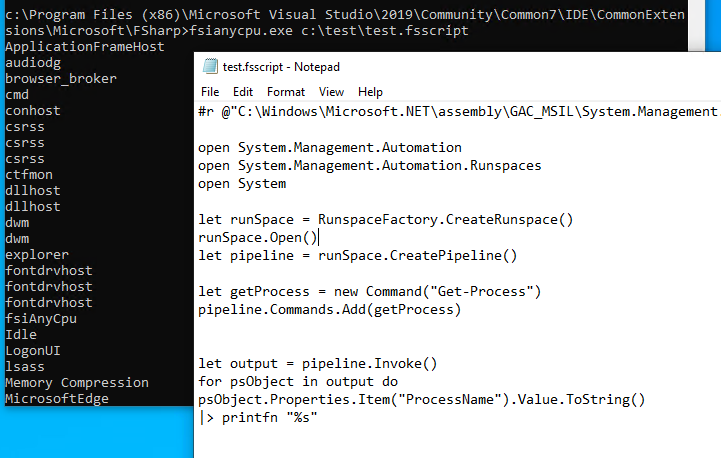
Interestingly, a “monitoring” application can leverage API diagnostic port to instruct the target application CLR to attach a profiler. Leveraging the API, the following C# code snippet serves as “injector” to load a “profiler” DLL into a running process using the AttachProfiler() method:
using Microsoft.Diagnostics.NETCore.Client;
class profiler_injector
{
static void Main(string[] args)
{
int pid = Int32.Parse(args[0]);
string profilerPath = args[1];
AttachProfiler(pid, Guid.NewGuid(), profilerPath);
}
static void AttachProfiler(int processId, Guid profilerGuid, string profilerPath)
{
var client = new DiagnosticsClient(processId);
client.AttachProfiler(TimeSpan.FromSeconds(10), profilerGuid, profilerPath);
}
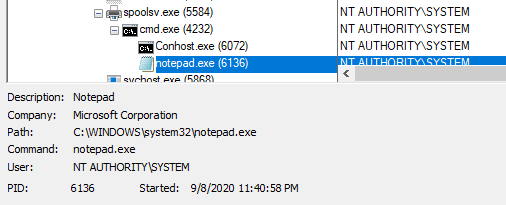
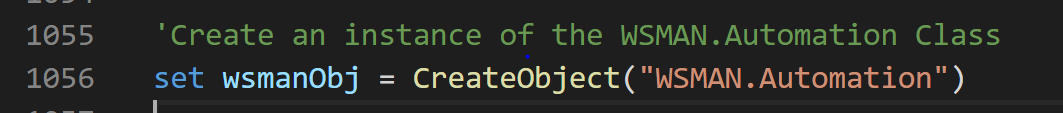
}Expectedly, running the injector programs shows a successful result:

IPC Messaging Protocol
The Diagnostic IPC Protocol is used for client (“monitoring application”) and server (target application CLR) messaging over the diagnostic port named pipe. Microsoft provides excellent documentation of the transport, structure, and commands. Leveraging the IONinja protocol analyzer, an example client request and server response for issuing the AttachProfiler command appears as follows:
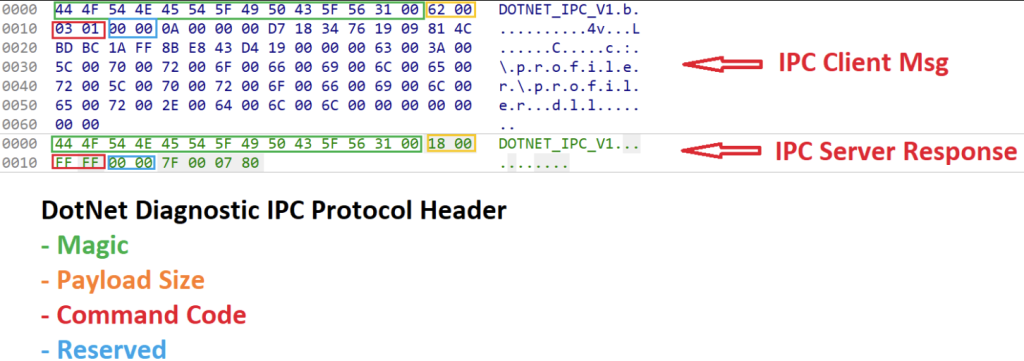
The “magic” string value effectively serves as the message header, and it has a 14-byte reservation. As of this blog release date, the constant magic value is “DOTNET_IPC_V1”. The following two bytes are reserved for the payload size, and the next two bytes are reserved for the command code.
For the client message, 0x0301 is the identifier for the AttachProfiler command. The next two bytes are generally reserved, and the remainder of the message is the payload. In this case, the client payload data includes the attachment timeout value, a CLSID/GUID value (e.g. for the CORECLR_PROFILER), and the path to the profiler DLL (e.g. for CORECLR_PROFILER_PATH). The remaining bytes are not set, but other messages may contain a client data element.
For this example, the command code in the server response (0xFFFF) is interesting. Although the “profiler” DLL successfully attaches, the command code indicates an error with the DLL since it is not a true profiler DLL. In this case, the DLL does not adhere to the expected structure and is evicted.
Note: With insight into the messaging protocol, one could go a step further and forgo managed API usage and craft diagnostic IPC messages at the byte-code level.
CVE-2023-33127: .NET Cross Session Local Privilege Escalation
Motivation
Every now and again, researching offensive tradecraft opens the door for thinking of new ways to exploit potential vulnerabilities. The CLR diagnostic attack surface was interesting, especially with the capabilities provided by the CLR and use of named pipes for IPC endpoint. Initially, I did not identify any formal services operating in a privileged context (e.g. NT AUTHORITY\SYSTEM) that leveraged .NET Core. Eventually, I found a few third-party services as well as use within Azure pipelines, but the UWP apps were all I had to work with at the time. I noted two possible use cases for privilege elevation:
- An observation was made that some UWP apps operated in low integrity. There may be a scenario to potentially elevate from low to medium integrity within a user session.
- Other UWP apps operate at medium integrity. UWP processes are created for each user logged into a machine. It may be possible to influence the UWP application diagnostic port that is created in another user’s session.
I opted to start with the latter as I always found cross-session attacks to be very interesting.
Discovery Methodology
Having already spent too many unhealthy years looking at Component Object Model (COM) and following the incredible research of James Forshaw (@tiraniddo), it was most natural place to look for cross-session attack opportunities. It is no secret that users can activate DCOM objects in other interactive sessions. This includes a scenario when a non-privileged users is logged into the same machine as a privileged user.
Cross session activation is made possible when the identity of the target DCOM object is set to run as the “interactive user” (e.g. the interactive user in the target session), and the activation and launch permissions permit the object activation to occur by the launching user (e.g. the attacker).
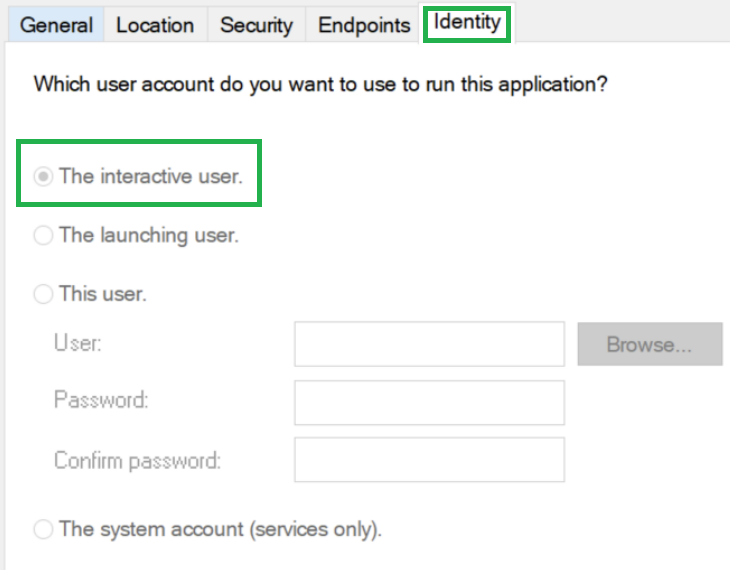
Note: Even if DCOM security settings permit object activation in another session, it does not necessarily mean the launching user has the permissions to access and use the activated object. Regardless, activation is all that is required for this use case.
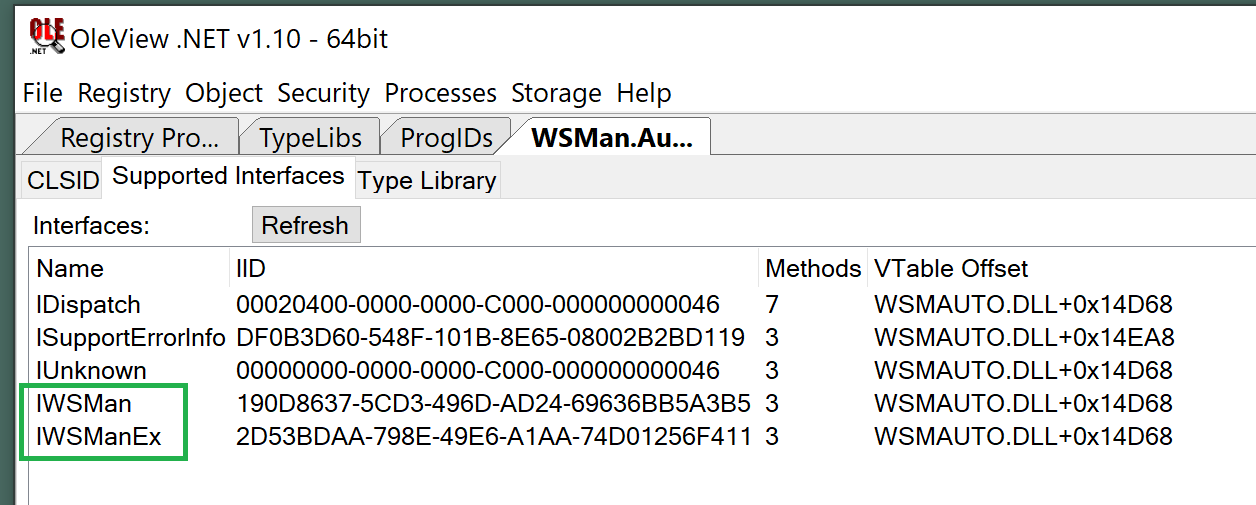
Fortunately for us, James developed and released OleViewDotNet, which makes discovering and analyzing COM objects much easier and quicker. After narrowing down COM objects configured to run as the “interactive user”, I discovered that the Phone Link UWP application (PhoneExperienceHost.exe) was also a DCOM server:

After some basic testing, two key elements came to fruition:
- As an out-of-process DCOM server, associated DCOM class objects would launch the PhoneExperienceHost.exe executable (including all .NET components).
- A lower privileged user could most certainly activate several associated DCOM objects in a privileged user session on Windows 10 (e.g. CLSID – 7540C300-BE9B-4C0D-A335-F002F9AB73B7).
Although a potential premise was set for cross-session attack, there was still the problem of lacking a core exploitation vector. There are several ways to approach this problem, and I thought about investigating a few of those potential vectors, but I focused on the diagnostic port named pipe. There are interesting exploitation primitives that could potentially be leveraged to attack named pipes as discussed in this fantastic blog post by @0xcsandker.
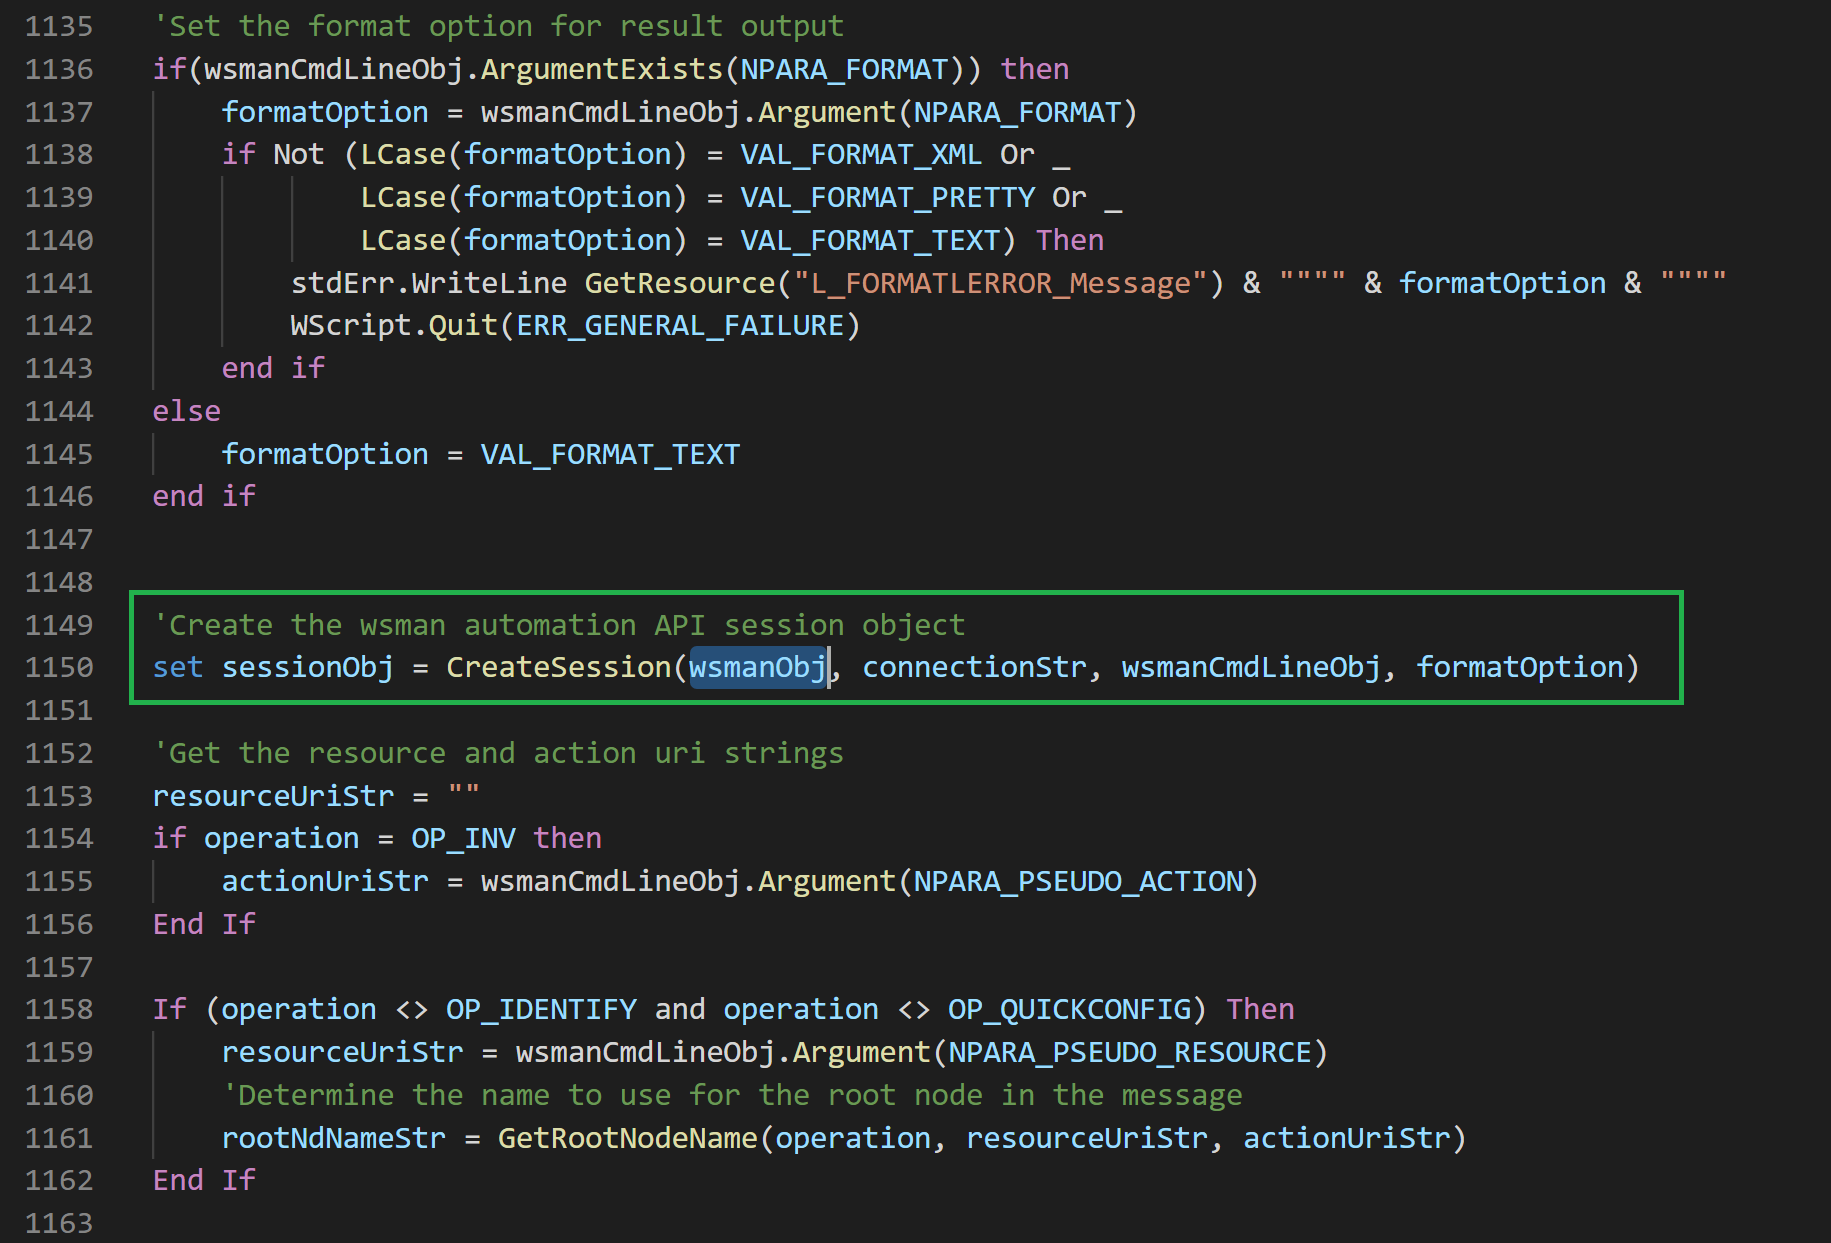
Albeit an obvious statement – one of the best things about open-source software is that the source code is made publicly available, so there is a time advantage for not having to reverse engineer part of the .NET runtime and/or dive too deeply into the internals (although it is not a bad idea). As such, I decided to search through the .NET runtime source code on GitHub and analyze the diagnostic port implementation. Here is the C code used to create the named pipe with CreateNamedPipeA (prior to patching):

Named pipes are FIFO structures – the first named pipe server instance has precedence to respond to client requests if multiple named pipes with the same name exist. Furthermore, subsequent named pipes inherit the handle security descriptor of the first named pipe when created, including the DACL and ownership. However, if the FILE_FLAG_FIRST_PIPE_INSTANCE flag is specified within the openmode parameter, the subsequent named pipe will not be created, and inheritance will be thwarted.
Interestingly, the FILE_FLAG_FIRST_PIPE_INSTANCE flag is not specified when creating the diagnostic port named pipe. This means that the named pipe will still be created even if another pipe with the same name already exists. In short, if an attacker creates a crafted named pipe before the Core CLR creates a diagnostic port with the same name, the attacker has the ability to control the diagnostic endpoint and issue commands from another session because the attacker owns the named pipe handle and security descriptor. To successfully exploit this condition, the attacker must figure out a way to create the malicious named pipe prior to the .NET application CLR runtime creating the legitimate named pipe of the same name.
Note: In my recorded MCTTP conference talk, I misspoke about the inclusion of the PIPE_UNLIMITED_INSTANCES flag when it should have been about the exclusion of the FILE_FLAG_FIRST_PIPE_INSTANCE flag. Please execute this error if you decide to watch the recorded talk.
Now, let’s recall the naming convention for the diagnostic port named pipe:
\.\pipe\dotnet-diagnostic-{Process ID (PID) of .NET application}Although the named pipe is mostly static, the suffix mirrors the process identifier of the running .NET application. As a result, there are three challenges to overcome for successful exploitation:
- Beat a race condition and create the tampered named pipe before the target .NET application.
- Figure out a continuous way to spawn the target process until a named pipe match is made.
- And finally, deliver a payload…
Exploitation Walkthrough
Fortunately, all of the challenges can be addressed programmatically with the required conditions in place. First order of business was to address the race condition, which in many ways is out of our control, so my solution was to optimize coverage and leverage a “spray and pray” technique. For a proof-of-concept, I opted to create thousands of weakly permissive named pipes conforming to the diagnostic port convention. After a restart, there was a likelihood of low-ordered PID creation for newly spawned target application processes, which slightly increased the chance of hitting the covered named pipes. In reality, this approach was not as practical as just accounting for different ranges of PIDs and maintaining a sense of realism (e.g. no reboot in the real world with multiple sessions). In the end, the best option was just to simply increase the number of tampered named pipes for getting a quicker match.
Next, the issue of continuous COM activation. Interestingly enough, activating a cross-session DCOM object is quite easy through the use of a Session Moniker:
Format: Session:[session id]!clsid:[class id]I opted to continuously activate target DCOM object in an infinite loop. A sleep delay was added to ensure that the same, previously activated object was not re-used so that a new out-of-process server in the target session was spawned to increase the chance of a match.
Lastly, I needed a payload delivery vector. This was the best part – simply re-using the AttachProfiler capability to deliver a malicious DLL payload worked like a charm after cleaning up the malicious named pipe.
Demonstration
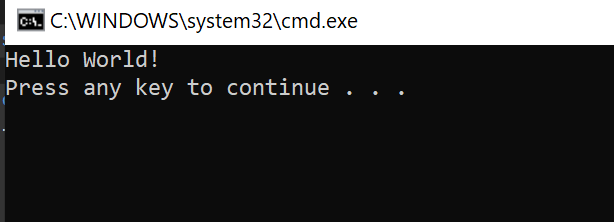
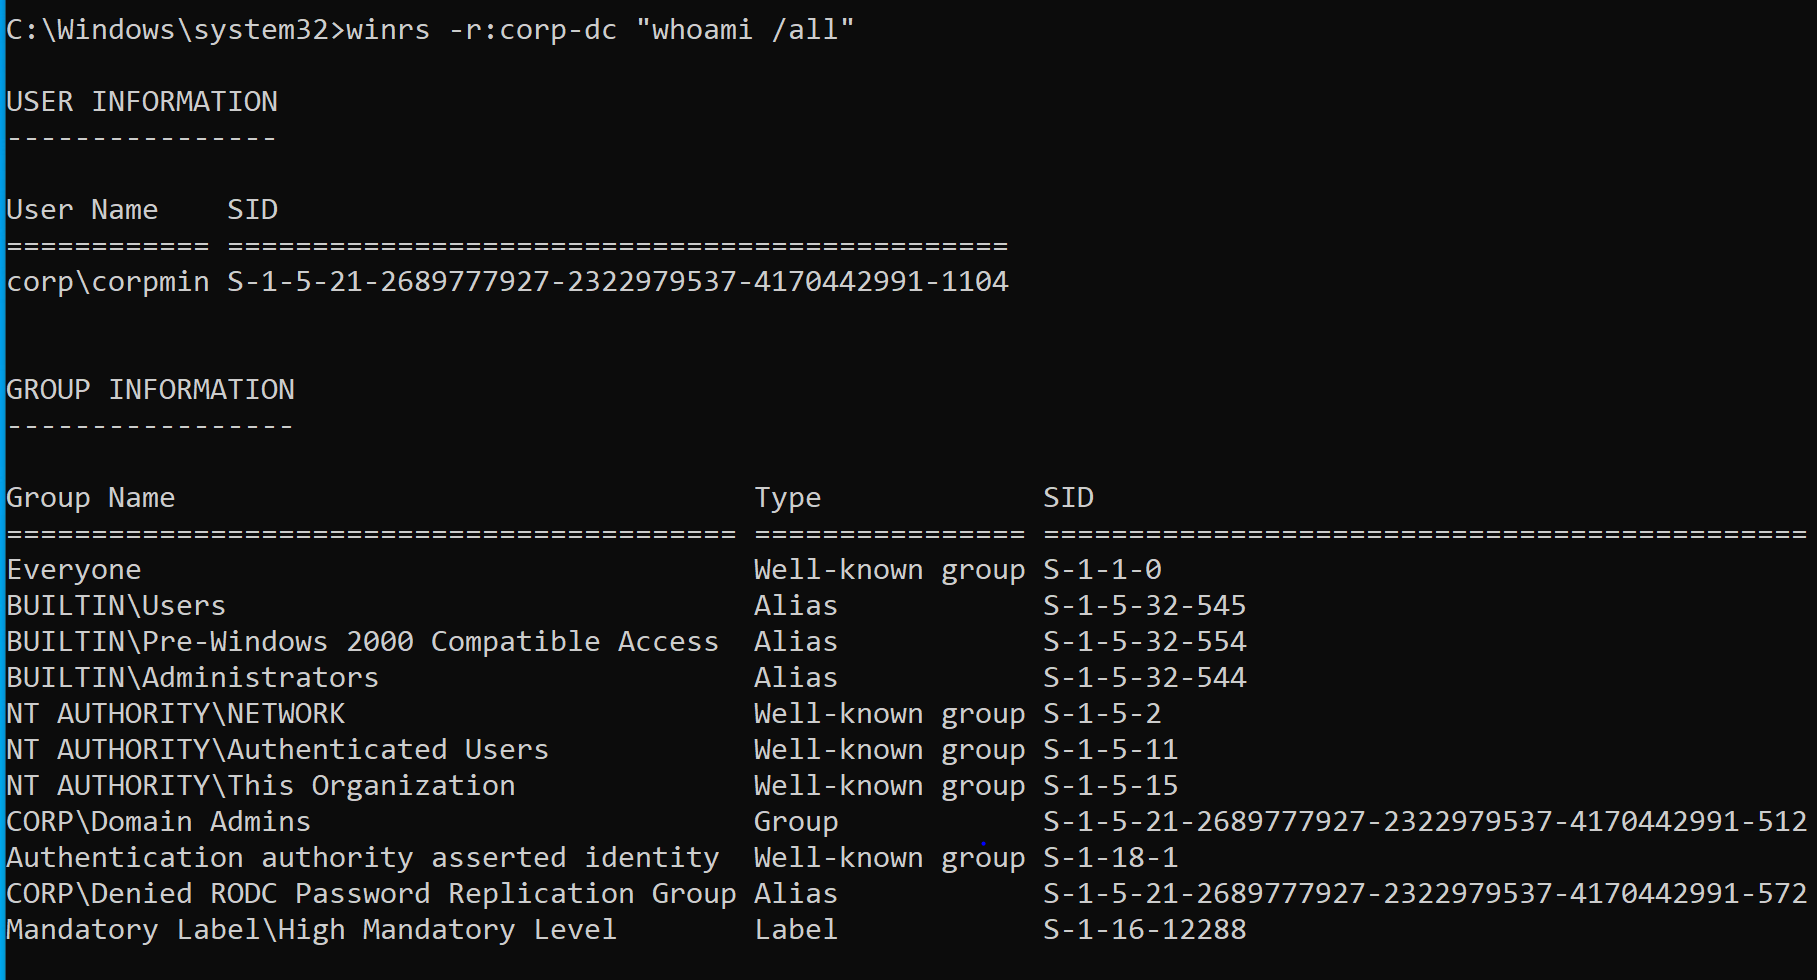
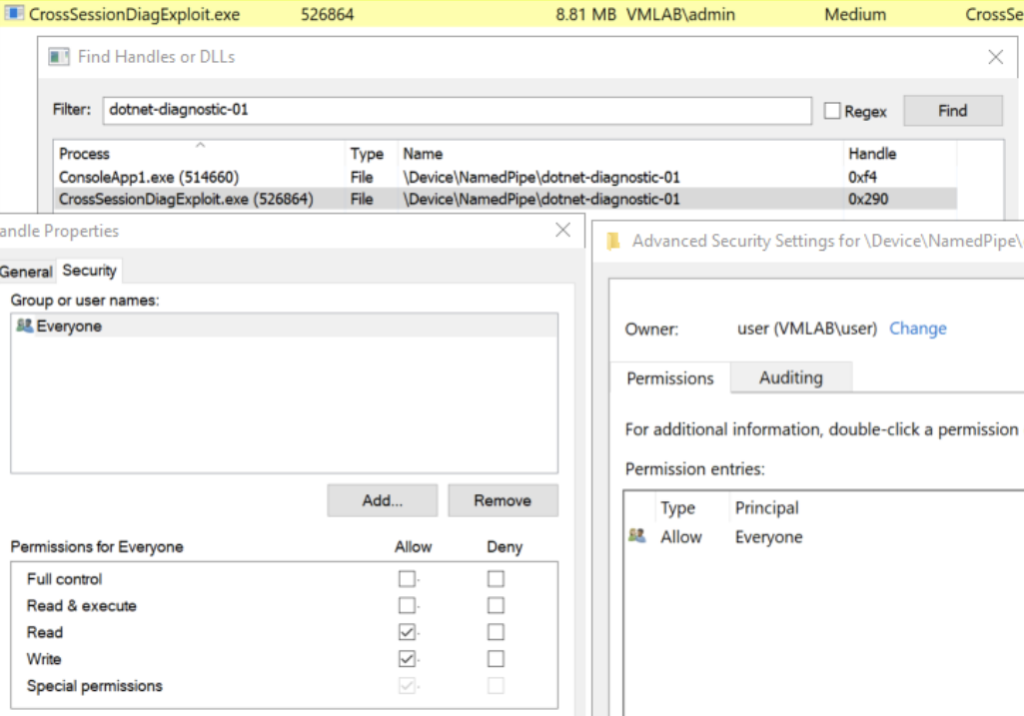
Here is a screenshot of the exploit in action:
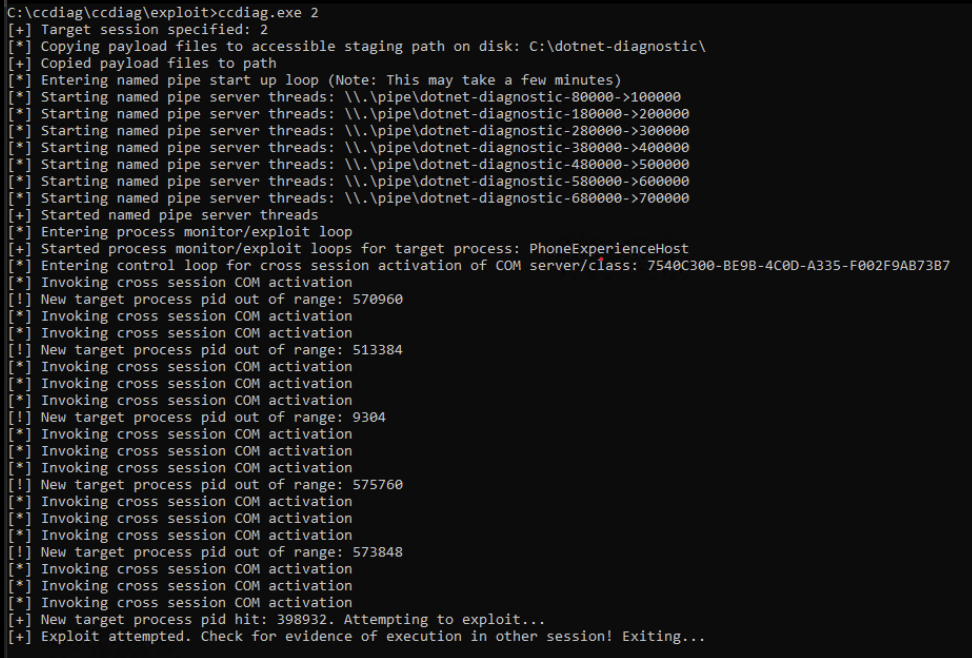
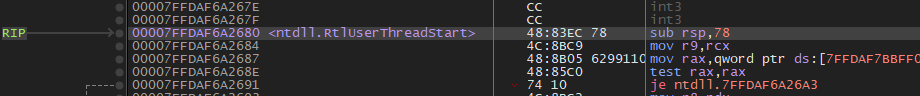
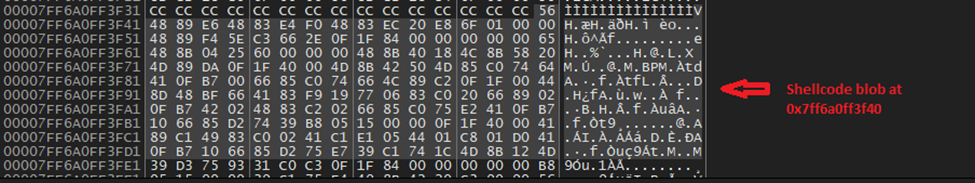
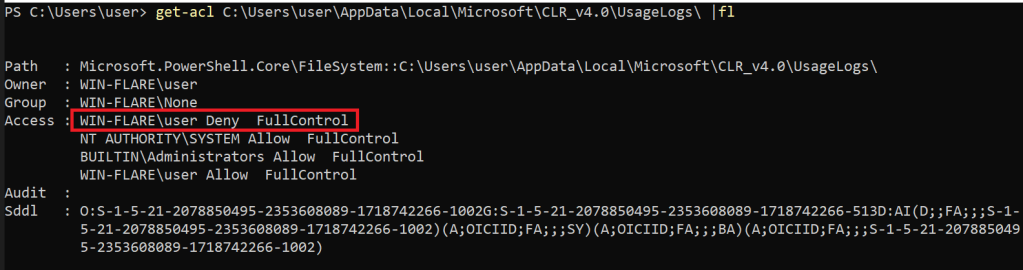
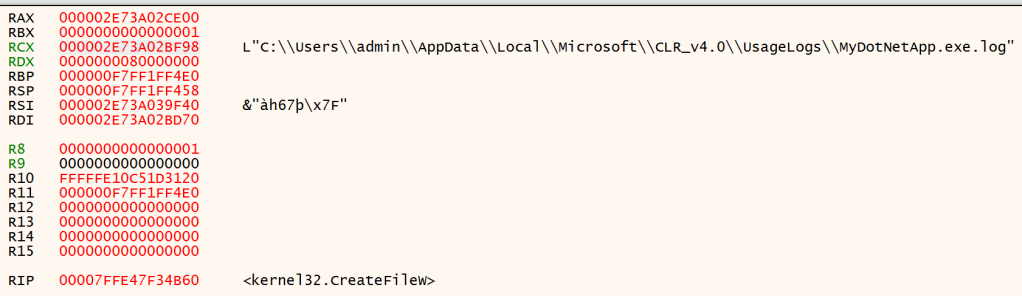
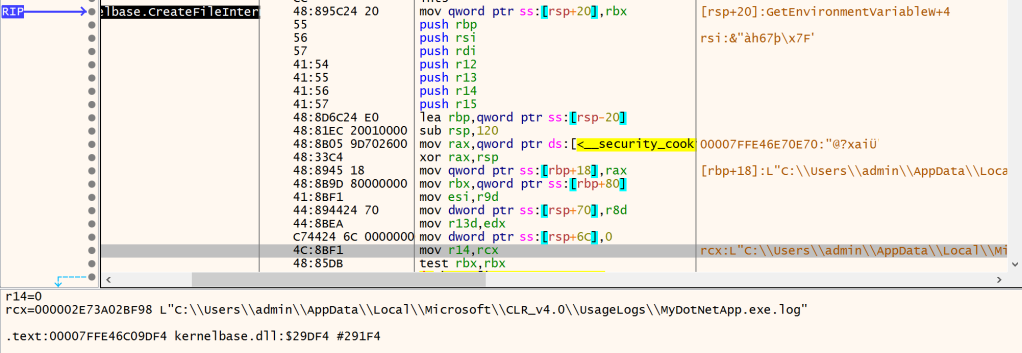
Once the .NET target process created the diagnostic port named pipe after a match, the handle inherited weak DACL permissions and ownership from the tampered named pipe:
Upon successful tampering, the exploit sends the AttachProfiler command to the target .NET application diagnostic endpoint and instructs the CLR to load the payload DLL to achieve cross-session code execution:

Mitigation & Disclosure Timeline
- 03/2023 – Initial report submitted to MSRC
- 04/2023 – Acknowledgement of vulnerability and patch development
- 06/2023 – Unofficially, Microsoft appeared to address launch and activation permissions for the impacted DCOM objects
- 07/2023 – Official patch released (in .NET) by Microsoft
- 09/2023 – Bug initially disclosed at the 2023 MCTTP conference
Defensive Considerations
- To protect against CVE-2023-33127 cross-session privilege escalation, upgrade .NET dependency components to the latest version. The patch was officially addressed in July 2023.
- To prevent the .NET Core CLR diagnostic port from loading at all, set persistent environment variables at all applicable levels with the following configuration knob:
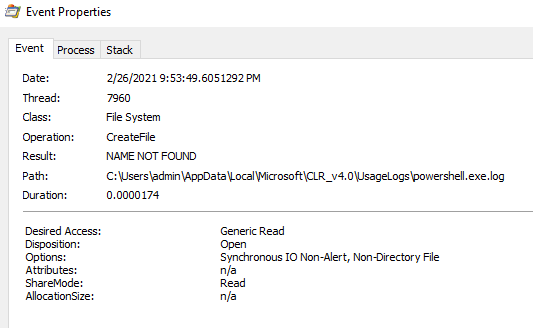
DOTNET_EnableDiagnostics=0- To detect possible dotnet-dump.exe lolbin abuse, consider implementing the following SIGMA rule authored by Nasreddine Bencherchali (@nas_bench): proc_creation_win_lolbin_dotnet_dump
- To detect possible Environment Variable CoreCLR profiler abuse, consider implementing the following updated SIGMA rule originally authored by Jose Rodriguez (@Cyb3rPandaH): registry_set_enabling_cor_profiler_env_variables
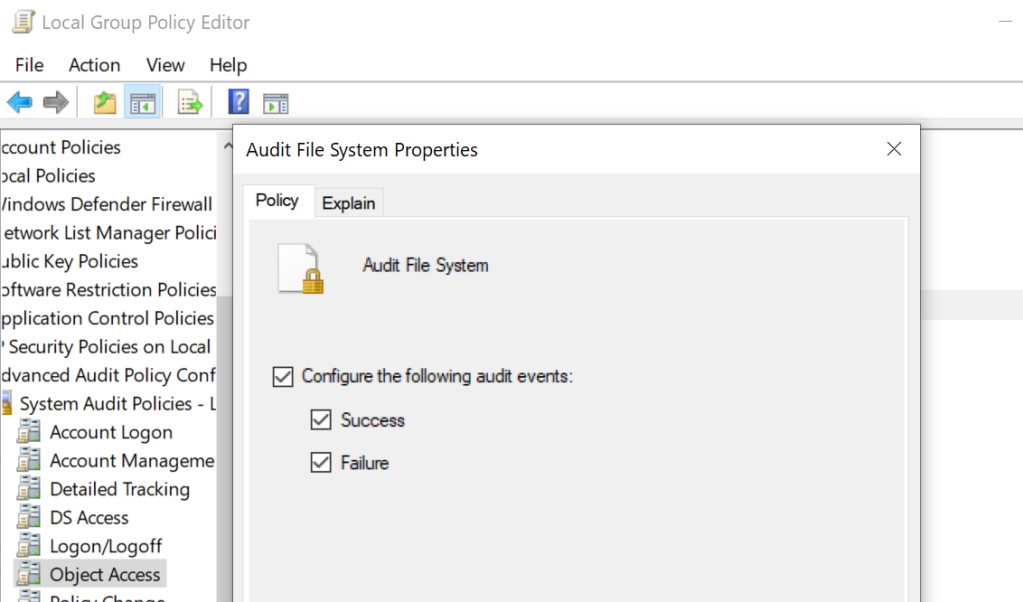
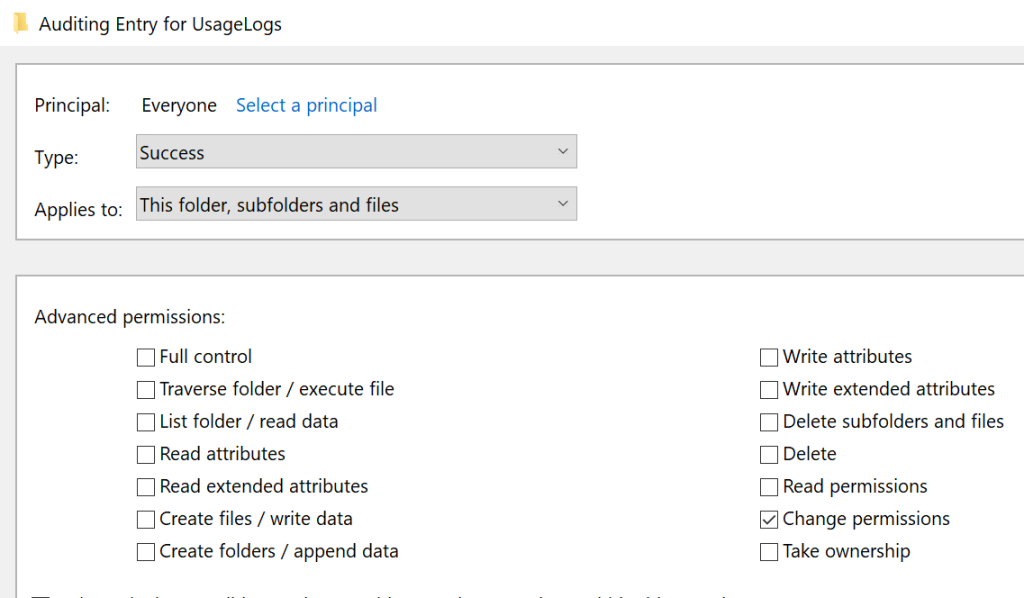
- Understanding .NET telemetry sources are important for collecting events and building robust detections. Telemetry Layering by Jonny Johnson (@jsecurity101) is a great resource that dives into the concept. As such, consider leveraging .NET (Core) diagnostic capabilities to aid in telemetry collection if feasible for your use cases. Monitor for interesting and opportunistic CLR events (e.g. profiler attachment) in addition to other interesting events such as .NET assembly loads.
Conclusion
.NET presents an interesting and opportunistic attack surface. In this post, we focused on Windows techniques, but there are certainly use cases that may extend to or present unique opportunities on other platforms and operating systems.
As always, thank you for taking the time to read this post and happy hunting!
-bohops