In November of last year, I took the OffSec EXP-401 Advanced Windows Exploitation class (AWE) at Black Hat MEA. While most of the blog posts out of there focus on providing an OSEE exam review, this blog post aims to be a day-by-day review of the AWE course content. OffSec Exp-401 (AWE) During the first […]
It’s been a while since I have taught a public class. I am happy to launch a new class that combines Windows Kernel Programming and Advanced Windows Kernel Programming into a 6-day (48 hours) masterclass. The full syllabus can be found here.
For those who have attended the Windows Kernel Programming class, and wish to capture the more “advanced” stuff, I offer one of two options:
Join the second part (3 days) of the training, at 60% of the entire course cost.
Register for the entire course with a 20% discount, and get the free recorded course.
The course is planned to stretch from mid-December to late-January, in 4-hour chunks to make it easier to combine with other activities and also have the time to do lab exercises (very important for truly understanding the material). Yes, I know christmas is in the middle there, I’ll keep the last week of December free
The course will be conducted remotely using MS Teams or similar.
Dates and times (not final, but unlikely to change much, if at all):
Dec 2023: 12, 14, 19, 21: 12pm-4pm EST (9am-1pm PST)
Jan 2024: 2, 4, 9, 11, 16, 18, 23, 25: 12pm-4pm EST (9am-1pm PST)
Training cost:
Early bird (until Nov 22): 1150 USD
After Nov 22: 1450 USD
If you’d like to register, please write to [email protected] with your name, company name (if any), and time zone. If you have any question, use the same email or DM me on X (Twitter) or Linkedin.
A while back I blogged about the differences between the virtual desktop feature exposed to users on Windows 10/11, and the Desktops tool from Sysinternals. In this post, I’d like to shed some more light on Window Stations, desktops, and windows. I assume you have read the aforementioned blog post before continuing.
We know that Window Stations are contained in sessions. Can we enumerate these? The EnumWindowStations API is available in the Windows API, but it only returns the Windows Stations in the current session. There is no “EnumSessionWindowStations”. Window Stations, however, are named objects, and so are visible in tools such as WinObj (running elevated):
Window stations in session 0
The Window Stations in session 0 are at \Windows\WindowStations The Window Stations in session x are at \Sessions\x\Windows\WindowStations
The OpenWindowStation API only accepts a “local” name, under the callers session. The native NtUserOpenWindowStation API (from Win32u.dll) is more flexible, accepting a full object name:
Here is an example that opens the “msswindowstation” Window Station:
#include <Windows.h>
#include <winternl.h>

#pragma comment(lib, "ntdll")

HWINSTA NTAPI _NtUserOpenWindowStation(_In_ POBJECT_ATTRIBUTES attr, _In_ ACCESS_MASK access);
int main() {
	// force Win32u.DLL to load
	::LoadLibrary(L"user32");
	auto NtUserOpenWindowStation = (decltype(_NtUserOpenWindowStation)*)
		::GetProcAddress(::GetModuleHandle(L"win32u"), "NtUserOpenWindowStation");

	UNICODE_STRING winStaName;
	RtlInitUnicodeString(&winStaName, L"\\Windows\\WindowStations\\msswindowstation");
	OBJECT_ATTRIBUTES winStaAttr;
	InitializeObjectAttributes(&winStaAttr, &winStaName, 0, nullptr, nullptr);
	auto hWinSta = NtUserOpenWindowStation(&winStaAttr, READ_CONTROL);
	if (hWinSta) {
        // do something with hWinSta
        ::CloseWindowStation(hWinSta);
    }
You may or may not have enough power to open a handle with the required access – depending on the Window Station in question. Those in session 0 are hardly accessible from non-session 0 processes, even with the SYSTEM account. You can examine their security descriptor with the kernel debugger (as other tools will return access denied):
You can become SYSTEM to help with access by using PsExec from Sysinternals to launch a command window (or whatever) as SYSTEM but still run in the interactive session:
psexec -s -i -d cmd.exe
If all else fails, you may need to use the “Take Ownership” privilege to make yourself the owner of the object and change its DACL to allow yourself full access. Apparently, even that won’t work, as getting something from a Window Station in another session seems to be blocked (see replies in Twitter thread). READ_CONTROL is available to get some basic info.
Here is a screenshot of Object Explorer running under SYSTEM that shows some details of the “msswindowstation” Window Station:
Guess which processes hold handles to this hidden Windows Station?
Once you are able to get a Window Station handle, you may be able to go one step deeper by enumerating desktops, if you managed to get at least WINSTA_ENUMDESKTOPS access mask:
::EnumDesktops(hWinSta, [](auto deskname, auto param) -> BOOL {
	printf(" Desktop: %ws\n", deskname);
	auto h = (HWINSTA)param;
	return TRUE;
	}, (LPARAM)hWinSta);
Going one level deeper, you can enumerate the top-level windows in each desktop (if any). For that you will need to connect the process to the Window Station of interest and then call EnumDesktopWindows:
The desktops in the Window Station “Service-0x0-45193$” above don’t seem to have top-level visible windows.
You can also access the clipboard and atom table of a given Windows Station, if you have a powerful enough handle. I’ll leave that as an exercise as well.
Finally, what about session enumeration? That’s the easy part – no need to call NtOpenSession with Session objects that can be found in the “\KernelObjects” directory in the Object Manager’s namespace – the WTS family of functions can be used. Specifically, WTSEnumerateSessionsExcan provide some important properties of a session:
What about creating a process to use a different Window Station and desktop? One member of the STARTUPINFO structure passed to CreateProcess (lpDesktop) allows setting a desktop name and an optional Windows Station name separated by a backslash (e.g. “MyWinSta\MyDesktop”).
There is more to Window Stations and Desktops that meets the eye… this should give interested readers a head start in doing further research.
Recently, a threat actor (TA) known as SpyBot posted a tool, on a Russian hacking forum, that can terminate any antivirus/Endpoint Detection & Response (EDR/XDR) software. IMHO, all the hype behind this announcement was utterly unjustified as it is just another instance of the well-known Bring Your Own Vulnerable Driver (BYOVD) attack technique: where a […]
Much of the Windows kernel functionality is exposed via kernel objects. Processes, threads, events, desktops, semaphores, and many other object types exist. Some object types can have string-based names, which means they can be “looked up” by that name. In this post, I’d like to consider some subtleties that concern object names.
Let’s start by examining kernel object handles in Process Explorer. When we select a process of interest, we can see the list of handles in one of the bottom views:
Handles view in Process Explorer
However, Process Explorer shows what it considers handles to named objects only by default. But even that is not quite right. You will find certain object types in this view that don’t have string-based names. The simplest example is processes. Processes have numeric IDs, rather than string-based names. Still, Process Explorer shows processes with a “name” that shows the process executable name and its unique process ID. This is useful information, for sure, but it’s not the object’s name.
Same goes for threads: these are displayed, even though threads (like processes) have numeric IDs rather than string-based names.
If you wish to see all handles in a process, you need to check the menu item Show Unnamed Handles and Mappings in the View menu.
Object Name Lifetime
What is the lifetime associated with an object’s name? This sounds like a weird question. Kernel objects are reference counted, so obviously when an object reference count drops to zero, it is destroyed, and its name is deleted as well. This is correct in part. Let’s look a bit deeper.
The following example code creates a Notepad process, and puts it into a named Job object (error handling omitted for brevity):
After running the above code, we can open Process Explorer, locate the new Notepad process, double-click it to get to its properties, and then navigate to the Job tab:
We can clearly see the job object’s name, prefixed with “\Sessions\1\BaseNamedObjects” because simple object names (like “MyTestJob”) are prepended with a session-relative directory name, making the name unique to this session only, which means processes in other sessions can create objects with the same name (“MyTestJob”) without any collision. Further details on names and sessions is outside the scope of this post.
Let’s see what the kernel debugger has to say regarding this job object:
Clearly, there is a single handle to the job object. The PointerCount value is not the real reference count because of the kernel’s tracking of the number of usages each handle has (outside the scope of this post as well). To get the real reference count, we can click the PointerCount DML link in WinDbg (the !truref command):
The handle count dropped to zero because we closed our (only) existing handle to the job. The job object’s name seem to be intact at first glance, but not really: The directory object is NULL, which means the object’s name is no longer visible in the object manager’s namespace.
Is the job object alive? Clearly, yes, as the pointer (reference) count is 1. When the handle count it zero, the Pointer Count is the correct reference count, and there is no need to run the !truref command. At this point, you should be able to guess why the object is still alive, and where is that one reference coming from.
If you guessed “the Notepad process”, then you are right. When a process is added to a job, it adds a reference to the job object so that it remains alive if at least one process is part of the job.
We, however, have lost the only handle we have to the job object. Can we get it back knowing the object’s name?
This call fails, and GetLastError returns 2 (“the system cannot find the file specified”, which in this case is the job object’s name). This means that the object name is destroyed when the last handle of the object is closed, even if there are outstanding references on the object (the object is alive!).
This the job object example is just that. The same rules apply to any named object.
Is there a way to “preserve” the object name even if all handles are closed? Yes, it’s possible if the object is created as “Permanent”. Unfortunately, this capability is not exposed by the Windows API functions like CreateJobObject, CreateEvent, and all other create functions that accept an object name.
Quick update: The native NtMakePermanentObject can make an object permanent given a handle, if the caller has the SeCreatePermanent privilege. This privilege is not granted to any user/group by default.
A permanent object can be created with kernel APIs, where the flag OBJ_PERMANENT is specified as one of the attribute flags part of the OBJECT_ATTRIBUTES structure that is passed to every object creation API in the kernel.
A “canonical” kernel example is the creation of a callback object. Callback objects are only usable in kernel mode. They provide a way for a driver/kernel to expose notifications in a uniform way, and allow interested parties (drivers/kernel) to register for notifications based on that callback object. Callback objects are created with a name so that they can be looked up easily by interested parties. In fact, there are quite a few callback objects on a typical Windows system, mostly in the Callback object manager namespace:
Most of the above callback objects’ usage is undocumented, except three which are documented in the WDK (ProcessorAdd, PowerState, and SetSystemTime). Creating a callback object with the following code creates the callback object but the name disappears immediately, as the ExCreateCallback API returns an object pointer rather than a handle:
PCALLBACK_OBJECT cb;
UNICODE_STRING name = RTL_CONSTANT_STRING(L"\\Callback\\MyCallback");
OBJECT_ATTRIBUTES cbAttr = RTL_CONSTANT_OBJECT_ATTRIBUTES(&name,
    OBJ_CASE_INSENSITIVE);
status = ExCreateCallback(&cb, &cbAttr, TRUE, TRUE);
The correct way to create a callback object is to add the OBJ_PERMANENT flag:
PCALLBACK_OBJECT cb;
UNICODE_STRING name = RTL_CONSTANT_STRING(L"\\Callback\\MyCallback");
OBJECT_ATTRIBUTES cbAttr = RTL_CONSTANT_OBJECT_ATTRIBUTES(&name,
    OBJ_CASE_INSENSITIVE | OBJ_PERMANENT);
status = ExCreateCallback(&cb, &cbAttr, TRUE, TRUE);
A permanent object must be made “temporary” (the opposite of permanent) before actually dereferencing it by calling ObMakeTemporaryObject.
Aside: Getting to an Object’s Name in WinDbg
For those that wonder how to locate an object’s name give its address. I hope that it’s clear enough… (watch the bold text).
Doing any kind of research into the Windows kernel requires working with a kernel debugger, mostly WinDbg (or WinDbg Preview). There are at least 3 “levels” of debugging the kernel.
Level 1: Local Kernel Debugging
The first is using a local kernel debugger, which means configuring WinDbg to look at the kernel of the local machine. This can be configured by running the following command in an elevated command window, and restarting the system:
bcdedit -debug on
You must disable Secure Boot (if enabled) for this command to work, as Secure Boot protects against putting the machine in local kernel debugging mode. Once the system is restarted, WinDbg launched elevated, select File/Kernel Debug and go with the “Local” option (WinDbg Preview shown):
If all goes well, you’ll see the “lkd>” prompt appearing, confirming you’re in local kernel debugging mode.
What can you in this mode? You can look at anything in kernel and user space, such as listing the currently existing processes (!process 0 0), or examining any memory location in kernel or user space. You can even change kernel memory if you so desire, but be careful, any “bad” change may crash your system.
The downside of local kernel debugging is that the system is a moving target, things change while you’re typing commands, so you don’t want to look at things that change quickly. Additionally, you cannot set any breakpoint; you cannot view any CPU registers, since these are changing constantly, and are on a CPU-basis anyway.
The upside of local kernel debugging is convenience – setting it up is very easy, and you can still get a lot of information with this mode.
Level 2: Remote Debugging of a Virtual Machine
The next level is a full kernel debugging experience of a virtual machine, which can be running locally on your host machine, or perhaps on another host somewhere. Setting this up is more involved. First, the target VM must be set up to allow kernel debugging and set the “interface” to the host debugger. Windows supports several interfaces, but for a VM the best to use is network (supported on Windows 8 and later).
First, go to the VM and ping the host to find out its IP address. Then type the following:
bcdedit /dbgsettings net hostip:172.17.32.1 port:55000 key:1.2.3.4
Replace the host IP with the correct address, and select an unused port on the host. The key can be left out, in which case the command will generate something for you. Since that key is needed on the host side, it’s easier to select something simple. If the target VM is not local, you might prefer to let the command generate a random key and use that.
Next, launch WinDbg elevated on the host, and attach to the kernel using the “Net” option, specifying the correct port and key:
Restart the target, and it should connect early in its boot process:
Microsoft (R) Windows Debugger Version 10.0.25200.1003 AMD64
Copyright (c) Microsoft Corporation. All rights reserved.

Using NET for debugging
Opened WinSock 2.0
Waiting to reconnect...
Connected to target 172.29.184.23 on port 55000 on local IP 172.29.176.1.
You can get the target MAC address by running .kdtargetmac command.
Connected to Windows 10 25309 x64 target at (Tue Mar  7 11:38:18.626 2023 (UTC - 5:00)), ptr64 TRUE
Kernel Debugger connection established.  (Initial Breakpoint requested)

************* Path validation summary **************
Response                         Time (ms)     Location
Deferred                                       SRV*d:\Symbols*https://msdl.microsoft.com/download/symbols
Symbol search path is: SRV*d:\Symbols*https://msdl.microsoft.com/download/symbols
Executable search path is:
Windows 10 Kernel Version 25309 MP (1 procs) Free x64
Edition build lab: 25309.1000.amd64fre.rs_prerelease.230224-1334
Machine Name:
Kernel base = 0xfffff801`38600000 PsLoadedModuleList = 0xfffff801`39413d70
System Uptime: 0 days 0:00:00.382
nt!DebugService2+0x5:
fffff801`38a18655 cc              int     3
Enter the g command to let the system continue. The prompt is “kd>” with the current CPU number on the left. You can break at any point into the target by clicking the “Break” toolbar button in the debugger. Then you can set up breakpoints, for whatever you’re researching. For example:
In this “level” of debugging you have full control of the system. When in a breakpoint, nothing is moving. You can view register values, call stacks, etc., without anything changing “under your feet”. This seems perfect, so do we really need another level?
Some aspects of a typical kernel might not show up when debugging a VM. For example, looking at the list of interrupt service routines (ISRs) with the !idt command on my Hyper-V VM shows something like the following (truncated):
Some things are missing, such as the keyboard interrupt handler. This is due to certain things handled “internally” as the VM is “enlightened”, meaning it “knows” it’s a VM. Normally, it’s a good thing – you get nice support for copy/paste between the VM and the host, seamless mouse and keyboard interaction, etc. But it does mean it’s not the same as another physical machine.
Level 3: Remote debugging of a physical machine
In this final level, you’re debugging a physical machine, which provides the most “authentic” experience. Setting this up is the trickiest. Full description of how to set it up is described in the debugger documentation. In general, it’s similar to the previous case, but network debugging might not work for you depending on the network card type your target and host machines have.
If network debugging is not supported because of the limited list of network cards supported, your best bet is USB debugging using a dedicated USB cable that you must purchase. The instructions to set up USB debugging are provided in the docs, but it may require some trial and error to locate the USB ports that support debugging (not all do). Once you have that set up, you’ll use the “USB” tab in the kernel attachment dialog on the host. Once connected, you can set breakpoints in ISRs that may not exist on a VM:
I’ve recently posted about the upcoming training classes, the first of which is Advanced Windows Kernel Programming in April. Some people have asked me how can they participate if they have not taken the Windows Kernel Programming fundamentals class, and they might not have the required time to read the book.
Since I don’t plan on providing the fundamentals training class before April, after some thought, I decided to do the following.
I am selling one of the previous Windows Kernel Programming class recordings, along with the course PDF materials, the labs, and solutions to the labs. This is the first time I’m selling recordings of my public classes. If this “experiment” goes well, I might consider doing this with other classes as well. Having recordings is not the same as doing a live training class, but it’s the next best thing if the knowledge provided is valuable and useful. It’s about 32 hours of video, and plenty of labs to keep you busy
As an added bonus, I am also giving the following to those purchasing the training class:
You get 10% discount for the Advanced Windows Kernel Programming class in April.
You will be added to a discord server that will host all the Alumni from my public classes (an idea I was given by some of my students which will happen soon)
A live session with me sometime in early April (I’ll do a couple in different times of day so all time zones can find a comfortable session) where you can ask questions about the class, etc.
These are the modules covered in the class recordings:
Module 0: Introduction
Module 1: Windows Internals Overview
Module 2: The I/O System
Module 3: Device Driver Basics
Module 4: The I/O Request Packet
Module 5: Kernel Mechanisms
Module 6: Process and Thread Monitoring
Module 7: Object and Registry Notifications
Module 8: File System Mini-Filters Fundamentals
Module 9: Miscellaneous Techniques
If you’re interested in purchasing the class, send me an email to [email protected] with the title “Kernel Programming class recordings” and I will reply with payment details. Once paid, reply with the payment information, and I will share a link with the course. I’m working on splitting the recordings into meaningful chunks, so not all are ready yet, but these will be completed in the next day or so.
Here are the rules after a purchase:
No refunds – once you have access to the recordings, this is it.
No sharing – the content is for your own personal viewing. No sharing of any kind is allowed.
No reselling – I own the copyright and all rights.
The cost is 490 USD for the entire class. That’s the whole 32 hours.
If you’re part of a company (or simply have friends) that would like to purchase multiple “licenses”, contact me for a discount.
Today I’m happy to announce two training classes to take place in April and May. These classes will be in 4-hour session chunks, so that it’s easier to consume even for uncomfortable time zones.
The first is Advanced Windows Kernel Programming, a class I was promising for quite some time now… it will be held on the following dates:
April: 18, 20, 24, 27 and May: 1, 4, 8, 11 (4 days total)
Times: 11am to 3pm ET (8am-12pm PT, 4pm to 8pm UT/GMT)
The course will include advanced topics in Windows kernel development, and is recommended for those that were in my Windows Kernel Programming class or have equivalent knowledge; for example, by reading my book Windows Kernel Programming.
Example topics include: deep dive into Windows’ kernel design, working with APCs, Windows Filtering Platform callout drivers, advanced memory management techniques, plug & play filter drivers, and more!
The second class is Windows Internals to be held on the following dates:
Times: 11am to 3pm ET (8am-12pm PT, 4pm to 8pm UT/GMT)
The syllabus can be found here (some modifications possible, but the general outline remains).
Cost 950 USD (if paid by an individual), 1900 USD (if paid by a company). The cost is the same for these training classes. Previous students in my classes get 10% off. Multiple participants from the same company get a discount as well (contact me for the details).
If you’d like to register, please send me an email to [email protected] with the name of the training in the email title, provide your full name, company (if any), preferred contact email, and your time zone.
The sessions will be recorded, so you can watch any part you may be missing, or that may be somewhat overwhelming in “real time”.
As part of the second edition of Windows Kernel Programming, I’m working on chapter 13 to describe the basics of the Windows Filtering Platform (WFP). The chapter will focus mostly on kernel-mode WFP Callout drivers (it is a kernel programming book after all), but I am also providing a brief introduction to WFP and its user-mode API.
This introduction (with some simplifications) is what this post is about. Enjoy!
The Windows Filtering Platform (WFP) provides flexible ways to control network filtering. It exposes user-mode and kernel-mode APIs, that interact with several layers of the networking stack. Some configuration and control is available directly from user-mode, without requiring any kernel-mode code (although it does require administrator-level access). WFP replaces older network filtering technologies, such as Transport Driver Interface (TDI) filters some types of NDIS filters.
If examining network packets (and even modification) is required, a kernel-mode Callout driver can be written, which is what we’ll be concerned with in this chapter. We’ll begin with an overview of the main pieces of WFP, look at some user-mode code examples for configuring filters before diving into building simple Callout drivers that allows fine-grained control over network packets.
WFP is comprised of user-mode and kernel-mode components. A very high-level architecture is shown here:
In user-mode, the WFP manager is the Base Filtering Engine (BFE), which is a service implemented by bfe.dll and hosted in a standard svchost.exe instance. It implements the WFP user-mode API, essentially managing the platform, talking to its kernel counterpart when needed. We’ll examine some of these APIs in the next section.
User-mode applications, services and other components can utilize this user-mode management API to examine WFP objects state, and make changes, such as adding or deleting filters. A classic example of such “user” is the Windows Firewall, which is normally controllable by leveraging the Microsoft Management Console (MMC) that is provided for this purpose, but using these APIs from other applications is just as effective.
The kernel-mode filter engine exposes various logical layers, where filters (and callouts) can be attached. Layers represent locations in the network processing of one or more packets. The TCP/IP driver makes calls to the WFP kernel engine so that it can decide which filters (if any) should be “invoked”.
For filters, this means checking the conditions set by the filter against the current request. If the conditions are satisfied, the filter’s action is applied. Common actions include blocking a request from being further processed, allowing the request to continue without further processing in this layer, continuing to the next filter in this layer (if any), and invoking a callout driver. Callouts can perform any kind of processing, such as examining and even modifying packet data. The relationship between layers, filters, and callouts is shown here:
As you can see the diagram, each layer can have zero or more filters, and zero or more callouts. The number and meaning of the layers is fixed and provided out of the box by Windows. On most system, there are about 100 layers. Many of the layers are sets of pairs, where one is for IPv4 and the other (identical in purpose) is for IPv6.
The WFP Explorer tool I created provides some insight into what makes up WFP. Running the tool and selecting View/Layers from the menu (or clicking the Layers tool bar button) shows a view of all existing layers.
Each layer is uniquely identified by a GUID. Its Layer ID is used internally by the kernel engine as an identifier rather than the GUID, as it’s smaller and so is faster (layer IDs are 16-bit only). Most layers have fields that can be used by filters to set conditions for invoking their actions. Double-clicking a layer shows its properties. The next figure shows the general properties of an example layer. Notice it has 382 filters and 2 callouts attached to it.
Clicking the Fields tab shows the fields available in this layer, that can be used by filters to set conditions.
The meaning of the various layers, and the meaning of the fields for the layers are all documented in the official WFP documentation.
The currently existing filters can be viewed in WFP Explorer by selecting Filters from the View menu. Layers cannot be added or removed, but filters can. Management code (user or kernel) can add and/or remove filters dynamically while the system is running. You can see that on the system the tool is running on there are currently 2978 filters.
Each filter is uniquely identified by a GUID, and just like layers has a “shorter” id (64-bit) that is used by the kernel engine to more quickly compare filter IDs when needed. Since multiple filters can be assigned to the same layer, some kind of ordering must be used when assessing filters. This is where the filter’s weight comes into play. A weight is a 64-bit value that is used to sort filters by priority. As you can see in figure 13-7, there are two weight properties – weight and effective weight. Weight is what is specified when adding the filter, but effective weight is the actual one used. There are three possible values to set for weight:
A value between 0 and 15 is interpreted by WFP as a weight index, which simply means that the effective weight is going to start with 4 bits having the specified weight value and generate the other 60 bit. For example, if the weight is set to 5, then the effective weight is going to be between 0x5000000000000000 and 0x5FFFFFFFFFFFFFFF.
An empty value tells WFP to generate an effective weight somewhere in the 64-bit range.
A value above 15 is taken as is to become the effective weight.
What is an “empty” value? The weight is not really a number, but a FWP_VALUEtype can hold all sorts of values, including holding no value at all (empty).
Double-clicking a filter in WFP Explorer shows its general properties:
The Conditions tab shows the conditions this filter is configured with. When all the conditions are met, the action of the filter is going to fire.
The list of fields used by a filter must be a subset of the fields exposed by the layer this filter is attached to. There are six conditions shown in figure 13-9 out of the possible 39 fields supported by this layer (“ALE Receive/Accept v4 Layer”). As you can see, there is a lot of flexibility in specifying conditions for fields – this is evident in the matching enumeration, FWPM_MATCH_TYPE:
The WFP API exposes its functionality for user-mode and kernel-mode callers. The header files used are different, to cater for differences in API expectations between user-mode and kernel-mode, but APIs in general are identical. For example, kernel APIs return NTSTATUS, whereas user-mode APIs return a simple LONG, that is the error value that is returned normally from GetLastError. Some APIs are provided for kernel-mode only, as they don’t make sense for user mode.
W> The user-mode WFP APIs never set the last error, and always return the error value directly. Zero (ERROR_SUCCESS) means success, while other (positive) values mean failure. Do not call GetLastError when using WFP – just look at the returned value.
WFP functions and structures use a versioning scheme, where function and structure names end with a digit, indicating version. For example, FWPM_LAYER0 is the first version of a structure describing a layer. At the time of writing, this was the only structure for describing a layer. As a counter example, there are several versions of the function beginning with FwpmNetEventEnum: FwpmNetEventEnum0 (for Vista+), FwpmNetEventEnum1 (Windows 7+), FwpmNetEventEnum2 (Windows 8+), FwpmNetEventEnum3 (Windows 10+), FwpmNetEventEnum4 (Windows 10 RS4+), and FwpmNetEventEnum5 (Windows 10 RS5+). This is an extreme example, but there are others with less “versions”. You can use any version that matches the target platform. To make it easier to work with these APIs and structures, a macro is defined with the base name that is expanded to the maximum supported version based on the target compilation platform. Here is part of the declarations for the macro FwpmNetEventEnum:
You can see that the differences in the functions relate to the structures returned as part of these APIs (FWPM_NET_EVENTx). It’s recommended you use the macros, and only turn to specific versions if there is a compelling reason to do so.
The WFP APIs adhere to strict naming conventions that make it easier to use. All management functions start with Fwpm (Filtering Windows Platform Management), and all management structures start with FWPM. The function names themselves use the pattern <prefix><object type><operation>, such as FwpmFilterAdd and FwpmLayerGetByKey.
It’s curious that the prefixes used for functions, structures, and enums start with FWP rather than the (perhaps) expected WFP. I couldn’t find a compelling reason for this.
WFP header files start with fwp and end with u for user-mode or k for kernel-mode. For example, fwpmu.h holds the management functions for user-mode callers, whereas fwpmk.h is the header for kernel callers. Two common files, fwptypes.h and fwpmtypes.h are used by both user-mode and kernel-mode headers. They are included by the “main” header files.
User-Mode Examples
Before making any calls to specific APIs, a handle to the WFP engine must be opened with FwpmEngineOpen:
Most of the arguments have good defaults when NULL is specified. The returned handle must be used with subsequent APIs. Once it’s no longer needed, it must be closed:
What can we do with an engine handle? One thing provided with the management API is enumeration. These are the APIs used by WFP Explorer to enumerate layers, filters, sessions, and other object types in WFP. The following example displays some details for all the filters in the system (error handling omitted for brevity, the project wfpfilters has the full source code):
#include <Windows.h>
#include <fwpmu.h>
#include <stdio.h>
#include <string>

#pragma comment(lib, "Fwpuclnt")

std::wstring GuidToString(GUID const& guid) {
    WCHAR sguid[64];
    return ::StringFromGUID2(guid, sguid, _countof(sguid)) ? sguid : L"";
}

const char* ActionToString(FWPM_ACTION const& action) {
    switch (action.type) {
        case FWP_ACTION_BLOCK:               return "Block";
        case FWP_ACTION_PERMIT:              return "Permit";
        case FWP_ACTION_CALLOUT_TERMINATING: return "Callout Terminating";
        case FWP_ACTION_CALLOUT_INSPECTION:  return "Callout Inspection";
        case FWP_ACTION_CALLOUT_UNKNOWN:     return "Callout Unknown";
        case FWP_ACTION_CONTINUE:            return "Continue";
        case FWP_ACTION_NONE:                return "None";
        case FWP_ACTION_NONE_NO_MATCH:       return "None (No Match)";
    }
    return "";
}

int main() {
    //
    // open a handle to the WFP engine
    //
    HANDLE hEngine;
    FwpmEngineOpen(nullptr, RPC_C_AUTHN_DEFAULT, nullptr, nullptr, &hEngine);

    //
    // create an enumeration handle
    //
    HANDLE hEnum;
    FwpmFilterCreateEnumHandle(hEngine, nullptr, &hEnum);

    UINT32 count;
    FWPM_FILTER** filters;
    //
    // enumerate filters
    //
    FwpmFilterEnum(hEngine, hEnum,
        8192,       // maximum entries,
        &filters,   // returned result
        &count);    // how many actually returned

    for (UINT32 i = 0; i < count; i++) {
        auto f = filters[i];
        printf("%ws Name: %-40ws Id: 0x%016llX Conditions: %2u Action: %s\n",
            GuidToString(f->filterKey).c_str(),
            f->displayData.name,
            f->filterId,
            f->numFilterConditions,
            ActionToString(f->action));
    }
    //
    // free memory allocated by FwpmFilterEnum
    //
    FwpmFreeMemory((void**)&filters);

    //
    // close enumeration handle
    //
    FwpmFilterDestroyEnumHandle(hEngine, hEnum);

    //
    // close engine handle
    //
    FwpmEngineClose(hEngine);

    return 0;
}
The enumeration pattern repeat itself with all other WFP object types (layers, callouts, sessions, etc.).
Adding Filters
Let’s see if we can add a filter to perform some useful function. Suppose we want to prevent network access from some process. We can add a filter at an appropriate layer to make it happen. Adding a filter is a matter of calling FwpmFilterAdd:
The weird-looking comments are generated by the Microsoft Interface Definition Language (MIDL) compiler when generating the header file from an IDL file. Although IDL is most commonly used by Component Object Model (COM) to define interfaces and types, WFP uses IDL to define its APIs, even though no COM interfaces are used; just plain C functions. The original IDL files are provided with the SDK, and they are worth checking out, since they may contain developer comments that are not “transferred” to the resulting header files.
Some members in FWPM_FILTER are necessary – layerKey to indicate the layer to attach this filter, any conditions needed to trigger the filter (numFilterConditions and the filterCondition array), and the action to take if the filter is triggered (action field).
Let’s create some code that prevents the Windows Calculator from accessing the network. You may be wondering why would calculator require network access? No, it’s not contacting Google to ask for the result of 2+2. It’s using the Internet for accessing current exchange rates.
Clicking the Update Rates button causes Calculator to consult the Internet for the updated exchange rate. We’ll add a filter that prevents this.
We’ll start as usual by opening handle to the WFP engine as was done in the previous example. Next, we need to fill the FWPM_FILTER structure. First, a nice display name:
FWPM_FILTER filter{};   // zero out the structure
WCHAR filterName[] = L"Prevent Calculator from accessing the web";
filter.displayData.name = filterName;
The name has no functional part – it just allows easy identification when enumerating filters. Now we need to select the layer. We’ll also specify the action:
There are several layers that could be used for blocking access, with the above layer being good enough to get the job done. Full description of the provided layers, their purpose and when they are used is provided as part of the WFP documentation.
The last part to initialize is the conditions to use. Without conditions, the filter is always going to be invoked, which will block all network access (or just for some processes, based on its effective weight). In our case, we only care about the application – we don’t care about ports or protocols. The layer we selected has several fields, one of with is called ALE App ID (ALE stands for Application Layer Enforcement).
This field can be used to identify an executable. To get that ID, we can use FwpmGetAppIdFromFileName. Here is the code for Calculator’s executable:
The code uses the path to the Calculator executable on my system – you should change that as needed because Calculator’s version might be different. A quick way to get the executable path is to run Calculator, open Process Explorer, open the resulting process properties, and copy the path from the Image tab.
The R"( and closing parenthesis in the above snippet disable the “escaping” property of backslashes, making it easier to write file paths (C++ 14 feature).
The conditionValue member of FWPM_FILTER_CONDITION is a FWP_VALUE, which is a generic way to specify many types of values. It has a type member that indicates the member in a big union that should be used. In our case, the type is a BLOB (FWP_BYTE_BLOB_TYPE) and the actual value should be passed in the byteBlob union member.
The last step is to add the filter, and repeat the exercise for IPv6, as we don’t know how Calculator connects to the currency exchange server (we can find out, but it would be simpler and more robust to just block IPv6 as well):
Running this code (elevated) should and trying to refresh the currency exchange rate with Calculator should fail. Note that there is no need to restart Calculator – the effect is immediate.
We can locate the filters added with WFP Explorer:
Double-clicking one of the filters and selecting the Conditions tab shows the only condition where the App ID is revealed to be the full path of the executable in device form. Of course, you should not take any dependency on this format, as it may change in the future.
You can right-click the filters and delete them using WFP Explorer. The FwpmFilterDeleteByKeyAPI is used behind the scenes. This will restore Calculator’s exchange rate update functionality.
A lot of the functionality in Windows is based around various kernel objects. One such object is a Directory, not to be confused with a directory in a file system. A Directory object is conceptually simple: it’s a container for other kernel objects, including other Directory objects, thus creating a hierarchy used by the kernel’s Object Manager to manage named objects. This arrangement can be easily seen with tools like WinObj from Sysinternals:
The left part of WinObj shows object manager directories, where named objects are “stored” and can be located by name. Clear and simple enough.
However, Directory objects can be unnamed as well as named. How can this be? Here is my Object Explorer tool (similar functionality is available with my System Explorer tool as well). One of its views is a “statistical” view of all object types, some of their properties, such as their name, type index, number of objects and handles, peak number of objects and handles, generic access mapping, and the pool type they’re allocated from.
If you right-click the Directory object type and select “All Objects”, you’ll see another view that shows all Directory objects in the system (well, not necessarily all, but most*).
If you scroll a bit, you’ll see many unnamed Directory objects that have no name:
It seems weird, as a Directory with no name doesn’t make sense. These directories, however, are “real” and serve an important purpose – managing a private object namespace. I blogged about private object namespaces quite a few years ago (it was in my old blog site that is now unfortunately lost), but here is the gist of it:
Object names are useful because they allow easy sharing between processes. For example, if two or more processes would like to share memory, they can create a memory mapped file object (called Section within the kernel) with a name they are all aware of. Calling CreateFileMapping (or one of its variants) with the same name will create the object (by the first caller), where subsequent callers get handles to the existing object because it was looked up by name.
This is easy and useful, but there is a possible catch: since the name is “visible” using tools or APIs, other processes can “interfere” with the object by getting their own handle using that visible name and “meddle” with the object, maliciously or accidentally.
The solution to this problem arrived in Windows Vista with the idea of private object namespaces. A set of cooperating processes can create a private namespace only they can use, protected by a “secret” name and more importantly a boundary descriptor. The details are beyond the scope of this post, but it’s all documented in the Windows API functions such as CreateBoundaryDescriptor, CreatePrivateNamespace and friends. Here is an example of using these APIs to create a private namespace with a section object in it (error handling omitted):
If you run this demo application, and look at the resulting handle (hSharedMem) in the above code in a tool like Process Explorer or Object Explorer you’ll see the name of the object is not given:
The full name is not shown and cannot be retrieved from user mode. And even if it could somehow be located, the boundary descriptor provides further protection. Let’s examine this object in the kernel debugger. Copying its address from the object’s properties:
Pasting the address into a local kernel debugger – first using the generic !object command:
The name is there, but the directory object is there as well. Let’s examine it:
lkd> !object ffffb3069e8cbe00
Object: ffffb3069e8cbe00  Type: (ffff9507ed6d0d20) Directory
    ObjectHeader: ffffb3069e8cbdd0 (new version)
    HandleCount: 3  PointerCount: 98300

    Hash Address          Type                      Name
    ---- -------          ----                      ----
     19  ffffb3068e162d10 Section                   MySharedMem
There is one object in this directory. What’s the directory’s name? We need to examine the object header for that – its address is given in the above output:
Getting a kernel’s object name is a little tricky, and will not be fully described here. The first requirement is the InfoMask member must have bit 1 set (value of 2), as this indicates a name is present. Since it’s not (the value is 8), there is no name to this directory. We can examine the directory object in more detail by looking at the real data structure underneath given the object’s original address:
The interesting piece is the NamespaceEntry member, which is not-NULL. This indicates the purpose of this directory: to be a container for a private namespace’s objects. You can also click on HasBuckets and locate the single section object there.
Going back to Process Explorer, enabling unnamed object handles (View menu, Show Unnamed Handles and Mappings) and looking for unnamed directory objects:
The directory’s address is the same one we were looking at!
The pointer at NamespaceEntry points to an undocumented structure that is not currently provided with the symbols. But just looking a bit beyond the directory’s object structure shows a hint:
The name “MyDescriptor” is clearly visible, which is the name of the boundary descriptor in the above code.
The kernel debugger’s documentation indicates that the !object command with a -p switch should show the private namespaces. However, this fails:
lkd> !object -p
00000000: Unable to get value of ObpPrivateNamespaceLookupTable
The debugger seems to fail locating a global kernel variable. This is probably a bug in the debugger command, because object namespaces scope has changed since the introduction of Server Silos in Windows 10 version 1607 (for example, Docker uses these when running Windows containers). Each silo has its own object manager namespace, so the old global variable does not exist anymore. I suspect Microsoft has not updated this command switch to support silos. Even with no server silos running, the host is considered to be in its own (global) silo, called host silo. You can see its details by utilizing the !silo debugger command:
kd> !silo -g host
Server silo globals fffff80766124540:
		Default Error Port: ffff950815bee140
		ServiceSessionId  : 0
		OB Root Directory :
		State             : Running
Clicking the “Server silo globals” link, shows more details:
PrivateNamespaceLookupTable is the root object for the private namespaces for this Silo (in this example it’s the host silo).
The interested reader is welcome to dig into this further.
The list of private namespaces is provided with the WinObjEx64 tool if you run it elevated and have local kernel debugging enabled, as it uses the kernel debugger’s driver to read kernel memory.
* Most objects, because the way Object Explorer works is by enumerating handles and associating them with objects. However, some objects are held using references from the kernel with zero handles. Such objects cannot be detected by Object Explorer.
I’m happy to open registration for the next 5 dayWindowsInternals training to be conducted in November in the following dates and from 11am to 7pm, Eastern Standard Time (EST) (8am to 4pm PST): 21, 22, 28, 29, 30.
The syllabus can be found here (some modifications possible, but the general outline should remain).
Training cost is 900 USD if paid by an individual, or 1800 USD if paid by a company. Participants in any of my previous training classes get 10% off.
If you’d like to register, please send me an email to [email protected] with “Windows Internals training” in the title, provide your full name, company (if any), preferred contact email, and your time zone.
The sessions will be recorded, so you can watch any part you may be missing, or that may be somewhat overwhelming in “real time”.
Recently-ish (~2020), Microsoft changed the way the kernel image is mapped and also some implementation details of hal.dll. The kernel changes have caused existing methods of finding the base of the kernel via shellcode or a leak and arbitrary read to crash. This obviously isn't great, so I decided to figure out a way around the issue to support some code I've been writing in my free time (maybe more on that later).
Our discussion is going to start at Windows 10 1903 and then move up through Windows 10 21H2. These changes are also still present in Windows 11.
What's the point(er)?
Finding the base of the kernel is important for kernel exploits and kernel shellcode. If you can find the base of the kernel you can look up functions inside of it via the export table in its PE header. Various functions inside of the kernel allow you to allocate memory, start threads, and resolve other kernel module bases via the PsLoadedModuleList. Without being able to utilize kernel routines and symbols, you're pretty limited in what you can do if you're executing in kernel. Hopefully this clarifies why this post is even necessary.
[[more]]
Literature Review: Existing Methods
In order to understand where I am going with all of this, we first need to look at what techniques are already out there. This is split up into three parts: how to get to the base of the kernel, obtaining ("leaking") a kernel address to be used to find the base, and how to do version detection in kernel.
Getting to Kernel Base
Two of these methods rely on having some kind of memory leak of a kernel address, one does not. They really all have the same goal: to locate the base of the kernel.
All of these techniques apply to any PE file, not just the kernel.
NtQuerySystemInformation
The easiest and most version independent way to get the base of the kernel and all other kernel modules as via NtQuerySystemInformation using the SystemModuleInformation (0xB) member of the SYSTEM_INFORMATION_CLASS enumeration. When queried (with an appropriate buffer size), the function will return a filled out SYSTEM_MODULE_INFORMATION structure that contains a DWORD for the number of modules present and then an anysize array of SYSTEM_MODULE structures representing the modules. Here's some C code that uses it to query driver names and bases. You can actually get the base addresses and names of every kernel module via some documented APIs too: EnumDeviceDrivers and GetDeviceDriverBaseNameA from the PSAPI can be used together in order to accomplish that. On the backend they use NtQuerySystemInformation with the SystemModuleInformation class. FYI, psapi is just a small stub around the API set DLL api-ms-win-core-psapi-l1-1-0.dll, which ends up forwarding to kernelbase.dll in all versions.
A portion of kernelbase!EnumDeviceDrivers showing a call to NtQuerySystemInformation
GetDeviceDriverBaseNameA calls the unexported kernel32!FindDeviceDriver function, which again calls NtQuerySystemInformation with the SystemModuleInformation class.
Scan Backwards
In the event we cannot get any information from user-mode or we are in a low-integrity process, then the scanback technique can be used. Basically, we need a memory leak or reliable way of getting a kernel address to get in the "ballpark" of the kernel image. See the next section on "leaking" kernel addresses for more details on that. Once we have an address somewhere in the kernel, we can scan backwards one page (0x1000 bytes) at a time until we get to the PE header of the kernel image. This trick relies on two major assumptions:
PE images are page aligned
The memory space between the leaked address and the base of the kernel is contiguously mapped
We will see later that #2 isn't true on newer versions of Windows.
Every PE file starts with the bytes MZ (0x5a4d). To see if we have reached the beginning of the PE file, we can check to see if the page starts with MZ. If it does not, continue scanning back, if it does, then you have (probably) found the base of the image. I recommend doing a little bit more validation than that, such as seeing if the suspected base address + IMAGE_DOS_HEADER.e_lfanew contains the bytes PE (0x4550).
If you're interested in a code implementation of this technique, here's some code from zerosum0x0.
Relative Virtual Address (RVA)
The lamest of the kernel base finding methods is just to hard code the Relative Virtual Address (RVA) of the leaked symbol into your shellcode or exploit. This requires knowing the exact version(s) your code will be running on ahead of time and also requires version detection to support multiple versions of the kernel.
A slight variation on this method is to use an exported symbol from the leaked module to calculate its base. You can open the image file in user-mode and then look up the exported symbol to get its offset from the base address. This can be accomplished with LoadLibraryA and GetProcAddress. You can also do manual PE parsing. However, loading something like the kernel image into a user-mode process is pretty suspicious. You'll also need a way to pass the calculated RVA into your exploit or shellcode.
"Leaking" Kernel Addresses
To get a kernel address from an exploit you usually have to have a memory leak (information disclosure). When you're already executing via shellcode you have more options, but you still need to find a pointer into the kernel or another module to utilize the techniques above.
KPCR
Each logical processor on a Windows system has an associated structure called the Kernel Processor Control Region (KPCR). The KPCR is a massive structure, coming in at 0xC000 bytes as of the Windows 11 Beta. The first 0x180 bytes are almostentirelyconsistentacrossversions. At offset 0x180 lies the nested Kernel Processor Region Control Block (KPRCB) structure, which is very large and the reason that the KPCR is as large as it is. Members are added when major features (like KVAS) are added to the OS.
On 64-bit Windows, the GS segment register points to the KPCR for that processor. The swapgs instruction at kernel entry points (such as the system call handler, KiSystemCall64[Shadow], and Interrupt Service Routines (ISRs)) causes the processor to swap the contents of Model Specific Register (MSR) 0xC0000101 (GSBASE) with MSR 0xC0000102 (KERNEL_GSBASE). GSBASE is also the contents of the GS segment register. On 32-bit, 0x30 is explicitly loaded into FS at kernel entry points, and the GDT entry at offset 0x30 defines the base as the address of the KPCR for that processor.
swapgs at the 64-bit kernel entrypoint
Moving 0x30 into FS at the 32-bit kernel entrypoint
Both the upper members of the KPCR and the KPRCB have pointers into the kernel and other modules that might be of use to use while trying to calculate where exactly the kernel is located. The issue with the KPRCB is that fields change frequently, so the offset to a particular field of interest would be very version dependent.
Interrupt Descriptor Table
One classic and consistent place to find reliable pointers into the kernel in the KPCR is in the Interrupt Descriptor Table (IDT). The KPCR has a pointer to the IDT at offset 0x38, the IdtBase field. Dumping out quad words (with symbols) at that address gives some pointers into the kernel!
If you look a bit lower in the code from zerosum0x0 that I linked earlier you can see this is exactly the method being used to get a kernel address.
KTHREAD Pointers
One of the fields in the KPRCB that is consistent across versions of the kernel is the CurrentThread field at offset 8. This would be at the KPCR at offset 0x188 (x64). In fact, you'll see this offset repeatedly in the kernel, as this is what the kernel uses to get a pointer to the current thread running on the processor.
Here's an example from KiKernelSysretExit, which might look familiar from my KVAS post
If we dump pointers with symbols (dps) at the current thread over the size of KTHREAD, we can see many pointers into the kernel!
The output was shortened in places that did not have kernel pointers. Notice there are only three kernel pointers in this thread! The two different functions and their offsets into KTHREAD are consistent between the system thread and the user thread. If you check any thread, you will find that these pointers are present. What are these three fields? The offset into KTHREAD to the first nt!EmpCheckErrataList pointer is 0x2a8 (0xffffe70e57dee368-0xffffe70e57dee0c0). Dumping out KTHREAD gives the answer!
The dt WinDbg command has a lot of useful options. -v and -r (used above) show sizes for fields and recurse through nested structures, respectively. Check out the docs for more options and info!
The fields are the KernelRoutine, RundownRoutine, and NormalRoutine function pointers in the SchedulerApc member of KTHREAD. These offsets have been consistent since Windows 8 RTM where the name of the field was changed from SuspendApc to SchedulerApc. Unfortunately, these function pointers seem to have been removed from Windows 21H1, probably to prevent this kind of disclosure. Of course you can just go back to the old versions to get the true use, since they are still present in newer Windows versions.
It's worth noting that I'm not the first one to discover this. Pages 20 and 21 of Morten Schenk's 2017 BlackHat briefing paper show that if you have a pointer to KTHREAD, then you can reliably get pointers into the kernel (hence why this is in the literature review section).
LSTAR MSR
When a syscall instruction is executed, the processor jumps to the address contained in the LSTAR Model Specific Register (MSR) (0xC0000082) after transitioning into kernel mode. This is not Windows specific behavior, as it is defined in the Intel Manual (Volume 2B, Chapter 4.3, SYSCALL). The system call handlers are unsurprisingly located in the kernel image, so if you can execute a rdmsr, you can get a pointer into the kernel. Of course this technique is only useful for shellcode or if you are somehow already executing in kernel.
With the introduction of KVAS, all of the kernel entry points were moved into a section in the kernel called KVASCODE. This section is present in both the user-mode and kernel-mode copies of the page tables. In kernels that have KVAS support up to Windows 10 19H2 the KVASCODE section directly borders the .text section, so if you are able to get an address of a kernel entry point (such as the one in the LSTAR MSR), then you can use it as a starting point for a scanback.
Passing in from Userland
Of course, one foolproof technique you can use to get the base of the kernel into your kernel mode payload is pass the address in from user-mode. This is assuming medium integrity execution in user-mode and will not help when you're dealing with a fully remote exploit.
Other Leaks
Talking about how more specific kernel memory leaks work is outside the scope of this post, but I will say that Microsoft very frequently patches kernel information disclosure bugs, so perhaps you can use my post about patch extraction and patch diffing to find and play with one :).
Version Detection in Kernel
Version detection can be accomplished by looking at the NtMajorVersion, NtMinorVersion, NtBuildNumber, and NtProductType fields of KUSER_SHARED_DATA, which is always located in the kernel at 0xFFDF0000 (32-bit) or 0xFFFFF78000000000 (64-bit). Microsoft recently randomized the writable version of this structure and a read-only mapping is located at the old static address. Information on that can be found on the MSRC blog and in this post by Connor McGarr.
Funny enough the NtMajorVersion is still 10 on Windows 11
What Has Changed?
Now that we are all up to speed on what techniques are already out there, we need to take a look at what Microsoft has changed in the most recent versions of Windows that get in the way of some of these techniques and then how to work around these changes to make sure exploitation and/or execution can keep working on 20H1 and higher.
Kernel Mapping and Fake Headers
In kernel versions prior to 20H1, the .text section of the kernel binary bordered the top of the image. This means that it also bordered the PE header for the image. This fact is why it is possible to use the scanback technique from a pointer into the .text section. In kernel versions 20H1 and up, the .text section no longer borders the PE header. In fact, no code sections at all border the PE header. The .rdata (read-only data), .pdata (exception data), and .idata (import data) sections now border the PE header. Between .idata and the next readable section, PROTDATA lies a few unmapped pages and then the text section at 0x200000 bytes offset from the base of the PE. Fortunately, .text and KVASCODE are contiguous with the sections in between them.
The image starts with .text and it borders the top of the image
The .text section and the base of the image are now non-contiguous
For the sake of validation, let's see if those pages are actually unmapped or if something is there. To do so, let's load up our trusty kernel debugger.
I'm just going to go back by a few thousand bytes fromt the kernel's text section into that gap and look over what is there, if anything.
Everything seems to parse out OK, but there is some minor issues...
For starters the machine type for this "DLL" is i386, which seems unlikely to be true since this is a 64-bit kernel. Another discrepancy is the debug directory, which seems to be completely bogus. It seems like there are a bunch of fake, mostly complete DOS/PE headers in that gap for some reason. The following command will find them all and dump their headers for closer inspection:
The first one is the header dump for the kernel. Note the valid debug directory. If you want the full output you can get that here.
Some of these headers are less valid than they appear. The last header tells us that the code section starts at an offset of 0x1000 bytes, as is common for PE files. Investigating that memory location yields not code, but ASCII data.
It is possible that these DLLs/drivers were really here at some point but they are gone now and may have been replaced by other data. Regardless, what is left will mess up our page-at-a-time scanback technique to find the base of the kernel.
hal.dll
Another interesting change in the kernel in 20H1+ is that the Hardware Abstraction Layer (HAL) has moved into the kernel image itself and no longer lives inside of hal.dll. If you open up hal.dll in a disassembler, you will notice that it actually does not even have a .text section. It is just a forwarding DLL that forwards exports into the kernel. The forwarding is done to not break backwards compatibility with drivers and components that expect to import HAL functionality from hal.dll and not ntoskrnl.exe.
hal.dll has no code! It does still have the Hal* exports.
Fixing Scanback
Since the new version of the kernel has the .text section starting at 0x200000 we can adjust our scanback to the following algorithm:
Obviously, this code has to be version dependent so we can still use the KUSER_SHARED_DATA version detection method to decide which step amount to use. The algorithm is the same as before, but instead of rounding down to the nearest page and then scanning backward by page size, we use 0x200000. This technique actually also works on 19H1, since the kernel is mapped with large pages (yes entirely RWX in 19H1) and large pages happen to be 0x200000 bytes in size.
Another alternative is to parse each header and try to figure out which one is ntoskrnl.exe. I've tried two alternatives that work: checking the number of sections or looking up the PDB path via the DEBUG data directory.
If Microsoft decides to change the .text section offset or puts unmapped regions between sections this will need to be re-written.
Wrap Up
I hope that this post has been informative! I thought there was going to be more in the solutions section than literature review, but I think this ended up being a good round up of info regardless. It's been something I've wanted to post for a while but finally took the time to write it up properly.
Anyway, have a good day and remember to ask yourself... ~~did you set it to wumbo?~~
I wanted to do a small post here, just because the answer to this issue was sort of scattered on the internet. Bigger post coming soon on some kernel exploit technique stuff.
It turns out that when running kd.exe for command line kernel debugging from VSCode remote, symbol resolution breaks completely. Why? Looks like when running from a service symsrv.dll uses WINHTTP for making requests instead of WININET. You can replicate this behavior in a normal shell by setting $env:DBGHELP_WINHTTP=1 in a powershell window and then running kd.exe. For some reason, WINHTTP tries to always use a proxy server, so you have to tell it not to via the following key in the registry:
HKEY_LOCAL_MACHINE\SOFTWARE\Microsoft\Symbol Server -> NoInternetProxy -> DWORD = 1
You should also set it in HKLM\SOFTWARE\WOW6432Node\Microsoft\Symbol Server too, in case you are using a 32-bit debugger.
This issue will happen with cdb.exe and kd.exe, so I hope this solution helps someone.
I’m happy to announce the next 5-day virtual Windows Kernel Programming class to be held in October. The syllabus for the class can be found here. A notable addition to the class is an introduction to the Kernel Mode Driver Framework (KMDF).
Dates and Times (all in October 2022), times based on London: 11 (full day): 4pm to 12am 12 (full day): 4pm to 12am 13 (half day): 4pm to 8pm 17 (half day): 4pm to 8pm 18 (full day): 4pm to 12am 19 (half day): 4pm to 8pm 20 (half day): 4pm to 8pm
The class will be recorded and provided to the participants.
Cost: 900 USD if paid by an individual 1700 USD if paid by a company Previous participants of my classes get 10% off. Multiple participants from the same company get a discount as well (talk to me).
Registration To register, send email to [email protected] and provide the name(s) and email(s) of the participant(s), the company name (if any), and your time zone (for my information, although I cannot change course times).
Feel free to contact me for any questions or comments via email, twitter (@zodiacon) or Linkedin.
In the wake of recent hacking tool dumps, the FLARE team saw a spike
in malware samples detonating kernel shellcode. Although most samples
can be analyzed statically, the FLARE team sometimes debugs these
samples to confirm specific functionality. Debugging can be an
efficient way to get around packing or obfuscation and quickly
identify the structures, system routines, and processes that a kernel
shellcode sample is accessing.
This post begins a series centered on kernel software analysis, and
introduces a tool that uses a custom Windows kernel driver to load and
execute Windows kernel shellcode. I’ll walk through a brief case study
of some kernel shellcode, how to load shellcode with FLARE’s kernel
shellcode loader, how to build your own copy, and how it works.
As always, only analyze malware in a safe environment such as a VM;
never use tools such as a kernel shellcode loader on any system that
you rely on to get your work done.
A Tale of Square Pegs and Round Holes
Depending upon how a shellcode sample is encountered, the analyst
may not know whether it is meant to target user space or kernel space.
A common triage step is to load the sample in a shellcode loader and
debug it in user space. With kernel shellcode, this can have
unexpected results such as the access violation in Figure 1.
Figure 1: Access violation from shellcode
dereferencing null pointer
The kernel environment is a world apart from user mode: various
registers take on different meanings and point to totally different
structures. For instance, while the gs segment register in 64-bit
Windows user mode points to the Thread Information Block (TIB) whose
size is only 0x38 bytes, in kernel mode it points to the Processor
Control Region (KPCR) which is much larger. In Figure 1 at address
0x2e07d9, the shellcode is attempting to access the IdtBase member of
the KPCR, but because it is running in user mode, the value at offset
0x38 from the gs segment is null. This causes the next instruction to
attempt to access invalid memory in the NULL page. What the code is
trying to do doesn’t make sense in the user mode environment, and it
has crashed as a result.
In contrast, kernel mode is a perfect fit. Figure 2 shows WinDbg’s
dt command being used to display the _KPCR type defined within
ntoskrnl.pdb, highlighting the field at offset 0x38 named IdtBase.
Figure 2: KPCR structure
Given the rest of the code in this sample, accessing the IdtBase
field of the KPCR made perfect sense. Determining that this was kernel
shellcode allowed me to quickly resolve the rest of my questions, but
to confirm my findings, I wrote a kernel shellcode loader. Here’s what
it looks like to use this tool to load a small, do-nothing piece of shellcode.
Using FLARE’s Kernel Shellcode Loader
I booted a target system with a kernel debugger and opened an
administrative command prompt in the directory where I copied the
shellcode loader (kscldr.exe). The shellcode loader expects to receive
the name of the file on disk where the shellcode is located as its
only argument. Figure 3 shows an example where I’ve used a hex editor
to write the opcodes for the NOP (0x90) and RET (0xC3) instructions
into a binary file and invoked kscldr.exe to pass that code to the
kernel shellcode loader driver. I created my file using the Windows
port of xxd that comes with Vim for Windows.
Figure 3: Using kscldr.exe to load kernel shellcode
The shellcode loader prompts with a security warning. After clicking
yes, kscldr.exe installs its driver and uses it to execute the
shellcode. The system is frozen at this point because the kernel
driver has already issued its breakpoint and the kernel debugger is
awaiting commands. Figure 4 shows WinDbg hitting the breakpoint and
displaying the corresponding source code for kscldr.sys.
Figure 4: Breaking in kscldr.sys
From the breakpoint, I use WinDbg with source-level debugging to
step and trace into the shellcode buffer. Figure 5 shows WinDbg’s
disassembly of the buffer after doing this.
Figure 5: Tracing into and disassembling
the shellcode
The disassembly shows the 0x90 and 0xc3 opcodes from before,
demonstrating that the shellcode buffer is indeed being executed. From
here, the powerful facilities of WinDbg are available to debug and
analyze the code’s behavior.
Building It Yourself
To try out FLARE’s kernel shellcode loader for yourself, you’ll need
to download the
source code.
To get started building it, download and install the Windows
Driver Kit (WDK). I’m using Windows
Driver Kit Version 7.1.0, which is command line driven, whereas
more modern versions of the WDK integrate with Visual Studio. If you
feel comfortable using a newer kit, you’re welcomed to do so, but
beware, you’ll have to take matters into your own hands regarding
build commands and dependencies. Since WDK 7.1.0 is adequate for
purposes of this tool, that is the version I will describe in this post.
Once you have downloaded and installed the WDK, browse to the
Windows Driver Kits directory in the start menu on your development
system and select the appropriate environment. Figure 6 shows the WDK
program group on a Windows 7 system. The term “checked build”
indicates that debugging checks will be included. I plan to load
64-bit kernel shellcode, and I like having Windows catch my mistakes
early, so I’m using the x64 Checked Build Environment.
Figure 6: Windows Driver Kits program group
In the WDK command prompt, change to the directory where you
downloaded the FLARE kernel shellcode loader and type ez.cmd. The
script will cause prompts to appear asking you to supply and use a
password for a test signing certificate. Once the build completes,
visit the bin directory and copy kscldr.exe to your debug target.
Before you can commence using your custom copy of this tool, you’ll
need to follow just a few more steps to prepare the target system to
allow it.
Preparing the Debug Target
To debug kernel shellcode, I wrote a Windows software-only driver
that loads and runs shellcode at privilege level 0. Normally, Windows
only loads drivers that are signed with a special cross-certificate,
but Windows allows you to enable
testsigning to load drivers signed with a test certificate. We can
create this test certificate for free, and it won’t allow the driver
to be loaded on production systems, which is ideal.
In addition to enabling testsigning mode, it is necessary to enable
kernel debugging to be able to really follow what is happening after
the kernel shellcode gains execution. Starting with Windows Vista, we
can enable both testsigning and kernel debugging by issuing the
following two commands in an administrative command prompt followed by
a reboot:
bcdedit.exe /set testsigning
on
bcdedit.exe /set debug on
For debugging in a VM, I install VirtualKD, but you can also
follow your virtualization vendor’s directions for connecting a serial
port to a named pipe or other mechanism that WinDbg understands. Once
that is set up and tested, we’re ready to go!
If you try the shellcode loader and get a blue screen indicating
stop code 0x3B (SYSTEM_SERVICE_EXCEPTION), then you likely did not
successfully connect the kernel debugger beforehand. Remember that the
driver issues a software interrupt to give control to the debugger
immediately before executing the shellcode; if the debugger is not
successfully attached, Windows will blue screen. If this was the case,
reboot and try again, this time first confirming that the debugger is
in control by clicking Debug -> Break in WinDbg. Once
you know you have control, you can issue the g command to let
execution continue (you may need to disable driver load notifications
to get it to finish the boot process without further intervention: sxd ld).
How It Works
The user-space application (kscldr.exe) copies the driver from a
PE-COFF resource to the disk and registers it as a Windows kernel
service. The driver implements device write and I/O control routines
to allow interaction from the user application. Its driver entry point
first registers dispatch routines to handle CreateFile, WriteFile,
DeviceIoControl, and CloseHandle. It then creates a device named
\Device\kscldr and a symbolic link making the device name accessible
from user-space. When the user application opens the device file and
invokes WriteFile, the driver calls ExAllocatePoolWithTag specifying a
PoolType of NonPagedPool (which
is executable), and writes the buffer to the newly allocated
memory. After the write operation, the user application can call
DeviceIoControl to call into the shellcode. In response, the driver
sets the appropriate flags on the device object, issues a breakpoint
to pass control to the kernel debugger, and finally calls the
shellcode as if it were a function.
While You’re Here
Driver development opens the door to unique instrumentation
opportunities. For example, Figure 7 shows a few kernel callback
routines described in the WDK help files that can track system-wide
process, thread, and DLL activity.
Kernel development is a deep subject that entails a great deal of
study, but the WDK also comes with dozens upon dozens of sample
drivers that illustrate correct Windows kernel programming techniques.
This is a treasure trove of Windows internals information, security
research topics, and instrumentation possibilities. If you have time,
take a look around before you get back to work.
Wrap-Up
We’ve shared FLARE’s tool for loading privileged shellcode in test
environments so that we can dynamically analyze kernel shellcode. We
hope this provides a straightforward way to quickly triage kernel
shellcode if it ever appears in your environment. Download the source code now.
The term “Zombie Process” in Windows is not an official one, as far as I know. Regardless, I’ll define zombie process to be a process that has exited (for whatever reason), but at least one reference remains to the kernel process object (EPROCESS), so that the process object cannot be destroyed.
How can we recognize zombie processes? Is this even important? Let’s find out.
All kernel objects are reference counted. The reference count includes the handle count (the number of open handles to the object), and a “pointer count”, the number of kernel clients to the object that have incremented its reference count explicitly so the object is not destroyed prematurely if all handles to it are closed.
Process objects are managed within the kernel by the EPROCESS (undocumented) structure, that contains or points to everything about the process – its handle table, image name, access token, job (if any), threads, address space, etc. When a process is done executing, some aspects of the process get destroyed immediately. For example, all handles in its handle table are closed; its address space is destroyed. General properties of the process remain, however, some of which only have true meaning once a process dies, such as its exit code.
Process enumeration tools such as Task Manager or Process Explorer don’t show zombie processes, simply because the process enumeration APIs (EnumProcesses, Process32First/Process32Next, the native NtQuerySystemInformation, and WTSEnumerateProcesses) don’t return these – they only return processes that can still run code. The kernel debugger, on the other hand, shows all processes, zombie or not when you type something like !process 0 0. Identifying zombie processes is easy – their handle table and handle count is shown as zero. Here is one example:
Any kernel object referenced by the process object remains alive as well – such as a job (if the process is part of a job), and the process primary token (access token object). We can get more details about the process by passing the detail level “1” in the !process command:
Notice the address space does not exist anymore (VadRoot is zero). The VAD (Virtual Address Descriptors) is a data structure managed as a balanced binary search tree that describes the address space of a process – which parts are committed, which parts are reserved, etc. No address space exists anymore. Other details of the process are still there as they are direct members of the EPROCESS structure, such as the kernel and user time the process has used, its start and exit times (not shown in the debugger’s output above).
We can ask the debugger to show the reference count of any kernel object by using the generic !object command, to be followed by !trueref if there are handles open to the object:
Clearly, there is a single handle open to the process and that’s the only thing keeping it alive.
One other thing that remains is the unique process ID (shown as Cid in the above output). Process and thread IDs are generated by using a private handle table just for this purpose. This explains why process and thread IDs are always multiples of four, just like handles. In fact, the kernel treats PIDs and TIDs with the HANDLE type, rather with something like ULONG. Since there is a limit to the number of handles in a process (16711680, the reason is not described here), that’s also the limit for the number of process and threads that could exist on a system. This is a rather large number, so probably not an issue from a practical perspective, but zombie processes still keep their PIDs “taken”, so it cannot be reused. This means that in theory, some code can create millions of processes, terminate them all, but not close the handles it receives back, and eventually new processes could not be created anymore because PIDs (and TIDs) run out. I don’t know what would happen then
Here is a simple loop to do something like that by creating and destroying Notepad processes but keeping handles open:
WCHAR name[] = L"notepad";
STARTUPINFO si{ sizeof(si) };
PROCESS_INFORMATION pi;
int i = 0;
for (; i < 1000000; i++) {	// use 1 million as an example
	auto created = ::CreateProcess(nullptr, name, nullptr, nullptr,
        FALSE, 0, nullptr, nullptr, &si, &pi);
	if (!created)
		break;
	::TerminateProcess(pi.hProcess, 100);
	printf("Index: %6d PID: %u\n", i + 1, pi.dwProcessId);
	::CloseHandle(pi.hThread);
}
printf("Total: %d\n", i);
The code closes the handle to the first thread in the process, as keeping it alive would create “Zombie Threads”, much like zombie processes – threads that can no longer run any code, but still exist because at least one handle is keeping them alive.
How can we get a list of zombie processes on a system given that the “normal” tools for process enumeration don’t show them? One way of doing this is to enumerate all the process handles in the system, and check if the process pointed by that handle is truly alive by calling WaitForSingleObjecton the handle (of course the handle must first be duplicated into our process so it’s valid to use) with a timeout of zero – we don’t want to wait really. If the result is WAIT_OBJECT_0, this means the process object is signaled, meaning it exited – it’s no longer capable of running any code. I have incorporated that into my Object Explorer (ObjExp.exe) tool. Here is the basic code to get details for zombie processes (the code for enumerating handles is not shown but is available in the source code):
m_Items.clear();
m_Items.reserve(128);
std::unordered_map<DWORD, size_t> processes;
for (auto const& h : ObjectManager::EnumHandles2(L"Process")) {
	auto hDup = ObjectManager::DupHandle(
        (HANDLE)(ULONG_PTR)h->HandleValue , h->ProcessId,
        SYNCHRONIZE | PROCESS_QUERY_LIMITED_INFORMATION);
	if (hDup && WAIT_OBJECT_0 == ::WaitForSingleObject(hDup, 0)) {
		//
		// zombie process
		//
		auto pid = ::GetProcessId(hDup);
		if (pid) {
			auto it = processes.find(pid);
			ZombieProcess zp;
			auto& z = it == processes.end() ? zp : m_Items[it->second];
			z.Pid = pid;
			z.Handles.push_back({ h->HandleValue, h->ProcessId });
			WCHAR name[MAX_PATH];
			if (::GetProcessImageFileName(hDup,
                name, _countof(name))) {
				z.FullPath =
                    ProcessHelper::GetDosNameFromNtName(name);
				z.Name = wcsrchr(name, L'\\') + 1;
			}
			::GetProcessTimes(hDup,
                (PFILETIME)&z.CreateTime, (PFILETIME)&z.ExitTime,
                (PFILETIME)&z.KernelTime, (PFILETIME)&z.UserTime);
			::GetExitCodeProcess(hDup, &z.ExitCode);
			if (it == processes.end()) {
				m_Items.push_back(std::move(z));
				processes.insert({ pid, m_Items.size() - 1 });
			}
		}
	}
	if (hDup)
		::CloseHandle(hDup);
}
The data structure built for each process and stored in the m_Items vector is the following:
The ObjectManager::DupHandle function is not shown, but it basically calls DuplicateHandle for the process handle identified in some process. if that works, and the returned PID is non-zero, we can go do the work. Getting the process image name is done with GetProcessImageFileName– seems simple enough, but this function gets the NT name format of the executable (something like \Device\harddiskVolume3\Windows\System32\Notepad.exe), which is good enough if only the “short” final image name component is desired. if the full image path is needed in Win32 format (e.g. “c:\Windows\System32\notepad.exe”), it must be converted (ProcessHelper::GetDosNameFromNtName). You might be thinking that it would be far simpler to call QueryFullProcessImageName and get the Win32 name directly – but this does not work, and the function fails. Internally, the NtQueryInformationProcess native API is called with ProcessImageFileNameWin32 in the latter case, which fails if the process is a zombie one.
Running Object Explorer and selecting Zombie Processes from the System menu shows a list of all zombie processes (you should run it elevated for best results):
Object Explorer showing zombie processes
The above screenshot shows that many of the zombie processes are kept alive by GameManagerService.exe. This executable is from Razer running on my system. It definitely has a bug that keeps process handle alive way longer than needed. I’m not sure it would ever close these handles. Terminating this process will resolve the issue as the kernel closes all handles in a process handle table once the process terminates. This will allow all those processes that are held by that single handle to be freed from memory.
I plan to add Zombie Threads to Object Explorer – I wonder how many threads are being kept “alive” without good reason.
During the last few weeks I was busy exploring
the internal working of Handles under Windows , by disassembling and
decompiling certain kernel (ntoskrnl.exe) functions under my Windows 7
32-bit machine.In the current time I am preparing a paper to describe
and explain what I learned about Handles. But today I’m here to discuss
an interesting function pointer hook that I found while decompiling and
exploring the ObpCloseHandleEntry function. (Source codes below).
A
function pointer hook consists of overwriting a callback function
pointer so when a kernel routine will call the callback function, the
hook function will be called instead . The function pointer that we will
be hooking in this article is the OkayToCloseProcedure callback that exists in the _OBJECT_TYPE_INITIALIZER structure which is an element of the OBJECT_TYPE struct.
Every
object in Windows has an OBJECT_TYPE structure which specifies the
object type name , number of opened handles to this object type ...etc OBJECT_TYPE also stores a type info structure (_OBJECT_TYPE_INITIALIZER) that has a group of callback functions (OpenProcedure ,CloseProcedure…) . All OBJECT_TYPE structures pointers are stored in the unexported ObTypeIndexTable array.
As I said earlier , the OkayToCloseProcedure is called inside ObpCloseHandleEntry
function.In general this function (if the supplied handle is not
protected from being closed) frees the handle table entry , decrements
the object’s handle count and reference count.
Another case when the handle will not be closed is if the OkayToCloseProcedure returned 0 , in this case the ObpCloseHandleTableEntry returns STATUS_HANDLE_NOT_CLOSABLE.
I will discuss handles in more details in my future blog posts.
So how the OkayToCloseProcedure is called ?
ObpCloseHandleTableEntry function actually gets the Object (which the handle is opened to) header (_OBJECT_HEADER). A pointer to the object type structure (_OBJECT_TYPE) is then obtained by accessing the ObTypeIndexTable array using the Object Type Index from the object header (ObTypeIndexTable[ObjectHeader->TypeIndex]).
The function will access the OkayToCloseProcedure field and check if it’s NULL , if that’s true the function will proceed to other checks (check if the handle is protected from being closed). If the OkayToCloseProcedure
field isn’t NULL , the function will proceed to call the callback
function. If the callback function returns 0 the handle cannot be closed
and ObpCloseHandleTableEntry will return STATUS_HANDLE_NOT_CLOSABLE. If it returns a value other than 0 we will proceed to the other checks as it happens when the OkayToCloseProcedure is NULL.
An
additional point is that the OkayToCloseProcedure
must always run within the context of the process that opened the handle
in the first place (a call to KeStackAttachProcess). I don’t think that this would be a problem if ObpCloseHandleTableEntry is called as a result of calling ZwClose from usermode because we’ll be running in the context of the process that opened the handle.However, if ZwClose was called from kernel land and was supplied a kernel handle KeStackAttachProcess will attach the thread to the system process. The reason behind that is that we always want to access the right handle table (each process has a different handle table, and for the kernel we have the system handle table).
So if ObpCloseHandleTableEntry is called from another process context and is trying to close another process’s handle, the OkayToCloseProcedure must run in that process context. That’s why ObpCloseHandleTableEntry takes a pointer to the process object (owner of the handle) as a parameter.
Applying the hook :
Now
after we had a quick overview of what’s happening , let’s try and apply
the hook on the OBJECT_TYPE_INITIALIZER’s OkayToCloseProcedure field.
I applied the hook on the Process object type , we can obtain a pointer to the process object type by taking advantage of the exported PsProcessType , it’s actually a pointer to a pointer to the process’s object type.
Here’s a list containing the exported object types : POBJECT_TYPE *ExEventObjectType; POBJECT_TYPE *ExSemaphoreObjectType; POBJECT_TYPE *IoFileObjectType; POBJECT_TYPE *PsThreadType; POBJECT_TYPE *SeTokenObjectType; POBJECT_TYPE *PsProcessType; POBJECT_TYPE *TmEnlistmentObjectType; POBJECT_TYPE *TmResourceManagerObjectType; POBJECT_TYPE *TmTransactionManagerObjectType; POBJECT_TYPE *TmTransactionObjectType;
A second way to get an object’s type is by getting an existing object’s pointer and then pass it to the exported kernel function ObGetObjectType which will return a pointer to the object’s type.
A third way is to get a pointer to the ObTypeIndexTable array, it’s unexported by the kernel but there are multiple functions using it including the exported ObGetObjectType
function.So the address can be extracted from the function's opcodes ,
but that will introduce another compatibility problem. After getting the
pointer to the ObTypeIndexTable you'll have to walk through the
whole table and preform a string comparison to the target's object type
name ("Process","Thread" ...etc) against the Name field in each _OBJECT_TYPE structure.
In my case I hooked the Process object type , and I introduced in my code the 1st and the 2nd methods (second one commented).
My
hook isn’t executing any malicious code !! it’s just telling us (using
DbgPrint) that an attempt to close an open handle to a process was made.
“An
attempt” means that we’re not sure "yet" if the handle will be closed
or not because other checks are made after a successful call to the
callback.And by a successful call , I mean that the callback must return
a value different than 0 that’s why the hook function is returning 1. I
said earlier that the ObpCloseHandleTableEntry will proceed to check if the handle is protected from being closed (after returning from the callback) if the OkayToCloseProcedure
is null or if it exists and returns 1 , that's why it’s crucial that our
hook returns 1.One more thing , I’ve done a small check to see if the
object type’s OkayToCloseProcedure is already NULL before hooking it (avoiding issues).
Example :
For example when closing a handle to a process opened by OpenProcess a debug message will display the handle value and the process who opened the handle.
As you can see "TestOpenProcess.exe" just closed a handle "0x1c" to a process that it opened using OpenProcess().
CVE-2022-23253 is a Windows VPN (remote access service) denial of service vulnerability that Nettitude discovered while fuzzing the Windows Server Point-to-Point Tunnelling Protocol (PPTP) driver. The implications of this vulnerability are that it could be used to launch a persistent Denial of Service attack against a target server. The vulnerability requires no authentication to exploit and affects all default configurations of Windows Server VPN.
Nettitude has followed a coordinated disclosure process and reported the vulnerability to Microsoft. As a result the latest versions of MS Windows are now patched and no longer vulnerable to the issue.
Affected Versions of Microsoft Windows Server
The vulnerability affects most versions of Windows Server and Windows Desktop since Windows Server 2008 and Windows 7 respectively. To see a full list of affected windows versions check the official disclosure post on MSRC: https://msrc.microsoft.com/update-guide/vulnerability/CVE-2022-23253.
Overview
PPTP is a VPN protocol used to multiplex and forward virtual network data between a client and VPN server. The protocol has two parts, a TCP control connection and a GRE data connection. The TCP control connection is mainly responsible for the configuring of buffering and multiplexing for network data between the client and server. In order to talk to the control connection of a PPTP server, we only need to connect to the listening socket and initiate the protocol handshake. After that we are able to start a complete PPTP session with the server.
When fuzzing for vulnerabilities the first step is usually a case of waiting patiently for a crash to occur. In the case of fuzzing the PPTP implementation we had to wait a mere three minutes before our first reproducible crash!
Our first step was to analyse the crashing test case and minimise it to create a reliable proof of concept. However before we dissect the test case we need to understand what a few key parts of the control connection logic are trying to do!
The PPTP Handshake
PPTP implements a very simple control connection handshake procedure. All that is required is that a client first sends a StartControlConnectionRequest to the server and then receives a StartControlConnectionReply indicating that there were no issues and the control connection is ready to start processing commands. The actual contents of the StartControlConnectionRequest has no effect on the test case and just needs to be validly formed in order for the server to progress the connection state into being able to process the rest of the defined control connection frames. If you’re interested in what all these control packet frames are supposed to do or contain you can find details in the PPTP RFC (https://datatracker.ietf.org/doc/html/rfc2637).
PPTP IncomingCall Setup Procedure
In order to forward some network data to a PPTP VPN server the control connection needs to establish a virtual call with the server. There are two types of virtual call when communicating with a PPTP server, these are outgoing calls and incoming calls. To to communicate with a VPN server from a client we typically use the incoming call variety. Finally, to set up an incoming call from a client to a server, three control message types are used.
IncomingCallRequest – Used by the client to request a new incoming virtual call.
IncomingCallReply – Used by the server to indicate whether the virtual call is being accepted. It also sets up call ID’s for tracking the call (these ID’s are then used for multiplexing network data as well).
IncomingCallConnected – Used by the client to confirm connection of the virtual call and causes the server to fully initialise it ready for network data.
The most important bit of information exchanged during call setup is the call ID. This is the ID used by the client and server to send and receive data along that particular call. Once a call is set up data can then be sent to the GRE part of the PPTP connection using the call ID to identify the virtual call connection it belongs to.
The Test Case
After reducing the test case, we can see that at a high level the control message exchanges that cause the server to crash are as follows:
StartControlConnectionRequest() Client -> Server
StartControlConnectionReply() Server -> Client
IncomingCallRequest() Client -> Server
IncomingCallReply() Server -> Client
IncomingCallConnected() Client -> Server
IncomingCallConnected() Client -> Server
The test case appears to initially be very simple and actually mostly resembles what we would expect for a valid PPTP connection. The difference is the second IncomingCallConnected message. For some reason, upon receiving an IncomingCallConnected control message for a call ID that is already connected, a null pointer dereference is triggered causing a system crash to occur.
Let’s look at the crash and see if we can see why this relatively simple error causes such a large issue.
The Crash
Looking at the stack trace for the crash we get the following:
What’s interesting here is that we can see that the crash does not not take place in the raspptp.sys driver at all, but instead occurs in the ndis.sys driver. What is ndis.sys? Well, raspptp.sys in what is referred to as a mini-port driver, which means that it only actually implements a small part of the functionality required to implement an entire VPN interface and the rest of the VPN handling is actually performed by the NDIS driver system. raspptp.sys acts as a front end parser for PPTP which then forwards on the encapsulated virtual network frames to NDIS to be routed and handled by the rest of the Windows VPN back-end.
So why is this null pointer dereference happening? Let’s look at the code to see if we can glean any more detail.
The Code
The first section of code is in the PPTP control connection state machine. The first part of this handling is a small stub in a switch statement for handling the different control messages. For an IncomingCallConnected message, we can see that all the code initially does is check that a valid call ID and context structure exists on the server. If they do exist, a call is made to the CallEventCallInConnect function with the message payload and the call context structure.
case IncomingCallConnected:
    // Ensure the client has sent a valid StartControlConnectionRequest message
    if ( lpPptpCtlCx->CtlCurrentState == CtlStateWaitStop )
    {
        // BigEndian To LittleEndian Conversion
        CallIdSentInReply = (unsigned __int16)__ROR2__(lpCtlPayloadBuffer->IncomingCallConnected.PeersCallId, 8);
        if ( PptpClientSide ) // If we are the client
            CallIdSentInReply &= 0x3FFFu; // Maximum ID mask
            // Get the context structure for this call ID if it exists
            IncomingCallCallCtx = CallGetCall(lpPptpCtlCx->pPptpAdapterCtx, CallIdSentInReply);
            // Handle the incoming call connected event
            if ( IncomingCallCallCtx )
                CallEventCallInConnect(IncomingCallCallCtx, lpCtlPayloadBuffer);
The CallEventCallInConnect function performs two tasks; it activates the virtual call connection through a call to NdisMCmActivateVc and then if the returned status from that function is not STATUS_PENDING it calls the PptpCmActivateVcComplete function.
We can see that in reality, the NdisMCMActivateVc function is surprisingly simple. We know that it always returns 0 so there will always be a proceeding call to PptpCmActivateVcComplete by the CallEventCallInConnect function.
Looking at the stack trace we know that the crash is occurring at an offset of 0x2d into the NdisMCmActivateVc function which corresponds to the following line in our pseudo code:
Since NdisMCmActivateVc doesn’t sit in our main target driver, raspptp.sys, it’s mostly un-reverse engineered, but it’s pretty clear to see that the main purpose is to set some properties on a structure which is tracked as the handle to NDIS from raspptp.sys. Since this doesn’t really seem like it’s directly causing the issue we can safely ignore it for now. The particular variable lpCallParameters (also the CallParameters argument) is causing the null pointer dereference and is passed into the function by raspptp.sys; this indicates that the vulnerability must be occurring somewhere else in the raspptp.sys driver code.
Referring back to the call from CallEventCallInConnect we know that the CallParmaters argument is actually a pointer stored within the Call Context structure in raspptp.sys. We can assume that at some point in the call to PptpCmActivateVcComplete this structure is freed and the pointer member of the structure is set to zero. So lets find the responsible line!
void __fastcall PptpCmActivateVcComplete(unsigned int OutGoingCallReplyStatusCode, CtlCall *CallContext, PVOID CallParams)
{
    CtlCall *lpCallContext; // rdi
    ...
if ( lpCallContext->UnkownFlag )
{
    if ( lpCallParams )
        ExFreePoolWithTag((PVOID)lpCallContext->CallParams, 0);
        lpCallContext->CallParams = 0i64;
        ...
After a little bit of looking we can see the responsible sections of code. From reverse engineering the setup of the CallContext structure we know that the UnkownFlag structure variable is set to 1 by the handling of the IncomingCallRequest frame where the CallContext structure is initially allocated and setup. For our test case this code will always execute and thus the second call to CallEventCallInConnect will trigger a null pointer dereference and crash the machine in the NDIS layer, causing the appropriate Blue Screen Of Death to appear:
Proof Of Concept
We will release proof of concept code on May 2nd to allow extra time for systems administrators to patch.
The Windows Registry is one of the most recognized aspects of Windows. It’s a hierarchical database, storing information on a machine-wide basis and on a per-user basis… mostly. In this post, I’d like to examine the major parts of the Registry, including the “real” Registry.
Looking at the Registry is typically done by launching the built-in RegEdit.exe tool, which shows the five “hives” that seem to comprise the Registry:
RegEdit showing the main hives
These so-called “hives” provide some abstracted view of the information in the Registry. I’m saying “abstracted”, because not all of these are true hives. A true hive is stored in a file. The full hive list can be found in the Registry itself – at HKLM\SYSTEM\CurrentControlSet\Control\hivelist (I’ll abbreviate HKEY_LOCAL_MACHINE as HKLM), mapping an internal key name to the file where it’s stored (more on these “internal” key names will be discussed soon):
The hive list
Let’s examine the so-called “hives” as seen in the root RegEdit’s view.
HKEY_LOCAL_MACHINE is the simplest to understand. It contains machine-wide information, most of it stored in files (persistent). Some details related to hardware is built when the system initializes and is only kept in memory while the system is running. Such keys are volatile, since their contents disappear when the system is shut down. There are many interesting keys within HKLM, but my goal is not to go over every key (that would take a full book), but highlight a few useful pieces. HKLM\System\CurrentControlSet\Services is the key where all services and device drivers are installed. Note that “CurrentControlSet” is not a true key, but in fact is a link key, connecting it to something like HKLM\System\ControlSet001. The reason for this indirection is beyond the scope of this post. Regedit does not show this fact directly – there is no way to tell whether a key is a true key or just points to a different key. This is one reason I createdTotal Registry (formerly called Registry Explorer), that shows these kind of nuances:
The liked key seems to have a weird name starting with \REGISTRY\MACHINE\. We’ll get to that shortly.
Other subkeys of note under HKLM include SOFTWARE, where installed applications store their system-level information; SAM and SECURITY, where local security policy and local accounts information are managed. These two subkeys contents is not not visible – even administrators don’t get access – only the SYSTEM account is granted access. One way to see what’s in these keys is to use psexec from Sysinternals to launch RegEdit or TotalRegistry under the SYSTEM account. Here is a command you can run in an elevated command window that will launch RegEdit under the SYSTEM account (if you’re using RegEdit, close it first):
psexec -s -i -d RegEdit
The -s switch indicates the SYSTEM account. -i is critical as to run the process in the interactive session (the default would run it in session 0, where no interactive user will ever see it). The -d switch is optional, and simply returns control to the console while the process is running, rather than waiting for the process to terminate.
The other way to gain access to the SAM and SECURITY subkeys is to use the “Take Ownership” privilege (easy to do when the Permissions dialog is open), and transfer the ownership to an admin user – the owner can specify who can do what with an object, and allow itself full access. Obviously, this is not a good idea in general, as it weakens security.
The BCD00000000 subkey contains the Boot Configuration Data (BCD), normally accessed using the bcdedit.exe tool.
HKEY_USERS – this is the other hive that truly stores data. Its subkeys contain user profiles for all users that ever logged in locally to this machine. Each subkey’s name is a Security ID (SID), in its string representation:
HKEY_USERS
There are 3 well-known SIDs, representing the SYSTEM (S-1-5-18), LocalService (S-1-5-19), and NetworkService (S-1-5-20) accounts. These are the typical accounts used for running Windows Services. “Normal” users get ugly SIDs, such as the one shown – that’s my user’s local SID. You may be wondering what is that “_Classes” suffix in the second key. We’ll get to that as well.
HKEY_CURRENT_USER is a link key, pointing to the user’s subkey under HKEY_USERS running the current process. Obviously, the meaning of “current user” changes based on the process access token looking at the Registry.
HKEY_CLASSES_ROOT is the most curious of the keys. It’s not a “real” key in the sense that it’s not a hive – not stored in a file. It’s not a link key, either. This key is a “combination” of two keys: HKLM\Software\Classes and HKCU\Software\Classes. In other words, the information in HKEY_CLASSES_ROOT is coming from the machine hive first, but can be overridden by the current user’s hive. What information is there anyway? The first thing is shell-related information, such as file extensions and associations, and all other information normally used by Explorer.exe. The second thing is information related to the Component Object Model (COM). For example, the CLSID subkey holds COM class registration (GUIDs you can pass to CoCreateInstance to (potentially) create a COM object of that class). Looking at the CLSID subkey under HKLM\Software\Classes shows there are 8160 subkeys, or roughly 8160 COM classes registered on my system from HKLM:
HKLM\Software\Classes
Looking at the same key under HKEY_CURRENT_USER tells a different story:
HKCU\Software\Classes
Only 46 COM classes provide extra or overridden registrations. HKEY_CLASSES_ROOT combines both, and uses HKCU in case of a conflict (same key name). This explains the extra “_Classes” subkey within the HKEY_USERS key – it stores the per user stuff (in the file UsrClasses.dat in something like c:\Users\<username>\AppData\Local\Microsoft\Windows).
HKEY_CURRENT_CONFIG is a link to HKLM\SYSTEM\CurrentControlSet\Hardware\Profiles\Current
The list of “standard” hives (the hives accessible by official Windows APIs such as RegOpenKeyEx contains some more that are not shown by Regedit. They can be viewed by TotalReg if the option “Extra Hives” is selected in the View menu. At this time, however, the tool needs to be restarted for this change to take effect (I just didn’t get around to implementing the change dynamically, as it was low on my priority list). Here are all the hives accessible with the official Windows API:
All hives
I’ll let the interested reader to dig further into these “extra” hives. On of these hives deserves special mentioning – HKEY_PERFORMANCE_DATA – it was used in the pre Windows 2000 days as a way to access Performance Counters. Registry APIs had to be used at the time. Fortunately, starting from Windows 2000, a new dedicated API is provided to access Performance Counters (functions starting with Pdh* in <pdh.h>).
Is this it? Is this the entire Registry? Not quite. As you can see in TotalReg, there is a node called “Registry”, that tells yet another story. Internally, all Registry keys are rooted in a single key called REGISTRY. This is the only named Registry key. You can see it in the root of the Object Manager’s namespace with WinObjfrom Sysinternals:
WinObj from Sysinternals showing the Registry key object
Here is the object details in a Local Kernel debugger:
All other Registry keys are based off of that root key, the Configuration Manager (the kernel component in charge of the Registry) parses the remaining path as expected. This is the real Registry. The official Windows APIs cannot use this path format, but native APIs can. For example, using NtOpenKey (documented as ZwOpenKey in the Windows Driver Kit, as this is a system call) allows such access. This is how TotalReg is able to look at the real Registry.
Clearly, the normal user-mode APIs somehow map the “standard” hive path to the real Registry path. The simplest is the mapping of HKEY_LOCAL_MACHINE to \REGISTRY\MACHINE. Another simple one is HKEY_USERS mapped to \REGISTRY\USER. HKEY_CURRENT_USER is a bit more complex, and needs to be mapped to the per-user hive under \REGISTRY\USER. The most complex is our friend HKEY_CLASSES_ROOT – there is no simple mapping – the APIs have to check if there is per-user override or not, etc.
Lastly, it seems there are keys in the real Registry that cannot be reached from the standard Registry at all:
The real Registry
There is a key named “A” which seems inaccessible. This key is used for private keys in processes, very common in Universal Windows Application (UWP) processes, but can be used in other processes as well. They are not accessible generally, not even with kernel code – the Configuration Manager prevents it. You can verify their existence by searching for \Registry\A in tools like Process Explorer or TotalReg itself (by choosing Scan Key Handles from the Tools menu). Here is TotalReg, followed by Process Explorer:
TotalReg key handlesProcess Explorer key handles
Finally, the WC key is used for Windows Container, internally called Silos. A container (like the ones created by Docker) is an isolated instance of a user-mode OS, kind of like a lightweight virtual machine, but the kernel is not separate (as would be with a true VM), but is provided by the host. Silos are very interesting, but outside the scope of this post.
Briefly, there are two main Silo types: An Application Silo, which is not a true container, and mostly used with application based on the Desktop Bridge technology. A classic example is WinDbg Preview. The second type is Server Silo, which is a true container. A true container must have its file system, Registry, and Object Manager namespace virtualized. This is exactly the role of the WC subkeys – provide the private Registry keys for containers. The Configuration Manager (as well as other parts of the kernel) are Silo-aware, and will redirect Registry calls to the correct subkey, having no effect on the Host Registry or the private Registry of other Silos.
You can examine some aspects of silos with the kernel debugger !silo command. Here is an example from a server 2022 running a Server Silo and the Registry keys under WC:
There you have it. The relatively simple-looking Registry shown in RegEdit is viewed differently by the kernel. Device driver writers find this out relatively early – they cannot use the “abstractions” provided by user mode even if these are sometimes convenient.
My schedule has been a mess in recent months, and continues to be so for the next few months. However, I am opening registration today for the Windows Internals training with some date changes from my initial plan.
Here are the dates and times (all based on London time) – 5 days total:
July 6: 4pm to 12am (full day)
July 7: 4pm to 8pm
July 11: 4pm to 12am (full day)
July 12, 13, 14, 18, 19: 4pm to 8pm
Training cost is 800 USD, if paid by an individual, or 1500 USD if paid by a company. Participants from Ukraine (please provide some proof) are welcome with a 90% discount (paying 80 USD, individual payments only).
If you’d like to register, please send me an email to [email protected] with “Windows Internals training” in the title, provide your full name, company (if any), preferred contact email, and your time zone. The basic syllabus can be found here. if you’ve sent me an email before when I posted about my upcoming classes, you don’t have to do that again – I will send full details soon.
The sessions will be recorded, so can watch any part you may be missing, or that may be somewhat overwhelming in “real time”.
It’s time for the season finale. In this post we explore several bypasses but also look at some mistakes made along the way.
1. From zero to hero: a quick recap
As promised in part 8, I spent some time converting the application to disable Driver Signature Enforcement (DSE) into a Beacon Object File (BOF) and adding in some extras, such as string obfuscation to hide very common string patterns like registry keys and constants from network inspection. I also changed some of the parameters to work with user input via CobaltWhispers instead of hardcoded values and replaced some notorious WIN32 API functions with their Windows Native API counterparts.
Once this was done, I started debugging the BOF and testing the full attack chain:
starting with the EarlyBird injector being executed as Administrator
disabling DSE using the BOF
deploying the Interceptor driver to cripple EDR/AV
running Mimikatz via Beacon.
The full attack is demonstrated below:
2. A BOF a day, keeps the doctor away
With my internship coming to an end, I decided to focus on Quality of Life updates for the InterceptorCLI as well as convert it into a Beacon Object File (BOF) in addition to the DisableDSE BOF, so that all the components may be executed in memory via Beacon.
The first big improvement is to rework the commands to be more intuitive and convenient. It’s now possible to provide multiple values to a command, making it much easier to patch multiple callbacks. Even if that’s too much manual labour, the -patch module command will take care of all callbacks associated with the provided drivers.
Next, I added support for vendor recognition and vendor based actions. The vendors and their associated driver modules are taken from SadProcessor’s Invoke-EDRCheck.ps1 and expanded by myself with modules I’ve come across during the internship. It’s now possible to automatically detect different EDR modules present on a target system and take action by automatically patching them using the -patch vendor command. An overview of all supported vendors can be obtained using the -list vendors command.
Finally, I converted the InterceptCLI client into a Beacon Object File (BOF), enhanced with direct syscalls and integrated in my CobaltWhispers framework.
3. Bigger fish to fry
With $vendor2 defeated, it’s also time to move on to more advanced testing. Thus far, I’ve only tested against consumer-grade Anti-Virus products and not enterprise EDR/AV platforms. I spent some time setting up and playing with $EDR-vendor1 and $EDR-vendor2.
To my surprise, once I had loaded the Interceptor driver, $EDR-vendor2 would detect a new driver has been loaded, most likely using ImageLoad callbacks, and refresh its own modules to restore protection and undo any potential tampering. Subsequently, any I/O requests to Interceptor are blocked by $EDR-vendor2 resulting in a "Access denied" message. The current version of InterceptorCLI makes use of various WIN32 API calls, including DeviceIoControl() to contact Interceptor. I suspect $EDR-vendor2 uses a minifilter to inspect and block I/O requests rather than relying on user land hooks, but I’ve yet to confirm this.
Contrary to $EDR-vendor2, I ran into issues getting $EDR-vendor1 to work properly with the $EDR-vendor1 platform and generate alerts, so I moved on to testing against $vendor3 and $EDR-vendor3. My main testing goal is the Interceptor driver itself and its ability to hinder the EDR/AV. The method of delivering and installing the driver is less relevant.
Initially, after patching all the callbacks associated with $vendor3, my EarlyBird-injector-spawned process would crash, resulting in no Beacon callback. The cause of the crash is klflt.sys, which I assume is $vendor3’s filesystem minifilter or at least part of it. I haven’t pinpointed the exact reason of the crash, but I suspect it is related to handle access rights.
When restoring klflt.sys callbacks, EarlyBird is executed and Beacon calls back successfully. However, after a notable delay, Beacon is detected and removed. Apart from detection upon execution, my EarlyBird injector is also flagged when scanned. I’ve used the same compiled version of my injector for several weeks against several different vendors, combined with other monitoring software like ProcessHacker2, it’s possible samples have been submitted and analyzed by different sandboxes.
In an attempt to get around klflt.sys, I decided to try a different injection approach and stick to my own process.
These 6 lines of primitive shellcode injection were successful in bypassing klflt.sys and executing Beacon.
4. Rookie mistakes
When I started my tests against $EDR-vendor3, the first thing that happened wasn’t alarms and sirens going off, it was a good old bluescreen. During my kernel callbacks patching journey, I never considered the possibility of faulty offset calculations. The code responsible for calculating offsets just happily adds up the addresses with the located offset and returns the result without any verification. This had worked fine on my Windows 10 build 19042 test machine, but failed on the $EDR-vendor3 machine which is a Windows 10 build 18362.
If we look at the kernel base address 0xfffff807'81400000, we can expect the address of the kernel callback arrays to be in the same range as the first 8 most significant bits (0xfffff807).
However, comparing the debug output to the expected address, we can note that the return address (callback array address) 0xfffff808'81903ba0 differs from the expected return address 0xfffff807'81903ba0 by a value of 0x100000000 or compared to the kernel base address 0x100503ba0. The 8 most significant bits don’t match up.
The calculated offset we’re working with in this case is 0xffdab4f7. Following the original code, we add 0xffdab4f7 + 0x7 + 0xfffff80781b586a2 which yields the callback array address. This is where the issue resides. OffsetAddr is a ULONG64, in other words "unsigned long long" which comes down to 0x00000000'00000000 when initialized to 0; When the memcpy() instruction copies over the offset address bytes, the result becomes 0x00000000'ffdab4f7. To quickly solve this problem, I changed OffsetAddr to a LONG and added a function to verify the address calculation against the kernel base address.
ULONG64 VerifyOffsets(LONG OffsetAddr, ULONG64 InstructionAddr) {
	ULONG64 ReturnAddr = OffsetAddr + 7 + InstructionAddr;
	ULONG64 KernelBaseAddr = GetKernelBaseAddress();
	if (KernelBaseAddr != 0) {
		if (ReturnAddr - KernelBaseAddr > 0x1000000) {
			KdPrint((DRIVER_PREFIX "Mismatch between kernel base address and expected return address: %llx\n", ReturnAddr - KernelBaseAddr));
			return 0;
		}
		return ReturnAddr;
	}
	else {
		KdPrint((DRIVER_PREFIX "Unable to get kernel base address\n"));
		return 0;
	}
}
5. Final round
As expected, $EDR-vendor3 is a big step up from the regular consumer grade anti-virus products I’ve tested against thus far and the loader I’ve been using during this series doesn’t cut it anymore. Right around the time I started my tests I came across a tweet from @an0n_r0 discussing a semi-successful $EDR-vendor3 bypass, so I used this as base for my new stage 0 loader.
The loader is based on the simple remote code injection pattern using the VirtualAllocEx, WriteProcessMemory, VirtualProtectEx and CreateRemoteThread WIN32 APIs.
I also incorporated dynamic function imports using hashed function names and CIG to protect the spawned suspended process against injection of non-Microsoft-signed binaries.
Last but not least, I incorporated the Sleep_Mask directive in my Cobalt Strike Malleable C2 profile. This tells Cobalt Strike to obfuscate Beacon in memory before it goes to sleep by means of an XOR encryption routine.
The loader was able to execute Beacon undetected and with the help of my kernel driver running Mimikatz was but a click of the button.
On that bombshell, it’s time to end this internship and I think I can conclude that while having a kernel driver to tamper with EDR/AV is certainly useful, a majority of the detection mechanisms are still present in user land or are driven by signatures and rules for static detection.
6. Conclusion
During this Kernel Karnage series, I developed a kernel driver from scratch, accompanied by several different loaders, with the goal to effectively tamper with EDR/AV solutions to allow execution of common known tools which would otherwise be detected immediately. While there certainly are several factors limiting the deployment and application of a kernel driver (such as DSE, HVCI, Secure Boot), it turns out to be quite powerful in combination with user land evasion techniques and manages to address the AI/ML component of EDR/AV which would otherwise require a great deal of obfuscation and anti-sandboxing.
About the author
Sander is a junior consultant and part of NVISO’s red team. He has a passion for malware development and enjoys any low-level programming or stumbling through a debugger. When Sander is not lost in 1s and 0s, you can find him traveling around Europe and Asia. You can reach Sander on LinkedIn or Twitter.
With this blog post I’d like to sum up my year-long Windows Drivers research; share and detail my own methodology for reverse engineering (WDM) Windows drivers, finding some possible vulnerable code paths as well as understanding their exploitability. I’ve tried to make it as “noob-friendly” as possible, documenting all the steps I usually perform during […]
This blog post serves as an advisory for a couple of MSI’s products that are affected by multiple high-severity vulnerabilities in the driver components they are shipped with. All the vulnerabilities are triggered by sending specific IOCTL requests and will allow to: Directly interact with physical memory via the MmMapIoSpace function call, mapping physical memory […]
As part of my continuous security research journey, during this year I’ve spent a good amount of time reverse-engineering Windows drivers and exploiting kernel-mode related vulnerabilities. While in the past there were (as far as I know), at least two good IDA plugins aiding in the reverse engineering process: DriverBuddy of NCC Group. win_driver_plugin of […]
I am announcing the next 5 day Windows Internals remote training to be held in January 2022, starting on the 24th according to the followng schedule:
Jan 24 – 2pm to 10pm (all times are based on London time)
Jan 25, 26, 27 – 2pm to 6pm
Jan 31 – 2pm to 10pm
Feb 1, 2, 3 – 2pm to 6pm
The syllabus can be found here (slight changes are possible if new important topics come up).
Cost and Registration
I’m keeping the cost of these training classes relatively low. This is to make these classes accessible to more people, especially in these unusual and challenging times.
Cost: 800 USD if paid by an individual, 1500 USD if paid by a company. Multiple participants from the same company are entitled to a discount (email me for the details). Previous students of my classes are entitled to a 10% discount.
To register, send an email to [email protected] and specify “Windows Internals Training” in the title. The email should include your name, contact email, time zone, and company name (if any).
Last week SentinelOne disclosed a “high severity” flaw in HP, Samsung, and Xerox printer’s drivers (CVE-2021-3438); the blog post highlighted a vulnerable strncpy operation with a user-controllable size parameter but it did not explain the reverse engineering nor the exploitation phase of the issue. With this blog post, I would like to analyse the vulnerability […]
Today I’m announcing the next public remote Windows Kernel Programming training. This is a 5-day training scheduled for October: 4, 5, 7, 11, 13. Times: 12pm to 8pm, London Time.
The syllabus can be found here. It may be slightly modified by the time the class starts, but not by much. This is a development-heavy course, so be prepared to write lots of code!
Cost: 800 USD if paid by an individual, 1500 USD if paid by a company. Previous participants of the my classes get 10% discount. Multiple participants from the same company are entitled to a discount (email me for the details).
To register, send an email to [email protected] and specify “Windows Kernel Programming Training” in the title. The email should include your name, preferred email for communication, and company name (if any).
The training sessions will be recorded and provided to the participants.
Please read carefully the pre-requisites for this class. You should especially be comfortable coding in C (any C++ used in the class will be explained). In case of any doubt, talk to me. If you have any questions, feel free to shoot me an email, or DM me on twitter (@zodiacon) or Linkedin (https://www.linkedin.com/in/pavely/).
At the beginning of the month, Sentinel One disclosed five high severity vulnerabilities in Dell’s firmware update driver. As the described vulnerability appeared not too complicated to exploit, a lot of fellow security researchers started weaponizing it. I was one of, if not the first tweeting about weaponizing it into a _SEP_TOKEN_PRIVILEGES overwrite exploit, and […]
While teaching a Windows Internals class recently, I came across a situation which looked like a bug to me, but turned out to be something I didn’t know about – dynamic symbolic links.
Symbolic links are Windows kernel objects that point to another object. The weird situation in question was when running WinObj from Sysinternals and navigating to the KenrelObjects object manager directory.
WinObj from Sysinternals
You’ll notice some symbolic link objects that look weird: MemoryErrors, PhysicalMemoryChange, HighMemoryCondition, LowMemoryCondition and a few others. The weird thing that is fairly obvious is that these symbolic link objects have empty targets. Double-clicking any one of them confirms no target, and also shows a curious zero handles, as well as quota change of zero:
Symbolic link properties
To add to the confusion, searching for any of them with Process Explorer yields something like this:
It seems these objects are events, and not symbolic links!
My first instinct was that there is a bug in WinObj (I rewrote it recently for Sysinternals, so was certain I introduced a bug). I ran an old WinObj version, but the result was the same. I tried other tools with similar functionality, and still got the same results. Maybe a bug in Process Explorer? Let’s see in the kernel debugger:
Definitely an event and not a symbolic link. What’s going on? I debugged it in WinObj, and indeed the reported object type is a symbolic link. Maybe it’s a bug in the NtQueryDirectoryObject used to query a directory object for an object.
I asked Mark Russinovich, could there be a bug in Windows? Mark remembered that this is not a bug, but a feature of symbolic links, where objects can be created/resolved dynamically when accessing the symbolic link. Let’s see if we can see something in the debugger:
Clearly, there is target, but notice the flags value 0x10. This is the flag indicating the symbolic link is a dynamic one. To get further information, we need to look at the object with a “symbolic link lenses” by using the data structure the kernel uses to represent symbolic links:
The Callback member shows the function that is being called (MiResolveMemoryEvent) that “resolves” the symbolic link to the relevant event. There are currently 11 such events, their names visible with the following:


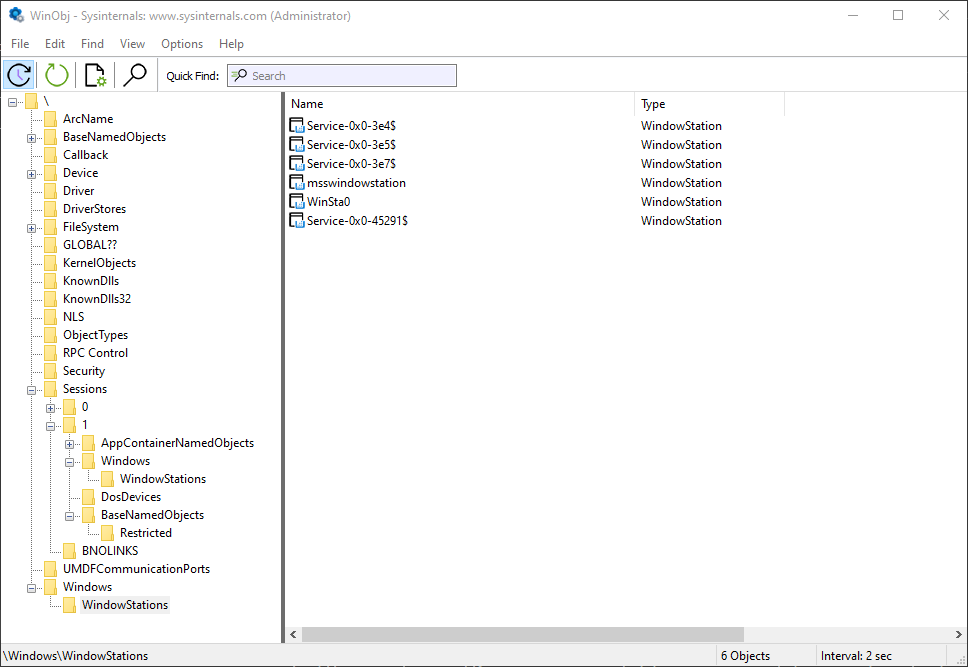
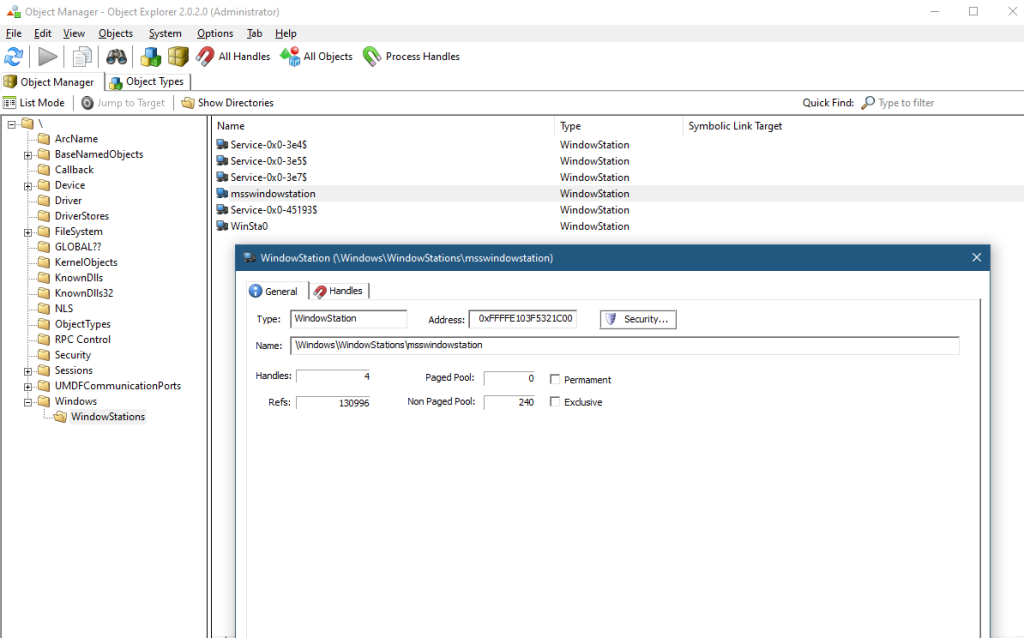


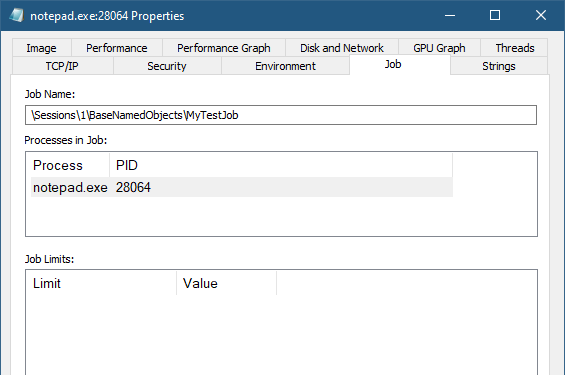


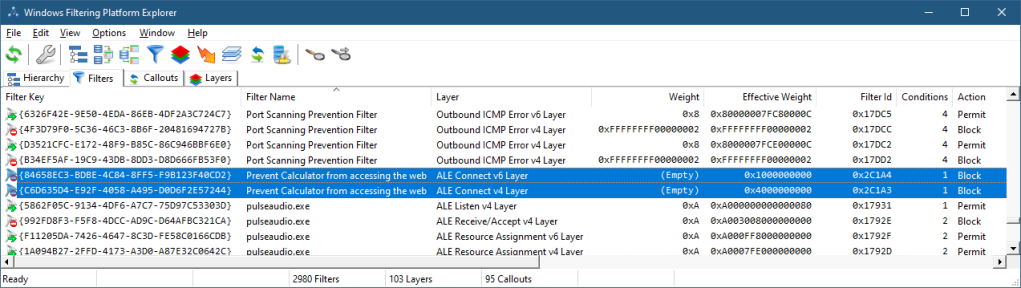


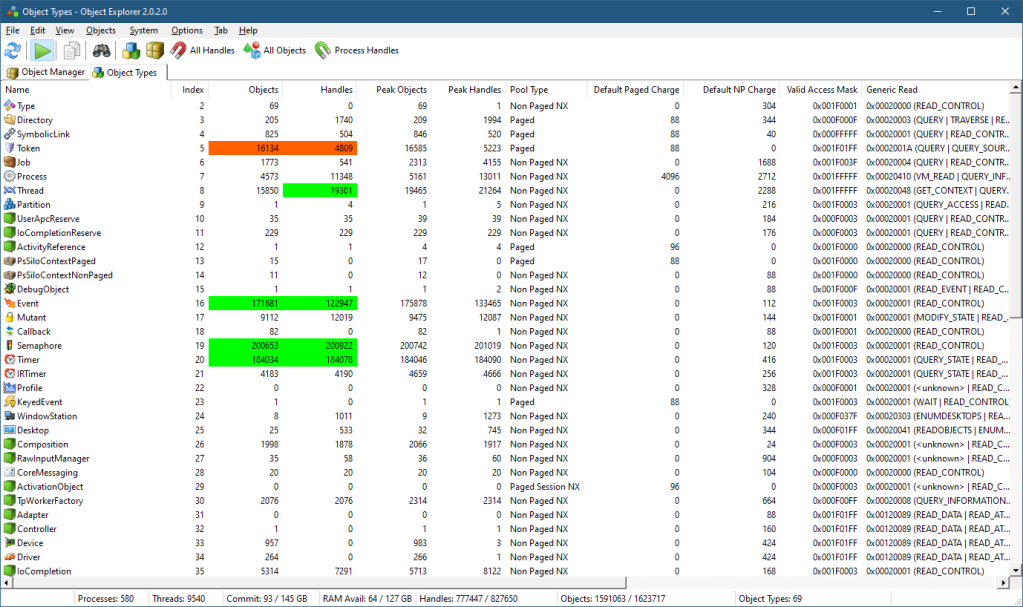


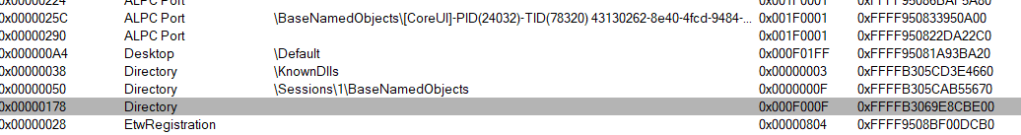

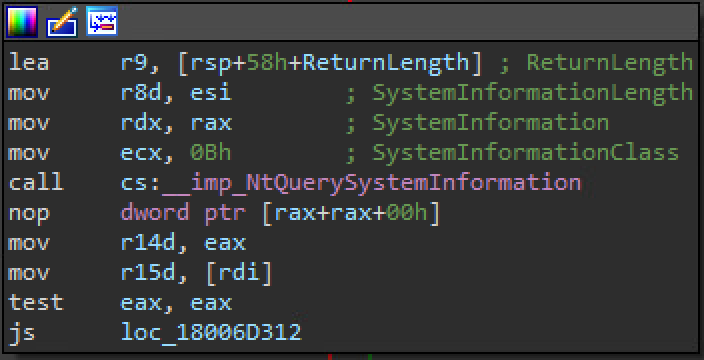


