How Visual Studio debugs containerized apps
Recently, I was looking into the internals of the Visual Studio debugger for the .NET Diagnostics Expert course. I was especially interested in how the Docker debugging works. For those of you who haven’t tried it yet, let me provide a concise description.
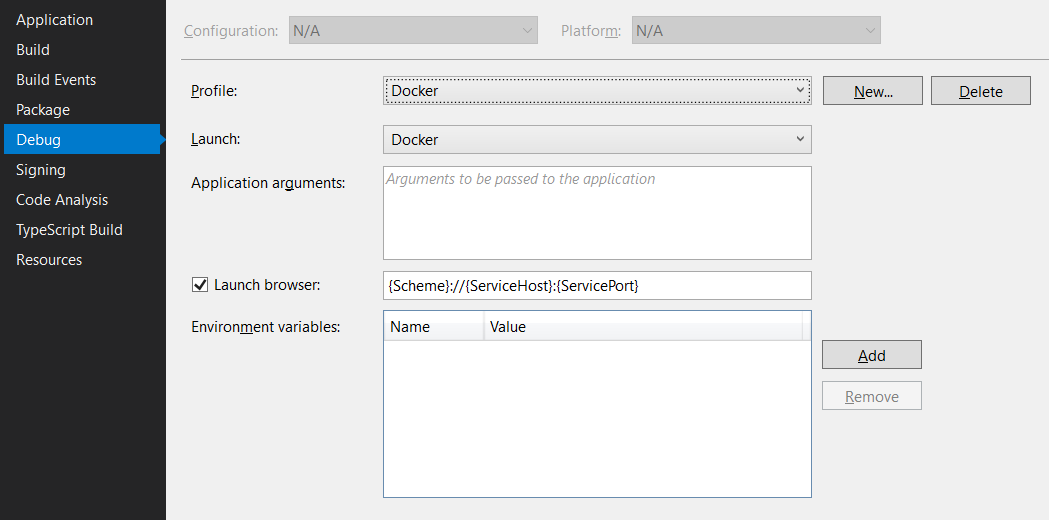
In Visual Studio 2019, when we work on the ASP.NET Core project, it is possible to create a launch profile that points to a Docker container, for example:
And that’s fantastic as we can launch the container directly from Visual Studio. And what’s even better, we can debug it! To make this all work, Visual Studio requires a Dockerfile in the root project folder. The default Dockerfile (which you can create in the ASP.NET Core application wizard) looks as follows:
FROM mcr.microsoft.com/dotnet/core/aspnet:3.1-buster-slim AS base
WORKDIR /app
EXPOSE 80
EXPOSE 443

FROM mcr.microsoft.com/dotnet/core/sdk:3.1-buster AS build
WORKDIR /src
COPY ["WebApplication1.csproj", ""]
RUN dotnet restore "./WebApplication1.csproj"
COPY . .
WORKDIR "/src/."
RUN dotnet build "WebApplication1.csproj" -c Release -o /app/build

FROM build AS publish
RUN dotnet publish "WebApplication1.csproj" -c Release -o /app/publish

FROM base AS final
WORKDIR /app
COPY --from=publish /app/publish .
ENTRYPOINT ["dotnet", "WebApplication1.dll"]
And that’s it. If we press F5, we land inside an application container, and we can step through our application’s code. It all looks like magic, but as usual, there are protocols and lines of code that run this machinery behind the magical facade. And in this post, we will take a sneak peek at them ![]() .
.
But before we dive in, I need to mention the doc describing how Visual Studio builds containerized apps. It is an excellent read which explains, among many other things, how the debugger binaries land in the docker container and what differences are between Debug and Release builds. This post will focus only on the debugger bits, so please read the doc to have the full picture.
Let’s collect some traces
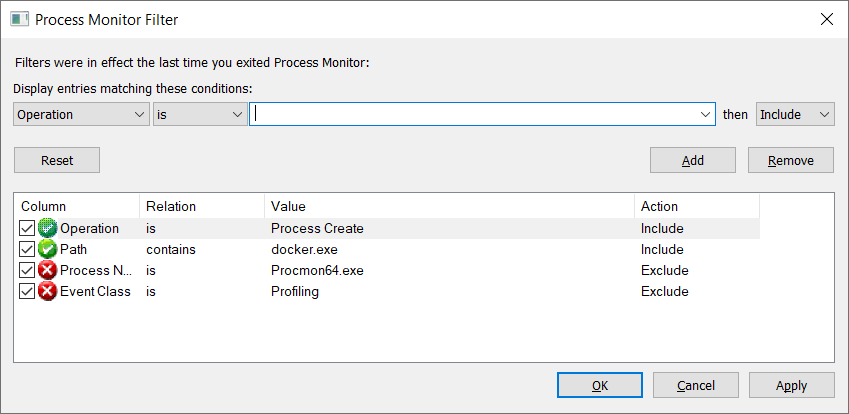
When I don’t know how things work, I use Process Monitor. In this case, I started the Process Monitor trace, moved back to Visual Studio, and pressed F5. Once the debugger launched, I stopped the trace and started the analysis. In the process tree (Ctrl + T), it was evident that Visual Studio uses the docker.exe client to interact with the Docker containers. I created a filter for the Operation and Path as on the image below:
With these filters in place, I was able to pick the events emitted when a parent process (in our case, Visual Studio and MSBuild) created each of the docker.exe instances:

And I had not only command-line arguments but also the call stacks! Let’s first have a look at the command lines:
"docker" ps --filter "status=running" --filter "id=4a2383dc1a410c425110cd924af9b826d9c50d577eff25d730bc07912f914331" --no-trunc --format {{.ID}} -n 1
"docker" exec -i 4a2383dc1a410c425110cd924af9b826d9c50d577eff25d730bc07912f914331 /bin/sh -c "if PID=$(pidof dotnet); then kill $PID; fi"
"docker" build -f "C:\Users\me\source\repos\WebApplication1\Dockerfile" --force-rm -t webapplication1  --label "com.microsoft.created-by=visual-studio" --label "com.microsoft.visual-studio.project-name=WebApplication1" "C:\Users\me\source\repos\WebApplication1"
"docker" images -a --filter "reference=webapplication1" --no-trunc --format {{.ID}}
"docker" images --filter "dangling=false" --format "{{json .}}" --digests
"docker" rm -f 4a2383dc1a410c425110cd924af9b826d9c50d577eff25d730bc07912f914331
"docker" run -dt -v "C:\Users\me\vsdbg\vs2017u5:/remote_debugger:rw" -v "C:\Users\me\AppData\Roaming\Microsoft\UserSecrets:/root/.microsoft/usersecrets:ro" -v "C:\Users\me\AppData\Roaming\ASP.NET\Https:/root/.aspnet/https:ro" -e "ASPNETCORE_URLS=https://+:443;http://+:80" -e "ASPNETCORE_ENVIRONMENT=Development" -e "ASPNETCORE_LOGGING__CONSOLE__DISABLECOLORS=true" -P --name WebApplication1 --entrypoint tail webapplication1 -f /dev/null
"docker" ps --all --format "{{.ID}}"
"docker" inspect --format="{{json .NetworkSettings.Ports}}" 019e9c646683350457a7ee1d30c85b7675a2bab28dc10ead6f851f6eb3963c43
"docker" inspect "019e9c646683"
"docker" exec -i 019e9c646683350457a7ee1d30c85b7675a2bab28dc10ead6f851f6eb3963c43 /bin/sh -c "ID=.; if [ -e /etc/os-release ]; then . /etc/os-release; fi; if [ $ID = alpine ] && [ -e /remote_debugger/linux-musl-x64/vsdbg ]; then VSDBGPATH=/remote_debugger/linux-musl-x64; else VSDBGPATH=/remote_debugger; fi; $VSDBGPATH/vsdbg --interpreter=vscode"
"docker" inspect --format="{{json .NetworkSettings.Ports}}" 019e9c646683350457a7ee1d30c85b7675a2bab28dc10ead6f851f6eb3963c43
We can see that MSBuild disposes the previous container during the build and then creates a new one (docker run). However, what interests us most, regarding our investigation, is the docker exec command. It creates an interactive debugger session in the Docker container. As a side note, notice that the debugger binaries were copied to my home folder (C:\Users\me\vsdbg) – it could be interesting to investigate how they landed there ![]() . But moving back to our trace, we can see that we have a running ASP.NET Core app container, and there is an interactive debugging session attached to it. But we still don’t know how Visual Studio communicates with the debugger running in the interactive session. At first, I started looking for some hidden named pipes and WSL API, but couldn’t find anything. Thus, I decided I need to have a more in-depth look at the Visual Studio debugger engine.
. But moving back to our trace, we can see that we have a running ASP.NET Core app container, and there is an interactive debugging session attached to it. But we still don’t know how Visual Studio communicates with the debugger running in the interactive session. At first, I started looking for some hidden named pipes and WSL API, but couldn’t find anything. Thus, I decided I need to have a more in-depth look at the Visual Studio debugger engine.
As the “docker exec” event came from Visual Studio, it could be the debugger engine that fired the command. So, I copied the call stack from the properties window for this event and looked at the frames (I stripped the unimportant ones):
"Frame","Module","Location","Address","Path"
"0","ntoskrnl.exe","PspCallProcessNotifyRoutines + 0x213","0xfffff8028583759f","C:\WINDOWS\system32\ntoskrnl.exe"
...
"18","KERNELBASE.dll","CreateProcessW + 0x2c","0x7646da2c","C:\WINDOWS\SysWOW64\KERNELBASE.dll"
"19","System.ni.dll","System.ni.dll + 0x23cc02","0x7252cc02","C:\WINDOWS\assembly\NativeImages_v4.0.30319_32\System\a94f452eecde0f07e988ad14497426a5\System.ni.dll"
"20","System.ni.dll","System.ni.dll + 0x1aaaa4","0x7249aaa4","C:\WINDOWS\assembly\NativeImages_v4.0.30319_32\System\a94f452eecde0f07e988ad14497426a5\System.ni.dll"
"21","System.ni.dll","System.ni.dll + 0x1aa39c","0x7249a39c","C:\WINDOWS\assembly\NativeImages_v4.0.30319_32\System\a94f452eecde0f07e988ad14497426a5\System.ni.dll"
"22","<unknown>","0x23e037ad","0x23e037ad",""
"23","<unknown>","0x23e035f8","0x23e035f8",""
"24","<unknown>","0x23e03438","0x23e03438",""
"25","<unknown>","0x23e03223","0x23e03223",""
"26","<unknown>","0x23e0168e","0x23e0168e",""
"27","<unknown>","0x23e0153c","0x23e0153c",""
"28","<unknown>","0x23e0009b","0x23e0009b",""
"29","<unknown>","0x2394e5f7","0x2394e5f7",""
"30","<unknown>","0x2394e54d","0x2394e54d",""
"31","<unknown>","0x2394e460","0x2394e460",""
"32","clr.dll","COMToCLRDispatchHelper + 0x28","0x745bf3c1","C:\Windows\Microsoft.NET\Framework\v4.0.30319\clr.dll"
"33","<unknown>","0x328d060","0x328d060",""
"34","vsdebug.dll","DllGetClassObject + 0x2072e","0x7bc84352","C:\Program Files (x86)\Microsoft Visual Studio\2019\Community\Common7\Packages\Debugger\vsdebug.dll"
...
"60","devenv.exe","IsAssertEtwEnabled + 0x12474","0x123d24","C:\Program Files (x86)\Microsoft Visual Studio\2019\Community\Common7\IDE\devenv.exe"
"61","KERNEL32.DLL","BaseThreadInitThunk + 0x19","0x75dafa29","C:\WINDOWS\SysWOW64\KERNEL32.DLL"
"62","ntdll.dll","__RtlUserThreadStart + 0x2f","0x770175f4","C:\WINDOWS\SysWOW64\ntdll.dll"
"63","ntdll.dll","_RtlUserThreadStart + 0x1b","0x770175c4","C:\WINDOWS\SysWOW64\ntdll.dll"
Time to reverse
Unfortunately, Process Monitor does not understand managed stacks (displays them as <unknown>), but, on the bright side, that also means that Visual Studio debugger is a .NET application. Nevertheless, I needed to create a memory dump of the Visual Studio process and manually decode the managed frames. The WinDbg output for the first <unknown> frame looked as follows:
0:000> !ip2md 0x23e037ad
MethodDesc:   23da1038
Method Name:  Microsoft.VisualStudio.Debugger.VSCodeDebuggerHost.AD7.Implementation.LocalTargetInterop+LocalProcessWrapper..ctor(System.String, System.String)
Class:        23dc22ec
MethodTable:  23da10b0
mdToken:      06000b66
Module:       20e3642c
IsJitted:     yes
CodeAddr:     23e03618
Transparency: Critical

0:000> !DumpMT /d 23da10b0
EEClass:         23dc22ec
Module:          20e3642c
Name:            Microsoft.VisualStudio.Debugger.VSCodeDebuggerHost.AD7.Implementation.LocalTargetInterop+LocalProcessWrapper
mdToken:         020001cf
File:            c:\program files (x86)\microsoft visual studio\2019\community\common7\ide\extensions\ahdlch2w.npb\Microsoft.VisualStudio.Debugger.VSCodeDebuggerHost.dll
BaseSize:        0x14
ComponentSize:   0x0
Slots in VTable: 16
Number of IFaces in IFaceMap: 1
And the first frame already revealed the place where Visual Studio keeps the debugger assemblies. It was time to fire up ILSpy and indulge myself in some reversing ![]() . Quite soon, I discovered that the Visual Studio engine communicates with the container debugger using the Debug Adapter Protocol. And interestingly, the communication happens over the process standard input/output. That explains the interactive docker session! With all the pieces matching, it was time to prove that everything is working the way I think it is.
. Quite soon, I discovered that the Visual Studio engine communicates with the container debugger using the Debug Adapter Protocol. And interestingly, the communication happens over the process standard input/output. That explains the interactive docker session! With all the pieces matching, it was time to prove that everything is working the way I think it is.
Sniffing the debugger channel
At first, I started looking for some sniffers of the process input/output but couldn’t find any (let me know if you know such tools). Then I experimented with breakpoints in WinDbg, but it proved to be hard to find the right handle and then extract the exchanged bytes. Finally, I decided to write my own sniffer and replace the docker.exe process with it. After a few trials (it seems that Console.StandardInput.ReadAsync is a blocking call), I ended up with the following code:
class Program
{
    static void Main(string[] args)
    {
        var psi = new ProcessStartInfo(Path.Combine(AppContext.BaseDirectory, "docker.bak.exe")) {
            RedirectStandardError = true,
            RedirectStandardInput = true,
            RedirectStandardOutput = true,
            UseShellExecute = false
        };
        Array.ForEach(args, arg => psi.ArgumentList.Add(arg));

        var proc = Process.Start(psi);
        if (proc == null)
        {
            Console.WriteLine("Error starting a process");
            return;
        }

        Console.CancelKeyPress += (o, ev) => { ev.Cancel = true; proc.Kill(); };

        var baseLogName = Path.Combine(Directory.CreateDirectory("d:\\temp\\docker-proxy").FullName, $"{proc.Id}");
        using (var s = File.CreateText(baseLogName))
        {
            s.WriteLine($"{psi.FileName} '{String.Join("', '", psi.ArgumentList)}'");
        }
        using var inlogstream = File.Create(baseLogName + ".in");
        using var outlogstream = File.Create(baseLogName + ".out");
        using var errlogstream = File.Create(baseLogName + ".err");

        using var cts = new CancellationTokenSource();
        using var instream = Console.OpenStandardInput();
        using var outstream = Console.OpenStandardOutput();
        using var errstream = Console.OpenStandardError();

        var forwarders = new[] {
            ForwardStream(instream, proc.StandardInput.BaseStream, inlogstream, cts.Token),
            ForwardStream(proc.StandardOutput.BaseStream, outstream, outlogstream, cts.Token),
            ForwardStream(proc.StandardError.BaseStream, errstream, errlogstream, cts.Token)
        };

        proc.WaitForExit();

        cts.Cancel();
        Task.WaitAny(forwarders);
    }

    static async Task ForwardStream(Stream instream, Stream outstream, Stream logstream, CancellationToken ct)
    {
        var b = new byte[4096];
        var inmem = new Memory<byte>(b, 0, b.Length);
        while (!ct.IsCancellationRequested)
        {
            int bytesread = await instream.ReadAsync(inmem, ct);
            if (bytesread == 0 || ct.IsCancellationRequested)
            {
                return;
            }
            var outmem = new ReadOnlyMemory<byte>(b, 0, bytesread);
            await logstream.WriteAsync(outmem, ct);
            await outstream.WriteAsync(outmem, ct);
            await outstream.FlushAsync();
        }
    }
}
As you can see, for each docker.exe launch, I’m creating four files:
- {pid} with a command line
- {pid}.in with the bytes from the standard input (I am forwarding them to the target process)
- {pid}.err with the bytes from the error output of the target process (I am pushing them on the sniffer error output)
- {pid}.out with the bytes from the standard output of the target process (I am pushing them on the sniffer’s standard output)
Then, I build a single assembly of my sniffer (thanks .NET 5.0!):
dotnet publish -r win-x64 -p:PublishSingleFile=true -p:PublishTrimmed=true -p:IncludeNativeLibrariesForSelfExtract=true --self-contained true
And copied it to c:\ProgramData\DockerDesktop\version-bin. Then I renamed the docker.exe shortcut in this folder to docker.bak.exe and my sniffer to docker.exe. I launched Visual Studio debugger, and soon in the d:\temp\docker-proxy folder, logs from multiple docker sessions started appearing. And one of the sessions was the debugger one! ![]()
Below, you may find two first messages from the .in and .out files arranged in the correct order:
Content-Length: 514

{"type":"request","command":"initialize","arguments":{"pathFormat":"path","clientID":"visualstudio","clientName":"Visual Studio","adapterID":"coreclr","locale":"en-US","linesStartAt1":true,"columnsStartAt1":true,"supportsVariableType":true,"supportsRunInTerminalRequest":true,"supportsMemoryReferences":true,"supportsProgressReporting":true,"SupportsMessageBox":true,"supportsHandshakeRequest":true,"supportsVsAdditionalBreakpointBinds":true,"supportsHitCountsChange":true,"supportsVsCustomMessages":true},"seq":1}
Content-Length: 1835

{"seq":0,"type":"response","request_seq":1,"success":true,"command":"initialize","body":{"supportsConfigurationDoneRequest":true,"supportsFunctionBreakpoints":true,"supportsConditionalBreakpoints":true,"supportsHitConditionalBreakpoints":true,"supportsEvaluateForHovers":true,"exceptionBreakpointFilters":[{"filter":"all","label":"All Exceptions","default":false},{"filter":"user-unhandled","label":"User-Unhandled Exceptions","default":true}],"supportsSetVariable":true,"supportsGotoTargetsRequest":true,"supportsModulesRequest":true,"additionalModuleColumns":[{"attributeName":"vsLoadAddress","label":"Load Address","type":"string"},{"attributeName":"vsPreferredLoadAddress","label":"Preferred Load Address","type":"string"},{"attributeName":"vsModuleSize","label":"Module Size","type":"number"},{"attributeName":"vsLoadOrder","label":"Order","type":"number"},{"attributeName":"vsTimestampUTC","label":"Timestamp","type":"unixTimestampUTC"},{"attributeName":"vsIs64Bit","label":"64-bit","type":"boolean"},{"attributeName":"vsAppDomain","label":"AppDomain","type":"string"},{"attributeName":"vsAppDomainId","label":"AppDomainId","type":"number"}],"supportedChecksumAlgorithms":["MD5","SHA1","SHA256"],"supportsExceptionOptions":true,"supportsValueFormattingOptions":true,"supportsExceptionInfoRequest":true,"supportTerminateDebuggee":true,"supportsSetExpression":true,"supportsReadMemoryRequest":true,"supportsCancelRequest":true,"supportsExceptionConditions":true,"supportsLoadSymbolsRequest":true,"supportsModuleSymbolSearchLog":true,"supportsDebuggerProperties":true,"supportsSetSymbolOptions":true,"supportsHitBreakpointIds":true,"supportsVsIndividualBreakpointOperations":true,"supportsSetHitCount":true,"supportsVsCustomMessages":true,"supportsEvaluationOptions":true,"supportsExceptionStackTrace":true,"supportsObjectId":true}}
Content-Length: 520

{"type":"request","command":"launch","arguments":{"name":".Net Core Launch","type":"coreclr","request":"launch","program":"dotnet","args":"--additionalProbingPath /root/.nuget/fallbackpackages2 --additionalProbingPath /root/.nuget/fallbackpackages  \"WebApplication1.dll\"","cwd":"/app","symbolOptions":{"cachePath":"/remote_debugger/symbols"},"env":{"ASPNETCORE_HTTPS_PORT":"49189"},"targetOutputLogPath":"/dev/console","projectFullPath":"C:\\Users\\me\\source\\repos\\WebApplication1\\WebApplication1.csproj"},"seq":2}
Content-Length: 117

{"seq":1,"type":"request","command":"handshake","arguments":{"value":"hQV{redacted}2Y="}}
![]()