Multiple vulnerabilities in RIOT OS
7 May 2024 at 07:28
“Where there is parsing, there are […]
The post Multiple vulnerabilities in RIOT OS appeared first on hn security.
“Where there is parsing, there are […]
The post Multiple vulnerabilities in RIOT OS appeared first on hn security.
In late 2023 and early 2024, the NCC Group Hardware and Embedded Systems practice undertook an engagement to reverse engineer baseband firmware on several smartphones. This included MediaTek 5G baseband firmware based on the nanoMIPS architecture. While we were aware of some nanoMIPS modules for Ghidra having been developed in private, there was no publicly available reliable option for us to use at the time, which led us to develop our own nanoMIPS disassembler and decompiler module for Ghidra.
In the interest of time, we focused on implementing the features and instructions that we encountered on actual baseband firmware, and left complex P-Code instruction emulation unimplemented where it was not yet needed. Though the module is a work in progress, it still decompiles the majority of the baseband firmware we’ve analyzed. Combined with debug symbol information included with some MediaTek firmware, it has been very helpful in the reverse engineering process.
Here we will demonstrate how to load a MediaTek baseband firmware into Ghidra for analysis with our nanoMIPS ISA module.
For an example firmware to analyze, we looked up phones likely to include a MediaTek SoC with 5G support. Some relatively recent Motorola models were good candidates. (These devices were not part of our client engagement.)
We found many Android firmware images on https://mirrors.lolinet.com/firmware/lenomola/, including an image for the Motorola Moto Edge 2022, codename Tesla: https://mirrors.lolinet.com/firmware/lenomola/tesla/official/. This model is based on a MediaTek Dimensity 1050 (MT6879) SoC.
There are some carrier-specific variations of the firmware. We’ll randomly choose XT2205-1_TESLA_TMO_12_S2ST32.71-118-4-2-6_subsidy-TMO_UNI_RSU_QCOM_regulatory-DEFAULT_cid50_R1_CFC.xml.zip.
The actual nanoMIPS firmware is in the md1img.img file from the Zip package.
To extract the content of the md1img file we also wrote some Kaitai structure definitions with simple Python wrapper scripts to run the structure parsing and output different sections to individual files. The ksy Kaitai definitions can also be used to interactively explore these files with the Kaitai IDE.
Running md1_extract.py with an --outdir option will extract the files contained within md1img.img:
$ ./md1_extract.py ../XT2205-1_TESLA_TMO_12_S2STS32.71-118-4-2-6-3_subsidy-TMO_UNI_RSU_QCOM_regulatory-DEFAULT_cid50_CFC/md1img.img --outdir ./md1img_out/
extracting files to: ./md1img_out
md1rom: addr=0x00000000, size=43084864
        extracted to 000_md1rom
cert1md: addr=0x12345678, size=1781
        extracted to 001_cert1md
cert2: addr=0x12345678, size=988
        extracted to 002_cert2
md1drdi: addr=0x00000000, size=12289536
        extracted to 003_md1drdi
cert1md: addr=0x12345678, size=1781
        extracted to 004_cert1md
cert2: addr=0x12345678, size=988
        extracted to 005_cert2
md1dsp: addr=0x00000000, size=6776460
        extracted to 006_md1dsp
cert1md: addr=0x12345678, size=1781
        extracted to 007_cert1md
cert2: addr=0x12345678, size=988
        extracted to 008_cert2
md1_filter: addr=0xffffffff, size=300
        extracted to 009_md1_filter
md1_filter_PLS_PS_ONLY: addr=0xffffffff, size=300
        extracted to 010_md1_filter_PLS_PS_ONLY
md1_filter_1_Moderate: addr=0xffffffff, size=300
        extracted to 011_md1_filter_1_Moderate
md1_filter_2_Standard: addr=0xffffffff, size=300
        extracted to 012_md1_filter_2_Standard
md1_filter_3_Slim: addr=0xffffffff, size=300
        extracted to 013_md1_filter_3_Slim
md1_filter_4_UltraSlim: addr=0xffffffff, size=300
        extracted to 014_md1_filter_4_UltraSlim
md1_filter_LowPowerMonitor: addr=0xffffffff, size=300
        extracted to 015_md1_filter_LowPowerMonitor
md1_emfilter: addr=0xffffffff, size=2252
        extracted to 016_md1_emfilter
md1_dbginfodsp: addr=0xffffffff, size=1635062
        extracted to 017_md1_dbginfodsp
md1_dbginfo: addr=0xffffffff, size=1332720
        extracted to 018_md1_dbginfo
md1_mddbmeta: addr=0xffffffff, size=899538
        extracted to 019_md1_mddbmeta
md1_mddbmetaodb: addr=0xffffffff, size=562654
        extracted to 020_md1_mddbmetaodb
md1_mddb: addr=0xffffffff, size=12280622
        extracted to 021_md1_mddb
md1_mdmlayout: addr=0xffffffff, size=8341403
        extracted to 022_md1_mdmlayout
md1_file_map: addr=0xffffffff, size=889
        extracted to 023_md1_file_map
The most relevant files are:
md1rom is the nanoMIPS firmware imagemd1_file_map provides slightly more context on the md1_dbginfo file: its original filename is DbgInfo_NR16.R2.MT6879.TC2.PR1.SP_LENOVO_S0MP1_K6879V1_64_MT6879_NR16_TC2_PR1_SP_V17_P38_03_24_03R_2023_05_19_22_31.xzmd1_dbginfo is an XZ compressed binary file containing debug information for md1rom, including symbolsmd1_dbginfo is another binary file format containing symbols and filenames with associated addresses. We’ll rename it and decompress it based on the filename from md1_file_map:
$ cp 018_md1_dbginfo DbgInfo_NR16.R2.MT6879.TC2.PR1.SP_LENOVO_S0MP1_K6879V1_64_MT6879_NR16_TC2_PR1_SP_V17_P38_03_24_03R_2023_05_19_22_31.xz
$ unxz DbgInfo_NR16.R2.MT6879.TC2.PR1.SP_LENOVO_S0MP1_K6879V1_64_MT6879_NR16_TC2_PR1_SP_V17_P38_03_24_03R_2023_05_19_22_31.xz
$ hexdump DbgInfo_NR16.R2.MT6879.TC2.PR1.SP_LENOVO_S0MP1_K6879V1_64_MT6879_NR16_TC2_PR1_SP_V17_P38_03_24_03R_2023_05_19_22_31 | head
00000000  43 41 54 49 43 54 4e 52  01 00 00 00 98 34 56 00  |CATICTNR.....4V.|
00000010  43 41 54 49 01 00 00 00  00 00 00 00 4e 52 31 36  |CATI........NR16|
00000020  2e 52 32 2e 4d 54 36 38  37 39 2e 54 43 32 2e 50  |.R2.MT6879.TC2.P|
00000030  52 31 2e 53 50 00 4d 54  36 38 37 39 5f 53 30 30  |R1.SP.MT6879_S00|
00000040  00 4d 54 36 38 37 39 5f  4e 52 31 36 2e 54 43 32  |.MT6879_NR16.TC2|
00000050  2e 50 52 31 2e 53 50 2e  56 31 37 2e 50 33 38 2e  |.PR1.SP.V17.P38.|
00000060  30 33 2e 32 34 2e 30 33  52 00 32 30 32 33 2f 30  |03.24.03R.2023/0|
00000070  35 2f 31 39 20 32 32 3a  33 31 00 73 00 00 00 2b  |5/19 22:31.s...+|
00000080  ed 53 00 49 4e 54 5f 56  65 63 74 6f 72 73 00 4c  |.S.INT_Vectors.L|
00000090  08 00 00 54 08 00 00 62  72 6f 6d 5f 65 78 74 5f  |...T...brom_ext_|
To extract information from the debug info file, we made another Kaitai definition and wrapper script that extracts symbols and outputs them in a text format compatible with Ghidra’s ImportSymbolsScript.py script:
$ ./mtk_dbg_extract.py md1img_out/DbgInfo_NR16.R2.MT6879.TC2.PR1.SP_LENOVO_S0MP1_K6879V1_64_MT6879_NR16_TC2_PR1_SP_V17_P38_03_24_03R_2023_05_19_22_31 | tee dbg_symbols.txt
INT_Vectors 0x0000084c l
brom_ext_main 0x00000860 l
INT_SetPLL_Gen98 0x00000866 l
PLL_Set_CLK_To_26M 0x000009a2 l
PLL_MD_Pll_Init 0x000009da l
INT_SetPLL 0x000009dc l
INT_Initialize_Phase1 0x027b5c80 l
INT_Initialize_Phase2 0x027b617c l
init_cm 0x027b6384 l
init_cm_wt 0x027b641e l
...
(Currently the script is set to only output label definitions rather than function definitions, as it was unknown if all of the symbols were for functions.)
First, we’ll have to install the nanoMIPS module for Ghidra. In the main Ghidra window, go to “File > Install Extensions”, click the “Add Extension” plus button, and select the module Zip file (e.g., ghidra_11.0.3_PUBLIC_20240424_nanomips.zip). Then restart Ghidra.
Load md1rom as a raw binary image. Select 000_md1rom from the md1img.img extract directory and keep “Raw Binary” as the format. For Language, click the “Browse” ellipsis and find the little endian 32-bit nanoMIPS option (nanomips:LE:32:default) using the filter, then click OK.
We’ll load the image at offset 0 so no further options are necessary. Click OK again to load the raw binary.
When Ghidra asks if you want to do an initial auto-analysis, select No. We have to set up a mirrored memory address space at 0x90000000 first.
Open the “Memory Map” window and click plus for “Add Memory Block”.
We’ll name the new block “mirror”, set the starting address to ram:90000000, the length to match the length of the base image “ram” block (0x2916c40), permissions to read and execute, and the “Block Type” to “Byte Mapped” with a source address of 0 and mapping ratio of 1:1.
Also change the permissions for the original “ram” block to just read and execute. Save the memory map changes and close the “Memory Map” window.
Note that this memory map is incomplete; it’s just the minimal setup required to get disassembly working.
Next, we’ll load up the debug symbols. Open the Script Manager window and search for ImportSymbolsScript.py. Run the script and select the text file generated by mtk_dbg_extract.py earlier (dbg_symbols.txt). This will create a bunch of labels, most of them in the mirrored address space.
Now we can begin disassembly. There is a jump instruction at address 0 that will get us started, so just select the byte at address 0 and press “d” or right-click and choose “Disassemble”. Thanks to the debug symbols, you may notice this instruction jumps to the INT_Initialize_Phase1 function.
Flow-based disassembly will now start to discover a bunch of code. The initial disassembly can take several minutes to complete.
Then we can run the normal auto-analysis with “Analysis > Auto Analyze…”. This should also discover more code and spend several minutes in disassembly and decompilation. We’ve found that the “Non-Returning Functions” analyzer creates many false positives with the default configuration in these firmware images, which disrupts the code flow, so we recommend disabling it for initial analysis.
The one-shot “Decompiler Parameter ID” analyzer is a good option to run next for better detection of function input types.
Although the module is still a work in progress, the results are already quite useable for analysis and allowed to us to reverse engineer some critical features in baseband processors.
The nanoMIPS Ghidra module and MediaTek binary file unpackers can be found on our GitHub at:
In this unique talk, Proofpoint’s Greg Lesnewich takes us on a tour of recent North Korean APTs targeting macOS devices and offers researchers new techniques for hunting this increasingly active cluster through similarity analysis of Mach-O binaries and linked dynamic libraries.
While many state-aligned threats have dipped their toes into macOS Malware, North Korea has invested serious time and effort into compromising Apple’s desktop operating system. Its operations in macOS environments include both espionage and financial gain. macOS malware analysis is an exciting space, but most blogs on the subject deal with functionality and capability, rather than how to find more similar samples. Analysts are forced to rely on string searching, based on disassembler output or a strings dump; in contrast, executables for Windows have “easy” pivots such as import hashing or rich headers that help analysts to find additional samples without much effort.
This talk introduces some of those easy pivots for Mach-O files, using North Korean samples as an initial case study; along the way, Greg takes us on a tour of the North Korean clusters using Mach-O samples, how those clusters intersect, how their families relate to one another, and shows how some simple pivots can link a group’s families together.
Greg Lesnewich is senior threat researcher at Proofpoint, working on tracking malicious activity linked to the DPRK (North Korea). Greg has a background in threat intelligence, incident response, and managed detection, and previously built a threat intelligence program for a Fortune 50 financial organization.
This presentation was featured live at LABScon 2023, an immersive 3-day conference bringing together the world’s top cybersecurity minds, hosted by SentinelOne’s research arm, SentinelLabs.
Keep up with all the latest on LABScon 2024 here.
![]()
By Ben Siraphob
During my time as a Trail of Bits associate last summer, I worked on optimizing the performance of Echidna, Trail of Bits’ open-source smart contract fuzzer, written in Haskell. Through extensive use of profilers and other tools, I was able to pinpoint and debug a massive space leak in one of Echidna’s dependencies, hevm. Now that this problem has been fixed, Echidna and hevm can both expect to use several gigabytes less memory on some test cases compared to before.
In this blog post, I’ll show how I used profiling to identify this deep performance issue in hevm and how we fixed it, improving Echidna’s performance.
Suppose we are keeping track of a fixed supply pool. Users can transfer tokens among themselves or burn tokens as needed. A desirable property of this pool might be that supply never grows; it only stays the same or decreases as tokens are transferred or burned. How might we go about ensuring this property holds? We can try to write up some test scenarios or try to prove it by hand… or we can fuzz the code with Echidna!
How Echidna works
Echidna takes in smart contracts and assertions about their behavior that should always be true, both written in Solidity. Then, using information extracted from the contracts themselves, such as method names and constants, Echidna starts generating random transaction sequences and replaying them over the contracts. It keeps generating longer and new sequences from old ones, such as by splitting them up at random points or changing the parameters in the method calls.
How do we know that these generations of random sequences are covering enough of the code to eventually find a bug? Echidna uses coverage-guided fuzzing—that is, it keeps track of how much code is actually executed from the smart contract and prioritizes sequences that reach more code in order to create new ones. Once it finds a transaction sequence that violates our desired property, Echidna then proceeds to shrink it to try to minimize it. Echidna then dumps all the information into a file for further inspection.
The Glasgow Haskell Compiler (GHC) provides various tools and flags that programmers can use to understand performance at various levels of granularity. Here are two:
+RTS -s to a profiled Haskell program makes it show runtime statistics. It’s more coarse than profiling, showing only aggregate statistics about the program, such as total bytes allocated in the heap or bytes copied during garbage collection. After enabling profiling, one can also use the -hT option, which breaks down the heap usage by closure type.Both of these options can produce human- and machine-readable output for further inspection. For instance, when we compile a program with profiling, we can output JSON that can be displayed in a flamegraph viewer like speedscope. This makes it easy to browse around the data and zoom in to relevant time slices. For runtime statistics, we can use eventlog2html to visualize the heap profile.
Looking at the flamegraph below and others like it led me to conclude that at least from an initial survey, Echidna wasn’t terribly bloated in terms of its memory usage. Indeed, various changes over time have targeted performance directly. (In fact, a Trail of Bits wintern from 2022 found performance issues with its coverage, which were then fixed.) However, notice the large blue regions? That’s hevm, which Echidna uses to evaluate the candidate sequences. Given that Echidna spends the vast majority of its fuzzing time on this task, it makes sense that hevm would take up a lot of computational power. That’s when I turned my attention to looking into performance issues with hevm.
The time use of functions and call stacks in Echidna
Profiling is useful, and it helped me find a bug in hevm whose fix led to improved performance in Echidna (which we get to in the next section), but you should also know that it can be misleading.
For example, while profiling hevm, I noticed something unusual. Various optics-related operators (getters and setters) were dominating CPU time and allocations. How could this be? The reason was that the optics library was not properly inlining some of its operators. As a result, if you run this code with profiling enabled, you would see that the % operator takes up the vast majority of allocations and time instead of the increment function, which is actually doing the computation. This isn’t observed when running an optimized binary though, since GHC must have decided to inline the operator anyway. I wrote up this issue in detail and it helped the optics library developers close an issue that was opened last year! This little aside made me realize that I should compile programs with and without profiling enabled going forward to ensure that profiling stays faithful to real-world usage.
Consider the following program. It repeatedly hashes a number, starting with 0, and writes the hashes somewhere in memory (up to address m). It does this n times.
contract A {
  mapping (uint256 => uint256) public map;
  function myFunction(uint256 n, uint256 m) public {
    uint256 h = 0;
    for (uint i = 0; i
What should we expect the program to do as we vary the value of n and m? If we hold m fixed and continue increasing the value of n, the memory block up to m should be completely filled. So we should expect that no more memory would be used. This is visualized below:
Holding m fixed and increasing n should eventually fill up m.
Surprisingly, this is not what I observed. The memory used by hevm went up linearly as a function of n and m. So, for some reason, hevm continued to allocate memory even though it should have been reusing it. In fact, this program used so much memory that it could use hundreds of gigabytes of RAM. I wrote up the issue here.
A graph showing allocations growing rapidly
I figured that if this memory issue affects hevm, it would surely affect Echidna as well.
Don't just measure once, measure N times!
Profiling gives you data about time and space for a single run, but that isn't enough to understand what happens as the program runs longer. For example, if you profiled Python’s insertionSort function on arrays with lengths of less than length 20, you might conclude that it's faster than quickSort when asymptotically we know that's not the case.
Similarly, I had some intuition about how "expensive" (from hevm's viewpoint) different Ethereum programs would be, but I didn’t know for sure until I measured the performance of smart contracts running on the EVM. Here's a brief overview of what smart contracts can do and how they interact with the EVM.
I wrote up eight simple smart contracts that would stress these various components. The underlying commonality between all of them is that they were parameterized with a number (n) and are expected to have a linear runtime with respect to that number. Any nonlinear runtime changes would thus indicate outliers. These are the contracts and what they do:
simple_loop: Looping and adding numbersprimes: Calculation and storage of prime numbershashes: Repeated hashinghashmem: Repeated hashing and storagebalanceTransfer: Repeated transferring of 1 wei to an addressfuncCall: Repeated function callscontractCreation: Repeated contract creationscontractCreationMem: Repeated contract creations and memoryYou can find their full source code in this file.
I profiled these contracts to collect information on how they perform with a wide range of n values. I increased n by powers of 2 so that the effects would be more noticeable early on. Here's what I saw:
![]()
I immediately noticed that something was definitely going on with the hashes and hashmem test cases. If the contracts’ runtimes increased linearly with increases to n, the hashes and hashmem lines wouldn't have crossed the others. How might we try to prove that? Since we know that each point should increase by roughly double (ignoring a constant term), we can simply plot the ratios of the runtimes from one point to the next and draw a line indicating what we should expect.
![]()
Bingo. hashes and hashmem were clearly off the baseline. I then directed my efforts toward profiling those specific examples and looking at any code that they depend on. After additional profiling, it seemed that repeatedly splicing and resplicing immutable bytearrays (to simulate how writes would work in a contract) caused the bytearray-related memory type to explode in size. In essence, hevm was not properly discarding the old versions of the memory.
The fix was conceptually simple and, fortunately, had already been proposed months previously by my manager, Artur Cygan. First, we changed how hevm handles the state in EVM computations:
- type EVM a = State VM a
+ type EVM s a = StateT (VM s) (ST s) a
Then, we went through all the places where hevm deals with EVM memory and implemented a mutable vector that can be modified in place(!) How does this work? In Haskell, computations that manipulate a notion of state are encapsulated in a State monad, but there are no guarantees that only a single memory copy of that state will be there during program execution. Using the ST monad instead allowed us to ensure that the internal state used by the computation is inaccessible to the rest of the program. That way, hevm can get away with destructively updating the state while still treating the program as purely functional.
Here’s what the graphs look like after the PR. The slowdown in the last test case is now around 3 instead of 5.5, and in terms of actual runtime, the linearity is much more apparent. Nice!
![]()
![]()
In the last few weeks of my associate program, I ran more detailed profilings with provenance information. Now we truly get x-ray vision into exactly where memory is being allocated in the program:
A detailed heap profile showing which data constructors use the most memory
What’s with all the Prop terms being generated? hevm has support for symbolic execution, which allows for various forms of static analysis. However, Echidna only ever uses the fully concrete execution. As a result, we never touch the constraints that hevm is generating. This is left for future work, which will hopefully lead to a solution in which hevm can support a more optimized concrete-only mode without compromising on its symbolic aspects.
In a software project like Echidna, whose effectiveness is proportional to how quickly it can perform its fuzzing, we’re always looking for ways to make it faster without making the code needlessly complex. Doing performance engineering in a setting like Haskell reveals some interesting problems and definitely requires one to be ready to drop down and reason about the behavior of the compilation process and language semantics. It is an art as old as computer science itself.
We should forget about small efficiencies, say about 97% of the time: premature optimization is the root of all evil. Yet we should not pass up our opportunities in that critical 3%.
— Donald Knuth
Cisco Talos’ Vulnerability Research team recently disclosed three zero-day vulnerabilities that are still unpatched as of Wednesday, May 8.
Two vulnerabilities in this group — one in the Tinyroxy HTTP proxy daemon and another in the stb_vorbis.c file library — could lead to arbitrary code execution, earning both issues a CVSS score of 9.8 out of 10. While we were unable to reach the maintainers, the Tinyroxy maintainers have since patched the issue.
Another zero-day exists in the Milesight UR32L wireless router.
These vulnerabilities have all been disclosed in adherence to Cisco’s third-party vulnerability disclosure timeline after the associated vendors did not meet the 90-day deadline for a patch or communication.
For Snort coverage that can detect the exploitation of these vulnerabilities, download the latest rule sets from Snort.org, and our latest Vulnerability Advisories are always posted on Talos Intelligence’s website.
Discovered by Dimitrios Tatsis.
The Tinyproxy HTTP proxy daemon contains a vulnerability that could lead to arbitrary code execution.
Tinyproxy is meant to be used in smaller networking environments. It was originally released more than a dozen years ago.
A use-after-free vulnerability, TALOS-2023-1889 (CVE-2023-49606), exists in the `Connection` header provided by the client. An adversary could make an unauthenticated HTTP request to trigger this vulnerability, setting off the reuse of previously freed memory, which leads to memory corruption and could lead to remote code execution. This issue has been patched, though Talos initially released it as a zero-day when no patch was available.
Discovered by Francesco Benvenuto.
The Milesight UR32L wireless router contains a vulnerability that could force the device to implement any firmware update, regardless of its legitimacy.
TALOS-2023-1852 (CVE-2023-47166) exists because the UR32L, an industrial cellular router, never checks the validity of the uploaded firmware. This could allow an adversary to upgrade the router with arbitrary firmware they created.
Talos has previously covered how an adversary could chain together several other vulnerabilities in the UR32L to completely take over the device. Talos released 22 security advisories in July 2023, nine of which have a CVSS score greater than 8.
Discovered by Emmanuel Tacheau.
A heap-based buffer overflow vulnerability exists in the comment functionality of stb _vorbis.c, an open-source, single-header file library used to decode Ogg Vorbis non-proprietary audio files. Ogg Vorbis is an open-source, patent- and royalty-free, general-purpose compressed audio format.
TALOS-2023-1846 (CVE-2023-47212) is triggered if an adversary sends the target a specially crafted .ogg file, which can lead to an out-of-bounds write. With enough heap grooming, an adversary could use this vulnerability to achieve arbitrary code execution.
Authored by Yashvi Shah and Preksha Saxena
AsyncRAT, also known as “Asynchronous Remote Access Trojan,” represents a highly sophisticated malware variant meticulously crafted to breach computer systems security and steal confidential data. McAfee Labs has recently uncovered a novel infection chain, shedding light on its potent lethality and the various security bypass mechanisms it employs.
It utilizes a variety of file types, such as PowerShell, Windows Script File (WSF), VBScript (VBS), and others within a malicious HTML file. This multifaceted approach aims to circumvent antivirus detection methods and facilitate the distribution of infection.
Figure 1: AsyncRAT prevalence for the last one month
The infection initiates through a spam email containing an HTML page attachment. Upon unwittingly opening the HTML page, an automatic download of a Windows Script File (WSF) ensues. This WSF file is deliberately named in a manner suggestive of an Order ID, fostering the illusion of legitimacy and enticing the user to execute it. Subsequent to the execution of the WSF file, the infection progresses autonomously, necessitating no further user intervention. The subsequent stages of the infection chain encompass the deployment of Visual Basic Script (VBS), JavaScript (JS), Batch (BAT), Text (TXT), and PowerShell (PS1) files. Ultimately, the chain culminates in a process injection targeting aspnet_compiler.exe.
Figure 2: Infection Chain
Upon opening a spam email, the recipient unwittingly encounters a web link embedded within its contents. Upon clicking on the link, it triggers the opening of an HTML page. Simultaneously, the page initiates the download of a WSF (Windows Script File), setting into motion a potentially perilous sequence of events.
Figure 3:HTML page
The HTML file initiates the download of a WSF file. Disguised as an order-related document with numerous blank lines, the WSF file conceals malicious intent. After its execution, no user interaction is required.
On executing wsf, we get the following process tree:
Figure 4: Process tree
Figure 5:Content of wsf file
The downloaded text file, named “1.txt,” contains specific lines of code. These lines are programmed to download another file, referred to as “r.jpg,” but it is actually saved in the public folder under the name “ty.zip.” Subsequently, this zip file is extracted within the same public folder, resulting in the creation of multiple files.
Figure 6: Marked files are extracted in a public folder
a) The “ty.zip” file comprises 17 additional files. Among these, the file named “basta.js” is the first to be executed. The content of “basta.js” is as follows:
Figure 7: basta.js
b) “basta.js” invoked “node.bat” file from the same folder.
Figure 8: node.js
Explaining the command present in node.bat:
To summarize, the command sets up a scheduled task called “cafee” which is designed to execute the “app.js” script found in the C:\Users\Public\ directory every 2 minutes. The primary purpose of this script is to maintain persistence on the system.
Figure 9: Schedule task entry
c) Now “app.js” is executed and it executes “t.bat” from the same folder.
Figure 10:app.js
d) “t.bat” has little obfuscated code which after concatenating becomes: “Powershell.exe -ExecutionPolicy Bypass -File “”C:\Users\Public\t.ps1”
Figure 11: Content of t.bat
e) Now the powershell script “t.ps1” is invoked. This is the main script that is responsible for injection.
Figure 12: Content of t.ps1
There are 2 functions defined in it:
A) function fun_alosh()
This function is used in the last for decoding $tLx and $Uk
B) Function FH ()
This function is used only once to decode the content of “C:\\Users\\Public\\Framework.txt”. This function takes a binary string as input, converts it into a sequence of ASCII characters, and returns the resulting string.
Figure 13: Content of Framework.txt
After decoding the contents of “C:\Users\Public\Framework.txt” using CyberChef, we are able to reveal the name of the final binary file targeted for injection.
Figure 14: Binary to Hex, Hex to Ascii Conversion using CyberChef
This technique aims to evade detection by concealing suspicious keywords within the script. Same way other keywords are also stored in txt files, such as:
Content of other text files are:
Figure 15: Content of other files
After replacing all the names and reframing sentences. Below is the result.
Figure 16: Injection code
Now, the two variables left are decrypted by fun_alosh.
After decrypting and saving them, it was discovered that both files are PE files, with one being a DLL ($tLx) and the other an exe ($Uk).
Figure 17: Decoded binaries
Process injection in aspnet_compiler.exe.
Figure 18: Process injection in aspnet_compiler.exe
Once all background tasks are finished, a deceptive Amazon page emerges solely to entice the user.
Figure 19: Fake Amazon page
The Dll file is packed with confuserEX and as shown, the type is mentioned ‘NewPE2.PE’ and Method is mentioned ‘Execute’.
Figure 20: Confuser packed DLL
The second file is named AsyncClient123 which is highly obfuscated.
Figure 21: AsyncRat payload
To summarize the main execution flow of “AsyncRAT”, we can outline the following steps:
The decrypting function is used to decrypt strings.
Figure 22: Decrypting Function
The program creates a mutex to prevent multiple instances from running simultaneously.
Figure 23: Creating Mutex
Figure 24: Mutex in process explorer
Checking the presence of a debugger.
Figure 25: Anti analysis code
Collecting data from the system.
Figure 26: Code for collecting data from system
Establish a connection with the server.
Figure 27: Code for C2 connection
Process injection in aspnet_compiler.exe:
Figure 28: C2 communication
In this blog post, we dissect the entire attack sequence of AsyncRAT, beginning with an HTML file that triggers the download of a WSF file, and culminating in the injection of the final payload. Such tactics are frequently employed by attackers to gain an initial foothold. We anticipate a rise in the utilization of these file types following Microsoft’s implementation of protections against malicious Microsoft Office macros, which have also been widely exploited for malware delivery. McAfee labs consistently advise users to refrain from opening files from unknown sources, particularly those received via email. For organizations, we highly recommend conducting security training for employees and implementing a secure web gateway equipped with advanced threat protection. This setup enables real-time scanning and detection of malicious files, enhancing organizational security.
Avoiding falling victim to email phishing involves adopting a vigilant and cautious approach. Here are some common practices to help prevent falling prey to email phishing:
| File | SHA256 |
| HTML | 969c50f319a591b79037ca50cda55a1bcf2c4284e6ea090a68210039034211db |
| WSF | ec6805562419e16de9609e2a210464d58801c8b8be964f876cf062e4ab52681a |
| ty.zip | daee41645adcf22576def12cb42576a07ed5f181a71d3f241c2c14271aad308b |
| basta.js | 909ec84dfa3f2a00431a20d4b8a241f2959cac2ea402692fd46f4b7dbf247e90 |
| node.bat | 569e33818e6af315b5f290442f9e27dc6c56a25259d9c9866b2ffb4176d07103 |
| app.js | 7d8a4aa184eb350f4be8706afb0d7527fca40c4667ab0491217b9e1e9d0f9c81 |
| t.bat | e2d30095e7825589c3ebd198f31e4c24e213d9f43fc3bb1ab2cf06b70c6eac1d |
| t.ps1 | a0c40aa214cb28caaf1a2f5db136bb079780f05cba50e84bbaeed101f0de7fb3 |
| exe | 0d6bc7db43872fc4d012124447d3d050b123200b720d305324ec7631f739d98d |
| dll | b46cd34f7a2d3db257343501fe47bdab67e796700f150b8c51a28bb30650c28f |
| URL | hxxp://142.202.240[.]40:222/1.txt |
| URL | hxxp://142.202.240[.]40:222/r.jpg |
The post From Spam to AsyncRAT: Tracking the Surge in Non-PE Cyber Threats appeared first on McAfee Blog.
Qiling is an emulation framework that builds upon the Unicorn emulator by providing higher level functionality such as support for dynamic library loading, syscall interception and more.
In this Labs post, we are going to look into Qiling and how it can be used to emulate a HTTP server binary from a router. The target chosen for this research was the NEXXT Polaris 150 travel router.
![]()
The firmware was unpacked with binwalk which found a root filesystem containing lots of MIPS binaries.
![]()
Before attempting to emulate the HTTP server, it was required to build a basic understanding of how the device initialises. A quick check of the unpacked rcS startup script (under /etc_ro) contained a helpful comment:
#!/bin/sh

... snip ...

# netctrl : system main process,
# all others will be invoked by it.
netctrl &

... snip ...
Simple enough. The helpful comment states that netctrl will spawn every other process, which should include the HTTP server. Loading netctrl into Ghidra confirmed this. A call to getCfmValue() is made just before httpd is launched via doSystem().
![]()
netctrl doesn’t do much more than launching programs via doSystem().
Having a quick look at httpd (spawned by netctrl) in Ghidra shows that it is a dynamically linked MIPS binary that uses pthreads.
![]()
When emulating a dynamically linked Linux ELF binary, Qiling requires a root filesystem and the binary itself. The filesystem is managed in a similar way to a chroot environment, therefore the binary will only have access to the provided filesystem and not the host filesystem (although this can be configured if necessary).
Since binwalk extracted the root filesystem from the firmware already, the root filesystem can simply be passed to Qiling. The code below does just that and then proceeds to run the /bin/httpd binary.
from qiling import Qiling
from qiling.const import *

def main():
  rootfs_path = "_US_Polaris150_V1.0.0.30_EN_NEX01.bin.extracted/_40.extracted/_3E5000.extracted/cpio-root"
  ql = Qiling([rootfs_path + "/bin/httpd"], rootfs_path, multithread=True, verbose=QL_VERBOSE.DEBUG)
  ql.run()

if __name__ == "__main__":
  main()
Passing multithread=True explicitly instructs Qiling to enable threading support for emulated binaries that use multiple threads, which is required in this case as httpd is using pthreads.
Starting off with verbose=QL_VERBOSE.DEBUG gives a better understanding of how the binary operates as all syscalls (and arguments) are logged.
Running this code presents an issue. Nothing printed to stdout by httpd is shown in the terminal. The very first line of code in the httpd main function uses puts() to print a banner, yet this output cannot be seen.
![]()
This is where Qiling hooks can be very useful. Instead of calling the real puts() function inside of the extracted libc a hook can be used to override the puts() implementation and call a custom Python implementation instead. This is achieved using the set_api() function Qiling provides, as show in the code snippet below.
def puts_hook(ql: Qiling):
params = ql.os.resolve_fcall_params({'s': STRING})
ql.log.warning(f"puts_hook: {params['s']}")
return 0

def main():

  ... snip ...

  ql.os.set_api("puts", puts_hook, QL_INTERCEPT.CALL)

  ... snip ...
Every call to puts() is now hooked and will call the Python puts_hook() instead. The hook resolves the string argument passed to puts() and then logs it to the terminal. Since QL_INTERCEPT.CALL is used as the last argument to set_api() then only the hook is called and not the real puts() function. Hooks can also be configured to not override the real function by using QL_INTERCEPT.ENTER / QL_INTERCEPT.EXIT instead.
Running the binary again shows the expected output:
![]()
Now the server is running but no ports are open. A simple way to diagnose this is to change the verbosity level in the Qiling constructor to verbose=QL_VERBOSE.DISASM which will disassemble every instruction as its ran.
![]()
Emulation hangs on the instruction located at 0x0044a8dc. Navigating to this offset in Ghidra shows a thunk that is calling pthread_create() via the global offset table.
![]()
The first cross reference to the thunk comes from the __upgrade() function which is only triggered when a firmware upgrade is requested through the web UI. The second reference comes from the InitWanStatisticTask() function which is always called from the httpd main function. This is likely where the emulation is hanging.
This function doesn’t appear to be critical for the operation of the HTTP server so doesn’t necessarily need to be executed.
There’s a few ways to tackle this:
pthread_create() or InitWanStatisticTask()pthread_create() with a NOPTo demonstrate the patching capabilities of Qiling the second option was chosen. The jump to pthread_create() happens at 0x00439f3c inside the InitWanStatisticTask() function.
![]()
To generate the machine code that represents a MIPS NOP instruction, the Python bindings for the Keystone framework can be used. The NOP bytes can be then written to the emulator memory using the patch() function, as shown below.
def main():

  ... snip ...

  ks = Ks(KS_ARCH_MIPS, KS_MODE_MIPS32)
  nop, _ = ks.asm("NOP")
  ql.patch(0x00439f3c, bytes(nop))

  ... snip ...
The emulator doesn’t hang anymore but instead prints an error. httpd attempts to open /var/run/goahead.pid but the file doesn’t exist.
![]()
Looking at the extracted root filesystem, the /var/run/ directory doesn’t exist. Creating the run directory and an empty goahead.pid file inside the extracted root filesystem gets past this error.
![]()
Emulation now errors when httpd tries to open /dev/nvram to retrieve the configured LAN IP address.
![]()
Searching for the error string initWebs: cannot find lanIpAddr in NVRAM in httpd highlights the following code:
![]()
getCfmValue() is called with two arguments. The first being the NVRAM key to retrieve, and the second being a fixed size out buffer to save the NVRAM value into.
The getCfmValue() function is a wrapper around the nvram_bufget() function from /lib/libnvram-0.9.28.so. Having a closer look at nvram_bufget() shows how /dev/nvram is accessed using ioctl() calls.
![]()
Qiling offers a few options to emulate the NVRAM access:
/dev/nvram file using add_fs_mapper()ioctl() calls and match on the arguments passedgetCfmValue() function at offset 0x0044a910The last option is the most direct and easiest to implement using Qiling hooks. This time the hook_address() function needs to be used which only hooks a specific address and not a function (unlike the previously used set_api() function).
This means that the hook handler will be called at the target address and then execution will continue as normal, so to skip over the getCfmValue() function implementation the hook must manually set the program counter to the end of the function by writing to ql.arch.regs.arch_pc.
The body of the handler resolves the NVRAM key and the pointer to the NVRAM value out buffer. A check is made for the key lanIpAddr and if it matches then the string 192.168.1.1 is written to the out buffer.
def getCfmValue_hook(ql: Qiling):
  params = ql.os.resolve_fcall_params(
    {
      'key': STRING,
      'out_buf': POINTER
    }
  )

  nvram_key = params["key"]
  nvram_value = ""
  if nvram_key == "lanIpAddr":
    nvram_value = "192.168.1.1"

  ql.log.warning(f"===> getCfmValue_hook: {nvram_key} -> {nvram_value}")

  # save the fake NVRAM value into the out parameter
  ql.mem.string(params["out_buf"], nvram_value)

  # force return from getCfmValue
  ql.arch.regs.arch_pc = 0x0044a92c

def main():

  ... snip ...

  ql.hook_address(getCfmValue_hook, 0x0044a910)

  ... snip ...
httpd now runs for a few seconds then crashes with a [Errno 11] Resource temporarily unavailable. The error message is from Qiling and related to the ql_syscall_recv() handler which is responsible for emulating the recv() syscall.
![]()
Error number 11 translates to EWOULDBLOCK / EAGAIN which is triggered when a read is attempted on a non-blocking socket but there is no data available, therefore the read would be blocked. To configure non-blocking mode the fcntl() syscall is generally used, which sets the O_NONBLOCK flag on the socket. Looking for cross references to this syscall highlighted the following function at 0x004107c8:
![]()
socketSetBlock() takes a socket file descriptor and a boolean to disable non-blocking mode on the file descriptor. The current file descriptor flags are retrieved at line 17 or 24 and the O_NONBLOCK flags is set / cleared at line 20 or 27. Finally, the new flags value is set for the socket at line 30 with a call to fcntl().
This function is an ideal candidate for hooking to ensure that O_NONBLOCK is never enabled. By hooking socketSetBlock() and always forcing the disable_non_block argument to be any non-zero value should make the function always disable O_NONBLOCK.
Inside the socketSetBlock_hook the disable_non_block argument is set to 1 by directly modifying the value inside the a1 register:
def socketSetBlock_hook(ql: Qiling):
    ql.log.warning("===> socketSetBlock_hook: disabling O_NONBLOCK")
    # force disable_non_block
    ql.arch.regs.a1 = 1

def main():
    ... snip ...
    ql.hook_address(socketSetBlock_hook, 0x004107c8)
    ... snip ...
If this helper function didn’t exist then the fcntl() syscall would need to be hooked using the set_syscall() function from Qiling.
Running the emulator again opens up port 8080! Navigating to localhost:8080 in a web browser loads a partially rendered login page and then the emulator crashes.
![]()
The logs show an Invalid memory write inside a specific thread. There aren’t many details to go off.
![]()
Since this error originates from the main thread and the emulated binary is effectively single threaded (after the NOP patch) the multithread argument passed to the Qiling constructor was changed to False.
![]()
Restarting the emulation and reloading the login page worked without crashing!
![]()
NVRAM stores the password which is retrieved using the previously hooked getCfmValue() function. After returning a fake password from getCfmValue_hook() the device can be logged into.
def getCfmValue_hook(ql: Qiling):
    ... snip ...
    elif nvram_key == "Password":
        nvram_value = "password"
    ... snip ...
Logging in causes the emulator to crash once again. This time, /proc/net/arp is expected to exist but the root filesystem doesn’t contain it.
![]()
Simply creating this file in the root filesystem fixes this issue.
![]()
After re-running the emulation everything seems to be working. The webpages can be navigated to without the emulator crashing! To make the pages fully functional required NVRAM values must exist which is an easy fix using the getCfmValue_hook.
![]()
Hopefully this Labs post gave a useful insight into some of the capabilities of Qiling. Qiling has many more features not covered here, including support for emulating bare metal binaries, GDB server integration, snapshots, fuzzing, code coverage and much more.
Finally, a few things to note:
original port + 8000 unless the emulation is ran as a privileged userverbose parameter can significantly speed up executionQiling documentation is often missing or outdatedThe full code used throughout this article can be found below:
from qiling.os.const import *
from qiling.os.posix.syscall import *
from keystone import *


def puts_hook(ql: Qiling):
    params = ql.os.resolve_fcall_params({'s': STRING})
    ql.log.warning(f"===> puts_hook: {params['s']}")
    return 0


def getCfmValue_hook(ql: Qiling):
    params = ql.os.resolve_fcall_params(
        {
            'key': STRING,
            'out_buf': POINTER
        }
    )

    nvram_key = params["key"]
    nvram_value = ""
    if nvram_key == "lanIpAddr":
        nvram_value = "192.168.1.1"
    elif nvram_key == "wanIpAddr":
        nvram_value = "1.2.3.4"
    elif nvram_key == "workMode":
        nvram_value = "router"
    elif nvram_key == "Login":
        nvram_value = "admin"
    elif nvram_key == "Password":
        nvram_value = "password"

    ql.log.warning(f"===> getCfmValue_hook: {nvram_key} -> {nvram_value}")

    # save the fake NVRAM value into the out parameter
    ql.mem.string(params["out_buf"], nvram_value)
    # force return from getCfmValue
    ql.arch.regs.arch_pc = 0x0044a92c


def socketSetBlock_hook(ql: Qiling):
    ql.log.warning(f"===> socketSetBlock_hook: disabling O_NONBLOCK")
    # force disable_non_block
    ql.arch.regs.a1 = 1


def main():
    rootfs_path = "_US_Polaris150_V1.0.0.30_EN_NEX01.bin.extracted/_40.extracted/_3E5000.extracted/cpio-root"
    ql = Qiling([rootfs_path + "/bin/httpd"], rootfs_path, multithread=False, verbose=QL_VERBOSE.DEBUG)

    ql.os.set_api("puts", puts_hook, QL_INTERCEPT.CALL)

    # patch pthread_create() call in `InitWanStatisticTask`
    ks = Ks(KS_ARCH_MIPS, KS_MODE_MIPS32)
    nop, _ = ks.asm("NOP")
    ql.patch(0x00439f3c, bytes(nop))

    ql.hook_address(getCfmValue_hook, 0x0044a910)
    ql.hook_address(socketSetBlock_hook, 0x004107c8)

    ql.run()


if __name__ == "__main__":
    main()
The post Emulation with Qiling appeared first on LRQA Nettitude Labs.
Today’s businesses are building their future in the cloud. They rely on cloud infrastructure and services to operate, develop new products and deliver greater value to their customers. The cloud is the catalyst for digital transformation among organizations of all sizes and industries.
But while the cloud powers immeasurable speed, growth and innovation, it also presents risk. The adoption of cloud technologies and modern software development practices have driven an explosion in the number of services, applications and APIs organizations rely on. For many, the attack surface is larger than ever — and rapidly expanding.
Adversaries are taking advantage of the shift. Last year, CrowdStrike observed a 75% increase in cloud intrusions and a 110% spike in cloud-conscious incidents, indicating threat actors are increasingly adept at breaching and navigating cloud environments. Cloud is the new battleground for modern cyber threats, but most organizations are not prepared to fight on it.
It’s time for a pivotal change in how organizations secure their cloud environments. CrowdStrike’s vision is to simplify and scale cloud security through a single, unified platform so security teams can protect the business with the same agility as their engineering colleagues. Our leadership in cloud security demonstrates our results so far: Most recently, we were recognized as a leader in The Forrester Wave![]() : Cloud Workload Security, Q1 2024 and a global leader in Frost & Sullivan’s Frost Radar: Cloud-Native Application Protection Platforms, 2023.
: Cloud Workload Security, Q1 2024 and a global leader in Frost & Sullivan’s Frost Radar: Cloud-Native Application Protection Platforms, 2023.
Today, our commitment to cloud security innovation continues. I’m thrilled to announce the general availability of CrowdStrike Falcon Application Security Posture Management (ASPM) and the expansion of our cloud detection and response (CDR) capabilities. Let’s dive into the details.
With the integration of ASPM into Falcon Cloud Security, CrowdStrike brings together the most critical CNAPP capabilities in a single, cloud-native platform, delivering the deep visibility, DevOps workflow integrations and incident response capabilities teams need to secure their cloud infrastructure and applications.
The demand for strong application security has never been greater: 71% of organizations report releasing application updates at least once a week, 23% push updates multiple times per week and 19% push updates multiple times per day. Only 54% of major code changes undergo a full security review before they’re deployed to production. And 90% of security teams use 3+ tools to detect and prioritize application vulnerabilities, making prioritization a top challenge for most.
CrowdStrike now delivers a unified CNAPP platform that sets a new standard for modern cloud security with:
Application security is cloud security — but no vendor has successfully incorporated a way to protect the apps that companies build to support business-critical functions and drive growth and revenue. CrowdStrike now provides a single, holistic solution for organizations to secure everything they create and run in the cloud.
CrowdStrike’s unified approach to CDR brings together world-class adversary intelligence, elite 24/7 threat hunting services and the industry’s most complete CNAPP. We are expanding our threat hunting with unified visibility across and within clouds, identities and endpoints to stop every stage of a cloud attack — even as threats move laterally from cloud to endpoint.
Our new CDR innovations are built to deliver the industry’s most comprehensive CDR service, drive consolidation across cloud security operations and stop breaches. This release empowers users to:
By uniting industry-leading managed threat hunting and deep visibility across cloud, identity and endpoints, CrowdStrike accelerates detection and response at every stage of a cloud attack. Our threat hunters rapidly detect, investigate and respond to suspicious behaviors and new attacker tradecraft while alerting customers of the complete attack path analysis of cloud-based threats.
Traditional approaches to securing cloud environments and applications have proven slow and ineffective. Security teams are overwhelmed with cybersecurity tools and alerts but struggle to gain the visibility they need to prioritize threats. Security engineers, often outnumbered by developers, must secure applications developed at a rapid pace. Tool fragmentation and poor user experience has led to more context switching, stress and frustration among security practitioners, and greater risk for organizations overall.
CrowdStrike, the pioneer of cloud-native cybersecurity, was born in the cloud to protect the cloud. We have been consistently recognized for our industry-leading cloud security strategy. Our innovations announced today continue to demonstrate our commitment to staying ahead of modern threats and building the technology our customers need to stop breaches.
Businesses must act now to protect their cloud environments — and the mission-critical applications and data within them — from modern adversaries. CrowdStrike is here to help.
The massive increase in cloud adoption has driven adversaries to focus their efforts on cloud environments — a shift that led to cloud intrusions increasing by 75% in 2023, emphasizing the need for stronger cloud security.
Larger scale leads to larger risk. As organizations increase their quantity of cloud assets, their attack surface grows. Each asset brings its own set of security concerns. Large cloud environments are prone to more cloud misconfigurations, which provide more opportunities for adversaries to breach the perimeter. Furthermore, when breaches do occur, tracing lateral movement to stop malicious activity is challenging in a complex cloud environment.
CrowdStrike, a proven cloud security leader, has enhanced its CrowdStrike Falcon® Cloud Security capabilities to ensure security analysts can easily visualize their cloud assets’ connections so they can better understand and prioritize risks. Today we’re expanding our asset graph to help modern organizations secure everything they build in the cloud.
We continue to expand our attack path analysis capabilities. Today, we’re announcing support for key AWS services including EC2, S3, IAM, RDS and container images.
With this enhanced support, CrowdStrike customers can quickly understand where their cloud weaknesses would allow adversaries to:
Investigating cyberattacks can be a grueling, stressful task. The CrowdStrike Falcon® platform stops breaches and empowers security analysts to find the root cause of each attack. As Falcon’s attack path analysis extends further into the cloud, customers can leverage CrowdStrike® Asset Graph to more quickly investigate attacks and proactively resolve cloud weaknesses.
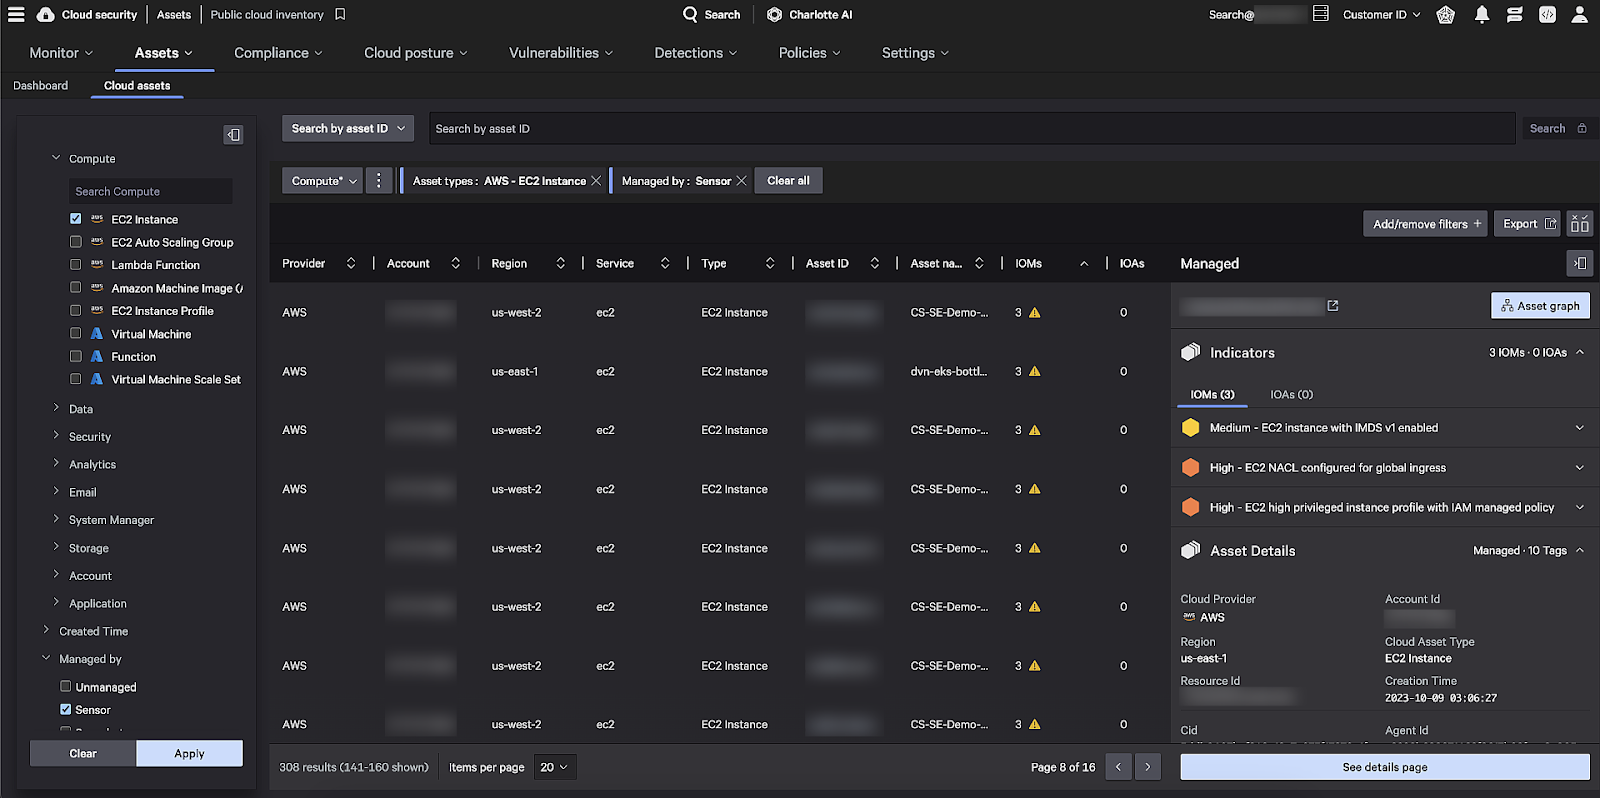
Figure 1. A filtered view of cloud assets shows all EC2 instances in the AWS account.
In this example, we are investigating an EC2 instance with a vulnerable metadata version enabled. We see the EC2 instance is open to global traffic, so we select “Asset Graph” to investigate.
In Asset Graph, an adversary’s potential entry point is automatically flagged for us. The access control list is misconfigured and accepts traffic from every IP address. Upon inspection, we quickly visualize how the adversary would move laterally to access our EC2 instance. To resolve this issue, we first restrict the access control list to company-specific IP addresses. Then, we update the metadata service version used by the EC2 instance.
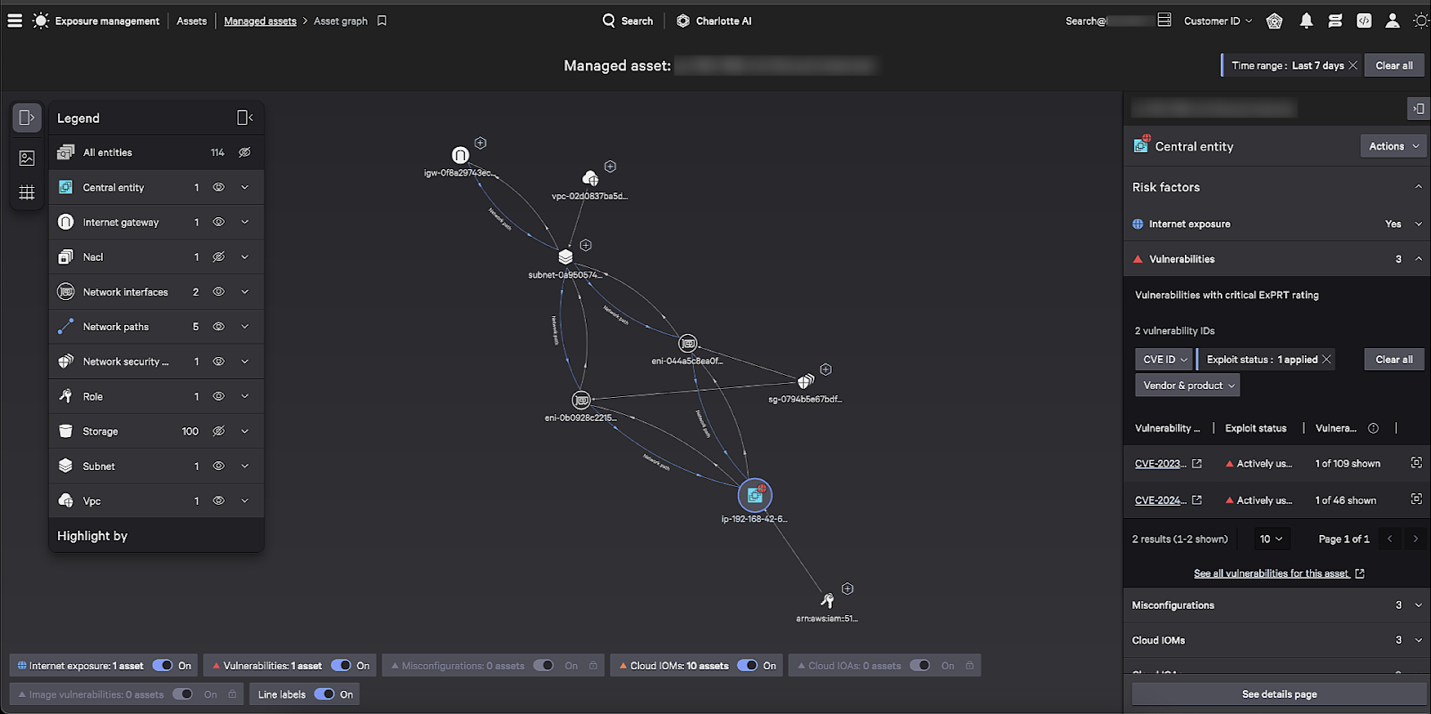
Figure 2. The EC2’s attack path analysis reveals a potential entry point for adversaries.
Both indicators of attack (IOAs) and indicators of misconfiguration (IOMs) are available for each managed cloud asset. With this knowledge, security teams can quickly identify each asset that allows for initial access to their cloud. Furthermore, sensitive compute and storage assets are automatically traced to upstream security groups and network access lists that allow for initial access. Using Falcon’s attack path analysis, security teams quickly see the remediation steps required to protect their cloud from adversaries.
Speed and agility are massive cloud benefits. However, the ability to quickly spin up cloud resources can result in asset sprawl — an unexpectedly large number of cloud assets in a live environment. For example, in some environments, a single S3 bucket can be accessible to many IAM roles. Each of those IAM roles may contain access to a large quantity of other storage buckets. Security teams need a way to sift through massive cloud estates to find the services requiring attention.
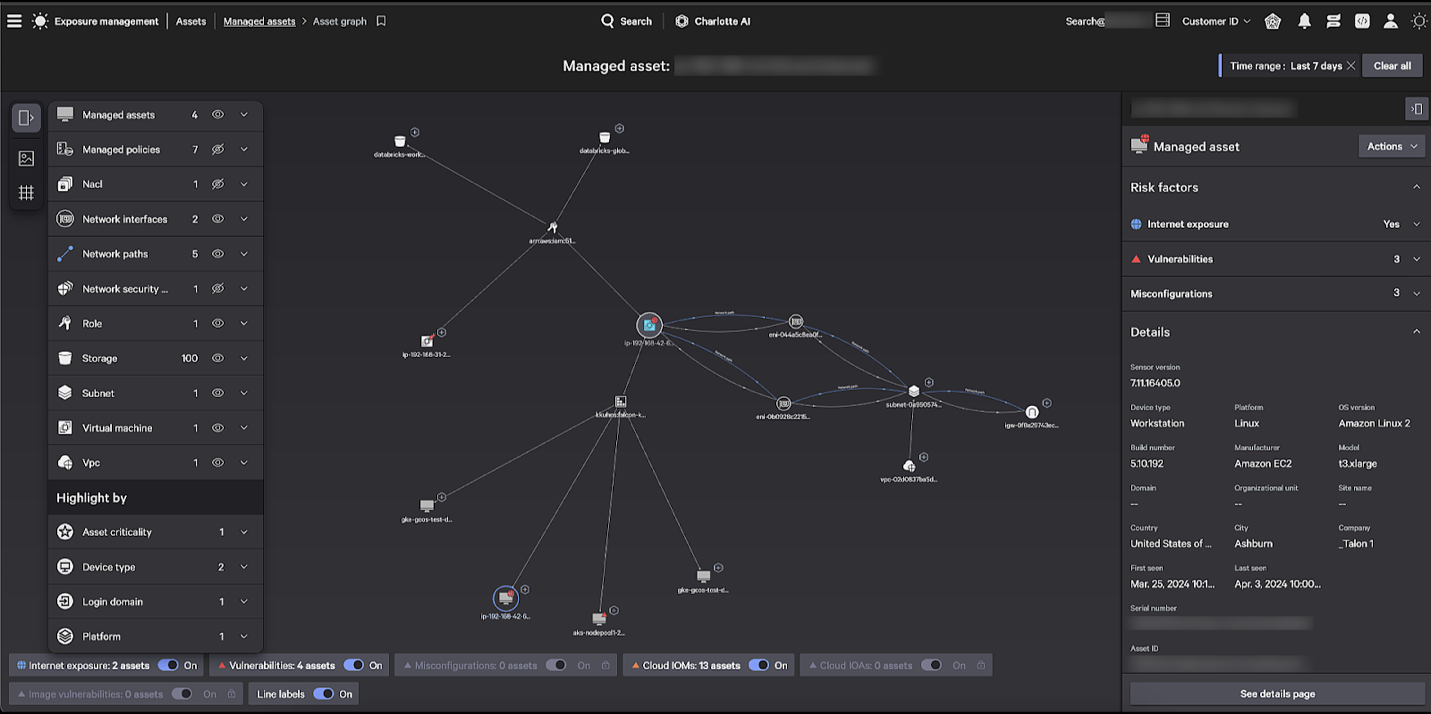
Figure 3. A CrowdStrike Asset Graph view reveals the many connections between cloud assets.
The Falcon query builder capabilities allow security teams to ask questions like:
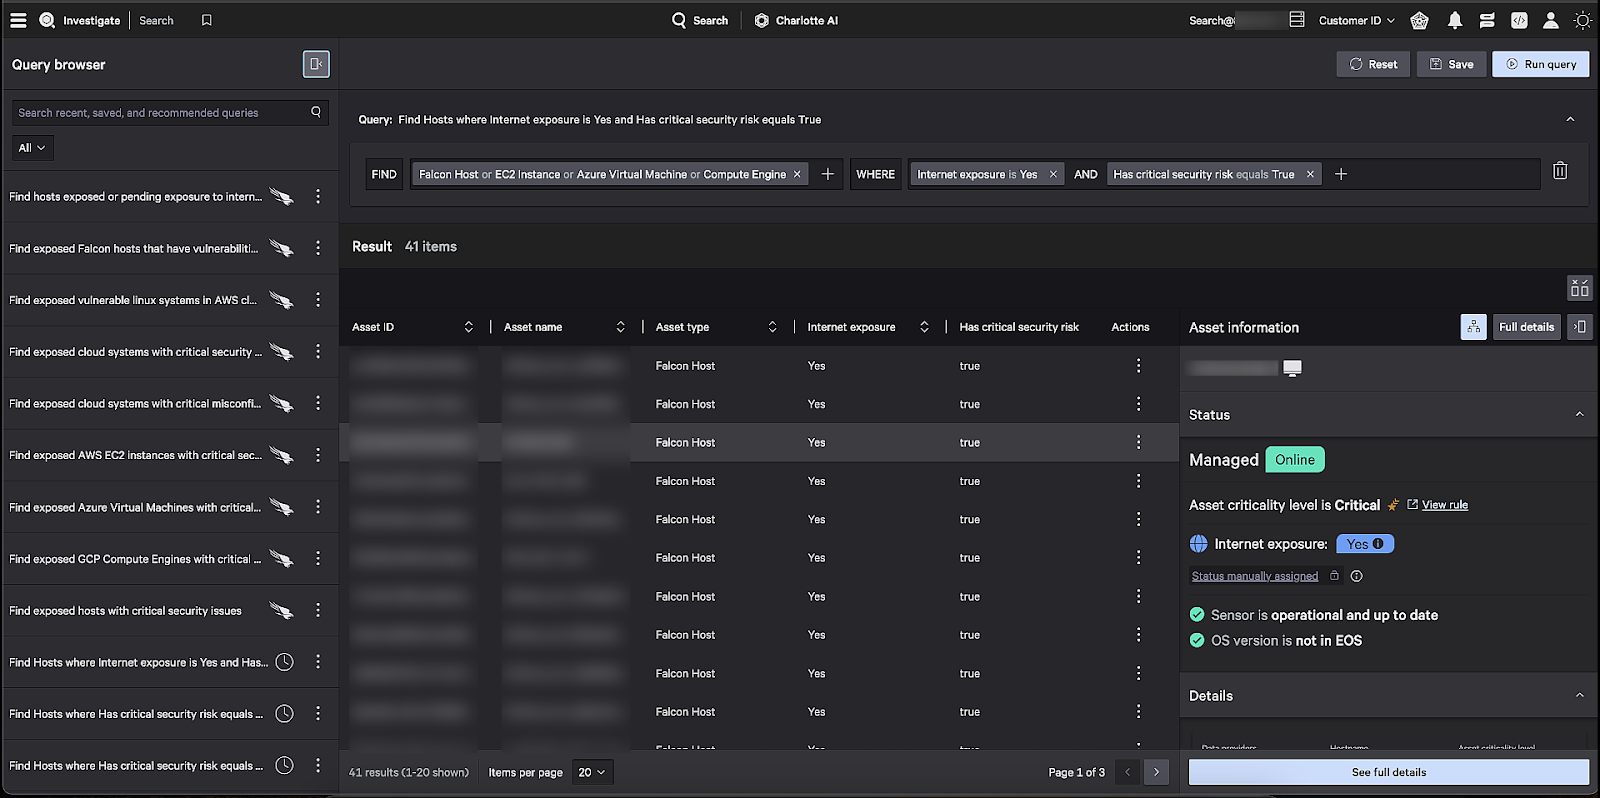
Figure 4. A query checking for internet-facing EC2 instances with critical security risks.
With Falcon’s query builder, pinpointing cloud weaknesses becomes an efficient process. Graphical views of cloud assets can be daunting. Building queries with Falcon enables teams to focus their attention on the assets that matter most: those that are prone to exploitation by adversaries.
The expansion of cloud asset visualization is another step toward providing a single console that addresses every cloud security concern. By integrating IOAs and IOMs with a connected asset map, CrowdStrike offers a robust, efficient solution for investigating today’s cloud security challenges.
Unlike other vendors that may offer disjointed security components, CrowdStrike’s approach integrates elements across the entire cloud infrastructure. From hybrid to multi-cloud environments, everything is managed through a single, intuitive console within the AI-native CrowdStrike Falcon platform. This unified cloud-native application protection platform (CNAPP) ensures organizations achieve the highest standards of security, effectively shielding against breaches with an industry-leading cloud security solution. The cloud asset visualization, while pivotal, is just one component of this comprehensive CNAPP approach, underscoring CrowdStrike’s commitment to delivering unparalleled security solutions that meet and anticipate the adversaries’ attacks on cloud environments.
Get a free Cloud Security Health Check and see Falcon Cloud Security in action for yourself.
During the review, you will engage in a one-on-one session with a cloud security expert, evaluate your current cloud environment, and identify misconfigurations, vulnerabilities and potential cloud threats.
In this guest blog from Pwn2Own winner Cody Gallagher, he details CVE-2024-21115 – an Out-of-Bounds (OOB) Write that occurs in Oracle VirtualBox that can be leveraged for privilege escalation. This bug was recently patched by Oracle in April. Cody has graciously provided this detailed write-up of the vulnerability and how he exploited it at the contest.
The core bug used for this escape is a relative bit clear on the heap from the VGA device. The bug is in function vgaR3DrawBlank, which is called from vgaR3UpdateDisplay. The bug can be triggered with a single core and 32MB of VRAM, and possibly less. All testing was done using the default graphics controller for Linux (VMSVGA). It should work on others as well.
As for the exploit, I could not get it to work with those constraints. For my exploit, I require at least 65 MB of VRAM but am using 128 MB to be safe. It requires 4 cores because of the race condition I use.
The Vulnerability
Inside the VGAState struct there is a bitmap used for tracking dirty pages in the vram buffer so that it knows whether it needs to redraw that part of the frame buffer.
This bitmap is large enough to hold the total number of pages even when using the max vram allowable by vbox, which is 256MB. However, inside vgaR3DrawBlank, when it attempts to clear the dirty page bits it incorrectly multiplies start_addr by 4 before doing so:
We can see here that if we are able to set start_addr to a value greater than 64MB, it will clear bits outside the bounds of the bitmap. Alternatively, even if start_addr is below 64MB, so that it starts clearing within the bitmap, the bit clear operation can continue past the bitmap's end.
Examining how start_addr is set, we can see that it allows any value up to vram_size:
Later in the code, vbe_start_addr is stored into start_addrand and vbe_line_offset is stored into line_offset. This happens when vgaR3UpdateBasicParams calls vgaR3GetOffsets. This update occurs whenever a new graphic or text is being drawn.
As long as our vram_size is greater than 64MB we will able to clear bits in heap memory following the bitmap.
The following are the values I set up to trigger the bug. All of these are settable via ioport communication.
These values are chosen to zero out a specific bit, but if the VBE_DISPI_INDEX_VIRT_WIDTH is increased it will most likely overwrite enough data to cause a segfault. For the exact ioport comms used, please reference the exploit code.
The Exploit
I explored several paths to find something we can zero out that would be usable to gain reliable code execution. I ended up looking at CritSect inside of VGAState. This critical section is used so that only 1 thread at a time can process in and out instructions for each device, as well as any loads or stores to the mmio region. There are several things we are concerned with in the critical section. The relevant structures are as follows:
When a thread locks the critical section, it adds 1 to cLockers, updates NativeThreadOwner to the current thread, and adds 1 to cNestings.
If a different thread then attempts to lock this same section it will see that cLockers is set and will attempt to wait its turn to lock. There is first an optimized wait, in which it will attempt to spin for some microseconds to see if it can quickly acquire the lock.
If that fails it will the block on the EventSem semaphore.
This hEvent value is just an int. Each time a critical section is created, a new hEvent value will be allocated in sequential fashion. When we look at the critical section of VGAState we can see the value of hEvent is 0x23.
The first 4 bytes are u32Magic, and the hEvent value can be seen at offset 0x18. With this information in hand, I realized that if we can find another critical section with an hEvent, we can modify the hEvent of VGState to match that of the other critical section. Then we can use that confusion to produce a race condition in any VGA ioport or mmio read/write. After looking around I found that VMMDev was using the hEvent value of 0x21.
After some testing, I found that the hEvent values are consistent between runs because they are assigned sequentially on startup. The critical sections for VMMDev and VGA are created directly after the processor-related critical sections. So long as the processor chipset doesn't change, these should remain constant.
I will note here that there are other critical sections that could potentially be used, but I chose to write my exploit using the VMMDev critical section.
First, we use our bit clearing bug to turn 0x23 into 0x21. Subsequently, whenever there are two threads, one holding the critical section for VMMDev and one holding the critical section for VGA, when either thread releases its critical section it can wake up a thread waiting for either device. Our plan is to use this race condition to wake a thread waiting for VGA prematurely, which is to say, while some other thread is still using VGA.
This is not good enough yet, though. Even if we hit the race, VirtualBox throws a SigTrap shortly thereafter. This is because when the racing thread locks the critical section, it changes NativeThreadOwner. When the first thread tries to unlock the critical section, the NativeThreadOwner does not match, causing the error.
Upon discovering this we also see that there is a way to completely turn off an individual critical section. There is a bit in fFlags called RTCRITSECT_FLAGS_NOP. If this bit is set then it will ignore all locking and unlocking operations for that particular critical section.
This poses a challenge for us, though. The only bug we have is a bit clear, so we have no way to set this flag. Instead, we must find a way to set the flag from our racing VGA thread before the first VGA thread exits and crashes the process.
When looking for a way to accomplish this, I found an ioport for writing data to vbe_regs in VGAState:
uint16_t vbe_regs[VBE_DISPI_INDEX_NB];
This ioport allows us to specify vbe_index as an arbitrary short, and then it will write an arbitrary short to vbe_regs[vbe_index] in vbe_ioport_write_data. The write is protected by a bounds check on the index, but we can circumvent the check by using the race condition we manufactured.
To exploit, we start a VGA request on one thread (the “worker”) specifying a valid vbe_index, and a second VGA request on a second thread (the “racer”) specifying a bad vbe_index. Normally the racer request would need to wait for the worker to finish, but by racing two VMMDev requests (on two other threads) we can wake the racerVGA thread prematurely, modifying the vbe_index after the workerthread has finished validating it but before using it.
Note that, for this to succeed, the racer thread must be woken at a critical moment during execution of the worker. To make this race easier to win, we can take advantage of a memset in vbe_ioport_write_data where we control the length. For the worker request, we make this a large number so we have a longer window in which to win the race. In testing, I found we can easily get this to over 1 millisecond which is a massive amount of time during which we can win the race.
After winning the race, we can see the desired effect.
By means of the vgaR3DrawBlank bug we have changed hEvent from 0x23 to 0x21, and by means of the vbe_ioport_write race we have changed the fFlags member at offset 0x14 to 0xf, disabling the critical section. Now that the critical section is fully disabled, we can easily race VGA threads against each other. The next step is to find a read and a better write with our new and improved race condition.
Both the write and the read can be achieved by corrupting the same value. In VGAState there is a field of struct type VMSVGASTATE, and that struct contains a field named cScratchRegion.
cScratchRegion is used to track the size of the buffer au32ScratchRegion, which stores data during VMSVGA IO port communication. In functions vmsvgaIORead and vmsvgaIOWrite we can read and write this buffer based on the value of cScratchRegion.
Using the vbe_ioport_write race one more time, we can corrupt cScratchRegion. This gives us a fully controlled buffer overread and buffer overflow of a buffer within VGAState.
From here we need to find a way to get arbitrary execution. Conveniently, each device in VirtualBox has a PDMPCIDEV allocated directly after it in memory. Since it is part of the initial allocation for the device, we can be assured it will always be there.
At the beginning of the structure there is a pointer to the static string vga located in VBoxDD.dll. We can use our buffer overread to read this pointer and infer the base address of VBoxDD.dll. The structure also has a nested PDMPCIDEVINT structure, which contains several easily accessible function pointers:
The function pointers pfnConfigRead and pfnConfigWrite can be overwritten by our buffer overflow. Afterwards, we can trigger calls to these function pointers using PCI ioports.
To prepare for calling these function pointers, we first call pciIOPortAddressWrite to set uConfigRegto to specify the PCI device we want to read from or write to. In our case, that value can be found in the uDevFn value at the beginning of the PDMPCIDEV struct.
After we set uConfigReg, we can then call pciIOPortDataWrite, which will call pci_data_write. This function will call our function pointer with some controlled arguments.
When the function pointer is called, arg1 ends up being the value of pDevInsR3 which is fully user-controlled by means of our buffer overflow. arg2 points to the PDMPCIDEV struct after our VGAState, which means we can control data at that location. With a fully controlled arg1 and arg2, we can start to write our final execution chain.
These libraries use Windows Control Flow Guard so we are not able to make indirect calls to arbitrary code. Fortunately for us, CFG allows calls to arbitrary functions in other libraries, so it doesn’t prevent us from calling WinExec("calc").
First, we need to use our buffer read/write primitives to construct an arbitrary read so we can get the address of kernel32.dll. We currently have the base address for VBoxDD.dll only, so we will have to find something to use in that library. When looking through functions in VBoxDD.dll I found one that will work perfectly for what we want to do.
Our arg1 is fully controlled, so this read routine will allow us to take memory from arg1+0x2d8 and store it into the memory pointed to by arg2. arg2 points directly after VGAState in memory, so we can read it afterwards with our buffer overread. This effectively gives us an arbitrary read primitive. With this, we can leak pointers to functions in other libraries through VBoxDD.dlls IAT.
VBoxDD.dll imports several functions from kernel32.dll, so we can read any one of those import table entries to get a pointer into kernel32.dll. From there we can scan backward using our read until we encounter the PE magic at the beginning of kernel32.dll, which gives us the base.
Next, we scan for the export table of kernel32.dll. We start by reading out all the table addresses.
We then scan through the names table until we find the name WinExec. Having obtained the index, we can use the ordinal and address tables to get the function address. Finally we write calc into heap memory we control and call WinExec("calc").
Impact
This bug can be triggered on a large percentage of virtual machines because it is an easily accessible path in VGA. I believe this can probably be turned into at least a DOS on any VM with at least 32MB of VRAM.
The way I exploited it has significantly more constraints, which restricts the number of machines affected by the full escape. It still may be possible to turn this bug into a full escape under a wider range of conditions, but that was not part of my research.
Thanks again to Cody for providing this thorough write-up. This was his first Pwn2Own event, and we certainly hope to see more submissions from him in the future. Until then, follow the team on Twitter, Mastodon, LinkedIn, or Instagram for the latest in exploit techniques and security patches.
![]()
One of the great cybersecurity challenges organizations currently face, especially smaller ones, is that they don’t know what they don’t know.
It’s tough to have your eyes on everything all the time, especially with so many pieces of software running and IoT devices extending the reach of networks broader than ever.
One potential (and free!) solution seems to be a new program from the U.S. Cybersecurity and Infrastructure Security Agency (CISA) that alerts companies and organizations of unpatched vulnerabilities that attackers could exploit.
Under a pilot program that’s been running since January 2023, CISA has sent out more than 2,000 alerts to registered organizations regarding the existence of any unpatched vulnerabilities in CISA’s Known Exploited Vulnerabilities (KEV) catalog. For those that don’t know, the KEV catalog consists of any security issues that threat actors are known to actively exploit in the wild, and often include some of the most serious vulnerabilities disclosed on a regular basis, some of which have been around for years.
Jen Easterly, CISA’s director, said last month that 49 percent of those vulnerabilities that CISA sent alerts about were mitigated — either through patching or other means. The program will launch in earnest later this year, but more than 7,000 organizations have already registered for the pilot program.
Everything about this makes sense to me — it comes at no cost to the consumer or business, it allows the government to inform organizations of something they very likely aren’t aware of, and these issues are easy enough to fix with software or hardware patches.
I’m mainly wondering how we’ll get more potential targets to sign up for this program and receive these alerts.
According to CISA’s web page on the program, the alerts are only currently available to “Federal, state, local, tribal and territorial governments, as well as public and private sector critical infrastructure organizations.”
I would imagine that, at some point, the scope of this will be expanded if it continues to be successful, and there are no clear guidelines for what “critical infrastructure” means in this context, exactly. (For example, would something like a regional ISP would be eligible for this program? I’d consider this CI, but I’m not sure the federal government would.)
Currently, signing up for the alerts seems to be as simple as sending an email. CISA’s also been sending alerts to any vulnerable systems that appear on Shodan scans. I don’t think there’s a way to make something like this compulsory unless it’s codified into law somewhere, but it almost seems like it should be.
Who wouldn’t want to just get free alerts from the federal government telling you when your network has a vulnerability that’s being exploited in the wild? For many of the local and state government teams, the pilot program targets are understaffed and underfunded, and sometimes the act of patching can get so overwhelming that it can take months to keep current. But this type of organization may also be stretched thin to the point they haven’t even heard of this program from CISA. So if the most I can do is shout out this government program in this newsletter and one extra company signs up, I’ll feel good about that.
Cisco Talos’ Vulnerability Research team recently disclosed three zero-day vulnerabilities two of which are still unpatched as of Wednesday, May 8. Two vulnerabilities in this group — one in the Tinyroxy HTTP proxy daemon and another in the stb_vorbis.c file library — could lead to arbitrary code execution, earning both issues a CVSS score of 9.8 out of 10. While we were unable to reach the maintainers, the Tinyproxy maintainers have since patched the issue. Another zero-day exists in the Milesight UR32L wireless router. These vulnerabilities have all been disclosed in adherence to Cisco’s third-party vulnerability disclosure timeline after the associated vendors did not meet the 90-day deadline for a patch or communication.
Tinyproxy is meant to be used in smaller networking environments. It was originally released more than a dozen years ago. A use-after-free vulnerability, TALOS-2023-1889 (CVE-2023-49606), exists in the `Connection` header provided by the client. An adversary could make an unauthenticated HTTP request to trigger this vulnerability, setting off the reuse of previously freed memory, which leads to memory corruption and could lead to remote code execution. Four of these issues that Talos disclosed this week still do not have patches available, so anyone using affected software should find other potential mitigations.
For Snort coverage that can detect the exploitation of these vulnerabilities, download the latest rule sets from Snort.org, and our latest Vulnerability Advisories are always posted on Talos Intelligence’s website.
Several international law enforcement agencies have identified, sanctioned and indicted the alleged leader of the LockBit ransomware group. Russian national Dmitry Yuryevich Khoroshev has been unmasked as the person behind the operator of the username “LockBitSupp,” LockBit’s creator and mastermind. The ransomware group has extorted an estimated $500 million from its victims over its several years of activity. Khoroshev allegedly took 20 percent of each ransom payment and operated the group’s data leak site. The U.S. federal government is offering up to a $10 million reward for anyone who can provide information leading to Khoroshev’s arrest. In all, he is charged with 26 crimes in the U.S. that carry a maximum punishment of 185 years in prison. LockBit, founded around 2018, operates under the ransomware-as-service model in which other actors can pay to access LockBit’s malware and infection tools. The group has been linked to several major ransomware attacks over the years, including against the U.K.’s Royal Mail service, a small Canadian town in Ontario and a children’s hospital in Chicago. (Wired, The Verge)
The U.K. blamed Chinese state-sponsored actors for a recent data breach at a military contractor that led to the theft of personal information belonging to around 270,000 members of the British armed forces. Potentially affected information includes names and banking information for full-time military personnel and part-time reservists, as well as veterans who left the military after January 2018. Some of those affected are also current members of parliament. A top official at the U.K.’s Ministry of Defense called the breach a “very significant matter” and that the contractor immediately took the affected systems offline. While the British government has yet to formally attribute the attack to a specific threat actor, several reports indicate they believe an actor emanating from China was responsible. While the actors may have been present on the network for up to weeks, there is currently no evidence that the information was copied or removed. (The Guardian, Financial Times)
Security researchers found a new attack vector that could allow bad actors to completely negate the effect of VPNs. The method, called “TunnelVision,” can force VPN services to send or receive some or all traffic outside of the encrypted tunnel they create. Traditionally users will rely on VPNs to protect their traffic from snooping or tampering, or to hide their physical locations. The researchers believe TunnelVision affects every VPN application available if it connects to an attacker-controlled network. There is currently no way to avoid or bypass these attacks unless the VPN runs on Linux or Android. TunnelVision has been possible since at least 2002, though it's unclear how often it's been used in the wild. VPN users who are concerned about this attack can run their VPN inside a virtual machine whose network adapter isn’t in bridged mode or connect via the Wi-Fi network of a cellular device. However, for the attack to be effective, the attacker would need complete control over a network. If a connection is affected, though, the user would be completely unaware, and the VPN would not alert them to a change. (Ars Technica, ZDNet)
ISC2 SECURE Europe (May 29)
Amsterdam, Netherlands
Gergana Karadzhova-Dangela from Cisco Talos Incident Response will participate in a panel on “Using ECSF to Reduce the Cybersecurity Workforce and Skills Gap in the EU.” Karadzhova-Dangela participated in the creation of the EU cybersecurity framework, and will discuss how Cisco has used it for several of its internal initiatives as a way to recruit and hire new talent.
Cisco Live (June 2 - 6)
Las Vegas, Nevada
SHA 256: c67b03c0a91eaefffd2f2c79b5c26a2648b8d3c19a22cadf35453455ff08ead0
MD5: 8c69830a50fb85d8a794fa46643493b2
Typical Filename: AAct.exe
Claimed Product: N/A
Detection Name: W32.File.MalParent
SHA 256: d529b406724e4db3defbaf15fcd216e66b9c999831e0b1f0c82899f7f8ef6ee1
MD5: fb9e0617489f517dc47452e204572b4e
Typical Filename: KMSAuto++.exe
Claimed Product: KMSAuto++
Detection Name: W32.File.MalParent
SHA 256: abaa1b89dca9655410f61d64de25990972db95d28738fc93bb7a8a69b347a6a6
MD5: 22ae85259273bc4ea419584293eda886
Typical Filename: KMSAuto++ x64.exe
Claimed Product: KMSAuto++
Detection Name: W32.File.MalParent
SHA 256: 8664e2f59077c58ac12e747da09d2810fd5ca611f56c0c900578bf750cab56b7
MD5: 0e4c49327e3be816022a233f844a5731
Typical Filename: aact.exe
Claimed Product: AAct x86
Detection Name: PUA.Win.Tool.Kmsauto::in03.talos
SHA 256: 59f1e69b68de4839c65b6e6d39ac7a272e2611ec1ed1bf73a4f455e2ca20eeaa
MD5: df11b3105df8d7c70e7b501e210e3cc3
Typical Filename: DOC001.exe
Claimed Product: N/A
Detection Name: Win.Worm.Coinminer::1201