I contemplated releasing this blog post earlier, and now that everyone has moved on from Sublime Text to Atom there's really no reason not to push it out. This is posted purely for educational purposes.
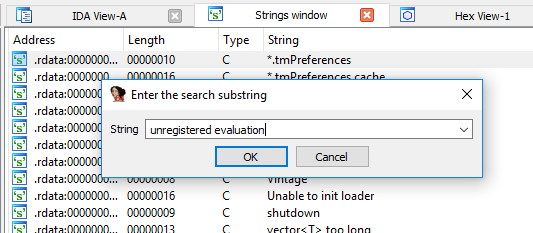
Everyone who has used the free version of Sublime Text knows that when you go to save a file, it will randomly show a popup asking you to buy the software. This is known as a "nag window".
The first time I saw it, I knew it had to be cracked. Just pop open the sublime_text.exe file in IDA Pro and search for the string.
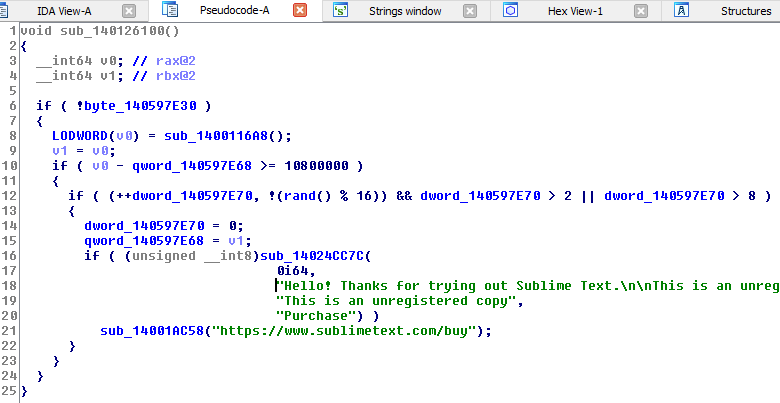
We find a match, and IDA tells us where it is cross referenced.
We open the function that uses these .rdata bytes and see that it checks some globals, and performs a call to rand(). If any of the checks fail it will display the popup. The function itself is only about 20 lines of pretty basic assembly but we decompile it anyway because the screenshot is cooler that way.
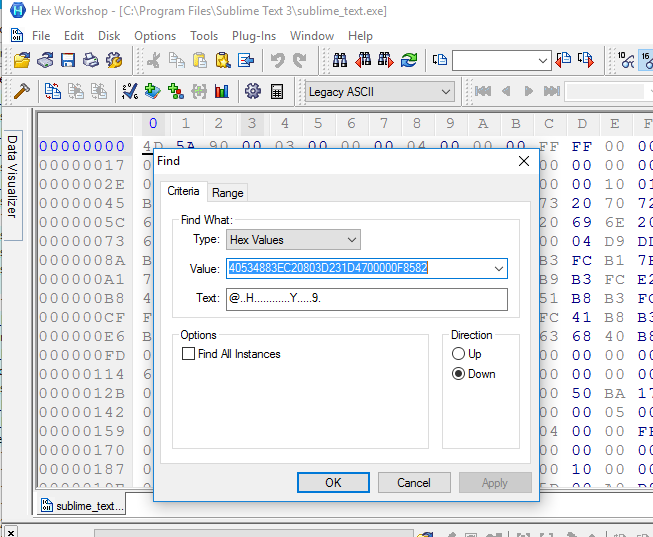
We open the hex view to see what the hex code for the start of the function looks like.
Next we open sublime_text.exe in Hex Workshop and search for the hex string that matches the assembly.
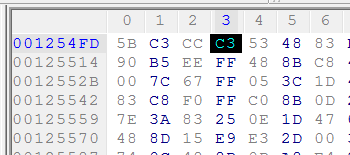
Finally, we patch the beginning of the function with the assembly opcode c3, which will cause the function to immediately return.
After saving, there will be no more nag window. As an exercise to the reader, try to make Sublime think you have a registered copy.
On Linux systems, you can include system() from the standard C library to easily shell a Postgres server. The mechanism for Windows is a bit more complicated.
I have created a Postgres extension (Windows DLL) that you can load which contains a reverse shell. You will need file write permissions (i.e. postgres user). If the PostgreSQL port (5432) is open, try logging on as postgres with no password. The payload is in DllMain and will run even if the extension is not properly loaded. You can upgrade to meterpreter or other payloads from here.
For whatever reason, Microsoft decided XML needed to be Turing complete. They created an XSL schema which allows for C# code execution in order to fill in the value of an XML element.
If an ASP.NET web application parses XML, it may be susceptible to this attack. If vulnerable, an attacker gains remote code execution on the web server. Crazy right? It is similar in exploitation as traditional XML Entity Expansion (XXE) attacks. Gaining direct code execution with traditional XXE requires extremely rare edge cases where certain protocols are supported by the server. This is more straight forward: supply whatever C# you want to run.
The payload in this example XML document downloads a web shell into the IIS web root. Of course, you can craft a more sophisticated payload, or perhaps just download and run some malware (such as msfvenom/meterpreter). In many cases of a successful exploitation, and depending on the application code, the application may echo out the final string "Exploit Success" in the HTTP response.
Note: I've never gotten the "using" directive to work correctly, but have found the fully qualified namespaces of the classes (e.g. System.Net.WebClient) works fine.
This is kind of a hidden gem, it was hard to find good information about this.
Thanks to Martin Bajanik for finding this information: this attack is possible when XsltSettings.EnableScript is set to true, but it is false by default.
I was attempting to reduce the number of records in the Import Address Table of an executable, which of course meant a replacement for LoadLibrary() and GetProcAddress() were needed. I couldn't find a version online that worked for x86, x64, and ARM; so I ended up writing one. Even being mostly familiar with the PE format and Windows internals in general, there were a few caveats that led to an annoying debug session (such as forward exports).
Here is a working replacement for the two APIs. You can even define the PE header and PEB structs in your own header and lose the requirement for the default Windows headers. I also recommend a crypter for the strings you pass to these functions.
Note: This will internally rely on Kernel32.dll being loaded, and will calculate the real location of LoadLibrary() dynamically. New DLLs will be mapped in with the real API call, this does not code does not do manual mapping or calling of DllMain. I recommend using it to get the real addresses of LoadLibrary() and GetProcAddress() and then doing all calls through the real APIs.
The Background Intelligent Transfer Service (BITS) is a
Windows system service that facilitates file transfers between clients
and servers, and serves as a backbone component for Windows Update. The
service comes pre-installed on all modern versions of Windows, and is
available in versions as early as Windows 2000 with service pack updates. There are ways for a non-Administrator
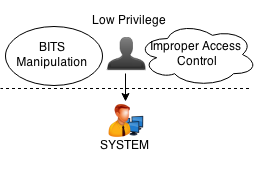
user to manipulate the service into providing an Identification Token with the LUID of 999 (0x3e7), or the NT AUTHORITY\SYSTEM (Local System) root-equivalent user.
BITS Manipulation is a pre-stage to modern privilege escalation attacks.
BITS Manipulation is not a full exploit per se, but rather a pre-stage to local (and possibly remote) privilege escalation with a crafted executable. Identification Tokens can only lead to arbitrary code execution in the prescence of secondary Improper Access Control (CWE-284) vulnerabilities. Google's Project Zero has proved a number of full exploits using the technique. There are currently no known plans for Microsoft to fix this. Details for performing it and why it works remain exceptionally scarce.
Windows Tokens
Every user-mode thread on Windows executes with a Token, which is used as its security identifier by the kernel in order to determine access rights during system calls. When a user starts a process, the Primary Token for that process becomes one which represents the access rights of that user. Individual threads within the process are allowed to change their security context from the Primary Token through the use of Impersonation Tokens, which come in different privilege levels and can allow code execution in the context of a different user.
Impersonation tokens are used throughout Windows in order to delegate responsibilities between users and the OS default users such as Local System, Local Service, and Network Service. For instance, a server process running as Network Service can impersonate a client user and perform actions on that user's behalf. It is extremely common and not suspicious behavior for a process to have multiple tokens open at any given time.
Token Impersonation Levels
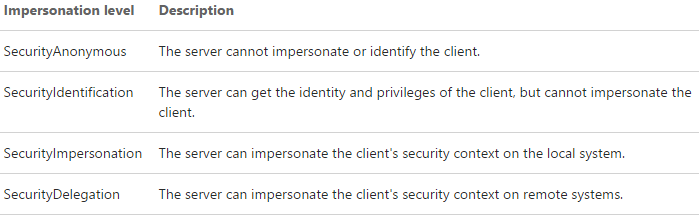
A normal user obtaining an Identification Token as Local System is not necessarily an exploit in and of itself (some would argue, but at least not in the eyes of Microsoft). To understand why, a review of Token Impersonation Levels is required.
BITS Manipulation and similar techniques only provide a SecurityIdentification Token for SYSTEM. This is useful for a number of tasks, but it still does not allow arbitrary code execution in the context of that user. Ordinarily, in order to achieve code execution as SYSTEM, the Token would need to be an Impersonation Token with the SecurityImpersonation or SecurityDelegation privilege.
Identification-Only Exploitation
There are a number of vulnerabilities in Windows where the Impersonation Level is not properly validated, such as in MS15-001, MS15-015, and MS15-050. These vulnerabilities failed to check if the Token Impersonation Level was sufficiently privileged before allowing arbitrary code execution in the context of the user.
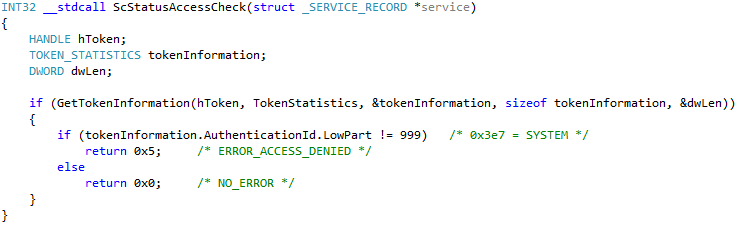
Here is a (simplified) reverse engineering of services.exe prior to the MS15-050 patch:
Before MS15-050 Patch: The calling thread's Token is checked to see if it is run as SYSTEM, or LUID 999.
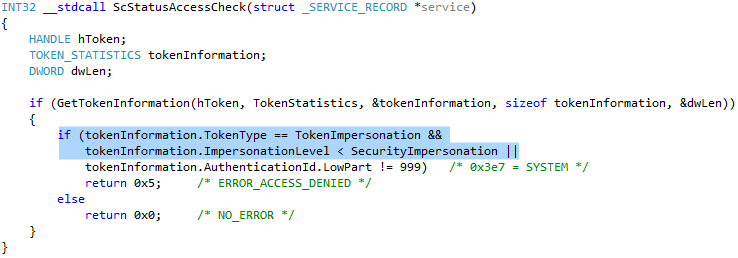
With the background information above, the bug is easy to spot. Here is the same code after the patch:
After MS15-050 Patch: The Impersonation Level is now correctly verified before the SYSTEM check.
It should now be apparent why a normal user attempting to escalate privileges would want a SYSTEM Token, even if it is only of the SecurityIdentification privilege. There are countless token access control vulnerabilities already discovered, and more likely to be found.
BITS Manipulation Methodology
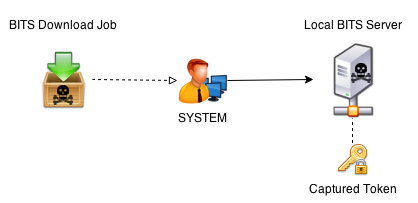
BITS, by default, is an automatically started Windows service which logs on as Local System. While the service is primarily used for uploading and downloading files between machines, it is also possible to create a BITS server which services the local machine context. When a download is queued, the BITS service connects to the server as the SYSTEM user.
Forcing a BITS download to an attacker-controlled BITS server allows capture of a SYSTEM token.
Here is the general methodology, which can be performed as a non-Administrator user on the machine:
Create a BITS server with a local context.
Launch a BITS download job, causing SYSTEM to start a client to the local BITS server.
Capture SYSTEM's token when it interacts with the server.
BITS Manipulation Implementation
BITS is served on top of Microsoft's Component Object Model (COM). COM is a topic of extensive study, but it is essentially a language-neutral object-oriented binary-interface which is an arguable precursor to .NET. Remnants of COM objects are found in various areas throughout the system, including inter-process (and inter-network) communications with network and local services. BITS Manipulation is fairly straightforward to implement for a software engineer familiar with the aforementioned methodology, BITS documentation, and experience using COM.
There is an already-written implementation that is available in Metasploit under exploit/windows/local/ntapphelpcachecontrol (MS15-001). The C++ source code offers a simple drop-in implementation for future proof-of-concepts, uncredited but likely written by James Forshaw of Google's Project Zero.
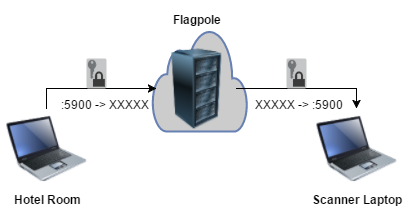
Scenario: You are at a client site, and want to be able to securely check on pentest scans from your hotel room.
There are three computers in this setup, which takes about 5 minutes.
The laptop on the client network (the VNC server)
The laptop you want to connect to the remote desktop with (the VNC client)
A flagpole server (Internet-facing SSH server)
Localhost port forwards managed by the Flagpole server sets up a secure tunnel between the machines.
No new ports will be externally exposed on any of the machines, and all network traffic will be encrypted through SSH. This method is preferable to other remote desktop solutions such as TeamViewer, where essentially the Flagpole server is controlled by a third party. For extra security, you can run your Flagpole SSH daemon on a high port and enforce certificate-based authentication.
This guide is for Linux, but the general methodology is probably possible on Windows using TigerVNC and PuTTY.
Step 1: Bind VNC Server to the Flagpole
On the VNC server machine (scanner laptop), issue the following commands:
Replace XXXXX with an unused port on Flagpole. Note that it is also possible to set a password for the x11vnc server. x11vnc defaults to port 5900, but can be changed with i.e. x11vnc -rfbport ###. This port is now forwarded by the port you assigned on the Flagpole.
Moshe Zioni of Apiiro talks about threat research and how to properly report discovered code vulnerabilities. We discuss the ways that vulnerabilities can find their way into code despite your best intentions, the difference between full disclosure and responsible disclosure, and being in the last generation to still grow up before the internet changed everything.
0:00 - Cybersecurity threat research 2:21 - Getting interested in computers 3:25 - Penetration testing and threat research 6:15 - Code vulnerabilities 10:58 - Research process for vulnerabilities 17:05 - Proper reporting of threats 23:11 - Full disclosure vs proper disclosure 25:53 - Current security threats 30:20 - Day-to-day work of security researchers 32:02 - Tips for working in pentesting 35:32 - What is Apiiro? 39:11 - Learn more about Moshe Zioni 39:42 - Outro
About Infosec Infosec believes knowledge is power when fighting cybercrime. We help IT and security professionals advance their careers with skills development and certifications while empowering all employees with security awareness and privacy training to stay cyber-safe at work and home. It’s our mission to equip all organizations and individuals with the know-how and confidence to outsmart cybercrime. Learn more at infosecinstitute.com.
This blog post accompanies the talk we gave at Insomni’hack 2022. The source code as well as the slides can be found at: https://github.com/scrt/avdebugger Introduction What can we do when a tool that we use during pentest engagements becomes detected by antivirus software? For a long time, the answer was: use a packer. After a … Continue reading Automatically extracting static antivirus signatures
It’s was a pleasure this year to meet you at the 2022 edition of our amazing security conference Insomni’hack ! With Splunk collaboration, we come back this year with “Splunk Boss Of The SOC” challenge. What is BOTS and his history Boss Of The SOC (BOTS) is a blue-team version of capture the flag competition. … Continue reading Splunk Boss Of The SOC (BOTS) @Insomni’hack
TEDx speaker, security researcher, host of the podcast MiC Club and all-around expert on security awareness and social engineering, Dr. Erik Huffman, is today's guest. Huffman spoke at the 2021 Infosec Inspire virtual conference, and for those of you who were captivated by his presentation, prepare for another hour of Dr. Huffman’s insights on why we need to teach security awareness from insight, rather than fear or punishment, how positive name recognition in an email can short-circuit our common sense and how to keep your extrovert family members from answering those questions online about your first pet and the street you lived on as a child.
0:00 - Clicking on phishing attacks 3:13 - First getting into cybersecurity 5:00 - Higher education and cybersecurity 7:41 - Cybersecurity research projects 10:05 - Impacting a cybersecurity breach 11:14 - Security awareness and social engineering 15:45 - Common social engineering tricks 23:00 - Changing security habits 30:15 - Cybersecurity communication avenues 33:30 - Getting family members cyber safe 38:00 - Harvesting info via social media 42:13 - Working in security awareness and threat research 44:54 - Importance of white papers and documentation 55:04 - Learn more about Erik Huffman 56:00 - Outro
About Infosec Infosec believes knowledge is power when fighting cybercrime. We help IT and security professionals advance their careers with skills development and certifications while empowering all employees with security awareness and privacy training to stay cyber-safe at work and home. It’s our mission to equip all organizations and individuals with the know-how and confidence to outsmart cybercrime. Learn more at infosecinstitute.com.
The analysis on this post was made from a Windows 10 x64 bits. If you are trying to compare the content of this post on a lower Windows version you will be disappointed since changes were made in Windows 10.
In my last post dedicated to the different ways to retrieve Syscall ID, I explained quickly how direct syscalls were performed in User Mode and remained vague about how it was processed in Kernel Mode.
The GDBug file is an ELF binary: It simply requires a valid serial that we should identify: The strings do not reveal anything, besides a fake flag which is not accepted: Anyway, the binary doesn’t seem to have particular protections: There only seems to be a basic anti-debug: But old versions of GDB and Radare2 … Continue reading GDBug write-up
The Apiculture challenges are dedicated to API attacks. The second level basically looks like a webpage dedicated to beehives: A quick look in the Developer Tools reveals a call to the /api/v4/products/ endpoint: This endpoint indeed permits to get the beehives JSON. It is also impacted by an Improper Data Filtering vulnerability since it contains … Continue reading Apiculture 2 write-up
The Apiculture challenges are dedicated to API attacks. It is basically a honey’s addict website: To solve the first challenge, we should pay attention to the call to the /api/products/ API: This endpoint provides information to the Angular front-end so that the page can be rendered in the browser… But it is impacted by an … Continue reading Apiculture 1 write-up
Marcus Fowler, senior vice president of strategic engagement and threats at DarkTrace, talks about attack vectors currently facing embedded journalists, their need to be available at all times for potential sources and how that openness makes them, their company and their confidential sources potential attack vectors for cybercriminals. Fowler talks about security hardening strategies that don’t compromise journalistic availability, the work of threat research and why people with natural interests in cybersecurity will have their career path choose them, not the other way around.
0:00 - Cybersecurity threats to journalists 3:00 - Getting into cybersecurity 5:50 - CIA cybersecurity training 7:18 - Joining DarkTrace in engagement threat roles 10:22 - Tasks with engagement threat jobs 13:22 - Cybersecurity work balance 17:49 - Advanced persistent threats against media 23:33 - Attack vectors journalists face 26:14 - Journalist cybersecurity savvy 28:08 - A truly secure journalism source 32:58 - Damage from a compromised source 36:05 - Main cybersecurity threats right now 38:37 - Qualifications needed to work as a threat researcher 42:52 - Safe cybersecurity jobs 47:05 - What is DarkTrace? 49:06 - Learn more about Marcus Fowler 50:11 - Outro
About Infosec Infosec believes knowledge is power when fighting cybercrime. We help IT and security professionals advance their careers with skills development and certifications while empowering all employees with security awareness and privacy training to stay cyber-safe at work and home. It’s our mission to equip all organizations and individuals with the know-how and confidence to outsmart cybercrime. Learn more at infosecinstitute.com.
Justin Pelletier is the director of the cyber range program at the ESL Global Cybersecurity Institute at the Rochester Institute of Technology. Infosec Skills has some great cyber ranges, but Pelletier shows the organization’s massive, immersive simulations. Because they’ve also included cyber range technology for beginning cybersecurity pros transitioning from other jobs, we cover what’s involved in making a good cyber range, how to break down those early barriers of fear and self-doubt and how quickly you can move into a cyber career after hands-on training.
0:00 - Immersive cyber ranges 3:13 - Getting into cybersecurity 5:06 - Studying data breaches 11:03 - Cybersecurity at the Department of Defense 14:02 - Cyber range education at the RIT 16:20 - Work of the Global Cyber Range 24:20 - Cyber range scenarios 38:30 - What makes a good cyber range? 42:00 - Successfully getting into cybersecurity 45:33 - Cyber range upskilling 48:47 - Cybersecurity hiring changes 51:30 - Learn more about the cyber range center 52:30 - Outro
About Infosec Infosec believes knowledge is power when fighting cybercrime. We help IT and security professionals advance their careers with skills development and certifications while empowering all employees with security awareness and privacy training to stay cyber-safe at work and home. It’s our mission to equip all organizations and individuals with the know-how and confidence to outsmart cybercrime. Learn more at infosecinstitute.com.
Su Windows, una condizione che può verificarsi è quella in cui processi ad altà integrità (anche noti come processi elevati) o processi SYSTEM possono avere handle a oggetti del kernel come altri processi/thread/token e si trovano successivamente in condizione di generare processi figli a media integrità. Se questi oggetti citati sono privilegiati (ad esempio sono a loro volta processi elevati/SYSTEM) e vengono ereditati dal processo figlio, si verifica una situazione in cui un processo a media integrità detiene un handle a una risorsa privilegiata e, se tale handle viene clonato e adeguatamente sfruttato, ciò può portare a privilege escalation. In questo post vedremo come ricercare in maniera automatizzata tali situazioni e come sfruttarle per elevare i propri privilegi o aggirare misure di sicurezza come UAC.
Introduzione
Salute compagni d’armi, qui è di nuovo last a infastidirvi. Ultimamente, insieme ai compagni di sventura degli Advanced Persistent Tortellini, mi sono messo alla ricerca di un tipo particolare vulnerabilità che si può trovare su applicativi per Windows e che raramente viene discusso: i leak di handle privilegiati. Notando l’assenza di risorse che approfondiscano l’argomento, abbiamo deciso di scrivere (in realtà tradurre) questo post.
Essenzialmente quello a cui miriamo è capire se e come possiamo cercare in maniera automatizzata processi non privilegiati (ossia a integrità media) che detengono handle verso risorse pregiate come processi ad alta integrità (anche noti come processi elevati), processi SYSTEM o thread appartenenti ai processi menzionati. A seguito di ciò dobbiamo assicurarci di poter aprire i processi non privilegiati in questione, clonare gli handle di interesse e infine sfruttarli per elevare i nostri privilegi. Vediamo rapidamente i requisiti per il tool che andremo a scrivere:
Deve eseguire a media integrità
Il SeDebugPrivilege non deve essere presente nel token del processo (normalmente non è presente nei token a media integrità in ogni caso)
Non può sfruttare bypass di UAC in quanto deve funzionare anche per utenti non amministratori
Il processo è abbastanza complesso, gli step che seguiremo saranno i seguenti:
Filtrare gli handle non interessanti - per il momento ci focalizzeremo solo sugli handle verso i processi, i token e i thread, in quanto sono quelli più facili da sfruttare
Filtrare gli handle che puntano a processi/thread/token a integrità inferiore a quella alta
Filtrare gli handle detenuti da processi con integrità superiore a media in quanto non possiamo agganciarci a questi senza il SeDebugPrivilege
Filtrare gli handle che non garantiscono un livello di accesso alla risorsa sufficiente
Verificare che siano rimasti handle (che quindi possono essere sfruttati per fare privilege escalation) ed eventualmente sfruttarli per elevare i nostri privilegi
Chiariamoci, è improbabile trovare questo genere di vulnerabilità su un sistema operativo appena installato (anche se, mai dire mai). Ciononostante, considerata la quantità di programmi di dubbia provenienza che i sysadmin installano e il livello di insicurezza che i programmi installati dai manufacturer attualmente mostrano, non è remota la possibilità di trovarne su sistemi in produzione da un pò.
Ora che abbiamo una vaga idea di quello che abbiamo intenzione di fare, ripassiamo i fondamentali.
Handles 101
Come ho discusso brevemente in questo thread su Twitter, Windows è un sistema operativo basato sugli oggetti (da non confondere con i linguaggi di programmazione a oggetti, che sono un’altra cosa). Con “basato sugli oggetti” intendiamo che ogni entità del sistema operativo (come processi, thread, mutex, semafori, file etc.) hanno un “oggetto” che li rappresenta nel kernel. Per i processi, per esempio, tale oggetto prende forma di una struttura dati chiamata _EPROCESS. Ogni processo ne ha una. Tutte le strutture _EPROCESS si trovano in kernelspace, ossia in quella porzione di memoria virtuale comune a tutti i processi e coincidente, nell’architettura x64, con i 128TB “alti” della memoria virtuale di un processo. Essendo una porzione di memoria condivisa, tutto ciò che è in kernelspace è uguale per tutti i processi, contrariamente a ciò che si trova in userspace, i 128TB “bassi” dello spazio di indirizzamento, che invece è diverso per ogni processo.
Essendo gli oggetti del kernel strutture di dati presenti in kernelspace non vi è modo per i normali processi di interagire direttamente con essi, in quanto ciò violerebbe tutti i principi di sicurezza su cui si poggia già in maniera molto precaria Windows. Per poter interagire con gli oggetti menzionati, Windows mette a disposizione dei processi un meccanismo di indirezione che si appoggia a variabili particolari di tipo HANDLE (e tipi derivati come SC_HANDLE). Un handle altro non è che una variabile che contiene un numero a 64 bit, sempre per quanto riguarda l’architettura x64. Tale numero rappresenta un indice in una tabella particolare ospitata in kernelspace, diversa per ogni processo. Ogni riga di questa tabella (nota come handle table) contiene l’indirizzo dell’oggetto cui l’handle fa riferimento e il livello di accesso all’oggetto che l’handle concede al processo che lo detiene. L’indirizzo a questa tabella è contenuto nel membro ObjectTable (che è di tipo _HANDLE_TABLE * e quindi punta a una variabile _HANDLE_TABLE) della struttura _EPROCESS di ogni processo.
Per rendere digeribile questo impasto indigesto di nozioni tecniche, vediamo un esempio. Per ottenere un handle a un processo si utilizza la funzione OpenProcess, esposta dalle API di Windows nella libreria kernel32.dll. Di seguito la definizione della funzione citata:
dwDesiredAccess è una DWORD (double word - intero a 32 bit) che specifica il livello di accesso all’oggetto processo che l’handle deve garantire
bInheritHandle è un valore booleano (vero/falso) che serve a specificare se l’handle ritornato dalla funzione deve essere ereditabile, significando che, nel caso il processo chiamante successivamente crei processi figli, l’handle ritornato da OpenProcess verrebbe copiato, assieme al livello di accesso, nella tabella degli handle del processo figlio
dwProcessId è una DWORD usata per specificare quale processo vogliamo che OpenProcess apra (passando in input il Process ID - PID del processo) e quindi a quale processo farà riferimento l’handle ritornato dalla funzione
Se il processo chiamante ha privilegi sufficienti per aprire il processo target, OpenProcess ritornerà un handle al processo target stesso, con il livello di accesso specificato.
Nella riga di codice a seguire proverò ad aprire un handle al processo System (che ha sempre PID 4), specificando al kernel che il livello di accesso richiesto per l’handle equivale a PROCESS_QUERY_LIMITED_INFORMATION, valido per richiedere solo un subset ristretto di informazioni relative al processo in questione. Inoltre, passando true come secondo argomento, specifico che l’handle ritornato dalla funzione deve essere ereditato da eventuali processi figli. In caso tutto vada per il meglio, la variabile hProcess (di tipo HANDLE) conterrà l’handle richiesto.
Dietro le quinte, il kernel effettua una serie di controlli di sicurezza sul contesto di sicurezza (anche noto come token) del processo chiamante. Se tali controlli danno esito positivo, il kernel prende il PID passato in input, risolve l’indirizzo della _EPROCESS associata e lo copia nella handle table del processo chiamante assieme alla access mask (i livello di accesso) richiesta. L’indice della riga della handle table appena riempita viene successivamente ritornato al codice in usermode e dato al processo come valore di ritorno di OpenProcess. Cose simili avvengono per le funzioni OpenThread e OpenToken.
Visualizzare e ottenere informazioni sugli handle
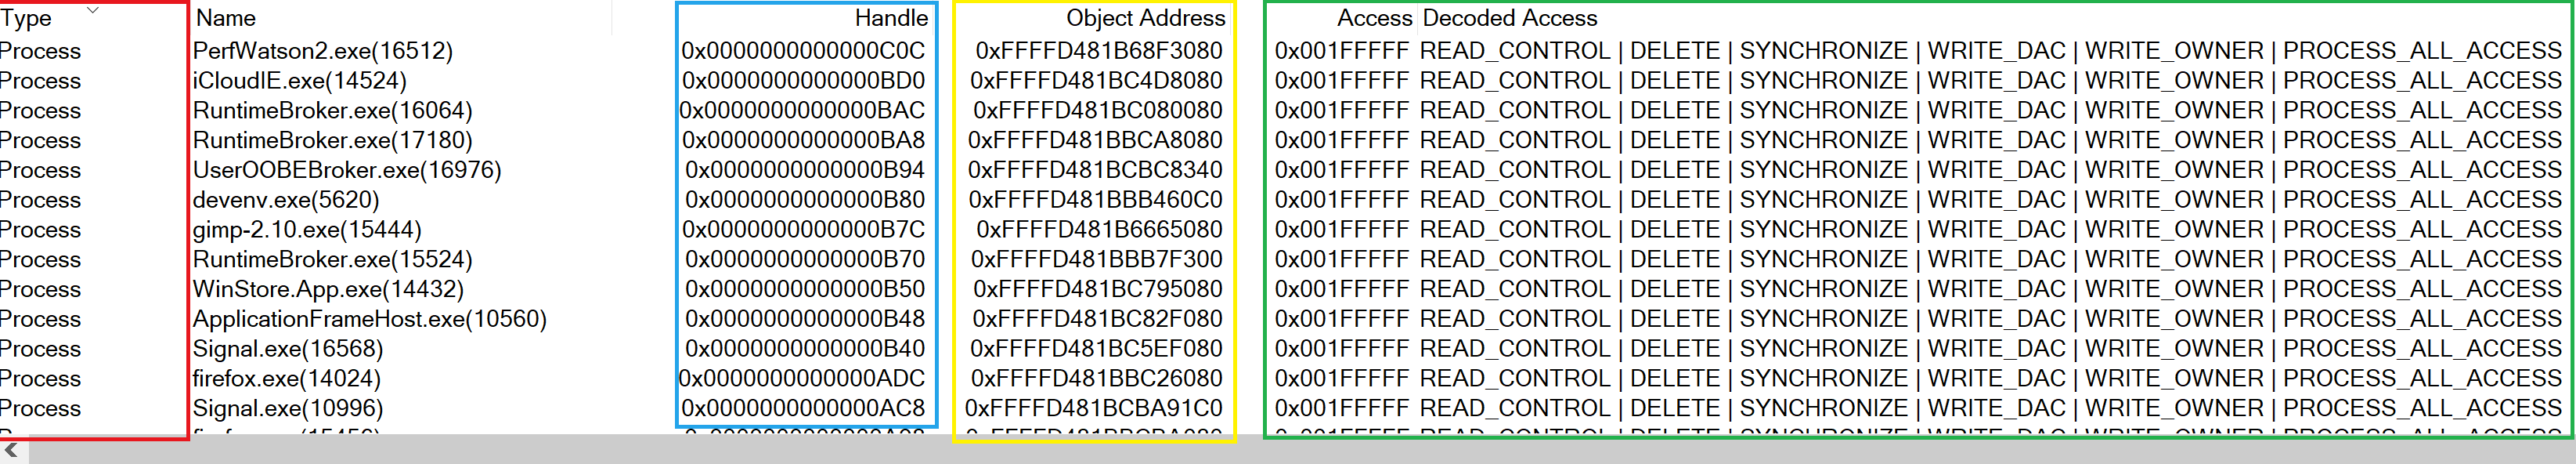
Come abbiamo introdotto precedentemente, i valori contenuti dagli handle sono essenzialmente indici di una tabella. Ogni riga della tabella contiene, fra le altre cose, l’indirizzo dell’oggetto cui l’handle fa riferimento e il livello di accesso all’oggetto che l’handle concede. Possiamo visualizzare graficamente queste informazioni attraverso strumenti come Process Hacker o Process Explorer:
Da questo screenshot di Process Explorer possiamo ricavare una serie di informazioni:
Riquadro rosso: il tipo di oggetto a cui l’handle si riferisce
Casella blu: il valore dell’handle (l’indice effettivo della riga nella tabella)
Casella gialla: l’indirizzo dell’oggetto a cui si riferisce l’handle
Riquadro verde: la maschera di accesso e il suo valore decodificato (le maschere di accesso sono macro definite nell’header Windows.h). Questo ci dice quali privilegi sono concessi al detentore dell’handle sull’oggetto;
Per ottenere questo genere di informazioni ci sono una serie di metodi. Tra questi, il più pratico e utile è utilizzare la funzione NtQuerySystemInformation, parte delle API native esposte tramite ntdll.dll.
Chiamando la funzione in questione e passando come primo argomento SystemHandleInformation (che ha valore 0x10), il secondo argomento sarà riempito con una struttura non documentata di tipo _SYSTEM_HANDLE_INFORMATION contenente un array di variabili SYSTEM_HANDLE dove ognuna di queste contiene informazioni su un handle aperto e la dimensione dell’array stesso (HandleCount):
Tutti gli handle presenti nel sistema operativi al momento della chiamata alla funzione sono inseriti nell’array in questione. La struttura di SYSTEM_HANDLE non è documentata, qui di seguito la definizione.
La struttura in questione presenta una serie di membri che forniscono informazioni interessanti riguardo l’handle cui la struttura stessa si riferisce. Andiamo ad approfondirli uno a uno:
ProcessId: il PID del processo che detiene cui la struttura fa riferimento
Handle: il valore dell’handle, cioè l’indice nella riga della handle table
Object: l’indirizzo in kernelspace dell’oggetto cui l’handle fa riferimento
ObjectTypeNumber: una variabile non documentata di tipo BYTE che identifica il tipo di oggetto cui l’handle fa riferimento. Per interpretare questo valore dobbiamo fare un pò di reverse engineering, ma per ora ci basta sapere che gli handle riferiti a processi hanno questo valore settato a 0x7, quelli riferiti ai thread a 0x8 e quelli riferiti ai token a 0x5
GrantedAccess: il livello di accesso all’oggetto che l’handle garantisce. Si possono richiedere livelli di accesso diversi per ogni oggetto. Per esempio valori ammissibili per i processi sono PROCESS_ALL_ACCESS, PROCESS_CREATE_PROCESS etc.
Vediamo ora brevemente come chiamare NtQuerySystemInformation utilizzando il C++.
Nel blocco di codice riportato facciamo uso delle seguenti variabili:
queryInfoStatus che conterrà il valore di ritorno di NtQuerySystemInformation e che utilizzeremo per capire se la funzione è stata eseguita con successo o meno
tempHandleInfo che conterrà i dati relativi a tutti gli handle sul sistema che NtQuerySystemInformation recupera per noi
handleInfoSize che è una “ipotesi” di quanta memoria sarà utilizzata per memorizzare i dati ritornati dalla funzione - questa variabile verrà raddoppiata ogni volta che NtQuerySystemInformation restituirà STATUS_INFO_LENGTH_MISMATCH che è un valore che ci dice che lo spazio allocato non è sufficiente
handleInfo che è un puntatore alla porzione di memoria che NtQuerySystemInformation riempirà con i dati di cui abbiamo bisogno (cioè la struttura _SYSTEM_HANDLE_INFORMATION)
Non fatevi confondere dal ciclo while utilizzato, è solo un modo di chiamare la funzione finché la memoria allocata non è sufficiente. Questo metodo è impiegato abbastanza spesso quando si ha a che fare con funzioni appartenenti alle API native di Windows.
I dati recuperati dalla funzione NtQuerySystemInformation possono essere poi parsati semplicemente iterando sull’array ritornato, come nell’esempio a seguire:
Come si può evincere dal precedente blocco di codice, abbiamo la variabile handle il cui tipo è SYSTEM_HANDLE (nascosto dall’uso della keyword auto). Usiamo successivamente i membri della struttura SYSTEM_HANDLE salvata in handle per stampare a schermo le informazioni di interesse.
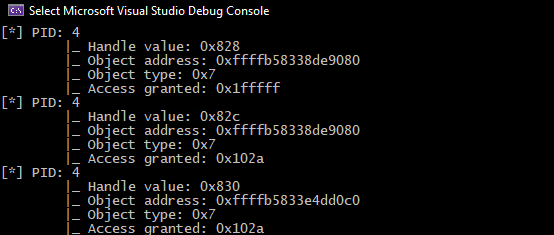
In questo screenshot possiamo osservare 3 handle detenuti dal processo con PID 4 (che ricordiamo essere il processo System). Tutti questi handle sono riferiti a oggetti di tipo processo, come si può evincere dal object type 0x7. Possiamo inoltre dedurre che i primi due handle sono riferiti allo stesso processo, in quanto l’object address è uguale, ma solo il primo dei 2 garantisce al processo System un accesso al processo rilevante, in quanto l’access granted ha valore 0x1fffff, che è il valore tradotto di PROCESS_ALL_ACCESS.
Sfortunatamente nella mia ricerca non ho trovato un modo diretto ed efficiente di estrarre i PID dei processi a cui gli handle fanno riferimento (a partire dal membro ObjectAddress). Vedremo dopo come aggirare questo problema, per ora limitiamoci a confrontare le informazioni che abbiamo stampato a schermo con quelle estratte tramite Process Explorer.
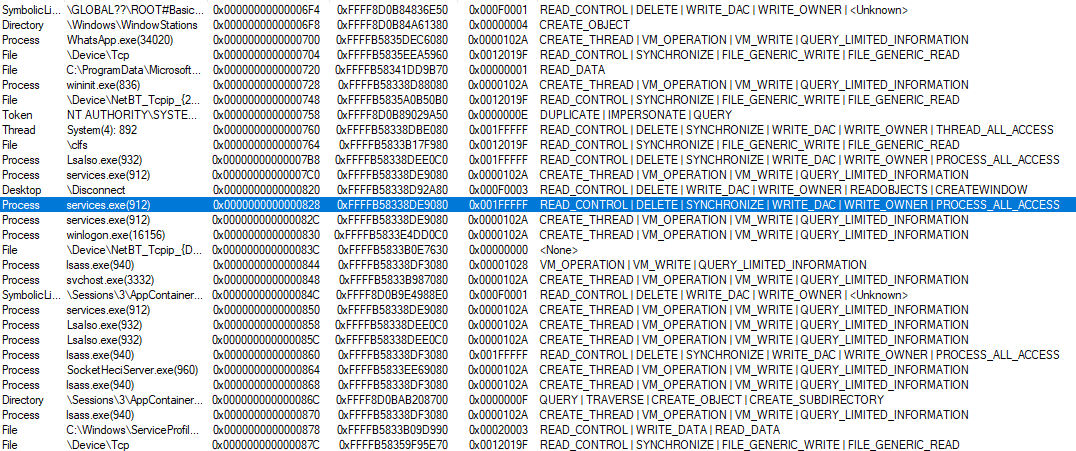
Come potete vedere, l’handle con valore 0x828 è, come ci aspettavamo, di tipo processo e si riferisce al processo services.exe. Sia l’indirizzo in kernelspace dell’oggetto che l’accesso garantito dall’handle corrispondono e, guardando sulla destra la maschera d’accesso decodificata, potete vedere che il valore decodificato è PROCESS_ALL_ACCESS.
Ciò è molto interessante perché sostanzialmente ci permette di avere visibilità sulla handle table di qualsiasi processo, a prescindere dal suo contesto di sicurezza o dal livello di protezione (PP o PPL) che tale processo ha.
A caccia di vulnerabilità
Ottenere il PID di un processo a partire dall’indirizzo della sua _EPROCESS
Nella mia ricerca non ho trovato un modo diretto ed efficiente di associare il un SYSTEM_HANDLE di tipo processo/thread al processo/thread a cui questo handle si riferisce. Il campo ProcessId della struttura infatti si riferisce al processo che detiene l’handle in questione, non al processo/thread cui questo punta, del quale l’unica informazione che abbiamo è l’indirizzo della _EPROCESS o _ETHREAD in kernelspace tramite il membro Object. Per tal ragione ho adottato un approccio poco ortodosso (per non dire direttamente “brutto”) che però mi permette di recuperare in maniera veloce ed efficiente l’associazione indirizzo in kernelspace - PID/TID del processo/thread puntato. A tal riguardo, vediamo i presupposti (alcuni dei quali già introdotti precedentemente) per arrivare a tale soluzione:
La struttura SYSTEM_HANDLE contiene il membro Object, che contiene l’indirizzo dell’oggetto del kernel, che è in kernelspace
In Windows, tutti i processi hanno il proprio spazio di indirizzamento privato, ma la porzione di tale spazio denominata kernelspace (128 TB superiori per i processi a 64 bit) è la stessa per tutti i processi. Gli indirizzi in kernelspace contengono gli stessi dati in tutti i processi
Quando abbiamo a che fare con handle riferiti a processi, il membro Object di SYSTEM_HANDLE punta alla struttura _EPROCESS del processo stesso. Per i thread la struttura invece è la _ETHREAD, per la quale valgono gli stessi discorsi di _EPROCESS
Ogni processo ha una sola struttura _EPROCESS
Possiamo ottenere un handle per qualsiasi processo, indipendentemente dal suo contesto di sicurezza, chiamando OpenProcess e specificando PROCESS_QUERY_LIMITED_INFORMATION come access mask
Chiamando NtQuerySystemInformation possiamo enumerare tutti gli handle aperti da tutti i processi in esecuzione al momento della chiamata
Da questo considerazioni possiamo dedurre quanto segue:
Il membro Object di due diverse strutture SYSTEM_HANDLE sarà uguale se l’handle è aperto sullo stesso oggetto, indipendentemente dal processo che detiene l’handle (es. due handle aperti sullo stesso file da due diversi processi avranno lo stesso valore Object)
Due handle allo stesso processo aperti da due processi diversi avranno un valore Object corrispondente
Lo stesso vale per thread, token, ecc.
Quando chiamiamo NtQuerySystemInformation possiamo enumerare gli handle detenuti anche dal nostro stesso processo
Se otteniamo un handle a un processo tramite OpenProcess, conosciamo il PID di detto processo e, tramite NtQuerySystemInformation, l’indirizzo in kernelspace della _EPROCESS associata
Avete intuito in che direzione stiamo andando? Se riusciamo ad aprire un handle con accesso PROCESS_QUERY_LIMITED_INFORMATION a ogni processo e successivamente recuperare tutti gli handle aperti tramite NtQuerySystemInformation possiamo filtrare gli handle non detenuti dal nostro processo ed estrarre dai rimanenti il contenuto del membro Object, riuscendo così ad associare il PID di ogni processo all’indirizzo della relativa struttura _EPROCESS. Ovviamente lo stesso può essere effettuato per i thread usando OpenThread e THREAD_QUERY_INFORMATION_LIMITED come livello di accesso per gli handle richiesti.
Per aprire in maniera efficiente i processi e i thread in esecuzione ci appoggiamo alle funzioni esposte dalla libreria TlHelp32.h, che in buona sostanza ci permette di effettuare un’istantanea dello stato del sistema operativo al momento dell’esecuzione e ricavare quanti e quali processi sono in esecuzione, con tanto di PID.
Il seguente blocco di codice mostra come effettuare l’istantanea di cui abbiamo parlato e successivamente iterarci sopra per aprire un handle a ogni processo.
// mappa che conterrà l'associazione handle - PIDstd::map<HANDLE,DWORD>mHandleId;// crea l'istantanea utilizzando CreateToolhelp32Snapshotwil::unique_handlesnapshot(CreateToolhelp32Snapshot(TH32CS_SNAPPROCESS,0));PROCESSENTRY32WprocessEntry={0};processEntry.dwSize=sizeof(PROCESSENTRY32W);// punta la struttura processEntry al primo processo dell'istantaneaautostatus=Process32FirstW(snapshot.get(),&processEntry);// inizia a iterare, aggiornando di volta in volta processEntry mentre si cerca di aprire ogni singolo processo, associandone il PID al valore dell'handle apertostd::cout<<"[*] Iterating through all the PID/TID space to match local handles with PIDs/TIDs...\n";do{autohTempHandle=OpenProcess(PROCESS_QUERY_LIMITED_INFORMATION,FALSE,processEntry.th32ProcessID);if(hTempHandle!=NULL){// if we manage to open a shHandle to the process, insert it into the HANDLE - PID map at its PIDth indexmHandleId.insert({hTempHandle,processEntry.th32ProcessID});}}while(Process32NextW(snapshot.get(),&processEntry));
Iniziamo col definire una std::map, ossia una classe simile a un dizionario per il C++, la quale ci permetterà di tenere traccia dell’associazione fra PID del processo aperto e il valore dell’handle riferito al processo aperto. Chiameremo questa mappa mHandleId.
Fatto ciò, procediamo a effettuare l’istantanea dello stato del sistema utilizzando CreateToolhelp32Snapshot e specificando che vogliamo che l’istantanea contenga informazioni relative ai processi in esecuzione (utilizzando il valore TH32CS_SNAPPROCESS come argomento). L’istantanea creata è assegnata alla variabile snapshot di tipo wil::unique_handle, una classe C++ della Windows Implementation Library (WIL) che ci permette di gestire in maniera sicura (attraverso il paradigma RAII e altre facilities del C++) i tipi HANDLE-like. Successivamente procediamo a definire e inizializzare a zero la variabile di tipo PROCESSENTRY32W chiamata processEntry, che conterrà le informazioni di ogni processo mentre iteriamo sull’istantanea.
In seguito procediamo a chiamare Process32FirstW e riempiere processEntry con i dati del primo processo dell’istantanea. Come già accennato, per ogni processo chiameremo OpenProcess con PROCESS_QUERY_LIMITED_INFORMATION e, se la chiamata termina con successo, salviamo la coppia formata dal valore dell’handle e dal PID del processo aperto nella mappa mHandleId.
Al termine di ogni iterazione del ciclo while eseguiamo la funzione Process32NextW e riempiamo processEntry con i dati del processo successivo contenuto nell’istantanea, fin quando non abbiamo esaminato tutti i processi dell’istantanea. Al termine del ciclo abbiamo una mappatura 1 a 1 di tutti gli handle aperti dal nostro processo con i rispettivi PID dei processi cui gli handle citati fanno riferimento. Procediamo alla fase successiva!
è arrivato il momento di creare la mappa che associerà handle ai processi aperti dal nostro processo e gli indirizzi in kernelspace delle strutture _EPROCESS dei suddetti processi. Per fare ciò dobbiamo recuperare tutti gli handle del sistema operativo e filtrare quelli che non appartengono al nostro processo. Abbiamo già visto come recuperare tutti gli handle aperti utilizzando NtQuerySystemInformation, a questo punto si tratta solo di analizzare il membro ProcessId della struttura SYSTEM_HANDLE e compararlo con il PID del nostro processo, recuperato tramite la funzione GetCurrentProcessId.
Come si può evincere dal blocco di codice a seguire, filtriamo gli handle che non appartengono al nostro processo, dopodiché prendiamo in considerazione solo quelli che fanno riferimento a un processo e ne insieriamo l’associazione fra handle e indirizzo in kernelspace nella mappa mAddressHandle.
std::map<uint64_t,HANDLE>mAddressHandle;for(uint32_ti=0;i<handleInfo->HandleCount;i++){autohandle=handleInfo->Handles[i];// skip handles not belonging to this processif(handle.ProcessId!=pid)continue;else{// switch on the type of object the handle refers toswitch(handle.ObjectTypeNumber){caseOB_TYPE_INDEX_PROCESS:{mAddressHandle.insert({(uint64_t)handle.Object,(HANDLE)handle.Handle});// fill the ADDRESS - HANDLE map break;}default:continue;}}}
Potrebbe esservi saltato all’occhio il fatto che usiamo uno switch al posto di un comune if. Il motivo è che questo pezzo di codice è estratto e modificato da un tool che come Advanced Persistent Tortellini stiamo sviluppando chiamato UpperHandler. UpperHandler è sviluppato specificamente per trovare vulnerabilità di questo tipo, non solo su processi ma anche su thread e altro (ecco perché lo switch). UpperHandler sarà rilasciato quando lo riterremo opportuno.
Adesso che abbiamo riempito le due mappe mHandleId e mAddressHandle, recuperare il PID di un processo a partire dall’indirizzo della sua _EPROCESS è in realtà un gioco da ragazzi.
Iniziamo con il salvare l’indirizzo della _EPROCESS nella variabile address, dopodiché cerchiamo la coppia che contiene tale indirizzo nella mappa mAddressHandle, estraendo poi dalla coppia l’handle associato. A questo punto, con l’handle, recuperiamo dalla mappa mHandleId la coppia che contiene il PID del processo cui l’handle fa riferimento e recuperiamo il PID.
Trovare automagicamente l’ago nel pagliaio
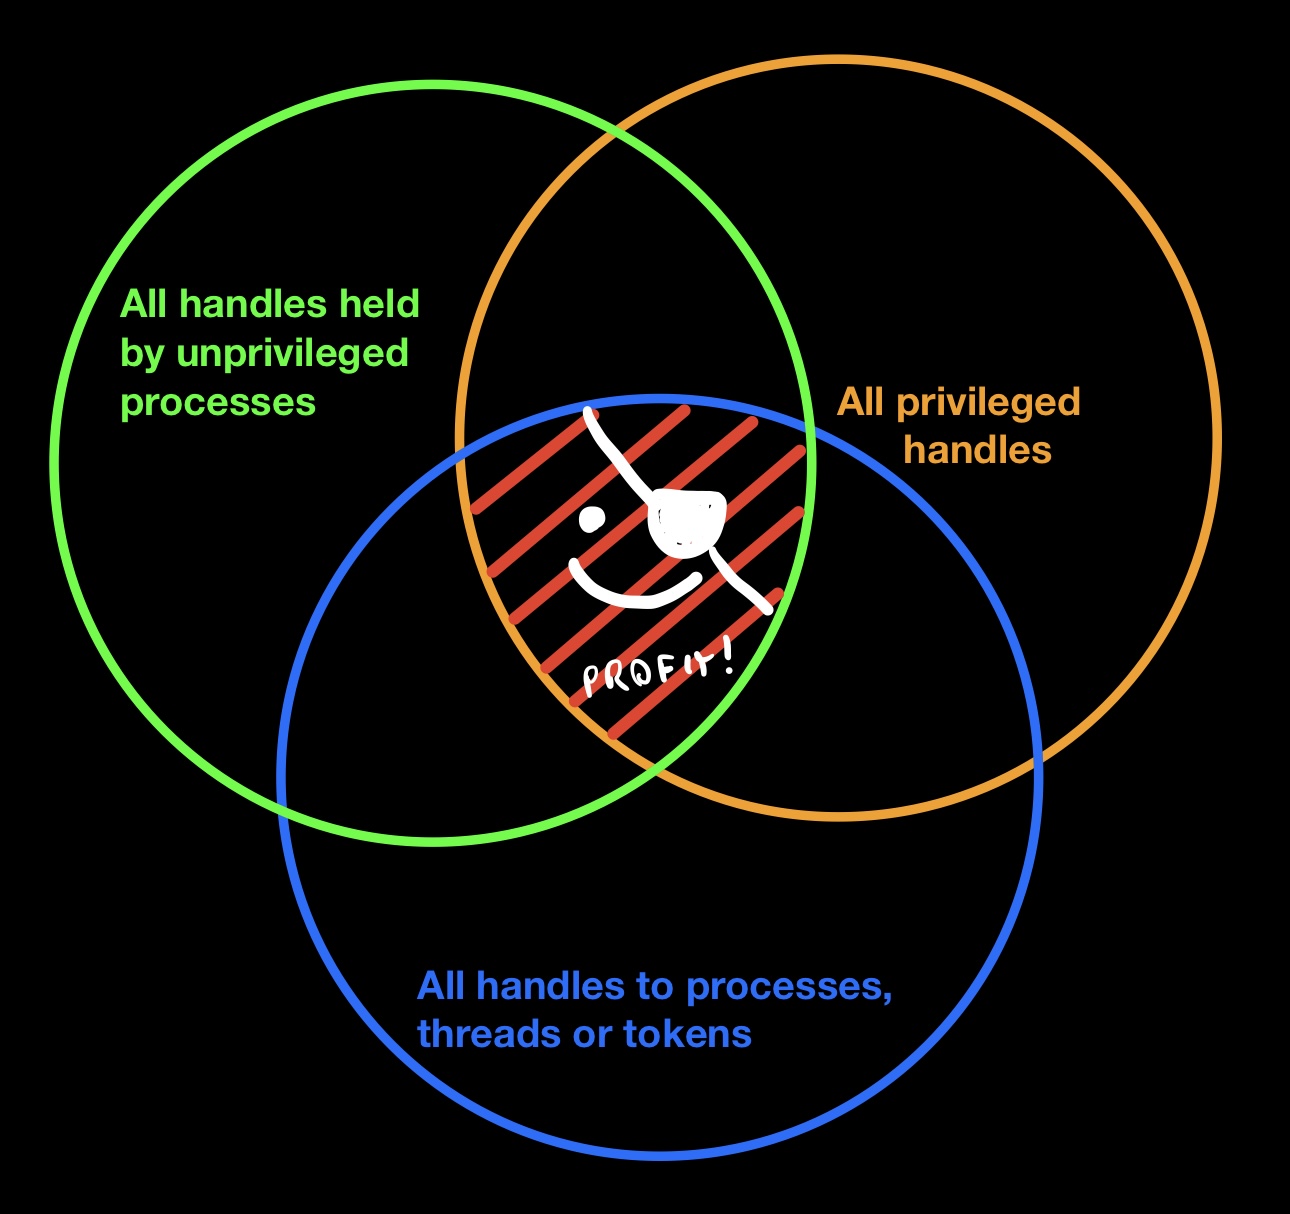
Adesso che abbiamo un metodo veloce e affidabile di recuperare i PID a partire dagli indirizzi in kernelspace della _EPROCESS, possiamo concentrarci sul cercare situazioni in cui processi a bassa integrità hanno handle privilegiati a processi ad alta integrità. Ma cosa si intende con la locuzione “handle privilegiato”? Bryan Alexander lo esprime in maniera abbastanza chiara in questo blogpost, ma essenzialmente, quando si parla di handle facenti riferimento a processi, i livelli di accesso (quindi le flag, essendo l’access mask degli handle una bitmask) che rendono un handle privilegiato sono i seguenti:
PROCESS_ALL_ACCESS
PROCESS_CREATE_PROCESS
PROCESS_CREATE_THREAD
PROCESS_DUP_HANDLE
PROCESS_VM_WRITE
Se trovare un handle verso un processo ad alta integrità con uno o più di questi livelli di accesso in un processo a integrità media, avete fatto jackpot. Vediamo come incassare la vincita:
std::vector<SYSTEM_HANDLE>vSysHandle;for(uint32_ti=0;i<handleInfo->HandleCount;i++){autosysHandle=handleInfo->Handles[i];autocurrentPid=sysHandle.ProcessId;if(currentPid==pid)continue;// skip our process' handlesautointegrityLevel=GetTargetIntegrityLevel(currentPid);if(integrityLevel!=0&&integrityLevel<SECURITY_MANDATORY_HIGH_RID&&// the integrity level of the process must be < HighsysHandle.ObjectTypeNumber==OB_TYPE_INDEX_PROCESS){if(!(sysHandle.GrantedAccess==PROCESS_ALL_ACCESS||sysHandle.GrantedAccess&PROCESS_CREATE_PROCESS||sysHandle.GrantedAccess&PROCESS_CREATE_THREAD||sysHandle.GrantedAccess&PROCESS_DUP_HANDLE||sysHandle.GrantedAccess&PROCESS_VM_WRITE))continue;autoaddress=(uint64_t)(sysHandle.Object);autofoundHandlePair=mAddressHandle.find(address);if(foundHandlePair==mAddressHandle.end())continue;autofoundHandle=foundHandlePair->second;autohandlePidPair=mHandleId.find(foundHandle);autohandlePid=handlePidPair->second;autohandleIntegrityLevel=GetTargetIntegrityLevel(handlePid);if(handleIntegrityLevel!=0&&handleIntegrityLevel>=SECURITY_MANDATORY_HIGH_RID// the integrity level of the target must be >= High){vSysHandle.push_back(sysHandle);// save the interesting SYSTEM_HANDLE}}}
In questo blocco di codice iniziamo con il definire un std::vector chiamato vSysHandle che conterrà tutti i SYSTEM_HANDLE interessanti. Successivamente chiamiamo NtQuerySystemInformation e iteriamo sui dati ritornati dalla funzione, solo che questa volta saltiamo gli handle detenuti dal nostro processo per focalizzarci su quelli degli altri processi. Per ognuno di questi processi controlliamo il livello di integrità con la funzione GetTargetIntegrityLevel, una funzione di supporto che ho scritto e riadattato da una serie di PoC online e di funzioni disponibili su MSDN. Tale funzione ritorna una DWORD contenente il livello di integrità del token associato al PID su cui è chiamata.
Una volta recuperato il livello di integrità del processo che detiene l’handle, ci assicuriamo sia minore di SECURITY_MANDATORY_HIGH_RID, poiché siamo interessati solo ai processi a media e bassa integrità, e ci assicuriamo inoltre che il SYSTEM_HANDLE si riferisca a risorse di tipo processo (0x7). Smarcato anche questo, procediamo a controllare il livello di accesso. Se questo non è PROCESS_ALL_ACCESS o non contiene nemmeno una delle flag di cui abbiamo parlato prima, lo saltiamo. Viceversa, proseguiamo e controlliamo il livello di integrità del processo puntato dal SYSTEM_HANDLE. Se è ad alta integrità o (meglio ancora) SYSTEM, lo salviamo dentro il vettore vSysHandle.
Questo è quanto, auspicabilmente abbiamo il nostro vettore pieno (o semi vuoto) di handle vulnerabili, vediamo come exploitarli.
Gaining the upper hand(le) - questa va bene così e non la traduco :P
Abbiamo separato gli aghi dalla paglia, e mò? Nuovamente, il blogpost di dronesec dettaglia cosa può essere fatto con ogni diverso livello di accesso, ma per ora concentriamoci su quello più semplice: PROCESS_ALL_ACCESS.
Prima di tutto iniziamo con l’agganciarci al processo che detiene l’handle vulnerabile e procediamo a clonare l’handle in questione.
Quest’operazione è abbastanza semplice e, se omettiamo di inserire la logica di controllo degli errori, fattibile in poche righe di codice. Iniziamo con l’aprire il processo che detiene l’handle vulnerabile con il livello di accesso PROCESS_DUP_HANDLE, che è il livello di accesso minimo per poter clonare gli handle detenuti dal processo, e successivamente usiamo la funzione DuplicateHandle per clonare l’handle cui siamo interessati (il cui valore è contenuto nel membro Handle della struttura sysHandle) e salvarne il valore nella variabile clonedHandle.
A questo punto clonedHandle conterrà un handle PROCESS_ALL_ACCESS a un processo ad alta integrità. Da qui in avanti si segue la procedura standard per creare un nuovo processo (in questo caso cmd.exe) che erediti il token dal processo di cui abbiamo l’handle PROCESS_ALL_ACCESS. La tecnica utilizzata è un classico esempio di Parent PID spoofing utilizzando la funzione CreateProcessW, così come spiegato in questo post del buon spotless
Today's podcast highlights implementation privacy, policy privacy and all things privacy with privacy expert and Infosec Skills author and instructor Chris Stevens. From his years in the government’s office of national intelligence to his multiple IAPP certifications, Stevens is happy to tell you everything you ever wanted to know about careers in privacy, around privacy and careers that would be better with a helping of privacy skills on top!
0:00 - Cybersecurity privacy 3:30 - Getting interested in cybersecurity 4:40 - Cybersecurity in the Department of Defense 6:00 - Computer science studies 8:50 - Cybersecurity research 11:05 - Information privacy and privacy professionals 14:48 - What does U.S. privacy cover? 19:10 - Privacy certifications and more 21:36 - Privacy differences across countries 24:50 - Difference in privacy certifications 27:16 - Learning about privacy 30:16 - Positions available for information privacy 33:50 - Educational steps to work in privacy 36:00 - Getting a job in privacy 37:57 - Entry-level work in privacy roles 42:44 - How to stay on track in lifelong learning 46:37 - Cybersecurity education in the future 48:19 - Outro
About Infosec Infosec believes knowledge is power when fighting cybercrime. We help IT and security professionals advance their careers with skills development and certifications while empowering all employees with security awareness and privacy training to stay cyber-safe at work and home. It’s our mission to equip all organizations and individuals with the know-how and confidence to outsmart cybercrime. Learn more at infosecinstitute.com.
Steve Pereira of Visible Value Stream Consulting discusses DevOps, SecOps, DevSecOps and his own lifelong love of streamlining projects. You’ll hear how his dad’s job with Bell Telephone facilitated his early explorations, the intersections of DevOps and Agile, the ever-important security component of it all and why following your interests and not the big money payouts might not work in the short run, but ultimately will get you where you want to go in the end.
0:00 - Intro 2:35 - Cybersecurity origin story 6:02 - Build and release engineering 9:27 - Tech and business 11:20 - DevOps projects 12:10 - Automating yourself out of your job 13:44 - What is DevOps? 23:45 - Method for DevOps success 31:47 - Development team vs security team 36:03 - DevOps history and Agile 44:50 - How do I work in DevOps? 52:09 - Visible Value Stream Consulting 54:42 - Outro
About Infosec Infosec believes knowledge is power when fighting cybercrime. We help IT and security professionals advance their careers with skills development and certifications while empowering all employees with security awareness and privacy training to stay cyber-safe at work and home. It’s our mission to equip all organizations and individuals with the know-how and confidence to outsmart cybercrime. Learn more at infosecinstitute.com.
Digital forensics analysts collect, analyze and interpret digital evidence to reconstruct potential criminal events and/or aid in preventing unauthorized actions from threat actors. They help recover data like documents, photos and emails from computer or mobile device hard drives and other data storage devices, such as zip folders and flash drives, that have been deleted, damaged or otherwise manipulated. Digital forensic analysts carefully follow chain of custody rules for digital evidence and provide evidence in acceptable formats for legal proceedings.
0:00 - Intro 0:26 - What is a digital forensics analyst? 0:57 - Digital forensics specialties 1:24 - How to become a digital forensics analyst 2:17 - Skills needed to be a digital forensics analyst 3:34 - Common tools for a digital forensics analyst 4:42 - Using digital forensics tools 5:17 - Digital forensics analyst jobs 6:30 - Moving from digital forensics to new roles 7:17 - Get started in digital forensics 8:18 - Outro
About Infosec Infosec believes knowledge is power when fighting cybercrime. We help IT and security professionals advance their careers with skills development and certifications while empowering all employees with security awareness and privacy training to stay cyber-safe at work and home. It’s our mission to equip all organizations and individuals with the know-how and confidence to outsmart cybercrime. Learn more at infosecinstitute.com.
As mentioned in our previous post, Part II is a continuation of our research sparked by changes found in the revised Furbo 2.5T devices. This post specifically covers a command injection vulnerability (CVE-2021-32452) discovered in the HTTP server running on the Furbo 2.5T devices. If you happened to watch our talk at the LayerOne conference, you may have already seen this in action!
Background
After purchasing an additional Furbo to test a finalized version of our RTSP exploit on a new, unmodified Furbo, we found that our RTSP exploit wasn’t working. The RTSP service still appeared to be crashing, however it was not restarting so our strategy of brute-forcing the libc base address was no longer valid. After running an nmap scan targeting the new device we quickly realized something was different.
This Furbo had telnet and a web server listening. Physical inspection of the device revealed that the model number was 2.5T vs 2.
We disassembled the new Furbo and while there were some slight hardware differences, we were still able to get a root shell via UART in the same manner as the Furbo 2.
We decided to take a look at the web server first to see what functionality it included.
Web Server Reverse Engineering
Browsing to the IP of the Furbo presented us with an Authentication Required window. Observing the request indicated that the server was utilizing Digest Authentication, which was confirmed by looking at the server configuration.
The following is a snippet from /etc/lighttpd/lighttpd.conf:
However, when entering the credentials admin:admin we were still met with an Access Denied response. If you have a keen eye you may have noticed that the realm specified in the lighttpd.conf file is different from that specified in the webpass.txt file. This mismatch was preventing the authentication from succeeding. After some additional testing, we found that we could intercept the server response and modify the realm the Furbo was sending to the browser to create the Digest Authentication header. Intercepting the response and setting the realm to ycam.com allowed us to successfully authenticate to the web server.
Note the browser prompt displays ycam.com after we modified the response in Burp Suite. After entering the username and password we had access to the web server.
Once we were able to interact with the web application, observing some requests in burp immediately revealed some interesting responses. The web application was utilizing a CGI executable, ldc.cgi, which appeared to be taking multiple parameters and inserting them into a command, /usr/local/bin/test_ldc, which then gets executed on the Furbo.
This looked like a good candidate for command injection and after a few more tests, we found our suspicions were correct! We attempted to inject cat /etc/passwd into various parameters.
As seen above, a payload of ;+cat/etc/passwd+; in the X parameter was injected into the /usr/local/bin/test_ldc command and the results were included in the response! The web server was also running as root, so we had code execution as root on the new Furbo. The mode, X, Y, zoom_num, zoom_denum, pano_h_fov parameters were all vulnerable. This exploit is much more reliable than the RTSP buffer overflow as it does not involve memory corruption and the web server does not crash.
After confirming via dynamic testing, we grabbed the ldc.cgi executable off of the Furbo and popped it into Ghidra to see exactly what was happening under the hood.
The above snippet shows the various parameters we observed being retrieved and stored in variables, which then are used to build the cmd variable via the first snprintf() call. No sanitization is performed on any of the values received from the HTTP request. The cmd variable is then passed directly to a system() call seen at the bottom of the screen shot.
We created a python script that calculates the Authorization Digest header using the proper realm to automate the command injection and retrieval of results:
We also turned the exploit into a metasploit module:
Attempt to contact Ambarella via LinkedIn, web form, and email
3/17/2021
Attempt to re-establish contact with Tomofun
3/19/2021
Attempt to contact Ambarella via web form
4/26/2021
Applied for CVE
5/6/2021
Presented at LayerOne
5/29/2021
Assigned CVE-2021-32452
10/6/2021
Publish Blog Post
10/12/2021
Conclusion
The command injection vulnerability allows for consistent, reliable exploitation as it does not involve memory corruption like the RTSP buffer overflow which proved more difficult to exploit. We suspect that the command injection vulnerability may also be present in other devices that utilize Ambarella chipsets with the lighttpd server enabled. We would love to hear from you if you successfully test this on your devices!
Lastly, we've recently got our hands on the newly released Furbo Mini Cam, which saw some hardware changes including a new SoC. Stay tuned for our next post!
The Furbo is a treat-tossing dog camera that originally started gaining traction on Indegogo in 2016. Its rapid success on the crowdfunding platform led to a public release later that year. Now the Furbo is widely available at Chewy and Amazon, where it has been a #1 best seller. The Furbo offers 24/7 camera access via its mobile application, streaming video and two-way audio. Other remote features include night vision, dog behavior monitoring, emergency detection, real-time notifications, and the ability to toss a treat to your dog. Given the device's vast feature set and popularity, Somerset Recon purchased several Furbos to research their security. This blog post documents a vulnerability discovered in the RTSP server running on the device. The research presented here pertains to the Furbo model: Furbo 2.
Once we got our hands on a couple of Furbos we began taking a look at the attack surface. Initially, the Furbo pairs with a mobile application on your phone via Bluetooth Low Energy (BLE), which allows the device to connect to your local WiFi network. With the Furbo on the network a port scan revealed that ports 554 and 19531 were listening. Port 554 is used for RTSP which is a network protocol commonly used for streaming video and audio. Initially the RTSP service on the Furbo required no authentication and we could remotely view the camera feed over RTSP using the VLC media player client. However, after an update and a reset the camera required authentication to access the RTSP streams.
The RTSP server on the Furbo uses HTTP digest authentication. This means that when connecting with an RTSP client, the client needs to authenticate by providing a username and password. The client utilizes a realm and nonce value sent by the server to generate an authentication header, which gets included in the request. With this in mind, we decided to try to identify a vulnerability in the RTSP service.
Crash
The crash was discovered by manually fuzzing the RTSP service. A common tactic in discovering stack or heap overflows is sending large inputs, so we fired off some requests with large usernames and much to our delight we saw the RTSP service reset. We eventually determined that a username of over 132 characters resulted in the RTSP service crashing due to improper parsing of the authentication header. An example request can be seen below:
At this point we wanted to obtain shell access on the Furbo to triage the crash and develop an exploit. To do so we shifted gears and took a look at the hardware.
Reverse Engineering Hardware to Gain Root Access
An important and helpful first step in attacking the Furbo, and most IoT devices, is obtaining a root shell or some other internal access to the device. Doing so can help elucidate processes, data, or communication which are otherwise obfuscated or encrypted. We focused our efforts on gaining root access to the Furbo by directly attacking the hardware which contains several interconnected printed circuit boards (PCBs). There are three PCBs that we analyzed.
The back PCB contains the reset switch and USB Micro-B port, which can be used to power the Furbo as show here:
Note the non-populated chips and connectors. We traced these to see if any of them provided serial access, but they turned out to link to the USB controller’s D+ and D- lines. These connectors are probably used during manufacturing for flashing, but they did not give us the serial access we were searching for.
The central PCB acts as the hub connecting other PCBs as shown here:
It contains relays, power regulators, an adjustment potentiometer, and a PIC16F57. Based on initial reverse engineering, this chip appears to control physical components such as the LED status bar, the treat shooter, and the mechanical switch that detects the treat shooter's motion.
The top PCB of the Furbo contains the large, visible-wavelength camera as shown here:
The board shown above supports Wi-Fi and Bluetooth, as evidenced by the connected patch antenna located on the side of the Furbo. The PCB also contains the main System on Chip (SoC) which performs the high level functions of the Furbo. The SoC is an Ambarella S2Lm.
The Ambarella SoC is the primary target: as a highly-capable ARM Cortex-A9 SoC running Linux (compared to the fairly limited PIC16 and wireless chips), it likely performs all the important functions of the Furbo, and hopefully contains an accessible TTY shell (serial access). As with many new complex or custom SoCs, detailed datasheets and specifications for the Ambarella chips are difficult to find. Instead we attached a Logic Analyzer to various test points until we located the UART TTY TX pin with a baud rate of 115200. From here we found the receive (RX) pin by connecting an FTDI to adjacent pins until a key press was registered on the serial terminal. The resulting serial access test points were located on the bottom left of the board as shown in the figure below:
We soldered on some wires to the test points circled above and had reliable serial access to the Ambarella SoC. The resulting boot log sequence is seen here:
As we can see above, the boot log sequence starts with the AMBoot bootloader. It is similar to Das U-Boot, but custom built by Ambarella. It will load images from NAND flash, and then boot the Linux v3.10.73 kernel. In the boot log note the line indicating the parameters used by AMBoot to initiate the Linux kernel:
The Linux terminal is protected by login credentials, but the process can be interrupted causing the Furbo to enter the AMBoot bootloader. See here for a similar demonstration of accessing a root shell from AMBoot. For the Furbo this can be done by pressing Enter at the TTY terminal immediately after reset, leading to the AMBoot terminal shown here:
Utilizing the AMBoot “boot” command with init=/bin/sh, as shown above, will bypass the Linux login prompt and boot directly into a root shell. The result of which can be seen here:
Once a root shell is accessible, a persistent root user can be created by adding or modifying entries in /etc/passwd and /etc/shadow. This persistent root shell can then be accessed via the normal Linux login prompt.
Debugging & Reverse Engineering
Now that we had shell access to the device, we looked around and got an understanding of how the underlying services work. An executable named apps_launcher is used to launch multiple services, including the rtsp_svc (RTSP server). These processes are all monitored by a watchdog script and get restarted if one crashes. We found that manually starting the apps_launcher process revealed some promising information.
It was here that we noticed that service rtsp_svc seemed to segfault twice before fully crashing. Note the segfault addresses are set to 0x41414141 indicating a successful buffer overflow, and the possibility of controlling program flow. To do so we needed to start the process of debugging and reversing the RTSP service crash.
From the information gathered so far, we were fairly confident we had discovered an exploitable condition. We added statically compiled dropbear-ssh and gdbserver binaries to the Furbo to aid in debugging and dove in. We connected to gdbserver on the Furbo from a remote machine using gdb-multiarch and GEF and immediately saw that we had a lot to work with:
Note that the presence of the username's "A"'s throughout, implying that the contents of the program counter ($pc), stack ($sp), and registers $r4 through $r11 could be controlled. Using a cyclic pattern for the username indicated the offset of each register that could be controlled. For example, the offset of the program counter was found to be 164 characters.
The link register ($lr) indicates that the issue is found in the parse_authenticaton_header() function. This function was located in the libamprotocol-rtsp.so.1 file. We pulled this file off of the Furbo to take a look at what was happening. Many of the file and function names utilized by the RTSP service indicate that they are part of the Ambarella SDK. Below is a snippet of the vulnerablefunction decompiled with Ghidra.
... snippet start ...

  size_t sizeof_str;
  int int_result;
  size_t value_len;
  undefined4 strdupd_value;
  int req_len_;
  char *req_str_;
  char parameter [128];
  char value [132];
  char update_req_str;

... removed for brevity ...

      while( true ) {
        memset(parameter,0,0x80);
        memset(value,0,0x80);
        int_result = sscanf(req_str_,"%[^=]=\"%[^\"]\"",parameter); //ghidra missed value argument here
        if ((int_result != 2) &&
           (int_result = sscanf(req_str_,"%[^=]=\"\"",parameter), int_result != 1)) break;
        sizeof_str = strlen(parameter);
        if (sizeof_str == 8) {
          int_result = strcasecmp(parameter,"username");
          if (int_result == 0) {
            if (*(void **)(header + 0xc) != (void *)0x0) {
              operator.delete[](*(void **)(header + 0xc));
            }
            strdupd_value = amstrdup(value);
            *(undefined4 *)(header + 0xc) = strdupd_value;
            sizeof_str = strlen(parameter);
          }

... snippet end ...
Assuming we have sent a request with a username full of ”A’s”, when it first hits the snippet shown, it will have stripped off everything in the request up until the username parameter. Note req_str_ in the highlighted section is a pointer to username="AAAAAAAAAA<+500>".
It’s worth mentioning that Ghidra appeared to misinterpret the arguments for sscanf() in this instance, as there should be two locations listed: parameter and value. The first format specifier parses out the parameter name such as username and stores it in parameter. The second format specifier copies the actual parameter value such as AAAAAAAAAAA and stores it in the location of value, which is only allocated 132 bytes. There is no length check, resulting in the buffer overflowing. When the function returns the service crashes as the return address was overwritten with the characters from the overflowed username in *req_str.
Additional information was gathered to craft a working PoC. The camera uses address space layout randomization (ASLR) and the shared objects were compiled with no-execute (NX). The rtsp_svc binary was not compiled with the position-independent executable (PIE) flag; however, the address range for the executable contains two leading null bytes (0x000080000) which unfortunately cannot be included in the payload. This means utilizing return-oriented programming (ROP) in the text section to bypass ASLR would be difficult, so we aimed to find another way.
Proof of Concept
As part of the triaging process, we disabled ASLR to see if we could craft a working exploit. With just 3 ROP gadgets from libc, we were able to gain code execution:
From here, we still wanted to find a way to exploit this with no prior access to the device (when ASLR is enabled). Ideally, we would have found some way to leak an address, but we did not find a way to accomplish that given the time invested.
As mentioned earlier, one of the behaviors we noticed was that the rtsp_svc executable would stay running after the first malformed payload, and would not fully crash until the second. Additionally, after the second request, the RTSP service would reset and the RTSP service would come back up. We confirmed this was because the rtsp_svc is run with a watchdog script.
Next, we checked the randomness of the libc address each time the service is run and found that 12 bits were changing. The addresses looked something like 0x76CXX000 where XX varied and sometimes the highlighted C would be a D. Taking all this into account, we crafted an exploit with two hardcoded libc base addresses that would be tried over and over again until the exploit was successful. If we consider that 12 bits can change between resets, there is a 1 in 4096 chance for the exploit to work. So we patiently waited as shown in the picture below:
In testing, it took anywhere from 2 minutes to 4 hours. Occasionally, the rtsp_svc executable would end up in a bad state requiring a full power cycle by unplugging the camera. This did not seem to happen after initial discovery, however since that time, multiple firmware updates have been issued to the Furbo (none fixed the vulnerability), which may have something to do with that behavior. Below is a screenshot showing the exploit running against an out of the box Furbo 2 and successfully gaining a shell:
Finally, here is a video demonstrating the exploit in action side-by-side with a Furbo. To create a more clear and concise video the demo below was executed with ASLR disabled.
We’ve made all the code available in our github repository if you want to take a look or attempt to improve the reliability!
Disclosure
Given the impact of this vulnerability we reached out to the Furbo Security Team. Here is the timeline of events for this discovery.
Event
Date
Vulnerability discovered
05/01/2020
Vulnerability PoC
08/01/2020
Disclosed Vulnerability to Furbo Security Team
08/14/2020
Escalated to Ambarella (according to Furbo Team)
8/19/2020
Last communication received from Furbo Security Team
8/20/2020
Applied for CVE
8/21/2020
Check In with Furbo for Update (No Response)
8/28/2020
Assigned CVE-2020-24918
8/30/2020
Check In with Furbo for Update (No Response)
9/8/2020
Check In with Furbo for Update (No Response)
10/20/2020
Additional Attempt to Contact Furbo (No Response)
3/19/2021
Published Blog Post
4/26/2021
As you can see, after exchanging emails sharing the details of the vulnerability with the Furbo Security Team, communications soon dropped off. Multiple follow up attempts went unanswered. The Furbo Security Team indicated that they had notified Ambarella of the vulnerability, but never followed up with us. Our own attempts to contact Ambarella directly went unanswered. At the time of posting, we are still looking to get in contact with Ambarella. This buffer overflow likely exists in the Ambarella SDK, which could potentially affect other products utilizing Ambarella chipsets.
Conclusion
The Furbo 2 has a buffer overflow in the RTSP Service when parsing the RTSP authentication header. Upon successful exploitation, the attacker is able to execute code as root and take full control of the Furbo 2. There are many features that can be utilized from the command line including, but not limited to, recording audio and video, playing custom sounds, shooting out treats, and obtaining the RTSP password for live video streaming.
Since the discovery of this exploit the Furbo has had multiple firmware updates, but they do not appear to have patched the underlying RTSP vulnerability. The reliability of our exploit has decreased because the RTSP service on the test devices more frequently goes into a bad state requiring the device to be fully power cycled before continuing. Additionally, Tomofun has released the Furbo 2.5T. This new model has upgraded hardware and is running different firmware. While the buffer overflow vulnerability was not fixed in code, the new Furbo 2.5T model no longer restarts the RTSP service after a crash. This mitigation strategy prevents us from brute-forcing ASLR, and prevents our currently released exploit from running successfully against Furbo 2.5T devices.
After realizing how much the Furbo 2.5T changed, we decided to reassess the new devices. We found a host of new vulnerabilities that will be the focus of Hacking the Furbo Dog Camera: Part II!
Here’s a bonus video featuring Sonny the Golden Retriever!
The LayerOne Capture The Flag (CTF) event is a traditional security competition hosted by the folks at Qualcomm at the LayerOne Security Conference. There were various challenges ranging in difficulty that required competitors to uncover flags by exploiting security vulnerabilities. This is a quick write up of one of the more complex challenges (LogViewer):
Part I
The first part of the challenge asked competitors to calculate the SHA-256 hashof the web service binary running on the CTF server. The provided URL displayed the following page:
The page was a simple form with an input field. Trying different inputs revealed that the form returned the content of the file provided. As an example, the contents of /etc/passwd was read as it is typically world-readable on a Linux system:
The web service allowed an arbitrary read of a user defined file on the server. Theoretically we could use this vulnerability to download the web service binary itself, but there was a challenge with this approach: we did not know the correct path to the web service binary.
This was solved by looking through /proc. On typical Linux systems there are a few symlinks under /proc; notably /proc/self, which links to the process that’s reading /proc/self. So accessing /proc/self through the web service will point to the web service process.
Note that every process running on a Linux system is represented by a directory under /proc (named after the pid). Each of these directories contains a set of typical directories and links. Notably the symlink exe is a link to the currently-running program. The following is a set of details of /exe from the proc man page:
Thus by accessing /proc/self/exe via the web form input we were able to download the web service binary directly:
After saving the binary we calculated the SHA-256 hash of the file and captured the flag:
The second part of this challenge was to read the /flag.txt file on the CTF server by using the web service binary we obtained in Part I.
In order to begin reversing of the web service binary, we pulled the HTML file from the challenge website and set it up on a local test environment. When we first ran the program in Ubuntu 18.04 and tried to read /flag.txt using the webform, it returned the following error:
This error message told us that the program was expecting to read the file /etc/alpine-release and use it somehow. To verify this, we created a docker container running Alpine Linux. After setting up the container, we got the following response from accessing the flag file:
A password was required (via GET parameters) to access the flag file and we had to figure out this password by reverse engineering the web service binary.
The binary was written in Go and was statically linked, making it a bit messy to view in IDA Pro. After we annotated and analyzed various functions, we reached the following conclusion regarding program flow:
The program first reads the form input and checks if it contains /flag.txt. If the user input does contain /flag.txt, it would check the password provided by the user and return its content if the password is correct. Otherwise, it would return the content of the user-specified file if it is present on the system.
Looking at the checkPassword functions, there were several cmp instructions that checked for the total length and byte values in the password. The following are the constraints for the password:
Constraint 1: The length of the password is at least 7 bytes (cmp rdx, 7)
Constraint 2: The 4th and 6th bytes of the password must be equal (cmp [rax+06], cl)
Constraint 3: The 1st byte of the password must be c (cmp BYTE PTR [rsp+0x3f], dl)
Constraint 4: The 3rd byte of the password must be e (cmp BYTE PTR [rsp+0x3f],cl)
Constraint 5: The 0th byte of the password must be Z (cmp BYTE PTR [rax], 0x5a)
Constraint 6: The 4th byte of the password must be x (cmp BYTE PTR [rax+4], 0x78)
Constraint 7: The 2nd byte of the password must be # (cmp BYTE PTR [rsp+0x3f], cl)
Constraint 8: The password’s 4th byte cannot be equal to the 5th byte plus 5 (cmp BYTE PTR [rsp+0x5],cl)
Constraint 9: The length of the password must be at least 9 bytes:
Constraint 10: The password’s third and fourth bytes have to be equal to the last two bytes:
To summarize all constraints:
Must be at least 7 bytes
Byte 4 and 6 must be equal
Byte 1 must be c
Byte 3 must be e
Byte 0 must be Z
Byte 4 must be x
Byte 2 must be #
Byte 4 must not be equal to byte 5 + 5 more chars
Must be at least 9 bytes
Bytes 3 and 4 must be equal to the last two bytes
After many trials and errors, we came up with the following form of the password:
Zc#exZx#e
Given this will be passed as a GET parameter it was important for us to URL-encode the “#” character as it would otherwise be interpreted as a fragment identifier.
After generating the password we queried the CTF server with the following encoded payload:
And such is the story of the LogViewer challenge. We really enjoyed capturing this multifaceted flag, and we had a blast competing at the LayerOne CTF. Thanks again to the organizers of the conference and CTF. We are looking forward to the next one.
On March 5th at the RSA security conference, the National Security Agency (NSA) released a reverse engineering tool called Ghidra. Similar to IDA Pro, Ghidra is a disassembler and decompiler with many powerful features (e.g., plugin support, graph views, cross references, syntax highlighting, etc.). Although Ghidra's plugin capabilities are powerful, there is little information published on its full capabilities. This blog post series will focus on Ghidra’s plugin development and how it can be used to help identify software vulnerabilities.
In our previous post, we leveraged IDA Pro’s plugin functionality to identify sinks (potentially vulnerable functions or programming syntax). We then improved upon this technique in our follow up blog post to identify inline strcpy calls and identified a buffer overflow in Microsoft Office. In this post, we will use similar techniques with Ghidra’s plugin feature to identify sinks in CoreFTPServer v1.2 build 505.
Ghidra Plugin Fundamentals
Before we begin, we recommend going through the example Ghidra plugin scripts and the front page of the API documentation to understand the basics of writing a plugin. (Help -> Ghidra API Help)
When a Ghidra plugin script runs, the current state of the program will be handled by the following five objects:
currentProgram: the active program
currentAddress: the address of the current cursor location in the tool
currentLocation: the program location of the current cursor location in the tool, or null if no program location exists
currentSelection: the current selection in the tool, or null if no selection exists
currentHighlight: the current highlight in the tool, or null if no highlight exists
It is important to note that Ghidra is written in Java, and its plugins can be written in Java or Jython. For the purposes of this post, we will be writing a plugin in Jython. There are three ways to use Ghidra’s Jython API:
Using Python IDE (similar to IDA Python console):
Loading a script from the script manager:
Headless- Using Ghidra without a GUI:
With an understanding of Ghidra plugin basics, we can now dive deeper into the source code by utilizing the script manager (Right Click on the script -> Edit with Basic Editor)
The example plugin scripts are located under /path_to_ghidra/Ghidra/Features/Python/ghidra_scripts. (In the script manager, these are located under Examples/Python/):
Ghidra Plugin Sink Detection
In order to detect sinks, we first have to create a list of sinks that can be utilized by our plugin. For the purpose of this post, we will target the sinks that are known to produce buffer overflow vulnerabilities. These sinks can be found in various write-ups, books, and publications.
Our plugin will first identify all function calls in a program and check against our list of sinks to filter out the targets. For each sink, we will identify all of their parent functions and called addresses. By the end of this process, we will have a plugin that can map the calling functions to sinks, and therefore identify sinks that could result in a buffer overflow.
Locating Function Calls
There are various methods to determine whether a program contains sinks. We will be focusing on the below methods, and will discuss each in detail in the following sections:
Linear Search - Iterate over the text section (executable section) of the binary and check the instruction operand against our predefined list of sinks.
Cross References (Xrefs) - Utilize Ghidra’s built in identification of cross references and query the cross references to sinks.
Linear Search
The first method of locating all function calls in a program is to do a sequential search. While this method may not be the ideal search technique, it is a great way of demonstrating some of the features in Ghidra’s API.
Using the below code, we can print out all instructions in our program:
listing = currentProgram.getListing() #get a Listing interface
ins_list = listing.getInstructions(1) #get an Instruction iterator
while ins_list.hasNext():             #go through each instruction and print it out to the console
    ins = ins_list.next()
    print (ins)
Running the above script on CoreFTPServer gives us the following output:
We can see that all of the x86 instructions in the program were printed out to the console.
Next, we filter for sinks that are utilized in the program. It is important to check for duplicates as there could be multiple references to the identified sinks.
Building upon the previous code, we now have the following:
sinks = [
         "strcpy",
         "memcpy",
         "gets",
         "memmove",
         "scanf",
         "lstrcpy",
         "strcpyW",
         #...
         ]
duplicate = []
listing = currentProgram.getListing()
ins_list = listing.getInstructions(1)
while ins_list.hasNext():
    ins = ins_list.next()
    ops = ins.getOpObjects(0)
    try:
        target_addr = ops[0]
        sink_func = listing.getFunctionAt(target_addr)
        sink_func_name = sink_func.getName()
        if sink_func_name in sinks and sink_func_name not in  duplicate:
            duplicate.append(sink_func_name)
            print (sink_func_name,target_addr)
    except:
        pass
Now that we have identified a list of sinks in our target binary, we have to locate where these functions are getting called. Since we are iterating through the executable section of the binary and checking every operand against the list of sinks, all we have to do is add a filter for the call instruction.
Adding this check to the previous code gives us the following:
sinks = [
	"strcpy",
	"memcpy",
	"gets",
	"memmove",
	"scanf",
	"strcpyA",
	"strcpyW",
	"wcscpy",
	"_tcscpy",
	"_mbscpy",
	"StrCpy",
	"StrCpyA",
        "lstrcpyA",
        "lstrcpy",
        #...
	]

duplicate = []
listing = currentProgram.getListing()
ins_list = listing.getInstructions(1)

#iterate through each instruction
while ins_list.hasNext():
    ins = ins_list.next()
    ops = ins.getOpObjects(0)
    mnemonic = ins.getMnemonicString()

    #check to see if the instruction is a call instruction
    if mnemonic == "CALL":
        try:
            target_addr = ops[0]
            sink_func = listing.getFunctionAt(target_addr)
            sink_func_name = sink_func.getName()
            #check to see if function being called is in the sinks list
            if sink_func_name in sinks and sink_func_name not in duplicate:
                duplicate.append(sink_func_name)
                print (sink_func_name,target_addr)
        except:
	        pass
Running the above script against CoreFTPServer v1.2 build 505 shows the results for all detected sinks:
Unfortunately, the above code does not detect any sinks in the CoreFTPServer binary. However, we know that this particular version of CoreFTPServer is vulnerable to a buffer overflow and contains the lstrcpyA sink.So, why did our plugin fail to detect any sinks?
After researching this question, we discovered that in order to identify the functions that are calling out to an external DLL, we need to use the function manager that specifically handles the external functions.
To do this, we modified our code so that every time we see a call instruction we go through all external functions in our program and check them against the list of sinks. Then, if they are found in the list, we verify whether that the operand matches the address of the sink.
The following is the modified section of the script:
sinks = [
	"strcpy",
	"memcpy",
	"gets",
	"memmove",
	"scanf",
	"strcpyA",
	"strcpyW",
	"wcscpy",
	"_tcscpy",
	"_mbscpy",
	"StrCpy",
	"StrCpyA",
        "lstrcpyA",
        "lstrcpy",
        #...
	]

program_sinks = {}
listing = currentProgram.getListing()
ins_list = listing.getInstructions(1)
ext_fm = fm.getExternalFunctions()

#iterate through each of the external functions to build a dictionary
#of external functions and their addresses
while ext_fm.hasNext():
    ext_func = ext_fm.next()
    target_func = ext_func.getName()

    #if the function is a sink then add it's address to a dictionary
    if target_func in sinks:
        loc = ext_func.getExternalLocation()
        sink_addr = loc.getAddress()
        sink_func_name = loc.getLabel()
        program_sinks[sink_addr] = sink_func_name

#iterate through each instruction
while ins_list.hasNext():
    ins = ins_list.next()
    ops = ins.getOpObjects(0)
    mnemonic = ins.getMnemonicString()

    #check to see if the instruction is a call instruction
    if mnemonic == "CALL":
        try:
            #get address of operand
            target_addr = ops[0]
            #check to see if address exists in generated sink dictionary
            if program.sinks.get(target_addr):
                print (program_sinks[target_addr], target_addr,ins.getAddress())
        except:
            pass
Running the modified script against our program shows that we identified multiple sinks that could result in a buffer overflow.
Xrefs
The second and more efficient approach is to identify cross references to each sink and check which cross references are calling the sinks in our list. Because this approach does not search through the entire text section, it is more efficient.
Using the below code, we can identify cross references to each sink:
sinks = [
	"strcpy",
	"memcpy",
	"gets",
	"memmove",
	"scanf",
	"strcpyA",
	"strcpyW",
	"wcscpy",
	"_tcscpy",
	"_mbscpy",
	"StrCpy",
	"StrCpyA",
        "lstrcpyA",
        "lstrcpy",
        #...
	]

duplicate = []
func = getFirstFunction()

while func is not None:
    func_name = func.getName()

    #check if function name is in sinks list
    if func_name in sinks and func_name not in duplicate:
        duplicate.append(func_name)
        entry_point = func.getEntryPoint()
        references = getReferencesTo(entry_point)
	#print cross-references
        print(references)
    #set the function to the next function
    func = getFunctionAfter(func)
Now that we have identified the cross references, we can get an instruction for each reference and add a filter for the call instruction. A final modification is added to include the use of the external function manager:
sinks = [
	"strcpy",
	"memcpy",
	"gets",
	"memmove",
	"scanf",
	"strcpyA",
	"strcpyW",
	"wcscpy",
	"_tcscpy",
	"_mbscpy",
	"StrCpy",
	"StrCpyA",
        "lstrcpyA",
        "lstrcpy",
        #...
	]

duplicate = []
fm = currentProgram.getFunctionManager()
ext_fm = fm.getExternalFunctions()

#iterate through each external function
while ext_fm.hasNext():
    ext_func = ext_fm.next()
    target_func = ext_func.getName()

    #check if the function is in our sinks list
    if target_func in sinks and target_func not in duplicate:
        duplicate.append(target_func)
        loc = ext_func.getExternalLocation()
        sink_func_addr = loc.getAddress()

        if sink_func_addr is None:
            sink_func_addr = ext_func.getEntryPoint()

        if sink_func_addr is not None:
            references = getReferencesTo(sink_func_addr)

            #iterate through all cross references to potential sink
            for ref in references:
                call_addr = ref.getFromAddress()
                ins = listing.getInstructionAt(call_addr)
                mnemonic = ins.getMnemonicString()

                #print the sink and address of the sink if
                #the instruction is a call instruction
                if mnemonic == “CALL”:
                    print (target_func,sink_func_addr,call_addr)
Running the modified script against CoreFTPServer gives us a list of sinks that could result in a buffer overflow:
Mapping Calling Functions to Sinks
So far, our Ghidra plugin can identify sinks. With this information, we can take it a step further by mapping the calling functions to the sinks. This allows security researchers to visualize the relationship between the sink and its incoming data. For the purpose of this post, we will use graphviz module to draw a graph.
Putting it all together gives us the following code:
from ghidra.program.model.address import Address
from ghidra.program.model.listing.CodeUnit import *
from ghidra.program.model.listing.Listing import *

import sys
import os

#get ghidra root directory
ghidra_default_dir = os.getcwd()

#get ghidra jython directory
jython_dir = os.path.join(ghidra_default_dir, "Ghidra", "Features", "Python", "lib", "Lib", "site-packages")

#insert jython directory into system path
sys.path.insert(0,jython_dir)

from beautifultable import BeautifulTable
from graphviz import Digraph


sinks = [
    "strcpy",
    "memcpy",
    "gets",
    "memmove",
    "scanf",
    "strcpyA",
    "strcpyW",
    "wcscpy",
    "_tcscpy",
    "_mbscpy",
    "StrCpy",
    "StrCpyA",
    "StrCpyW",
    "lstrcpy",
    "lstrcpyA",
    "lstrcpyW",
    #...
]

sink_dic = {}
duplicate = []
listing = currentProgram.getListing()
ins_list = listing.getInstructions(1)

#iterate over each instruction
while ins_list.hasNext():
    ins = ins_list.next()
    mnemonic = ins.getMnemonicString()
    ops = ins.getOpObjects(0)
    if mnemonic == "CALL":
        try:
            target_addr = ops[0]
            func_name = None

            if isinstance(target_addr,Address):
                code_unit = listing.getCodeUnitAt(target_addr)
                if code_unit is not None:
                    ref = code_unit.getExternalReference(0)
                    if ref is not None:
                        func_name = ref.getLabel()
                    else:
                        func = listing.getFunctionAt(target_addr)
                        func_name = func.getName()

            #check if function name is in our sinks list
            if func_name in sinks and func_name not in duplicate:
                duplicate.append(func_name)
                references = getReferencesTo(target_addr)
                for ref in references:
                    call_addr = ref.getFromAddress()
                    sink_addr = ops[0]
                    parent_func_name = getFunctionBefore(call_addr).getName()

                    #check sink dictionary for parent function name
                    if sink_dic.get(parent_func_name):
                        if sink_dic[parent_func_name].get(func_name):
                            if call_addr not in sink_dic[parent_func_name][func_name]['call_address']:
                                sink_dic[parent_func_name][func_name]['call_address'].append(call_addr)
                            else:
                                sink_dic[parent_func_name] =
                    else:
                        sink_dic[parent_func_name] =
        except:
            pass

#instantiate graphiz
graph = Digraph("ReferenceTree")
graph.graph_attr['rankdir'] = 'LR'
duplicate = 0

#Add sinks and parent functions to a graph
for parent_func_name,sink_func_list in sink_dic.items():
    #parent functions will be blue
    graph.node(parent_func_name,parent_func_name, style="filled",color="blue",fontcolor="white")
    for sink_name,sink_list in sink_func_list.items():
        #sinks will be colored red
        graph.node(sink_name,sink_name,style="filled", color="red",fontcolor="white")
        for call_addr in sink_list['call_address']:
	    if duplicate != call_addr:
                graph.edge(parent_func_name,sink_name, label=call_addr.toString())
                duplicate = call_addr

ghidra_default_path = os.getcwd()
graph_output_file = os.path.join(ghidra_default_path, "sink_and_caller.gv")

#create the graph and view it using graphiz
graph.render(graph_output_file,view=True)
Running the script against our program shows the following graph:
We can see the calling functions are highlighted in blue and the sink is highlighted in red. The addresses of the calling functions are displayed on the line pointing to the sink.
After conducting some manual analysis we were able to verify that several of the sinks identified by our Ghidra plugin produced a buffer overflow. The following screenshot of WinDBG shows that EIP is overwritten by 0x42424242 as a result of an lstrcpyA function call.
Additional Features
Although visualizing the result in a graph format is helpful for vulnerability analysis, it would also be useful if the user could choose different output formats.
The Ghidra API provides several methods for interacting with a user and several ways of outputting data. We can leverage the Ghidra API to allow a user to choose an output format (e.g. text, JSON, graph) and display the result in the chosen format. The example below shows the dropdown menu with three different display formats. The full script is available at our github:
Limitations
There are multiple known issues with Ghidra, and one of the biggest issues for writing an analysis plugin like ours is that the Ghidra API does not always return the correct address of an identified standard function.
Unlike IDA Pro, which has a database of function signatures (FLIRT signatures) from multiple libraries that can be used to detect the standard function calls, Ghidra only comes with a few export files (similar to signature files) for DLLs. Occasionally, the standard library detection will fail.
By comparing IDA Pro and Ghidra’s disassembly output of CoreFTPServer, we can see that IDA Pro’s analysis successfully identified and mapped the function lstrcpyA using a FLIRT signature, whereas Ghidra shows a call to the memory address of the function lstrcpyA.
Although the public release of Ghidra has limitations, we expect to see improvements that will enhance the standard library analysis and aid in automated vulnerability research.
Conclusion
Ghidra is a powerful reverse engineering tool that can be leveraged to identify potential vulnerabilities. Using Ghidra’s API, we were able to develop a plugin that identifies sinks and their parent functions and display the results in various formats. In our next blog post, we will conduct additional automated analysis using Ghidra and enhance the plugins vulnerability detection capabilities.
In our last post we reviewed some basic techniques for hunting vulnerabilities in binaries using IDAPython. In this post we will expand upon that work and extend our IDAPython script to help detect a real Microsoft Office vulnerability that was recently found in the wild. The vulnerability that will be discussed is a remote code execution vulnerability that existed in the Microsoft Office EQNEDT32.exe component which was also known as the Microsoft Office Equation Editor. This program was in the news in January when, due to a number of discovered vulnerabilities. Microsoft completely removed the application (and all of its functionality) from Microsoft Office in a security update. The vulnerabilities that ended up resulting in Equation Editor being killed are of the exact type that we attempted to identify with the script written in the previous blog post. However, calls to strcpy in the Equation Editor application were optimized out and inlined by the compiler, rendering the script that we wrote previously ineffective at locating the vulnerable strcpy usages.
While the techniques that we reviewed in the previous post are useful in finding a wide range of dangerous function calls, there are certain situations where the script as written in the previous blog post will not detect the dangerous programming constructs that we intend and would expect it to detect. This most commonly occurs when compiler optimizations are used which replace function calls to string manipulation functions (such as strcpy and strcat) with inline assembly to improve program performance. Since this optimization removes the call instruction that we relied upon in our previous blog post, our previous detection method does not work in this scenario. In this post we will cover how to identify dangerous function calls even when the function call itself has been optimized out of the program and inlined.
Understanding the Inlined strcpy()
Before we are able to find and detect inlined calls to strcpy, we first need to understand what an inlined strcpy would look like. Let us take a look at an IDA Pro screenshot below that shows the disassembly view side-by-side with the HexRays decompiler output of an instance where a call to strcpy is inlined.
Example of inlined strcpy() - Disassembly on left, HexRays decompiled version on right
In the above screenshot we can observe that the decompiler output on the right side shows that a call to strcpy in made, but when we look to the left side disassembly there is not a corresponding call to strcpy. When looking for inlined string functions, a common feature of the inlined assembly to watch for is the use of the “repeat” assembly instructions (rep, repnz, repz) in performing the string operations. With this in mind, let’s dig into the disassembly to see what the compiler has used to replace strcpy in the disassembly above.
First, we observe the instruction at 0x411646: `repne scasb`. This instruction is commonly used to get the length of a string (and is often used when strlen() is inlined by the compiler). Looking at the arguments used to set up the `repne scasb` call we can see that it is getting the length of the string “arg_0”. Since performing a strcpy requires knowing the length of the source string (and consequently the number of bytes/characters to copy), this is typically the first step in performing a strcpy.
Next we continue down and see two similar looking instructions in `rep movsd` and `rep movsb`. These instructions copy a string located in the esi register into the edi register. The difference between these two instructions being the `rep movsd` instruction moves DWORDs from esi to edi, while `rep movsb` copies bytes. Both instructions repeat the copy instruction a number of times based upon the value in the ecx register.
Viewing the above code we can observe that the code uses the string length found by `repne scasb` instruction in order to determine the size of the string that is being copied. We can observe this by viewing seeing that following instruction 0x41164C the length of the string is stored in both eax and ecx. Prior to executing the `rep movsd` instruction we can see that ecx is shifted right by two. This results in only full DWORDs from the source string being copied to the destination. Next we observe that at instruction 0x41165A that the stored string length is moved back into ecx and then bitwise-AND’d with 3. This results in any remaining bytes that were not copied in the `rep movsd` instruction to be copied to the destination.
Automating Vuln Hunting with the Inlined strcpy()
Now that we understand how the compiler optimized strcpy function calls we are able to enhance our vulnerability hunting scripts to allow us to find instances where they an inlined strcpy occurs. In order to help us do this, we will use the IDAPython API and the search functionality that it provides us with. Looking at the above section the primary instructions that are more or less unique to strcpy are the `rep movsd` with the `rep movsb` instruction following shortly thereafter to copy any remaining uncopied bytes.
So, using the IDAPython API to search for all instances of `rep movsd` followed by `rep movsb` 7 bytes after it gives us the following code snippet:
ea = 0
while ea != BADADDR:
   addr = FindText(ea+2,SEARCH_DOWN|SEARCH_NEXT, 0, 0, "rep movsd");
   ea = addr
   if "movsb" in GetDisasm(addr+7):
       print "strcpy found at 0x%X"%addr
If we run this against the EQNEDT32.exe, then we get the following output in IDA Pro:
Output of Script Against EQNEDT32.exe
If we begin to look at all of the instances where the script reports detected instances of inlined strcpy we find several instances where this script picks up other functions that are not strcpy but are similar. The most common function (other than strcpy) that this script detects is strcat(). Once we think about the similarities in functionality between those functions, it makes a lot of sense. Both strcat and strcpy are dangerous string copying functions that copy the entire length of a source string into a destination string regardless of the size of the destination buffer. Additionally, strcat introduces the same dangers as strcpy to an application, finding both with the same script is a way to kill two birds with one stone.
Now that we have code to find inlined strcpy and strcat in the code, we can add that together with our previous code in order to search specifically for inline strcpy and strcat that copy the data into stack buffers. This gives us the code snippet shown below:
# Check inline functions
info = idaapi.get_inf_structure()
ea = 0

while ea != BADADDR:
   addr = FindText(ea+2,SEARCH_DOWN|SEARCH_NEXT, 0, 0, "rep movsd");
   ea = addr
   _addr = ea

   if "movsb" in GetDisasm(addr+7):
       opnd = "edi" # Make variable based on architecture
       if info.is_64bit():
           opnd = "rdi"


       val = None
       function_head = GetFunctionAttr(_addr, idc.FUNCATTR_START)
       while True:
           _addr = idc.PrevHead(_addr)
           _op = GetMnem(_addr).lower()

           if _op in ("ret", "retn", "jmp", "b") or _addr < function_head:
               break

           elif _op == "lea" and GetOpnd(_addr, 0) == opnd:
               # We found the origin of the destination, check to see if it is in the stack
               if is_stack_buffer(_addr, 1):
                   print "0x%X"%_addr
                   break
               else: break

           elif _op == "mov" and GetOpnd(_addr, 0) == opnd:
               op_type = GetOpType(_addr, 1)

               if op_type == o_reg:
                   opnd = GetOpnd(_addr, 1)
                   addr = _addr
               else:
                   break
Running the above script and analyzing the results gives us a list of 32 locations in the code where a strcpy() or strcat() call was inlined by the compiler and used to copy a string into a stack buffer.
Improving Upon Previous Stack Buffer Check
Additionally, now that we have some additional experience with IDA Python, let us improve our previous scripts in order to write scripts that are compatible with all recent versions of IDA Pro. Having scripts that function on varying versions of the IDA API can be extremely useful as currently many IDA Pro users are still using IDA 6 API while many others have upgraded to the newer IDA 7.
When IDA 7 was released, it came with a large number of changes to the API that were not backwards compatible. As a result, we need to perform a bit of a hack in order to make our is_stack_buffer() function compatible with both IDA 6 and IDA 7 versions of the IDA Python API. To make matters worse, not only has IDA modified the get_stkvar() function signature between IDA 6 and IDA 7, it also appears that they introduced a bug (or removed functionality) so that the get_stkvar() function no longer automatically handles stack variables with negative offsets.
As a refresher, I have included the is_stack_buffer() function from the previous blog post below:
First, we begin to introduce this functionality by adding a try-catch to surround our call to get_stkvar() as well as introduce a variable to hold the returned value from get_stkvar(). Since our previous blog post worked for the IDA 6 family API our “try” block will handle IDA 6 and will throw an exception causing us to handle the IDA 7 API within our “catch” block.
Now in order to properly handle the IDA 7 API, in the catch block for the we must pass an additional “instruction” argument to the get_stkvar() call as well as perform a check on the value of inst[idx].addr. We can think of “inst[idx].addr” as a signed integer that has been cast into an unsigned integer. Unfortunately, due to a bug in the IDA 7 API, get_stkvar() no longer performs the needed conversion of this value and, as a result, does not function properly on negative values of “inst[idx].addr” out of the box. This bug has been reported to the Hex-Rays team but, as of when this was written, has not been patched and requires us to convert negative numbers into the correct Python representation prior to passing them to the function. To do this we check to see if the signed bit of the value is set and, if it is, then we convert it to the proper negative representation using two’s complement.
def twos_compl(val, bits=32):
"""compute the 2's complement of int value val"""
# if sign bit is set e.g., 8bit: 128-255
if (val & (1 << (bits - 1))) != 0:
val = val - (1 << bits) # compute negative value
return val # return positive value as is
def is_stack_buffer(addr, idx):
inst = DecodeInstruction(addr)
# IDA < 7.0
try:
ret = get_stkvar(inst[idx], inst[idx].addr) != None
# IDA >= 7.0
except:
from ida_frame import *
v = twos_compl(inst[idx].addr)
ret = get_stkvar(inst, inst[idx], v)
return ret
Microsoft Office Vulnerability
The Equation Editor application makes a great example program since it was until very recently, a widely distributed real-world application that we are able to use to test our IDAPython scripts. This application was an extremely attractive target for attackers since, in addition to it being widely distributed, it also lacks common exploit mitigations including DEP, ASLR, and stack cookies.
Running the IDAPython script that we have just written finds and flags a number of addresses including the address, 0x411658. Performing some further analysis reveals that this is the exact piece in the code that caused CVE-2017-11882, the initial remote code execution vulnerability found in Equation Editor.
Additionally, in the time that followed the public release of CVE-2017-11882, security researchers began to turn their focus to EQNEDT32.exe due to the creative work done by Microsoft to manually patch the assembly (which prompted rumors that Microsoft had somehow lost the source code to EQNEDT32.exe). This increased interest within the security community led to a number of additional vulnerabilities being subsequently found in EQNEDT32.exe (with most of them being stack-buffer overflows). These vulnerabilities include: CVE-2018-0802, CVE-2018-0804, CVE-2018-0805, CVE-2018-0806, CVE-2018-0807, CVE-2018-0845, and CVE-2018-0862. While there are relatively scarce details surrounding most of those vulnerabilities, given the results of the IDAPython scripting that we have performed, we should not be surprised that a number of additional vulnerabilities were found in this application.
NOTE: This blog post is based on our DEF CON talk with the same title. If you would like to view the slides from DEF CON, they can be viewed here. Demonstration videos will be posted soon.
Overview
As IoT devices continue to become more and more commonplace, new threats and attack vectors are introduced that must be considered. Embedded devices contain a variety of distinct surfaces that a determined attacker could target. One such attack vector that must be considered is the development supply chain. In developing an IoT device, a development team requires a variety of special components, tools, and debuggers. Any of these products could be targeted by an attacker to compromise the integrity of the device that is being developed. With that in mind, we analyze the security of the Segger J-Link Debug Probes. Hardware debuggers, such as the J-Link, are critical tools in assisting developers with building embedded devices. Segger claims that their J-Link devices are “the most widely used debug probes in the world."
J-Link Attack Surface
The Segger J-Link debug probes come with a variety of supporting software packages that are used in order to interact with the debug probes. Included in this software is:
Many user-mode applications
USB driver
Full Integrated Development Environment (IDE)
Analyzing the user-mode applications that were distributed with the J-Link revealed that many of the applications were missing binary protections which can assist in preventing the successful exploitation of vulnerabilities. The analysis of the binary protections revealed:
DEP/NX was enabled
ASLR was enabled
PIE was not enabled
Stack canaries were NOT present in *nix binaries, stack canaries were present in Windows
SafeSEH was used in Windows binaries
As we began to analyze the applications included with J-Link, we quickly identified a number of input vectors that these applications accepted. These input vectors included command line arguments, files, and network interfaces. With this information in mind, we began to examine the applications’ security.
Vulnerability Research
After identifying input vectors and getting a feel for the applications, we determined to move forward with security analysis through a combination of fuzzing and reverse engineering. As we began to further analyze these applications and began to compare the Linux and Windows versions of these packages we found that the majority of the code was cross-compiled. This made our lives easier as we knew that the functionality was nearly identical between the Windows and Linux versions of the application.
Additionally, we realized that much of the interesting application logic appeared to require traversing deep, complicated code paths to reach. As a result of this, we decided to use a generational fuzzing approach in order to attempt to achieve better fuzzing coverage of these hard to reach code paths. This method involved using knowledge of the binary gathered from reverse engineering in order to determine the structure of data that each respective application expects to receive and leads to the “interesting” code sections and then recreating that data structure within the context of our fuzzer’s data specification format.
Since we were planning to generationally fuzz both network and file formats we decided to use the Peach fuzzer. Peach allows us to define our data formats in a simple XML file format and includes support for all of the desired input vectors (networking, files, command line) out of the box.
We then developed several data format specifications (known in Peach as pit files) and began fuzzing various J-Link applications. We started seeing crashes right away, but we also began to have issues as the J-Link debug probes entered a bad state and were disconnected from the VM that we were using for fuzzing. This caused our fuzzing to halt as the applications that we were fuzzing require that a J-Link device be present as the applications require the device in order to properly execute.
In order to keep our J-Link attached to our VM we developed a custom crash monitor in order to ensure that the device was attached prior to executing any fuzzing iteration. The crash monitor is triggered on any crash that occurs while fuzzing and executes a user-specified set of actions. We wrote a custom script for the crash monitor to execute that utilized libvirt to check if the J-Link device was still attached to the VM and, if it was not attached, then reattach it. This allowed us to continue fuzzing the applications without issue.
Soon we were forced to halt our fuzzing efforts since we had observed so many crashes that we were running out of disk space due to the crash data stored by Peach. While triaging the crashes we noticed some interesting things about the crashes. First, we observed that a huge number of crashes were identical and were being automatically flagged as exploitable (thanks to !exploitable). These crashes made up such a large portion of our crashes that we received less coverage overall from our fuzzers than we had initially hoped for. Further analysis of our crashes revealed that, while we had built the data models to reach deep and interesting code paths, easy to trigger bugs that were located early in the execution path were causing crashes prior to reaching the code paths that we had initially targeted for security analysis.
Even though we received less coverage than we had hoped, we were still left with a variety of distinct crashes that appeared to be exploitable after some initial triage. With this information, we then attempted to see if we could fully exploit any of the issues that we had discovered.
Vulnerabilities Discovered
CVE-2018-9094 - Format String Vulnerability
One of the first vulnerabilities that we found was a format string vulnerability. This vulnerability can be demonstrated with a command line argument. Simply passing in a format specifier (such as “%p”) as part of the file name on the command line results in the format specifier to be formatted as such. We show this below with “fileName%p” in the command line being converted to “fileName00922C0F” in the output.
Format String Vulnerability Demonstration
In the vulnerable application, JFlashSPI_CL.exe, we have a user controlled string which inserted into a larger log message string via sprintf. This log message string is then passed as the first argument into a “printf-style” function which accepts format specifiers. Hex-Rays decompiler output showing this vulnerable code snippet is shown below and clearly shows the vulnerability.
Hex-Rays Output of the Source of the Vulnerability
Further reversing reveals that the “custom_printf” function shown above is a logging function that is included in the J-Link applications. This function accepts a subset of the format specifiers that are accepted by printf and does not accept the “%n” family of specifiers that allow one to generate arbitrary writes via a format string vulnerability. With that being said, it is still possible to generate an arbitrary read with this code.
We can demonstrate this with the following command:
Next, we analyzed the individual crash that made up a huge majority of our total crashes and caused us to eat up most of our VM’s disk space. This vulnerability is a traditional stack buffer overflow. In this vulnerability, we can overflow a stack buffer by including a line with 511 characters or more in a command file that is parsed by the JLinkExe application.
Since this application is compiled with NX protections in addition to ASLR, we are forced to bypass these in order to exploit this vulnerability and gain arbitrary code execution. In order to bypass the NX protections, we utilized ROP in order to perform all operations needed to gain execution. Using Ropper, we searched through the ROP gadgets that were present in JLinkExe in order to bypass ASLR and then gain execution. Since ASLR was enabled, we need to determine the address of libc and, subsequently, system(). Fortunately, we have enough gadgets present in JLinkExe in order to leak the address of libc.
We are able to leak the address of libc using a traditional GOT deference technique in which we dereference the GOT entry of some libc function and then utilize that dereferenced address in order to calculate the address of the desired function - in our case system() - by performing arithmetic to add or subtract the static offset of our desired function from the dereferenced function.
This left us needing to pass an argument to system() in order to gain code execution. Since this vulnerability is triggered by a file that is local to the exploited system, we focused on just getting shell via this system rather than passing arbitrary, user-controlled payloads to it. This made finishing our exploitation somewhat simpler since we now just had to find a string to pass to the call to system in order to get our shell. However, since we were unable to send null bytes, we were limited with regards to which addresses we could pass as an argument to system. For example, our first thought was to use the “/bin/sh” string in the libc library, but the address of that string contains a null byte, forcing us to use a different address. As a result of that, we started focusing on strings in the valid address space and realized that we had a number of options to work with.
By pointing our argument to system() into the middle of a string that ended with “sh” we were able to execute the “sh” command as our argument to system(). This allows us to bypass the limitations on addresses and launches a shell for us, giving us the execution that we desired.
CVE-2018-9097 - Settings File Buffer Overflow
In the course of our fuzzing we found another buffer overrun caused by an input file JLinkExe. This vulnerability was caused by a buffer overrun in the BSS segment of a shared library that was used by the main executable. At this point, we could write an arbitrary number of non-null bytes into the BSS segment of the libjlinkarm.so.6.30.2, but we still needed some way to gain control of execution in the application in order to execute our code. Since we had the ability to overwrite arbitrary data into the BSS segment, we began to look into ways that we could turn that into code execution.
Using the IDA Sploiter plugin in IDA Pro, we searched for writable function pointers that we could overwrite. Fortunately, we were able to identify a number of overwritable function pointers following our overflowable buffer. After a little bit more research into those function pointers we were able to identify a function pointer that we could overwrite without causing the application to crash and would also get called soon after overwriting. With that, we were able to consistently redirect execution to a user-controlled location. At this point, we decided not to finish full exploitation on this vulnerability as and to instead focus more on the remote vulnerabilities that we had found. The reason for this was the similarity in the attack vector and impact of exploitation between this vulnerability and CVE-2018-9095.
CVE-2018-9096 - Telnet Stack Buffer Overflow
One interesting observation that we made when initially analyzing the applications that are included with the J-Link was that an application, JLinkRemoteServer, listens on a number of ports. Of particular interest to us was that the application listens on port 23.
Since port 23 is commonly used by telnet we decided to focus some of our reverse engineering efforts on this executable to determine what the purpose of this open port is. After beginning to look into this portion of the application in IDA Pro, we were quickly able to identify that this was, in fact, a Telnet server within the application.
Hex-Rays Output Showing the Creation of a Telnet Server Thread
With this information, we configured our fuzzer to focus on the open ports with a special focus on the Telnet server as it appeared to have a large attack surface. Fuzzing the Telnet server revealed one interesting crash that appeared to be exploitable but was difficult for our team to reproduce. Additional analysis led us to discover that this was the result of a stack-buffer overflow. However, we were still unable to consistently trigger that crash. After further reversing of this application we were able to identify a race condition caused the application to either crash or continue running.
While we were unable to cause this crash to happen consistently, we were able to write an exploit which exploited this vulnerability in the instances where the race condition triggers the crash. In order to do this we followed a similar technique to what we used in the local stack buffer overflow exploit where we utilize a ROP chain in order to leak an address inside of libc through a GOT dereference and then use that leaked address to calculate the address of system().
Once we had the address of system() we wanted to develop a method for the exploit to execute an arbitrary, user-controlled command. While looking at the state of program memory during exploitation, we found that user-controlled data was also being stored in static locations in program memory. Due to the multithreaded nature of the JLinkRemoteServer application, the exact location where this data was stored in memory varied between two locations. Due to these locations being somewhat close to each other in memory, we attempted to develop a solution in order to allow our exploit to work consistently, regardless of which memory location the data was stored at.
While brainstorming potential solutions to this problem, we devised a solution using a clever trick. This trick is very similar to using a nop-sled. A nop-sled is when a shell-code payload is prepended with many nops or no-op instructions in order to increase the likelihood of executing the shellcode payload by allowing the application’s execution to be redirected anywhere into the nop-sled that was prepended to the payload and always execute the payload since the nop instructions are valid instructions which do not change the state of the application.
As we thought more about this technique, we began thinking about whether there was anything similar that we could prepend to our text-based command payload which would have the same effect. We immediately decided to try using spaces to prepend to our payload in order to try what we termed as a “space-sled”. Using this space-sled we prepend spaces to our command so that regardless of which location the user-controlled data was copied to, we would be able to point to the latter location in memory and land in a usable portion of the command string.
CVE-2018-9093 - Tunnel Server Backdoor
Lastly, we have the J-Link tunnel server which effectively is a backdoor to J-Link devices via a Segger proxy server. The purpose of the tunnel server is to enable remote debugging of embedded devices, but, given that the tunnel server does not implement even the most basic of security measures, in doing so opens any J-Link device using this feature vulnerable to attack.
When the remote server runs with a J-Link device attached, the JLinkRemoteServer application registers the J-Link device serial number with the Segger tunnel server. In order to remotely access this remote device, a client must connect to the tunnel server and provide a serial number of the device that the client wishes to connect to.
Since serial numbers are 9 decimal digits, this means that there are 10 billion possible serial numbers. Assuming that valid serial numbers are randomly distributed throughout this space and the rate that we can check to see if a serial number is connected is 10 serial numbers/sec (this is about what we’ve seen in our testing) it would take over 31 years to check the entire serial number space. This seemed large enough that it would prove generally unfeasible for an attacker to brute force serial numbers on a large scale.
However, we realized that if we could shrink the space of serial numbers then we could potentially reduce the amount of time required to brute-force the space of serial numbers. In order to attempt to reduce the number of serial numbers that we needed to brute force, we began by trying to gather as much information on device models and serial numbers as we could. We did this by searching online for images of J-Link devices where we were able to read the device serial numbers from the images as well as gather the serial numbers from all of the devices that we had access to. Between these two methods we were able to gather around 30 J-Link serial numbers to analyze.
After reviewing these serial numbers we were able to detect several patterns in the way that Segger assigned J-Link serial numbers. The serial numbers seemed to be divided into three distinct sections: device model, device version, and an incremented device number.
Segger Serial Number Divided into Sections
With this information, we were able to reduce the serial number space required in order to get good coverage of J-Link serial numbers from the initial 10 billion to around 100,000. Using the same rate as above, that effectively reduces the time to brute from from over 31 years to less than 3 hours. This reduction in address space suddenly makes an attack on the Segger J-Link server much more appealing to an attacker.
Impact of Vulnerabilities
The vulnerabilities discovered are listed above in increasing level of severity. Below we discuss the impact of each of these vulnerabilities and explain the potential impact of an attacker exploiting each vulnerability.
The first vulnerability, CVE-2018-9094, is not able to be used to gain code execution due to the custom format string functions that are in use and, even if it were, would be a lower severity simply due to the input vector (the command line) that is used to exploit that vulnerability.
Next up, we have CVE-2018-9095 and CVE-2018-9097. These two vulnerabilities involve malicious files and result in gaining code execution when a malicious file is opened by a J-Link application. These are more severe since malicious files are a common attack vector and are able to be spread via email or any other file transfer mechanism. An attacker could use one of these vulnerabilities to attempt to gain access to the a system by getting an unwitting user to open a malicious file in a vulnerable application. As a result, these vulnerabilities are a high severity, but exploitation still relies on a user opening an untrusted file.
CVE-2018-9096 is our first remote exploit. This exploit allows a user to gain code execution on a system remotely and without any interaction from the victim. This is a critical vulnerability as it allows an attacker to spread throughout a network to any machine that is running the vulnerable application.
Lastly, we have CVE-2018-9093. This vulnerability is perhaps the most severe of these vulnerabilities. This vulnerability allows attackers to gain access into a network, bypassing firewalls and other security systems to gain access inside a network. Once inside the network with this vulnerability an attacker could read or write the firmware of any devices attached to the remote J-Link. To make matters worse, this vulnerability simply requires knowledge of the Segger J-Link serial number scheme and a small bit of reverse engineering to discover the hardcoded “magic numbers” that Segger uses in order to make a connection to via their tunnel server.
Disclosure
Following this research, we disclosed these vulnerabilities to Segger on April 4, 2018. They were acknowledged by Segger shortly later and we have seen many of these issues patched in several of the subsequent releases of the J-Link software.
Conclusion/Takeaways
As we have previously demonstrated with our security research into Hello Barbie and Election Safe Locks, many embedded devices have severe security flaws. With that being said, if you are a developer or device manufacturer who is attempting to build a secure device it is important to consider your supply chain. As we have shown here, important elements of the device development process oftentimes contain vulnerabilities that could compromise the integrity of a device that is being developed as well as the entire network.
Hacking video games poses interesting challenges that sit outside the realm of traditional vulnerability research and exploit development. It requires a different perspective that aims to solve a set of goals that rely heavily on reverse engineering and shares similar techniques to that of malware analysis. However unlike traditional exploit development, when you hack a video game it provides immediate visual feedback.
At Somerset Recon, we find value in researching this form of hacking. While it is a bit esoteric, in the end it is still hunting for vulnerabilities in software. Additionally, much of the software in video games shares similarities to the software we regularly perform security assessments on. These similarities include utilizing custom protocols, assuming trust in the client, and using an architecture built upon legacy software/architecture with features bolted on, etc.
Hammerwatch is one game that encompasses all these elements. It is a top down multiplayer “hack-and-slash” dungeon-crawler that draws direct inspiration from the classic arcade game Gauntlet. The multiplayer gameplay uses a client-server architecture. When starting a multiplayer session a user hosts a game and other clients connect to that user’s game session. Our goal here was to unlock or create abilities in Hammerwatch that the game was not intended to have, to have those newly created abilities work in multiplayer, and to attempt do it all with style.
During our research, we quickly discovered that Hammerwatch had a very loose client-server model. Using the memory editor in Cheat Engine, we were able to set our health value and the server respected the change. This led us to believe that the client was responsible for updating the server of changes and that these changes were not double-checked by the server.
Our next steps were to reverse the codebase to observe what values in the game we could change. Since Hammerwatch is written on Mono, decompiling it with a .NET decompiler gives us the full C# codebase. We used dnSpy for this task. Loading the Hammerwatch.exe executable results in a tree-view which nicely displays all the classes in the game, including the character classes.
Dnspy Provides the Full Decompiled Source
After reviewing the classes, we noted that the ranger character looked interesting, so we decided to focus our efforts on modifying the Ranger class. The Ranger class is extended by a subclass, PlayerRangerActorBehavior, that contains the properties and behaviors of our Ranger character. This subclass contains a function called "Damaged" that controls how the client calculates and reports damage to the world.
public override bool Damaged(WorldObject attacker, int dmg, IBuff buff, bool canKill)
{
if (EnemyHiveMind.Random.NextDouble() < (double)this.dodgeChance)
{
this.dodgeEffectColor = 1f;
this.dodgeSnd.Play3D(this.actor.Position, false, -1f);
Network.SendToAll("RangerDodged", new object[0]);
return false;
}
return base.Damaged(attacker, dmg, buff, canKill);
}
Most of the work is done in the base class, but the ranger can randomly dodge attacks depending on a random number generator. However, an invincibility cheat can be achieved simply by patching the dodge chance check to always return false.
public override bool Damaged(WorldObject attacker, int dmg, IBuff buff, bool canKill)
{
this.dodgeEffectColor = 1f;
this.dodgeSnd.Play3D(this.actor.Position, false, -1f);
Network.SendToAll("RangerDodged", new object[0]);
return false;
}
Invincibility Cheat in Effect. Left-side is what the cheater sees, and the Right-side is what the other players see
Success! The client is dodging all damage indicated by the character blinking, and those dodges are then propagated to the server.
More interesting cheats can be achieved when observing the ranger classes Attack function. This function works by starting some animations, calling ShootArrow in the direction the character is facing, and updating the world about this action.
By replacing the above call to ShootArrow and replacing it with a custom function, we are able to modify the default shoot arrow attack with a custom attack. This attack shoots multiple arrows in a perfect circle around the player, named appropriately as “RainingDeath”.
RainingDeath Custom Attack in Effect - Left-side is what the cheater sees, Right-side is what the other players see
The most interesting part about this cheat is the effect it has on the host and other clients. The other players do not render the “RainingDeath” animations, but they do process the damage to enemies correctly. While it seems odd, it makes perfect sense when you take a look at the how the game handles creature damage. In BaseCreature class, the Damaged function is the handler that’s called when an enemy takes damage. The function is large, but the interesting bits are the Network.SendToAll function calls.
public override bool Damaged(WorldObject attacker, int dmg, IBuff buff, bool canKill)
{
…………
if (base.Health <= 0f)
{
this.dead = true;
if (buff != null && this.HasHitEffect(buff.EffectId))
{
Network.SendToAll("UnitDiedWithHitEffect", new object[]
{
this.actor.NodeId,
buff.EffectId
});
}
else
{
Network.SendToAll("UnitDied", new object[]
{
this.actor.NodeId
});
}
}
…
}
The SendToAll function sends a set of predefined commands to all connected players, including the host, and it is easily abused. While our previous modifications have been focused on modifying our local behavior and seeing if it would propagate to the server, it’s clear that all we had to do was issue “UnitDied” commands repeatedly until there was no one left.
Our analysis of Hammerwatch revealed that it does not implement robust client-server protections and anti-cheating measures. If the game’s authors had made a few design decisions differently these cheats would not be possible. Specifically, creating a mechanism for the server would verify the integrity of a client’s game binary to make sure it has not been tampered with before allowing it to connect, or modifying the client-server model so that only the server were able to receive action updates, keep track of creatures damage, and enforce rules.
While these issues may seem specific to Hammerwatch, they actually extend past this. In our experience, issues that we encounter in game hacking such as custom protocols with similar weaknesses of assuming trust or not properly verifying the sender, are common in software today. All of this combined to make our work with Hammerwatch a good lesson in security as well as a fun game to hack.
The End Result: Playing Hammerwatch using Invincibility Mode, Unlimited Mana Mode, and a Custom Multi-Arrow Spin Attack
IDAPython is a powerful tool that can be used to automate tedious or complicated reverse engineering tasks. While much has been written about using IDAPython to simplify basic reversing tasks, little has been written about using IDAPython to assist in auditing binaries for vulnerabilities. Since this is not a new idea (Halvar Flake presented on automating vulnerability research with IDA scripting in 2001), it is a bit surprising that there is not more written on this topic. This may be partially a result of the increasing complexity required to perform exploitation on modern operating systems. However, there is still a lot of value in being able to automate portions of the vulnerability research process.
In this post we will begin to describe using basic IDAPython techniques to detect dangerous programming constructs which often result in stack-buffer overflows. Throughout this blog post, I will be walking through automating the detection of a basic stack-buffer overflow using the “ascii_easy” binary from http://pwnable.kr. While this binary is small enough to manually reverse in its entirety, it serves as a good educational example whereby the same IDAPython techniques can be applied to much larger and more complex binaries.
Getting Started
Before we start writing any IDAPython, we must first determine what we would like our scripts to look for. In this case, I have selected a binary with one of the most simple types of vulnerabilities, a stack-buffer overflow caused by using `strcpy` to copy a user-controlled string into a stack-buffer. Now that we know what we are looking for, we can begin to think about how to automate finding these types of vulnerabilities.
For our purposes here, we will break this down into two steps:
1. Locating all function calls that may cause the stack-buffer overflow (in this case `strcpy`) 2. Analyzing usages of function calls to determine whether a usage is “interesting” (likely to cause an exploitable overflow)
Locating Function Calls
In order to find all calls to the `strcpy` function, we must first locate the `strcpy` function itself. This is easy to do with the functionality provided by the IDAPython API. Using the code snippet below we can print all function names in the binary:
for functionAddr in Functions():
print(GetFunctionName(functionAddr))
Running this IDAPython script on the ascii_easy binary gives us the following output. We can see that all of the function names were printed in the output window of IDA Pro.
Next, we add code to filter through the list of functions in order to find the `strcpy` function that is of interest to us. Using simple string comparisons will do the trick here. Since we oftentimes deal with functions that are similar, but slightly differing names (such as `strcpy` vs `_strcpy` in the example program) due to how imported functions are named, it is best to check for substrings rather than exact strings.
Building upon our previous snippet, we now have the following code:
for functionAddr in Functions():
if “strcpy” in GetFunctionName(functionAddr):
print hex(functionAddr)
Now that we have the function that we are interested in, we have to identify all locations where it is called. This involves a couple of steps. First we get all cross-references to `strcpy` and then we check each cross-reference to find which cross references are actual `strcpy` function calls. Putting this all together gives us the piece of code below:
for functionAddr in Functions():
# Check each function to look for strcpy
if "strcpy" in GetFunctionName(functionAddr):
xrefs = CodeRefsTo(functionAddr, False)
# Iterate over each cross-reference
for xref in xrefs:
# Check to see if this cross-reference is a function call
if GetMnem(xref).lower() == "call":
print hex(xref)
Running this against the ascii_easy binary yields all calls of `strcpy` in the binary. The result is shown below:
Analysis of Function Calls
Now, with the above code, we know how to get the addresses of all calls to `strcpy` in a program. While in the case of the ascii_easy application there is only a single call to `strcpy` (which also happens to be vulnerable), many applications will have a large number of calls to `strcpy` (with a large number not being vulnerable) so we need some way to analyze calls to `strcpy` in order to prioritize function calls that are more likely to be vulnerable.
One common feature of exploitable buffers overflows is that they oftentimes involve stack buffers. While exploiting buffer overflows in the heap and elsewhere is possible, stack-buffer overflows represent a simpler exploitation path.
This involves a bit of analysis of the destination argument to the strcpy function. We know that the destination argument is the first argument to the strcpy function and we are able to find this argument by going backwards through the disassembly from the function call. The disassembly of the call to strcpy is included below.
In analyzing the above code, there are two ways that one might find the destination argument to the _strcpy function. The first method would be to rely on the automatic IDA Pro analysis which automatically annotates known function arguments. As we can see in the above screenshot, IDA Pro has automatically detected the “dest” argument to the _strcpy function and has marked it as such with a comment at the instruction where the argument is pushed onto the stack.
Another simple way to detect arguments to the function would be to move backwards through the assembly, starting at the function call looking for “push” instructions. Each time we find an instruction, we can increment a counter until we locate the index of the argument that we are looking for. In this case, since we are looking for the “dest” argument that happens to be the first argument, this method would halt at the first instance of a “push” instruction prior to the function call.
In both of these cases, while we are traversing backwards through the code, we are forced to be careful to identify certain instructions that break sequential code flow. Instructions such as “ret” and “jmp” cause changes in the code flow that make it difficult to accurately identify the arguments. Additionally, we must also make sure that we don’t traverse backwards through the code past the start of the function that we are currently in. For now, we will simply work to identify instances of non-sequential code flow while searching for the arguments and halt the search if any instances of non-sequential code flow is found.
We will use the second method of finding arguments (looking for arguments being pushed to the stack). In order to assist us in finding arguments in this way, we should create a helper function. This function will work backwards from the address of a function call, tracking the arguments pushed to the stack and return the operand corresponding to our specified argument.
So for the above example of the call to _strcpy in ascii_easy, our helper function will return the value “eax” since the “eax” register stores the destination argument of strcpy when it is pushed to the stack as an argument to _strcpy. Using some basic python in conjunction with the IDAPython API, we are able to build a function that does that as shown below.
def find_arg(addr, arg_num):
# Get the start address of the function that we are in
function_head = GetFunctionAttr(addr, idc.FUNCATTR_START)
steps = 0
arg_count = 0
# It is unlikely the arguments are 100 instructions away, include this as a safety check
while steps
Using this helper function we are able to determine that the “eax” register was used to store the destination argument prior to calling _strcpy. In order to determine whether eax is pointing to a stack buffer when it is pushed to the stack we must now continue to try to track where the value in “eax” came from. In order to do this, we use a similar search loop to that which we used in our previous helper function:
# Assume _addr is the address of the call to _strcpy
# Assume opnd is “eax”
# Find the start address of the function that we are searching in
function_head = GetFunctionAttr(_addr, idc.FUNCATTR_START)
addr = _addr
while True:
_addr = idc.PrevHead(_addr)
_op = GetMnem(_addr).lower()
if _op in ("ret", "retn", "jmp", "b") or _addr
In the above code we perform a backwards search through the assembly looking for instructions where the register that holds the destination buffer gets its value. The code also performs a number of other checks such as checking to ensure that we haven’t searched past the start of the function or hit any instructions that would cause a change in the code flow. The code also attempts to trace back the value of any other registers that may have been the source of the register that we were originally searching for. For example, this code attempts to account for the situation demonstrated below.
Additionally, in the above code, we reference the function is_stack_buffer(). This function is one of the last pieces of this script and something that is not defined in the IDA API. This is an additional helper function that we will write in order to assist us with our bug hunting. The purpose of this function is quite simple: given the address of an instruction and an index of an operand, report whether the variable is a stack buffer. While the IDA API doesn’t provide us with this functionality directly, it does provide us with the ability to check this through other means. Using the get_stkvar function and checking whether the result is None or an object, we are able to effectively check whether an operand is a stack variable. We can see our helper function in the code below:
Note that the above helper function is not compatible with the IDA 7 API. In our next blog post we will present a new method of checking whether an argument is a stack buffer while maintaining compatibility with all recent versions of the IDA API.
So now we can put all of this together into a nice script as shown below in order to find all of the instances of strcpy being used in order to copy data into a stack buffer. With these skills it is possible for us to extend these capabilities beyond just strcpy but also to similar functions such as strcat, sprintf, etc. (see the Microsoft Banned Functions List for inspiration) as well as to adding additional analysis to our script. The script is included in its entirety at the bottom of the post. Running the script results in our successfully finding the vulnerable strcpy as shown below.
Script
def is_stack_buffer(addr, idx):
   inst = DecodeInstruction(addr)
   return get_stkvar(inst[idx], inst[idx].addr) != None
def find_arg(addr, arg_num):
# Get the start address of the function that we are in
function_head = GetFunctionAttr(addr, idc.FUNCATTR_START)
steps = 0
arg_count = 0
# It is unlikely the arguments are 100 instructions away, include this as a safety check
while steps
Back in July 2016, AttackIQ announced that they were hosting a GameOn! Competition for their FireDrill platform. FireDrill aims to aid companies in improving their network security posture by performing continuous real-world network attack simulations, they call scenarios, on a company’s network to test whether it is susceptible to particular vulnerabilities and network mis-configurations. Scenarios can be selected, deployed, and controlled from an administration console from the AttackIQ cloud. Once a scenario is chosen, AttackIQ servers communicate and instrument a software agent that has been deployed on the host. This agent performs local/remote attacks on the company’s network, such as testing for pass the hash or outbound firewall rules, like TOR traffic. Note that these tests are harmless and only check for vulnerabilities without actually exploiting them. If a security mechanism, such as a firewall, properly blocks an attack, then the scenario will fail at the last phase it was running. Finally, it logs the results back to the cloud, which can be viewed by the user.
The competition required each team’s submission to be in the form of a custom attack scenario. We took this as an opportunity to spend some time searching for vulnerabilities in common supervisory control and data acquisition (SCADA) human machine interfaces (HMIs) and create custom FireDrill scenarios for them.
This lead us to investigate Ecava IntegraXor and Sielco Sistemi Winlog Lite, popular SCADA HMIs that run on Windows platforms. We discovered that it was possible to gain code execution by crafting a project file that abuses the internal scripting engines in both HMIs. IntegraXor uses a Javascript engine and Winlog Lite uses a custom runtime scripting engine, which executes WLL files. This technique could be compared to malicious macros in Microsoft-related project files. Our reasoning was that many users and defensive technologies are conscious of potentially malicious Windows executables, PDFs, Adobe Flash files, JARs, etc. However, it was less likely that they are aware of dangerous SCADA HMI files. We created two five-phase scenarios named IGX-Poison and WLL-Poison. Other than phase 1, both scenarios are identical in behavior.
Phase 1 - Code Execution
The deployed agent for this scenario starts by running a malicious (poisoned) project file, on a victim host. This can be thought of as a user or system administrator running an IntegraXor or Winlog Lite project file that they had received over email or some other means. The poisoned file contains SCADA simulation files and malicious scripting code. The malicious scripting code spawns a set of CMD commands and outputs a malicious base64 encoded Windows batch file. The batch file is then decoded using certutil (a default Windows program). The result is a FTP-base reverse shell that is then executed. Because these HMIs run as an administrative user, the malicious program also gets full administrative privileges.
In IGX-Poison, the project code abuses a design flaw in IntegraXor’s HMI ActiveX engine that allows us to execute CMD commands on the host, which we use to decrypt an included malicious batch file and run it. We encrypt the batch file as a means to circumvent and test the network’s antivirus, intrusion detection systems (IDS), and intrusion prevention systems (IPS).
Malicious Javascript embedded within the poisoned IntegraXor project
Incredible enough, the process is nearly identical in WLL-Poison. However, the malicious code is written in WinLog Lite’s custom programming language and abuses its ShellExec function.
Malicious WLL code embedded within the poisoned Winlog Lite project
Phase 2 - Persistence
This is a setup phase that checks if access controls are in place to prevent an attacker from creating files and directories for storing harvested data. If proper access controls are in place, the scenario will fail at this step.
Phase 3 - Reverse Shell
This phase attempts to create a persistent reverse shell by using the Windows built-in FTP client. We chose this route to circumvent antivirus, reduce the dependencies on post-exploitation toolkits, and rely purely on vanilla Windows services. It works by running a script that continuously downloads a text file from an attacker’s remote FTP server and execute its contents.
Reverse shell batch file
Phase 4 - Harvesting
Assuming that an attacker now has remote shell access, the harvesting stage simulates an attacker searching for sensitive data on a host. It is performed by scanning local disks for SCADA HMI projects and extracting database connections strings from the files. Sensitive information can be harvested from these project files and additional data can be gathered for future data exfiltration.
Phase 5 - Exfiltration
The exfiltration phase attempts to send harvested data back to the attacker covertly. This phase encrypts and compresses harvested data into a ZIP file. The ZIP file is then split into 10-Byte chunks and sent over the network to the attacker over HTTP. If at any point a firewall blocks data transfer back to an attacker, this scenario phase will fail.
Defense
When using IntegraXor or Winlog Lite on a production network, it’s possible to implement security measures to prevent exploitation of the vulnerability we highlight in this scenario. The most effective would be limiting the network’s internet access. Doing so would drastically decrease the capability of an attacker to communicate with a compromised host. Application whitelisting, blocking all ingress and egress traffic/ports at the firewall, employing network IDS/IPS, disabling cmd.exe and batch file execution, and email filters to block or flag project files are additional system and network security considerations. In the end, it's important that users and companies understand the risks that SCADA project files pose and how they could be leveraged to exploit and exfiltrate data from a network.