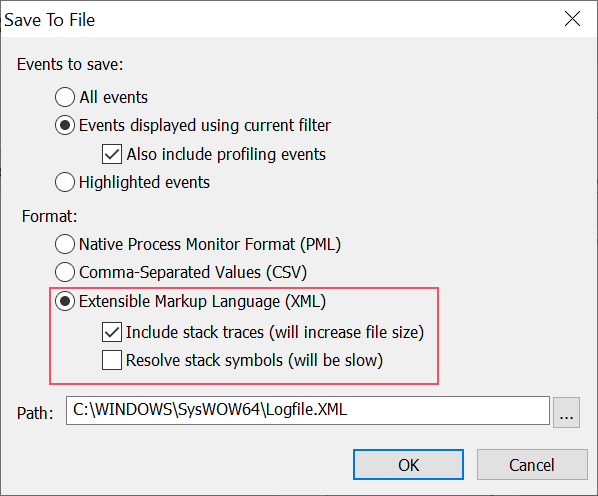
In this blogpost, I will share a simple technique to circumvent the check that was introduced in Windows 10 build 1809 to detect user-mode APC injection. This technique will only allow us to "bypass" the sensor when we're running code from kernel-mode, i.e., queuing a user-mode APC to a remote thread from user-mode will still be logged. For more information about this new feature, please check out my previous blogpost.
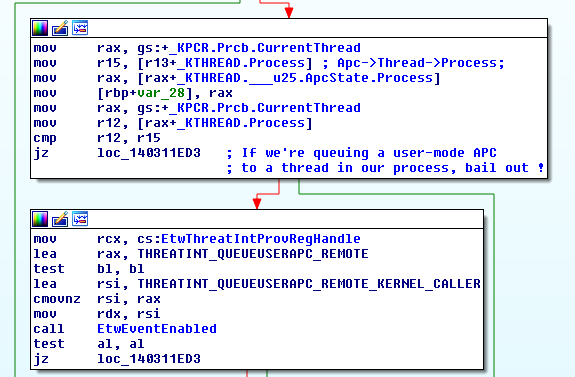
In short, the sensor will log any user-mode APCs queued to a remote thread, be it from user-mode or kernel-mode. The most important check is implemented in the kernel function : EtwTiLogQueueApcThread as shown below.
(Click to zoom)
So queuing a user-mode APC to a thread in a process other than ours is considered suspicious and will be logged. However, when having code execution in kernel-mode we can queue a kernel-mode APC that will run in the context of the target process and from there we can queue a user-mode APC. This way, the check when KeInsertQueueApc is called from the kernel-mode APC will always yield (UserApc->Thread->Process == CurrentThread->Process).
The driver registers a CreateThreadNotifyRoutine in its DriverEntry.
CreateThreadNotifyRoutine queues a kernel-mode APC to a newly created thread.
The kernel-mode APC is delivered as soon as the IRQL drops below APC_LEVEL in the target thread in which we allocate executable memory in user-space, copy the shellcode, then queue the user-mode APC.
The user-mode APC is delivered in user-mode.
The only issue here is that Windows Defender's ATP will still log the allocation of executable memory thanks to another sensor.
Thanks for your time :)
Follow me on Twitter : here
objdump is one of the most widley adopted linear disassembler, which often gives a significant help during initial binary analysis.A linear disassmbling algorithm, as opposed to a recursive one, is faster but also more prone to errors, as it only weeps through the file sections one instruction at a time, instead of inspecting every conditional statement.
Here, I would like to give a simple demo of how easily objdump can be confused, by filling the binary with instructions in the rdata section and strings in the text section.
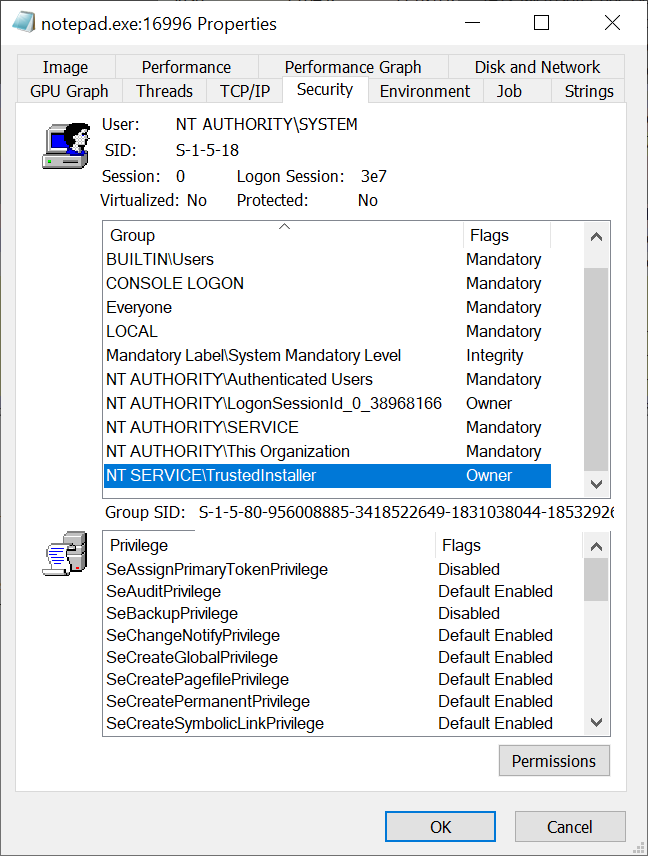
During my implementation of NT Debug Object support in NtObjectManager (see a related blog here) I added support to open the debug object for a process by using the ProcessDebugObjectHandle process information class. This immediately struck me as something which could be used for anti-debugging, so I did a few searches and sure enough I was right, it's already documented (for example this link).
With that out of the way I went back to doing whatever it was I should have really been doing. Well not really, instead I considered how you could bypass this anti-debug check. This information was harder to find, and typically you just hook NtQueryInformationProcess and change the return values. I wanted to do something more sneaky, so I looked at various examples to see how the check is done. In pretty much all cases the implementation is:
The code checks if the query is successful and then whether a valid debug object handle has been returned, returning TRUE if that's the case. This would indicate the process is being debugged. If the an error occurs or the debug object handle is NULL, then it indicates the process is not being debugged.
To progress I'd now analyse the logic and find the failure conditions for the detection, fortunately the code isn't very big. We want the function to return FALSE even though the debugger is attached, this means we need to either:
Make the query return an error code even though a debugger is attached, or...
Let the query succeed but return a NULL handle.
We've reached the limit with what we can do staring at the anti-debug code. We'll dig into the other side, the kernel implementation of the information class. It boils down to a single function:
If there's no debug port attached then return STATUS_PORT_NOT_SET.
If the process holding the debug port is at a higher protection level return STATUS_PROCESS_IS_PROTECTED.
Finally open a handle to the debug object and return the status code from the open operation.
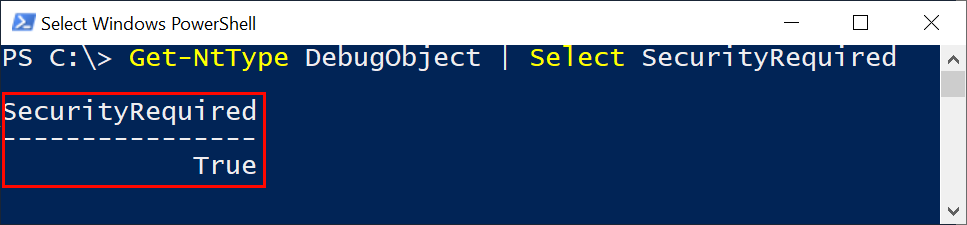
For our purposes case 1 is a non-starter as it means the process is not being debugged. Case 2 is interesting but as the Process object parameter (which comes from the handle passed in the query) will be the same as KeGetCurrentProcess that'd never fail. We're therefore all in on case 3. It turns out that the debug objects, like many kernel objects are securable resources. We can confirm that by using NtObjectManager by querying for the DebugObject type and checking its SecurityRequired flag.
If SecurityRequired is true then it means the object must have a security descriptor whether it has a name or not. Therefore we can cause the call to ObOpenObjectByPointer to fail by setting a security descriptor which prevents the process using the anti-debug check opening the debug object and therefore returning FALSE from the check.
To test that we need a debugger and a debuggee. As I do my best to avoid writing new C++ code I converted the anti-debug code to C# using my NtApiDotNet library:
using(varresult=NtProcess.Current.OpenDebugObject(false)){if(result.IsSuccess){Console.ForegroundColor=ConsoleColor.Red;Console.WriteLine("[ERROR] We're being Debugged, stahp!");}else{Console.ForegroundColor=ConsoleColor.Green;Console.WriteLine("[SUCCESS] Go ahead, we're cool!");}}
I don't bother to check for a NULL handle as the kernel code indicates that can't happen, either you get an error, or you get a valid handle. Anyway it doesn't need to be robust, ..., for me ;-)
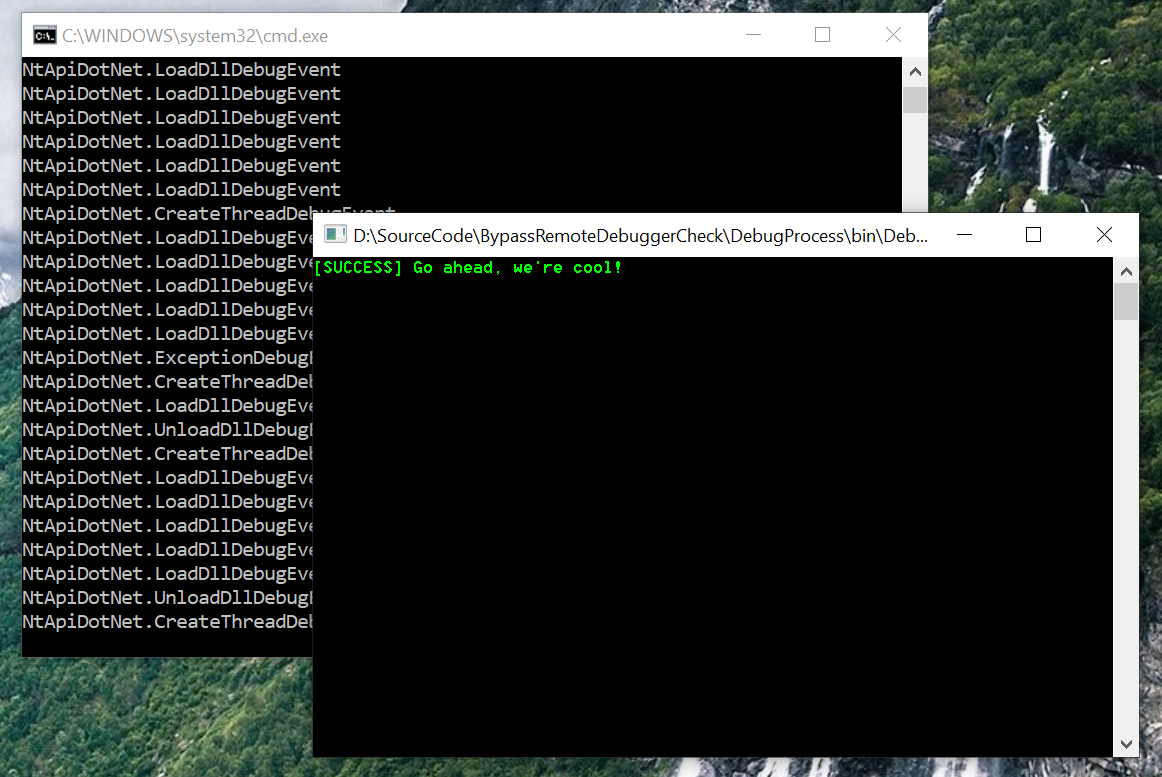
This code is pretty simple, we create the debuggee process with the DebugProcess flag. When CreateProcess is called the APIs will create a new debug object and attach it to the new process. We can then open the debug object and set an appropriate security descriptor to block the open call in the debuggee. Finally we can just poll the debug object which resumes the target, looping until completion.
What can we set as the security descriptor? The obvious choice would be to set an empty DACL which blocks all access. This is distinct from a NULL DACL which allows anyone access. We can specify an empty DACL in SDDL format using "D:". If you test with an empty DACL the debuggee can still open the debug object, this is because the kernel specified MAXIMUM_ALLOWED, as the current user is the owner of the object this allows for READ_CONTROL and WRITE_DAC access to be granted. If we're an administrator we can change the owner field (or by using a WontFix bug) however instead we'll just specify the OWNER_RIGHTS SID with no access. This will block all access to the owner. The SDDL for that is "D:(A;;0;;;OW)".
If you put this all together yourself you'll find it works as expected. We've successfully circumvented the anti-debug check. Of course this anti-debug technique is unlikely to be used in isolation, so it's not likely to be of much real use.
The anti-debug author is trying to model one state variable, whether a process is being debugged, by observing the state of something else, the success or failure from opening the debug object port. You might assume that as the anti-debug check is directly interacting with a debug artefact then there's a direct connection between the two states. However as I've shown that's not the case as there's multiple ways the failure case can manifest. The code could be corrected to check explicitly for STATUS_PORT_NOT_SET and only then indicate the process is not being debugged. Of course this behavior is not documented anywhere, and even it was could be subject to change.
The problem with the anti-debug code is not that you can set a security descriptor on the debug object and get it to fail but the code itself does take into accurately take into account the thing its trying to check. This problem demonstrates the fundamental difficulty in writing secure code, specifically:
Any non-trivial program has a state space too large to accurately model in finite time which leads to unexpected or undefined behavior.
Or put another way:
The time constrained programmer writes what works in testing, not what is correct. While bypassing anti-debug is hardly a major security issue (well unless you write DRM code), the process I followed here is pretty much the same for any of my bugs. I thought it'd be interesting to see my approach to these sorts of problems.
This blogpost is about a vulnerability that I found in Panda Antivirus that leads to privilege escalation from an unprivileged account to SYSTEM.
The affected products are : Versions < 18.07.03 of Panda Dome,
Panda Internet Security, Panda Antivirus Pro, Panda Global Protection,
Panda Gold Protection, and old versions of Panda Antivirus >= 15.0.4.
The vulnerability was fixed in the latest version : 18.07.03
The Vulnerability:
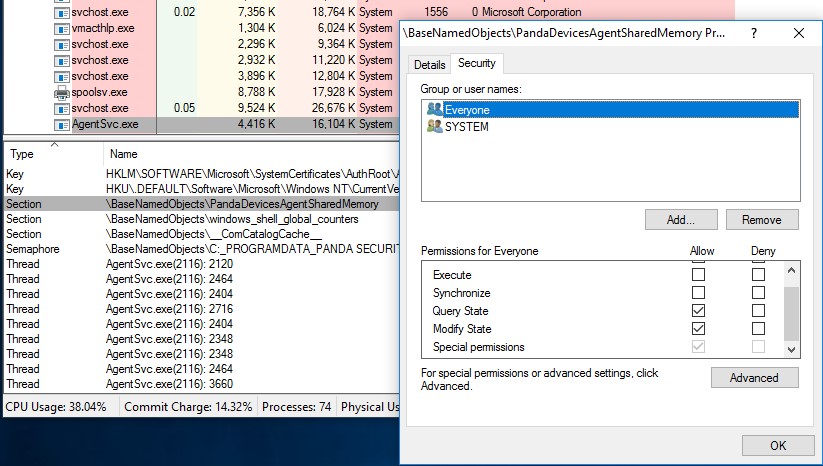
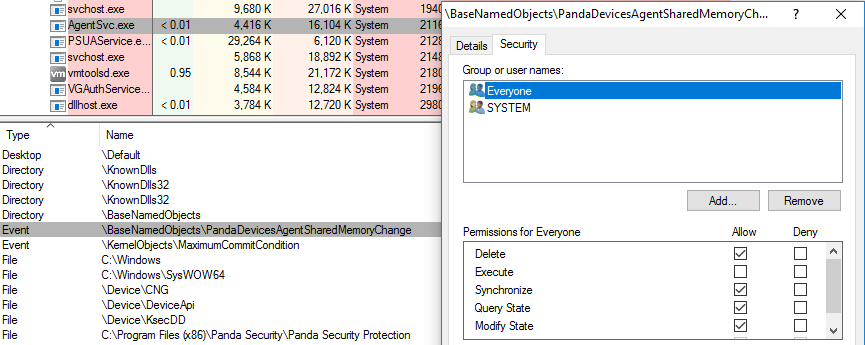
The vulnerable system service is AgentSvc.exe. This service creates a global section object and a corresponding global event that is signaled whenever a process that writes to the shared memory wants the data to be processed by the service. The vulnerability lies in the weak permissions that are affected to both these objects allowing "Everyone" including unprivileged users to manipulate the shared memory and the event.
(Click to zoom)
(Click to zoom)
Reverse Engineering and Exploitation :
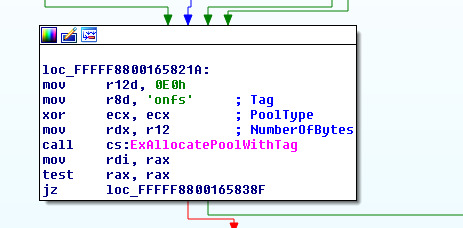
The service creates a thread that waits indefinitely on the memory change event and parses the contents of the memory when the event is signaled. We'll briefly describe what the service expects the contents of the memory to be and how they're interpreted.
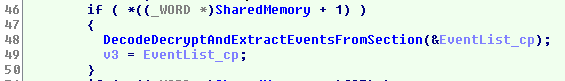
When the second word from the start of the shared memory isn't zero, a call is made to the function shown below with a pointer to the address of the head of a list.
(Click to zoom)
The structure of a list element looks like this, we'll see what that string should be representing shortly :
typedef struct StdList_Event { struct StdList_Event* Next; struct StdList_Event* Previous; struct c_string { union { char* pStr; char str[16]; }; unsigned int Length; unsigned int InStructureStringMaxLen; } DipsatcherEventString; //.. };
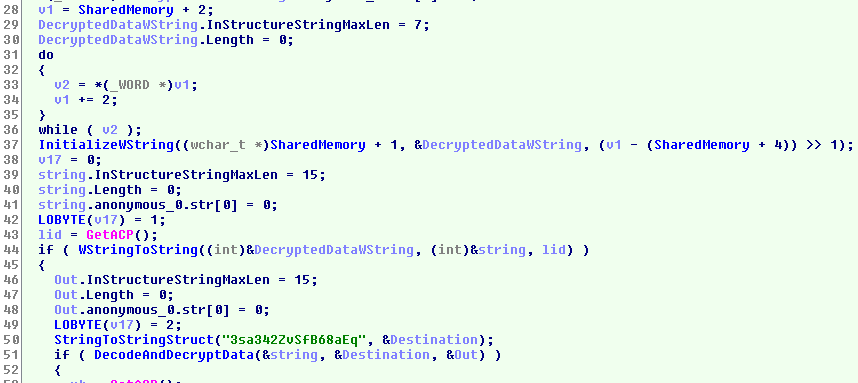
As shown below, the code expects a unicode string at offset 2 of the shared memory. It instantiates a "wstring" object with the string and converts the string to ANSI in a "string" object. Moreover, a string is initialized on line 50 with "3sa342ZvSfB68aEq" and passed to the function "DecodeAndDecryptData" along with the attacker's controlled ANSI string and a pointer to an output string object.
(Click to zoom)
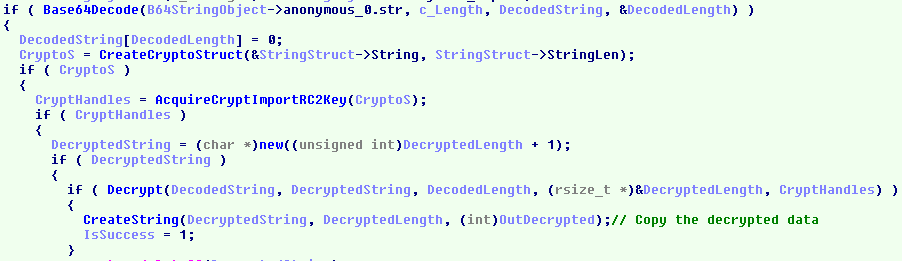
The function simply decodes the string from base64 and decrypts the result using RC2 with the key "3sa342ZvSfB68aEq". So whatever we supply in the shared memory must be RC2 encrypted and then base64 encoded.
(Click to zoom)
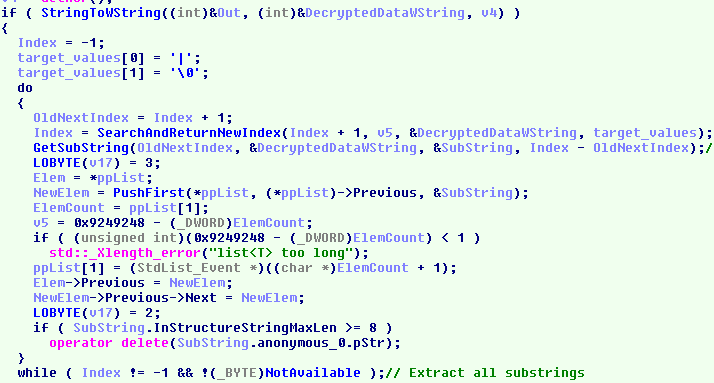
When returning from the above function, the decoded data is converted to a "wstring" (indicating the nature of the decrypted data). The do-while loop extracts the sub-strings delimited by '|' and inserts each one of them in the list that was passed in the arguments.
(Click to zoom)
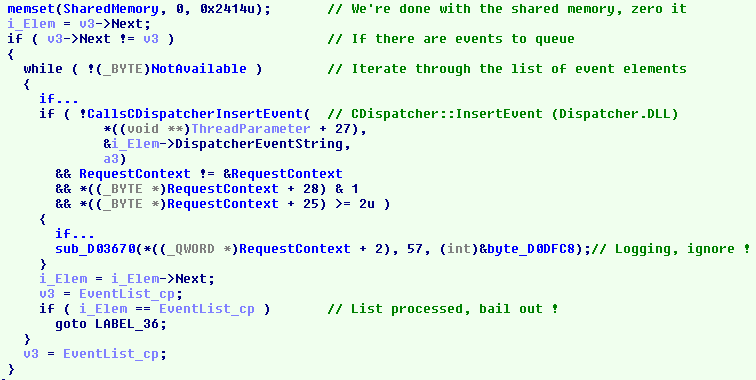
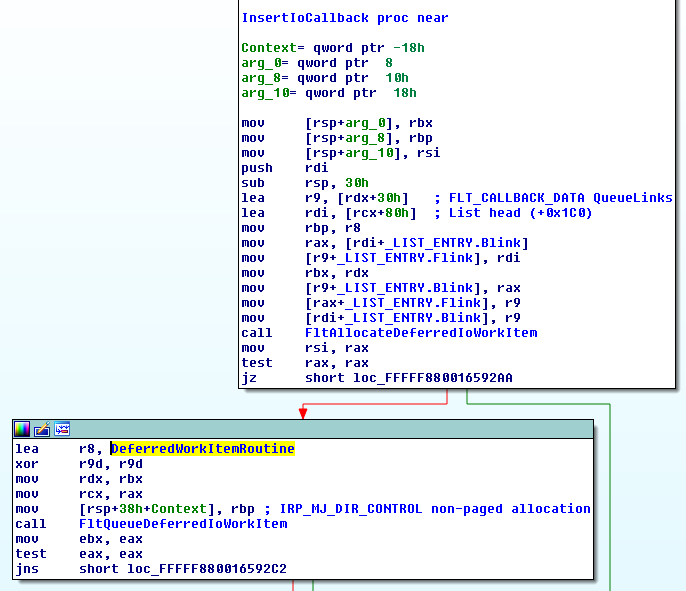
When returning from this function, we're back at the thread's main function (code below) where the list is traversed and the strings are passed to the method InsertEvent of the CDispatcher class present in Dispatcher.dll. We'll see in a second what an event stands for in this context.
(Click to zoom)
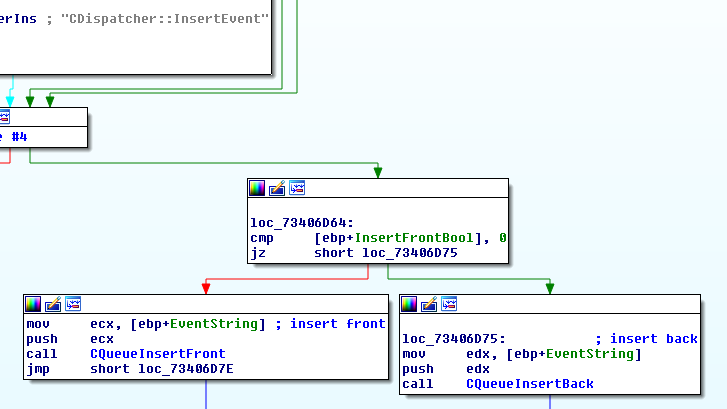
In Dispatcher.dll we examine the CDispatcher::InsertEvent method and see that it inserts the event string in a CQueue queue.
(Click to zoom)
The queue elements are processed in the CDispatcher::Run method running in a separate thread as shown in the disassembly below.
(Click to zoom)
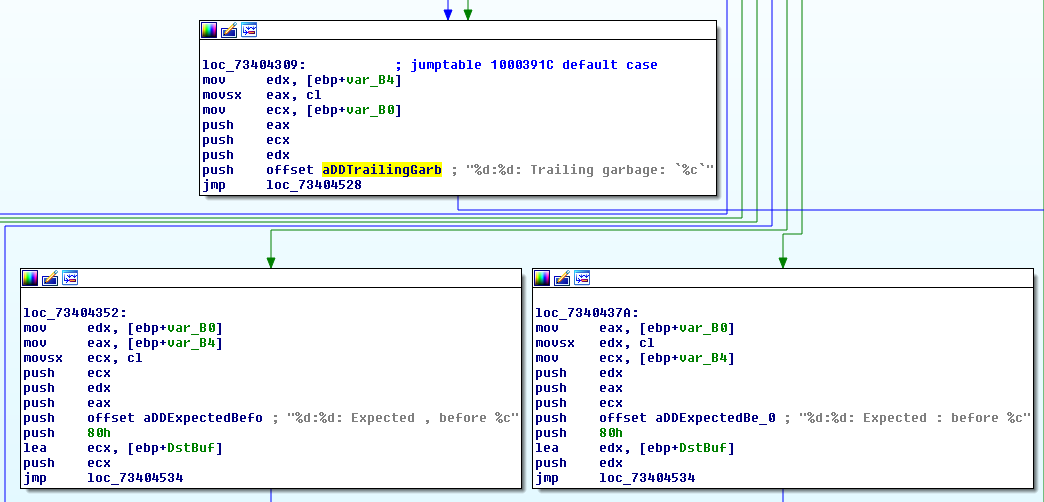
The CRegisterPlugin::ProcessEvent method does parsing of the attacker controlled string; Looking at the debug error messages, we find that we're dealing with an open-source JSON parser : https://github.com/udp/json-parser
(Click to zoom)
Now that we know what the service expects us to send it as data, we need to know the JSON properties that we should supply.
The method CDispatcher::Initialize calls an interesting method CRegisterPlugins::LoadAllPlugins that reads the path where Panda is installed from the registry then accesses the "Plugins" folder and loads all the DLLs there.
A DLL that caught my attention immediately was Plugin_Commands.dll and it appears that it executes command-line commands.
(Click to zoom)
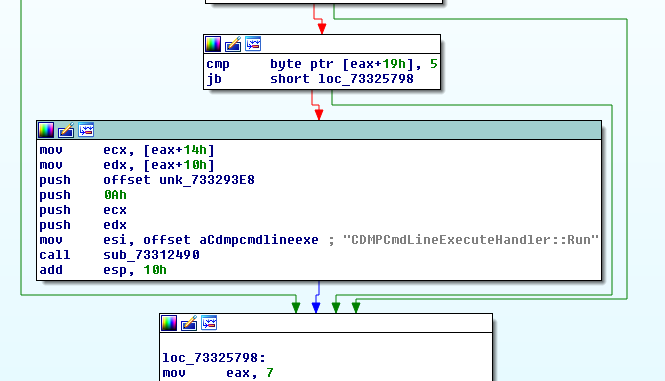
Since these DLLs have debugging error messages, they make locating methods pretty easy. It only takes a few seconds to find the Run method shown below in Plugin_Commands.dll.
(Click to zoom)
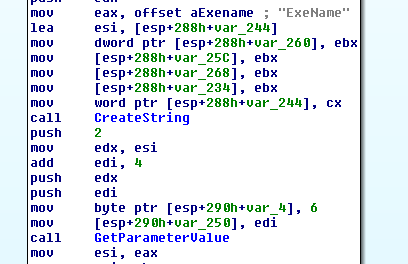
In this function we find the queried JSON properties from the input :
(Click to zoom)
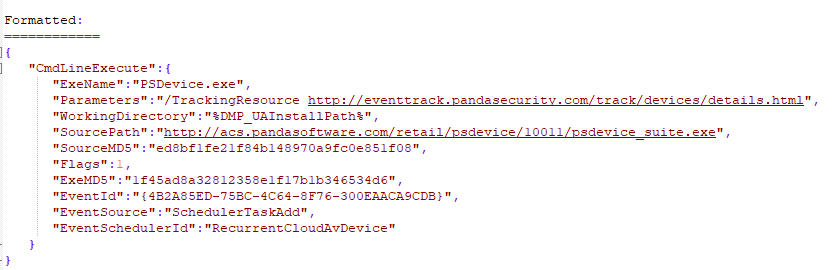
It also didn't hurt to intercept some of these JSON messages from the kernel debugger (it took me a few minutes to intercept a command-line execute event).
(Click to zoom)
The ExeName field is present as we saw in the disassembly, an URL, and two md5 hashes. By then, I was wondering if it was possible to execute something from disk and what properties were mandatory and which were optional.
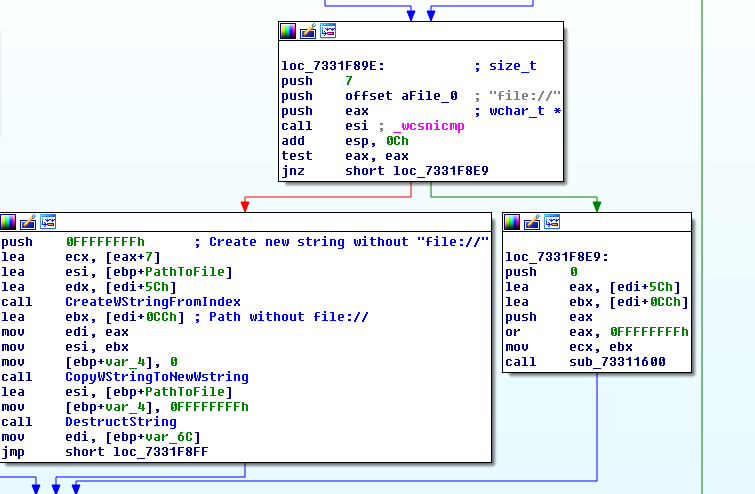
Tracking the SourcePath property in the Run method's disassembly we find a function that parses the value of this property and determines whether it points to an URL or to a file on disk. So it seems that it is possible to execute a file from disk by using the file:// URI.
(Click to zoom)
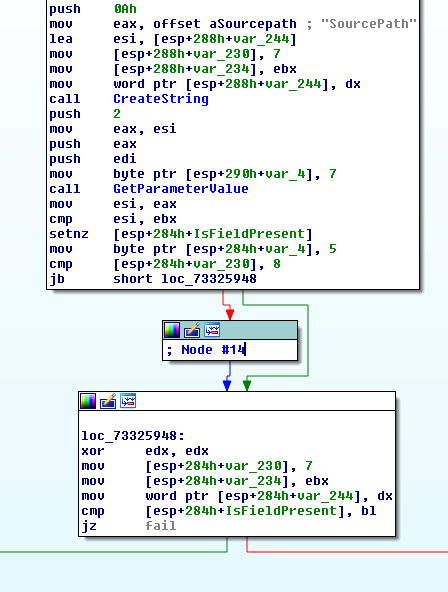
Looking for the mandatory properties, we find that we must supply at minimum these two : ExeName and SourcePath (as shown below).
Fails (JZ fail) if the property ExeName is absent
Fails if the property SourcePath is absent
However when we queue a "CmdLineExecute" event with only these two fields set, our process isn't created. While debugging this, I found that the "ExeMD5" property is also mandatory and it should contain a valid MD5 hash of the executable to run.
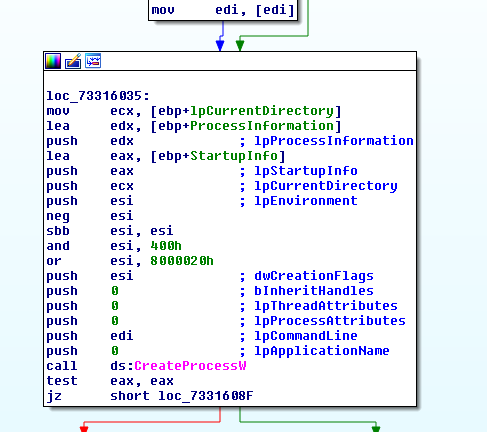
The function CheckMD5Match dynamically calculates the file hash and compares it to the one we supply in the JSON property.
(Click to zoom)
And if successful the execution flow takes as to "CreateProcessW".
(Click to zoom)
Testing with the following JSON (RC2 + Base64 encoded) we see that we successfully executed cmd.exe as SYSTEM :
The final exploit drops a file from the resource section to disk, calculates the MD5 hash of cmd.exe present on the machine, builds the JSON, encrypts then encodes it, and finally writes the result to the shared memory prior to signaling the event.
Also note that the exploit works without recompiling on all the products affected under all supported Windows versions.
Intro Recently, I have decided to tackle another challenge from the Practical Binary Analysisbook, which is the latest one from Chapter 7.
It asks the reader to create a parasite binary from a legitimate one. I have picked ps, the process snapshot utility, where I have implanted a bind-shell as a child process.
DISCLAIMER : The following PoC will work only on a non-PIE binary due to the hardcoded entry-point address
We are not going to overwrite the saved RET on the stack (we're gonna have a different pointer available, without touching the stack protector). We are also going to:
beat ASLR with an initial tiny little taste of brute force combined with a partial overwrite
Noticing a good deal of unused code reaffirmed my feeling that this app was either intended to be solvable in multiple ways or was expected to be solved in a very painful way, requiring multiple steps and gadgets to be used (which would mean that the originally intended solution was slightly more complicated than what I came up with).
For the sake of brevity, I am only going to bring up parts of the code I found relevant for getting arbitrary code execution.
First, there's a simple structure definition, holding two buffers and an integer:
OK, now the main() function (this is where the uinfo structure is instantiated, by the way):
From all of the above, we are in fact only interested in:
1) line 75: an instance of the uinfo structure gets declared as a local variable, which means it's on the local stack of the main() function
2) line 91: the address of the print_listing() function is assigned to the merchant.sfunc integer value
3) line 113: if we type '3', we call the function from the merchant.sfunc address, passing the address of the merchant structure as an argument.
4) line 107: if we type '1', we call the setup_account() function.
We don't care about the print_listing() function, we are not going to use it, neither anything else not mentioned so far.
Now, the setup_account() function. This is where our neat buffer overflow resides:
The vulnerability is sitting in the expression being the first argument to memcpy().
As temp is 128 bytes long, user->name can be up to 32 bytes and the fixed " is a " string is 6 bytes long, we are able to overflow the user->desc buffer by 38 bytes.
If we look at the uinfo structure definition again, we can see that the sfunc pointer resides right after the desc buffer, so it becomes clear how we are going to achieve execution control. We are actually going to exploit this three times to execute arbitrary code.
What's useful - a few gadgets
On line 69, there's a nice and very simple function print_name():
It's not called anywhere in the code, but it's definitely a good gadget for leaking. Will print any buffer pointed by the argument, until a nullbyte is encountered.
Also, on line 29, there's a definition of a strange function. This function does not get called anywhere from the rest of the program, clearly suggesting it being intended to be used as a gadget.
It simply writes 8 bytes of the buffer pointed by the value pointed by its argument (a pointer to a pointer) to the standard output:
In fact I found it quite handy using it as a gadget in leaking information needed for properly constructing the final code execution payload.
Leaking the address space layout
So, we want to overwrite the sfunc integer with an address of the print_name() function, as it appears to be the best (simplest) way to leak some memory.
This is how the stack looks like when the setup_account() is called (with 31 'A' characters + newline as username, plus 90 'B' characters to fill the desc (32+90 = 128), to stop exactly before touching the original sfunc value (the address of the print_name() function):
Let's see what offsets our functions have (output from gdb on a binary that was not run before, hence all bases are 0x00000 and only offsets are visible):
OK, so we can do a partial overwrite (by using 130 bytes instead of 132), only overwrite two least significant bytes of the pointer, leaving the base value (which we won't know at the time of exploitation) alone. This is a common ASLR bypass technique. We want to 9e0 become be2.
The problem is that we can't simply overwrite half-bytes, only whole bytes. This means we have keep trying (brute force) with some arbitrary value of the first half-byte we do not know (because it's part of the base provided by ASLR), until we hit an instance of the program when in fact that half-byte will be equal to it, so overwriting it with our arbitrary value won't mess up the address.
'b' is the value I chose, as I saw it appearing in an actual address in gdb (see the screenshot above).
Hence I decided to try doing this partial overwrite to print_name with an arbitrary value of 0xbbe2, whereas the first be2 is the known offset of the `print_name` function while the preceding 'b' half-byte is a guess. First two most significant bytes are left intact (it's important to avoid sending out the trailing newline, as it will overwrite the third least significant byte with 0x0a and we definitely don't want that!):
A sneak peak of the exploit code
To automate this a bit, the routine was put into a loop:
This does not need many attempts as there are only 16 possible values a half-byte can have.
If the address is incorrect, the program will crash right after calling the 'View info' option by sending '3'. If it does not crash, print_name(&merchant) was successfully called, with the entire merchant (name + desc + print_name_addr) content being printed out up until the nearest nullbyte down the stack.
And this is how it looks like:
This way we have leaked the entire base of the code segment, after guessing its least-significant half-byte. Now we can do calculations, so we know exactly the value we'll overwrite the sfunc pointer next (we will NOT restart the program from now, but keep overflowing and calling from now on - no more bruteforce!), to achieve arbitrary code execution.
Again, the exploit snippet:
Calculating libc system() - the hard way
So, I obviously thought of the simplest system("sh") similar to ret2libc. Let's just overwrite the sfunc with the address of the libc system() method.
But how are we going to know what it is? Well, we can obviously calculate the offset between system() and printf():
So, in our libc printf()'s address is 0xd0f0 above system()'s. Hence, all we'll need to do to achieve system()'s address will be a subtraction of this value. Then another overwrite with setup_account() and we should get our shell.
OK, where do we get that (printf()'s address) value from? It should be in our address space (GOT, in the data segment), because printf() is being used by our target program so it is definitely linked and already resolved in GOT by the PLT routine (the PLT routine is in the code segment, by the way).
A quick search showed that this is the case (the program was broken on a breakpoint at setup_account(), so GOT was resolved already (0xb7707000 0xb7708000 was the range of the data segment in that instant):
The above also showed that the relevant GOT entry (0xb7707010) was located at offset 0x10 of the current base address of the data segment (0xb7707010 - 0xb7707000 = 0x10).
But then I thought: but how do we leak the data segment address?
I started looking at the code to notice that it is being passed on the stack, e.g. for the ulisting-operating functions like make_listing().
I could read that from the stack. But how do I leak the stack address first?
Oh fuck no, it looks like I am going to have to redirect the execution to that make_note() function first and exploit it first? Nah, this is madness. There has to be an easier way!
Calculating libc system() from here - the easy way
So, below is a sample full output of the vmmap command (this time addresses are slightly different than the ones earlier, this is due ASLR, nonetheless the same rules apply):
Notice something? The three consecutive segments marked red, are, respectively:
the code segment
the read only data segment
the data segment
And they create a continuous range of addresses, which suggests they are aligned at fixed offsets from each other. Let's run the program several times and check if this is the case:
Yup. We can clearly see that data, code and rodata share the same base. Awesome, looks like we found a shortcut.
rodata is is 0x2000 bytes greater than code, data is 0x1000 greater than rodata.
So, once we have the base for the code segment, we simply add 0x3000 to it and get the base for the data segment. Then we add the known offset and we know the address of printf()'s GOT entry. So we know where to read from the libc printf() address. Then we can calculate the address of system().
The exploitation algorithm from here
The first overflow allowed us to leak the base of the code segment and calculate everything else we need for exploitation. Now we want to:
Trigger the overflow for the second time, this time to overwrite the sfunc value with the address of the write_wrap() function (which is perfectly suited to leak the GOT after being provided its address, because the GOT itself is a pointer). With the GOT address put in front of the merchant object (name buffer), so it becomes the argument to the sunc(&merchant) call.
Leak the printf() libc address by calling the newly overwritten sfunc.
Trigger the overflow for the third time, this time to overwrite the sfunc value with the address of system(), while putting the arbitrary command in front of the merchant object (name buffer).
Cll it!
How the second overflow unexpectedly failed and why. read() and strncpy() to the rescue.
So, the last surprise here was that the second overflow failed. Instead of leaking the GOT, the whole buffer was printed again. This meant that the sfunc was not overwritten this second time and that in result of "pressing" '3', print_name() was called once again.
After looking at the code I figured out why. The merchant->user and merchant->desc buffers are initialized with nullbytes only before the while loop and never again.
This means that after filling both buffers with non-null values, the next time setup_account() calls this memcpy:
the strlen(user->desc) expression is going to return much more than 32 (as it did in the first call), because after the first overflow at least 128 bytes of the user->desc buffer already contain non-null bytes. This will effectively make this second overflow go much further, starting overwriting beyond the pointer we want to overwrite.
Just before that memcpy() happens, this is how user->desc is impacted:
So if we need that strlen(user->desc) to return less, this time we have to inject a nullbyte into the user->name buffer (via the read() call on line 60) and let it be propagated to user->desc by the following strncpy() call. Luckily both read() and strncpy() support this :D
After that - depending on which character we put the nullbyte at, the strlen() call will return no more than 32, making the sfunc pointer again within the reach of our overwrite. We just need to properly calculate how many bytes will there be to fill between the beginning of the user->desc buffer and the sfunc variable (the sum will always be 128).
And since merchant is the argument to the sfunc() call, we put our arbitrary command (argument for system()) in the beginning of the merchant->name buffer, as it's the first field of the structure anyway):
Intro During the last couple of weeks I started focusing more and more on windows internals and the way shellcode is crafted for the different windows platforms. There are many good windows shellcodes examples available out for grabs on the internet, but some of them are written in MASM or others are not so keen having a small memory footprint. Hence, I decided to focus on probably the best shellcode actively mantained repository: msfvenom.
Right away we can see two data structure definitions, which more-less suggest what we are going to be dealing with (structures holding some data along with some function pointers):
While the menu clearly shows what operations are available:
After creating instances of the structures we'll be able to call their dedicated print functions pointed by the (* print) pointers.
If you are familiar with Use after Free, you already know it will all boil down to allocating space for one of them, filling it with arbitrary data wherever we can control it, then asking the program to remove it, then allocating another instance of another structure in the same space previously taken by the first one - and then abusing an old pointer used for tracking the first structure to perform the structure-specific operation, making a function call to an arbitrary address we smuggled inside the data of the second structure.
How data is aligned in memory
So, to find out what fields of the number and data structures overlap with each other and therefore can be used to decide on the exploitation sequence, first we need to know exactly how data is aligned in memory.
We already know that the number structure is 16 bytes long, while the data structure is 32. So we would expect to have to use two number structures to fill the space previously taken by one data instance.
So I ran gdb to find out I was wrong. I allocated three numbers in a row, then took the current heap start address from vmmap output (important to do this AFTER the first allocation, otherwise you won't even see the [heap] section in vmmap output because it won't be allocated by the OS) and had a look. Then I restarted the program and did the same with the number structure. The results are illustrated by the screenshot below:
Comparison of the view of the heap after allocating three number structures versus three data structures
As we can see, both structures take 32 bytes (the 16-bit structure is automatically padded to 32 bytes). This is very convenient for us, as we won't have to struggle with aligning different numbers of instances against each other to achieve the favorable alignment allowing us do something neat.
Combining mutually-overlapping fields of both structures to find the proper codexec UaF scenario
So, since I already started with the visualization thing to clearly see the memory layout, I decided to take further advantage of it to compare what fields in one structure correspond to what fields in the other.
On the upper part of the screenshot (number) function pointers were marked red, actual numbers were marked green. On the lower side of the screenshot (data) function pointers were marked green, last four bytes of the string were marked red:
Looking at this for just a few seconds made it clear to me how to achieve execution control.
We can see that in the number structure, the function pointer (0xb770ccb4 on the screenshot above) occupies the same space that, when allocated with a string, always contains at least one nullbyte (0x00414141 on the screenshot above). This is because the string is automatically null-terminated by fgets() and we can't control it.
Hence, allocating a number, then deleting it, allocating a string in its place and then requesting the program to print the number won't get us far (we'll crash the program if we call 0x00ANYTHING), as we only control up to three bytes and we are not even overwriting a function pointer, so a partial overwrite won't help us (fgets will always put a null where we want something arbitrary/the most significant byte of the base).
At the same time we can see that the space holding the actual number value (0x41414141 on the screenshot above) which we can control fully as numbers from all ranges are acceptable), sits in the same place as the function pointer for the string structure ( 0xb774dc16 on the screenshot above). Hence, allocating a string, deleting it, creating an arbitrary number and then requesting the string to be printed would effectively lead to the program trying to print the already freed string with code pointed by our newly created number, still treating it as a pointer to the data-> print(big_str/small_str) function.
Let's try it.
We add a string (its contents are irrelevant, we are only interested in having data structure's print function pointer propagated onto the heap):
Now we remove it:
OK. Now we are going to introduce the pointer address we will trick the target program to call (in our final exploit this will be the address of system()). Let's say we want the program to crash by calling address 0x31337157 (because it's not a valid address in its address space).
Calculating the decimal format:
$ printf "%d" 0x31337157 825454935
OK:
Now, asking the program to print the string 1 should lead to a segfault at 0x31337157:
Yup. And the string itself will be useful to us to control the arguments (so we'll put system()'s address instead of 0x31337157 and "sh" as the string, leading to system("sh")).
If we look at the corresponding fields on the heap layout we'll see that first 16 bytes of the string buffer are occupied by the reserved fields in the number structure, which means that if we allocate a number after removing a string, taking the space it was allocated on, the first 16 bytes of the structure (6 bytes reserved and 2 bytes of padding) will be left alone with the old values from the string.
So calling system("sh") should be doable:
create a string "sh"
delete the string
create a number == libc system()'s address
'print' the string
The only problem we have got left to figure out is how to leak the memory layout to bypass ASLR.
Combining mutually-overlapping fields of both structures to find the proper UaF leak scenario
Looking at the layout again brought me the potential answer to this literally after the first glance (which proves how crucial it is to have the literally see the layout).
As we want to leak memory, we need to call a function taking an argument that happens to be/store a pointer.
The goal is to see both possible states of the memory combined and find such a combination of values that will let us achieve our goal. Let's look at the layout again, this time focusing on two particular neighboring double word values we would like to have in one state - and then think if we can groom the memory into that state:
When the space is occupied by a number structure, the +0x20 address contains a pointer (the print function, marked green), while +0x24 contains data (the number, in this case 0x41414141 - but that's irrelevant to our goal, thus marked grey).
Conversely, when the space is occupied by a data structure, the +0x20 address contains data (the last three bytes of the string and its terminating nullbyte - useless to us, hence marked gray), while +0x24 contains a pointer (the print function, marked red).
We want to trick the program to create that state, so we can call the big_num/small_num number-printing function, with the address of the string-printing function sitting in the space previously occupied by an irrelevant number before it was free()'d and then allocated again (but not entirely overwritten!) for the string structure.
So, we create a number, then we remove it (so the number[index] is not 0, even though the structure it was pointing at was 'removed', which means free()'d).
Then we create a relatively short (less than 15-character) string, to avoid fgets() overwriting the last four bytes of the buff[20], because that is where the old number's print pointer is held and we will want to call it, so it prints out the address of the string-printing function for us, thus leaking to us the mem layout info needed for calculating the system()'s address.
Let's try this slow motion, using a breakpoint in the main loop: b *(main+169).
First, we allocate a number (1):
Now, this is the heap:
Now, we remove the number:
And again, this is the heap (yes, everything is still there after free()):
Now, we make a string up to 16 characters:
Now, this is the heap:
Now, requesting the program to print the number[1] will make it call 0xb779dc65 (big_num) with 0xb779dbc7 as argument, so we have our leak:
So, we have a number vomited out. Let's convert it to a format more readable to us (hex):
Looks good. Let's confirm in gdb:
Confirming that the leaked address is the address of the small_str() function
Awesome. It looks like we have all the bits and pieces to develop an exploit! :D
Instead, I decided to find out whether libc's system() address could be calculated based only on the leaked base of the target program's code segment - and it turned out it can! At least on the VM provided for MBE.
Either way, first let's have a look around just like we were about to leak the GOT anyway:
Here are, respectively, our code, rodata and data segments (again, creating a continuous space with fixed offsets from each other):
OK, now we search these ranges for the 0xb7622280 value (the address of printf()) as we know it has to be stored in GOT after the first printf() call:
This time (as opposed to what we had in https://hackingiscool.pl/mbe-is-fun-lab6a-walkthrough/), our entry is at 0xfa4 offset in the rodata (read-only data) segment, which at the time of taking the screenshot above was at base 0xb77b4000. This is most likely the result of the -z relro gcc compilation flag:
That's OK, this is a countermeasure against GOT overwrites, we don't care about it this time at all.
If we were doing this the usual way, we would leak the code base first. Then we would calculate the rodata address to then calculate the printf()'s GOT, so then we would leak printf()'s address from it. And then based on its fixed offset from system() within libc itself, calculate system()'s address. Then get a shell.
But let's try more directly and run the program for a few times, observing the vmmap output, focusing on the relation between the target app code segment base (which we can already leak) and the libc base (which we want to know as well):
Another run:
Yup, in both cases the offsets are the same:
Hence, one leak is enough here (which would not be the case for the stack or the heap, but we don't care about those here).
So, once we subtract 0x1dd000 from the leaked target app code base, we have the libc code base.
Now we want to know system()'s offset within the libc itself (as opposed to calculating the difference from the relative printf() offset):
The required calculations can be done with below python code:
Python offset calculation
With all this in place, we can already exploit the program.
Manual exploitation
This exploitation can be easily conducted by just interacting with the program in console by properly choosing menu options and entering simple strings and numbers:
This is was one of the most painstaking ones (which is reflected in the length of this write up). While finding the vulnerability was trivial, building a working exploit was quite of a challenge here.
msg->message[] buffer size is 128 (MAX_BLOCKS*sizeof(int)).
Results of arithmetic division operations on integers give integer results. So, 128/4 == 32, but also 129/4 == 32, 130/4 == 32 and 131/4 == 32.
129,130 and 131 are possible length values we can sneak in without hitting the (new_msg->msg_len / BLOCK_SIZE) > MAX_BLOCKS condition and having our input length overwritten with the safe value of MAX_BLOCKS*BLOCK_SIZE.
And then, right away after smuggling the slightly bigger new_msg->msg_len, in the same create_message() call, we have this:
So, read() (to which there are no bad characters, by the way! :D) writes new_msg->msglen bytes from standard input to the new_msg->message buffer. So we can overflow the new_msg->message buffer by up to three bytes. And what will we overwrite this way? Yup, the msg_len field! This way we can achieve having created a message with nearly any size in msg_len, as we can control 3 out of its 4 bytes.
This can be taken advantage of in the edit_message() function:
Here is the second heap overflow, directly resulting from the first one, making it possible to overwrite the heap contents far beyond currently edited message body and its length field (so we will overwrite the print_msg pointer of the next message we create on the heap, getting a foothold into execution control).
Also, note the numbuf[32] buffer used to store user input before converting it to an integer used for message index (with 10 being maximum expected number of messages, which are indexed from 0, hence one digit is actually enough to store the index). We are going to use it later.
More insight on the target app
First of all, LAB7A.c comes with the following readme:
This is the way it is being run (output from ps aux from the gameadmin/root user):
So, it is running as the lab7end user (so we would have to become root to debug it) and has ugly timeout of 60 seconds, making debugging additional hassle.
So, we should work locally, on /levels/lab07/lab7A, or on its copy in /tmp.
This itself will not let us get rid of the timeout... because it is also implemented with the following macro call on line 10:
The macro boils down to calling alarm(60) and setting the alarm handler to a function doing exit().
I initially tried to work on a version I manually recompiled (with the only difference being the timeout parameter changed from 60 to 0 to effectively disable it), using the same flags... and I thought it was OK... but then later when searching for ROP gadgets I noticed slight differences in offsets, so I decided to work on the original copy instead and just add an automated call alarm(0) to my gdb script (-x commands.txt).
Second, we will have to write a custom shellcode here this time, as the binary is compiled statically (libc will no longer be dynamically linked, instead only the required functions are statically linked, which means they are built in the executable):
Simply returning to libc's system() won't be an option as we won't have the entire libc dynamically linked. Instead, only the libc functions actually used by the program would be linked in, by putting their code into the same code segment as program's own code. This will definitely make exploitation more difficult.
Another specific property is the lack of -fPIE -pie flags, the result of which was the code segment not being ASLR-ed, so all the functions and ROP gadgets are at fixed addresses (which will, in turn, make the exploitation easier). Still, other segments get ASLR-ed (except for the heap, which turned out kind of tricky - although its range in the target app was the same every time I checked, the first address returned by malloc() varied between instances, making the need for leaking).
How data is aligned in memory - getting our first crash at an EIP we control
Oh, this was unexpected. Where is it then? Let's find it by searching for any part (first four bytes) of the XOR pad/encrypted output we just displayed above. Search for the literal did not work due to endianness, search for the bytes in reversed order did the trick:
OK, let's see it (we need to aim a bit wider, as 0x80f19d4 is just the beginning of the XOR pad, while we want to see the entire structure and the preceding malloc metadata):
OK, now we create another message and have a look again:
Now, this is the layout with the messages sitting on the heap:
This should give us clear picture of how to start make the program call an arbitrary address. After we create message #0 with an arbitrary length value bigger than 140 (128 for the message body + 4 for the overwritten once again length value + 8 bytes for the malloc meta fields = 140), we will start overwriting message #1's print_msg() pointer, then the message #1's XOR pad, then the message #1's body itself.
Afterwards we ask the program to print message #1, making it call our overwritten #1's print_msg pointer.
First crash
So we create a new message, with arbitrary length of 131 (max we can sneak through the faulty boundary check) and we use those additional three bytes to smuggle three 'C's:
Step 1
Now, those three 'C's overwrote the three least significant bytes of the original msg.len field, turning it from 131 to 1128481536:
OK, cool. Let's proceed to a careful overwrite of a pointer. Luckily, we don't have to be very careful when it comes to the arbitrary value of the message length field we put here. CCC (0x0043434) is good enough, because we don't have to fill the full length of 1128481536, read() will stop when no more data is available from the standard input, at first we'll just write 144 bytes, with the last 4 being the new pointer for the next message's print_msg() function.
So:
We create a message with declared length 131 and following content (this will be index #0): AAAAAAAAAAAAAAAAAAAAAAAAAAAAAAAAAAAAAAAAAAAAAAAAAAAAAAAAAAAAAAAAAAAAAAAAAAAAAAAAAAAAAAAAAAAAAAAAAAAAAAAAAAAAAAAAAAAAAAAAAAAAAAAACCC (already done).
We create a second message with any length and content (irrelevant now).
We edit the first message, filling it with this payload (ZZZZ will be the hijacked EIP):
$ python -c 'print "A"*140+"Z"*4' AAAAAAAAAAAAAAAAAAAAAAAAAAAAAAAAAAAAAAAAAAAAAAAAAAAAAAAAAAAAAAAAAAAAAAAAAAAAAAAAAAAAAAAAAAAAAAAAAAAAAAAAAAAAAAAAAAAAAAAAAAAAAAAAAAAAAAAAAAAAZZZZ
We ask the program to print the second message (index #1) and watch it crash on ZZZZ.
Step 2Step 3 - this time we put 144 bytes as the message bodyStep 4
We control EIP, now what
Controlling only the EIP is not sufficient to make the program do exactly what we want. As long as we cannot simply inject a shellcode to an executable memory range and jump to it (and we can't - at least not yet :) - as we are dealing with DEP/NX), we need to go with ROP approach. Even if we were not doing an actual ROP chain, but a simple overwrite of the controlled pointer to system()'s address (which we can't here, as mentioned before), we still need to control the argument that function call is expecting to have on the stack when called.
Let's be entirely clear, this is what we hijack:
messages[i]->print_msg(messages[i]) call inside the print_index() call.
So, at the time of execution of our arbitrary EIP, the argument on the stack will be a pointer to messages[i] structure on the heap (with its first field being the print_msg pointer, by the way). Even if we could make EIP point at system(), we would still want the stack to contain a pointer pointing to a buffer we control - as opposed to the XOR pad, which is filled with random data.
This is what the stack looks like at the time function print_msg() (or ZZZZ) is entered:
The saved RET points to the next instruction in print_index(), messages[i] points to the beginning of the message structure on the heap.
Then I noticed that mprotect() is linked into the program:
So I instantly recalled XPN's ROP Primer writeup (https://blog.xpnsec.com/rop-primer-level-0/) and thought 'fuck yeah, I am gonna set EIP to mprotect() and make the heap executable, the buffer address is the first argument... but what about the next two?'
So the next two variables on the stack being 0x00000000 and 0x0000000a were ALMOST what I thought would suffice. 0x00000000 is where the buffer length should be (0 is not great for length), while 0x0000000a would serve as the flags (0x7 is RWX, so oxa includes 0xb, we would be fine as long as this flags value is not invalid). Obviously, this did not work (at least because of the 0 as length, but probably there's more than there is to it - we'll be back to this later).
Anyway, I started wondering whether I can control that 0x00000000 and 0x0000000a on the stack, only to figure out where they come from: they are a survival from the strtoul(numbuf, NULL, 10) call in print_index() right before our message is printed (it's the NULL and 10, last two arguments to strtoul()):
So I looked at the registers state and the stack at the time of the call/crash, looking for anything to hook on, any candidate for the next step in execution control that would allow us make the memory and registers alignment more favorable - and put my attention to EDX, as it was pointing to the buffer we control (remember, we can write past the ZZZZ any number of bytes we want!):
So I started wondering, what if I could find a ROP gadget that would somehow mv EDX to ESP, tricking the program to start using the heap as the stack? Then we could place the rest of the ROP chain on the heap, as we are having a hard time trying to control the stack right now.
By the way, ropeme is a nice tool for this (the lab7A.ggt was previously created by the same script, by calling generate on the target binary):
Corb3nik's solution - tricky format-string-based leaking of the heap pointer after sneaky stack-grooming
Reading Corb3nik's exploit made me realize that leaking a heap-stored message pointer would in fact be needed for a reliable exploit to work - if we want to use the heap for our payload (as we could alternatively use the stack - but then we would need to leak the stack address, so it does not really make much difference at this point). So leaking has to be done before proceeding to attaining arbitrary code execution. And it turned out to be tricky (no comfy gadget this time, like with https://hackingiscool.pl/mbe-is-fun-lab6a-walkthrough/).
So, if we want to leak something, we can overwrite the EIP with printf()'s address, which as we know is fixed in this case. But what about the argument? When doing heap overflow, we overwrite the next message print_msg pointer and if we keep writing, we overwrite it's XOR pad. Then if we ask the program to print the message, it will call printf() with just one argument, being the pointer to the message[i] structure:
messages[i] (0x080f09d0 at the moment) looks like this:
Now here's the trick. If printf() treats the entire buffer pointed by messages[i] as a string, the XOR pad we overwrite past the print_msg pointer (which itself we overwrite with printf()'s address) can contain a FORMAT STRING expression.
This means that if we overwrite the XOR pad (pointed by messages[i]) with a string like %1$p, it will print the value of the nextdword on the stack, right to the heap pointer itself - exactly where the next argument to printf() would be, if it was called with that format string properly (like printf("%1$p",some_pointer_to_be_printed_out);):
This way, we can pick an arbitrary value from the stack we want printed plain and clean in proper pointer format (thus the %p, whereas number$ index selects the number of the value from the stack). So, even the nullbytes on the stack are not an issue.
As we can see on the screenshot above, we could already leak the stack (the last value to the right at the bottom, 0xbffff728 in that case) if we wanted to use it for storing the final payload. Something I realized only while writing this up and have not tried pursuing.
In Corb3nik's solution - which I followed - heap was used to store the payload (a ROP chain execve(/bin/sh) shellcode), by using a pop esp; ret + payload_addr_on_the_heap first-stage chain to trick the program to start using the heap as the stack - something I originally wanted to do when I got stuck.
So, the problem with this approach is that we do not actually have a pointer pointing to the heap anywhere on the stack while print_msg()/printf() is called - except for messages[i] - but messages[i] is literally the first argument from printf() call's perspective and we cannot reach it with %0$p format string (I tried)... we can reach everything past it, but not it itself. And it's not held anywhere on the heap itself either, so just leaking the heap without a format string at all wouldn't help.
This is where Corb3nik used a recurrent call of print_index() from within print_index(). In order to achieve this, four messages had to be created, because two overwritten pointers were needed:
By overflowing message #0, message #1's pointer was overwritten to print_index() (so this is why we already had to create two messages).
By overflowing message #2, message #3's pointer was overwritten to printf(), with its XOR pad being overwritten with the format string (thus, two more mesages).
Then, by asking the program to print message #1, we have it call print_index() from the menu and asks for the number of the message to print. Once the number is provided, print_index() calls print_msg() - or whatever pointer we put there. Since for message #1 we overwrote this pointer with print_index(), by asking the program to print message #1 we manage to have a recurrent print_index()->print_index() call. This way another set print_index()'s local variables and arguments is put on the stack, along with messages[i]. When the second print_index() call asks for the message number to print, we chose #3, because its print_msg() pointer was overwritten with printf()'s address and its XOR pad with our format string.
This way we achieve the print_index()->print_index()->printf("%20$p"), creating and exploiting a format string condition.
Below is the stack of print_index():
Below is the stack of print_index()->print_index():
So the stack's properly groomed for leaking the address of messages[i]. From this point we can calculate the offset to the XOR pad we decide to put our payload in. We'll get back to this, now let's find out how to take control of the stack and start our ROP.
Corb3nik's solution - ROP-based stack pivoting
By analyzing Corb3nik's solution, after comprehending the convoluted heap address leaking, I realized that he started his ROP chain with a pointer pointing at a mov ecx, esp; ret; gadget (changing the stack pointer to the value of ECX). We saw a bunch of those earlier in ropeme output, when we were searching for stack-pivoting gadgets. I felt puzzled, as back then when looking at the state of the registers the only register that appeared to have a useful value was EDX.
I understood the use of ECX after I analyzed the way he provided arguments to the final print_index() call in his exploit, made me understand the trick:
So let's not focus on the ROP chain itself now (it makes ESP point to the buffer on the heap and then ret to it, as mentioned before, turning the heap into program's stack, because why not :D - I decided to go a different route, later on that).
Let's focus on the way the chain is delivered - along with the message index!
Again, print_index() source code, focusing on a part we did not pay much attention to before:
So again, this is the function that calls our overwritten pointer. It will trigger the exploitation by calling print_index()->mov ecx, esp; ret;.
Its local variables are held on the stack. Then it makes the call to print_msg() - or whatever we overwrite it with, putting more variables (call arguments, stack frame, saved RET and any local variables if needed) to the stack. This means that the numbuf[32] is there on the stack - and that's where ECX happens to point when messages[i]->print_msg(messages[i]); occurs.
While fgets() allows us to stuff 31 bytes into numbuf[32], only the first one needs to be a digit corresponding to the chosen message index, the rest can be anything non-null we want to place on the stack, as the later strtoul() conversion will simply ignore it - and ECX points there:
So, after we have any message structure on the heap with its print_msg pointer overwritten with one of the mov ecx, esp; ret; gadgets (e.g. 0x80bd536), we can simply ask the program to print a message and provide it's index along with up to 30 bytes of our ROP chain.
So now we control EIP, we control the stack and we can overwrite the heap pretty much anyway we want. Now we can talk!
My last-stage ugly alternative - shellcode to heap, mprotect() heap RWX and ret there
Corb3nik's ROP chain delivered to the print_index()->numbuff[32] buffer via print_index()->fgets()'s input made the program start using the heap as the stack (pop esp, ret;).With the rest of his ROP chain stored on the heap via the initial heap overflow:
As you might remember from the beginning of this way too long write up, I wanted to use mprotect() really bad, to make the heap executable and just fucking jump to it (thus ugly), without using any more ROP.
I did as well start off with the messages[i]->print_msg() pointer overwritten with the address of a mov ecx, esp; ret; gadget.
But my ROP chain delivered along with the message number to the print_index() stack looked like this:
So obviously it started with the address of mprotect().
Then there was an address of a pop3ret instruction - the next instruction the mprotect() would return to - this is where it would expect to have its parent's saved RET stored. Before we return to the next address, we have to jump over/clean up the mprotect() arguments still lying on the stack, hence we have to use popNret as the next addr to return from our function whenever that function takes N arguments. This is the basic principle of building ROP chains.
OK, then the arguments.
First, the start address of the memory area we want to change memory protection flags of. I initially used the address of my shellcode (warning, this did NOT work and required a fix, but read on!). The shellcode was already delivered to message #1's buffer by overwriting its XOR pad with the format string for printf() AND the shellcode itself:
At the time of writing the exploit it was still a NOP-holder, I left shellcode writing till the end. The point is that the address of the shellcode on the heap was already known thanks to its fixed offset from the leaked pointer.
Then the length (I wanted to use 0x64 just to be on the safe side and have enough space executable). Then the flags (0x7 = READ + WRITE + EXEC).
And then, lastly, again the address of the shellcode on the heap. This is where the last ret from this short ROP chain will return. Then it will be just normal (a sequence of opcodes) shellcode executed on the heap.
For some reason mprotect() kept returning an error (0xffffffff in EAX), so the range must have been incorrect. I peeked into XPN's ROP Primer https://blog.xpnsec.com/rop-primer-level-0/ write up again and did as he did there with the stack - used the entire fixed heap start address + length as arguments (as I mentioned, they stayed the same between instances, hence could be fixed). Not the prettiest solution, but it was late and I just wanted to write the shellcode, run it from the heap and call it a day.
Shellcode
OK, the shellcode now. As far as I remember it should look like:
I built this using shellnoob (a tool I recommend for asm->opcode and opcode->asm conversions):
Below are the compilation flags from the comment at the top of the source file:
However, these flags do not seem to add up with the actual compilation flags used to produce the /levels/lab08/lab8B binary. My conclusion is that -fPIE -pie flags were NOT used when compiling, as the addresses in the code segment turned out to be fixed (but that's OK, we can leak mem from the program, having them ASLR-ed would not really make things much more difficult here). Plus, there' s a second (bonus) solution to this, which does not utilize those fixed addresses, but later on that. Also, this commit https://github.com/RPISEC/MBE/commit/ad0d378e379470ebf744655234361bd303530ab4 suggests some comment flags vs real compilation flags discrepancies in chapter 8's labs.
The code
Below is the data structure we are going to work on:
The core logic of the program is to allow us enterData() into v1 and v2 structures (just the numbers and the char, the printFunc pointer is initialized with a fixed value).
We can't manually enter data into the v3 vector. Instead, v3 is filled by adding the values of the corresponding v1 and v2 fields together (sumVectors()). For this to happen, neither of the v1 and v2 fields can be 0:
enterData() simply fills a vector structure with user-supplied numbers plus the vector.achar, using scanf() calls with format strings relevant to their declared types (signed/unsigned). The vector.achar is an exception to this, as it is read from stdin with a getchar() call:
This is our user interface:
And this is how our user interface is connected to methods:
Now, the most important method:
How v.printFunc pointers are initialized + what does printVector() do
By default all printFunc pointers point at printf():
When enterData() is called, v.printFunc is overwritten with printVector() address:
This means that asking the program to print a vector before we even enter it would make it call printf() on an yet empty vector. The only initialized field would be the printFunc, containing the current libc printf() address. So yeah, this is the first vulnerability, but it's not the only leak in this app.
The second leak is a feature of the program itself, implemented in the printVector() function:
So we can leak printVector() address, libc printf() address as well as the address of the v vector in the data segment.
The following simple exploit skeleton extracts both of the leaks:
We can allocate and copy up to MAX_FAVS (10) versions of v3 (can be the same v3 without making any changes to it) to the faves[] array.
The first fave (faves[0]) is a proper byte-to-byte copy of v3, because i is 0 at the time. The issue starts to manifest itself as i grows. So, a careful pick of the sum constituents (relevant corresponding v1 and v2 fields) along with the right choice of an i value from within the 0-9 range should allow us to arbitrarily overwrite the printFunc pointer in at least one of the faves. Then load it back to either v1 or v2 and task the program to print it.
But before we get ahead of ourselves, let's clarify few basic things first.
Sizes and paddings - how data is aligned in memory
In this case it seems like a good idea to start with checking the size of the struct vector structure, as well as its individual members. We also need to expect some padding (we're in 32-bit world here, so eventual space reserved for an object will be rounded to a multiply of 4).
Over the course of my work on this challenge, I compiled a few small C programs to test some stuff the easy way, here's one of them:
The output:
So we know that in our system (MBE VM) both int and long int have the same size. We also know the entire size of the struct vector = 44.
Since both longs take 8+8 (16), four integers take 4+4+4+4 (16), that's already 32. We also know that the printFunc pointer will take 4 bytes, making it 36. So, we have 8 more bytes occupied by two short integers and one char. This makes sense as short integers are two-byte variables, so 4 bytes are needed to contain two of them (making it all 40 so far). A single char takes only one byte (making it 41), so three more bytes of padding are required attain the nearest multiply of 4 (44).
But let's see how this actually looks like in memory. For this purpose, I created a skeleton of the exploit, simply filling the particular structure fields with a set of values making them easy to distinguish:
When using pwnlib (pwntools), I highly recommend the additional stdin=PTY argument for the process() call (can save you a lot of frustration, whereas the output you expect from the target app does not arrive and you have the impression that the program hung). This particular challenge made me learn the hard way that by default pwnlib is using a pipe (not a PTY) as the standard input for our exploit. This means that the target application does not recognize its standard output as an active device (PTY), which would prevent libc from buffering data coming from its output routines like printf(). Some more details here: https://twitter.com/julianpentest/status/1143386259164938240.
Anyway, back to our memory alignment inspection. Running it (you might want to cp /levels/lab08/lab8B /tmp first):
Second console (for this, /proc/sys/kernel/yama/ptrace_scope needs to be set to 0 - I keep it this way on MBE VM as it's efficient):
And here's the v1 contents after enterData()(easy to attach and see when the program is waiting for input here, no breakpoints needed):
A slightly closer look:
v1 test contents with clear distinction of data distribution, including the two null paddings marked white
Adding vectors
OK, now let's get two vectors summed, while trying to pick the v1 and v2 fields in such a way that we get expected values in v3 fields.
So, let's say we want our v3 sum to consist of consecutive capital letters, 'A','B','C' and so on.
This will make it easy to distinguish which bytes of the v3 vector are being copied to which bytes of the particular faves[i] structure, as the i offset grows.
As our v3 has to come from a sum of non-zero values, we will simply fill the first vector with growing natural numbers, starting at 0x1, while filling all the fields in the second vector with 0x40-s.
We can achieve 0x40 in particular memory cells by putting the following values in, depending on the type:
Due to our v1 values being very small (0x1), the more-significant bytes of those values were nulls, producing 0x40 (no change) in v3 when summed with the more-significant bytes of their v2 counterparts. Fair enough, now we have a basic understanding how to manipulate v3 and therefore faves[i].
Options for execution control
Now, the best way to see our options here is to simply use the v3 contents we already have and add it to favorites 10 times or less (as we can't do more) and examine the resulting faves[i].printFunc pointer. Once we identify and pick the most favorable offset (the value of i that allows us to fully control the pointer with any of the v3 fields), we'll pick the proper v1 and v2 values once again so their sum is what we want and exploit it. Having the proper i we know how many times our v3 has to be added to favorites and as well what is the favorite number we want to ask the program to print for us to execute code from our arbitrarily provided address.
I initially though that i increments by 1 in the vulnerable memcpy() call will result in the pointer address being incremented by one byte as well.
Debugging, however, revealed that the expression is expanded with the variable type being a pointer to int (which is 4 bytes), hence consecutive increments of i will make the memcpy() source argument point at further and further whole dwords (double words, 4-byte chunks) of the current v3 contents.
Here's how faves[] change with every single fave() call:
i=0, faves[0] == v3, this is expected
So, for i=0, faves[0] is a complete copy of v3.
Now, after a second fave() call, i=1:
Yes, the second fave already has its printFunc pointer fully overwritten with data from our input (0x40420041)! So with every new favorite added the byte offset of the out-of-bound-read-write will effectively move by 4.
As we can see, i=1 is not sufficient for our desired pointer overwrite, because we cannot control the nullbyte (as opposed to every other byte) in the 0x40420041 value (that nullbyte comes from the char v3.a padding - beyond our control). The whole value contains v3.a with padding (two least significant bytes) and short int v3.b (two most significant bytes).
The next offset (i=2, faves[2]) is even worse, as we would have the unsigned short int v3.c being our new pointer (0x00004043 at the time of taking the above screenshot), which in turn has two padding nullbytes we cannot control:
Marked are faves[i].printFunc values
Offset i=3 does the trick (gives us full control over the pointer).
One more thing. We can't ask the program to directly call any of the faves[i].printFunc. Instead, we must load the particular favorite into one of the two work vectors (v1 or v2), then print it.
And:
It looks like we're almost there.
The basic solution (without bonus points)
There's one more important code section I did not mention:
Long story short, the basic solution is to now pick our input in such a way that instead of 0x40404044, faves[3].printFunc contains the address of thisIsASecret().
Normally we would calculate the thisIsASecret() function's address based on the already leaked printVector() address:
But due to the missing -fPIE -pie flags this is not required. The address is simply 0x800010a7.
The problem with signs
Knowing that 0x800010a7 is 2147487911 in decimal, I simply tried to split it between v1.d and v2.d values as 2147487910 and 1.
This did not work, because d is a signed integer, with possible value range of -2147483648 <--> 2147483647. 2147487911 is slightly above the range. When provided to scanf("%d", &(v->d));, it ends up truncated to the maximum value of 0x7fffffff to avoid integer overflow.
0x7fffffff is 2147483647, while 0x80000000 is -2147483648. This means that our desired pointer is a negative number and we cannot achieve int overflows with scanf().
The arithmetic overflow, however, is entirely feasible when the values get added in the sumVectors() function. So v1.d = 2147487911 ending up as 0x7fffffff, summed with 0x1 made the value 0x80000000. Quite close, but not what we want.
There are several solutions to this:
stick to the values we already picked and just overflow the sum even more by setting v2.d to the 0x10a7 offset + 1, so v1.d=0x7fffffff + v2.d = 0x10a7 + 1 becomes 0x800010a7 or just pick some two static numbers that lead to the result we want (the simple and ugly solution, not to mention lazy as well)
dynamically leak the target value as a signed integer, using pwnlibs unpacking functions (e.g. number = u32(leak[0x0:0x4],sign="signed")) to get the value of the pointer interpreted as a signed integer, use if on v1.d input while putting the required calculation offset (e.g. difference between printVector() and thisIsASecret() or difference between system() and printf()) as v2.d, flipping the signs if needed - depending on whether the initial value is negative
dynamically leak and calculate the target value treating it as unsigned, then split it into half (e.g. for target 2147487911 that would be 1073743955 and 1073743956 for v1.d and v2.d inputs, respectively), so both inputs are within the signed int range for scanf() and still good for the overflow (smart, reliable and quite easy solution)
simply use the next offset i=4 instead of i=3, because v.e is an unsigned integer, so we get rid of the problem entirely (lazy and neat solution)
Thus, overflowing it even more with a statically picked values could go like this:
Knowing that:
0x80000000 is -2147483648 (the bottom of the unsigned int range)
Recently YouTube changed its policy on “hacking” tutorials to an essential blanket ban. In the past, such content was occasionally removed under YouTube’s broad “Harmful
Intro As opposed to the multi-purpose windows' userland shellcode, kernel ones merely try to elevate privileges and obtain an NT\SYSTEM status. There are several ways to accomplish this, and we are going to explore some of the different scenarios.
Most of the following ideas have been inspired by Morten Schenk and Cesar Cerrudo excellent works, which I have then gathered and readapted to the latest Win10 version.
Before jumping too quickly into shellcoding, we want would like to setup a comfortable and easy-to-fire shellcode loader on our system.
So, the basic version was in fact very simple after figuring out how to control EIP. We just overwrote it with a pointer to this function:
Now, since we want to avoid using it to get the bonus points, regardless to what approach we will take (e.g. a full ROP-shell execve("/bin/sh") shellcode or a call to system("/bin/sh")), we have to attain some sort of argument control, as an arbitrary EIP just isn't enough.
How loadFave() really works
As mentioned previously, we can't print arbitrary vectors from the faves[] array by calling their own printFunc functions (like faves[i]->printFunc(faves[i])).
Even though the target application does contain a function called printFaves(), I did not find it to be much of a use (neither for code execution, leaking nor for stack-grooming):
The problem with execution control is that this function directly calls the printVector() function, instead of using the faves[i]->printFunc pointer - the pointer we can overwrite and break our way into execution control.
Thus, after creating a v3 vector with arbitrary values and pushing it several times to the faves[] array to achieve arbitrary printFunc pointer values, in order to call any of those pointers first we have to load it to either of the two vectors v1, v2, explicitly asking the program to call loadFave():
Now, notice the memcpy() call's details:
It's memcpy(v, faves[i], sizeof(v));, NOT memcpy(v, faves[i], sizeof(struct vector));
It does not copy the entire fave[i] structure into v1/v2. Instead, it only overwrites sizeof(v) - which is a pointer. So the entire loadFave() operation only overwrites the first 4 bytes of the vector structure - which happen to be the printFunc pointer.
Let's illustrate this step by step.
We'll initialize v1 with values of 1 and v2 with values of 2, then sum them up, then add the sum to the faves several times, then load one of the faves back to v2 and see how it changed.
So, after initializing the vectors, summing them up and loading the sum four times to faves, this is what faves[] and v2 look like:
faves[3].printFuncv2.printFunc
Again, this is right BEFORE we load fave[3] to v2.
Note that our fave[3].printFunc is 0x00000003 - and its other fields are as well just full of 3-s. v2 yet has its original values; v2.printFunc = printVector and fields full of 2-s.
Now, after calling loadFave() of faves[3] to v2:
Only printFunc was overwritten
So, only the printFunc pointer from the chosen fave is loaded. Everything else stays intact. When attaining execution control, we make the program call v2.printFunc(v2)/v1.printFunc(v1). Since in the basic version we simply overwrote the printFunc value with thisIsASecret() address - which does need nor take any arguments, we simply did not care about them - and honestly I did not even notice this exact loadFave() behavior until I started poking around a solution that does not involve calling thisIsASecret().
Sticking to v2 as our vector of choice, this means that we would effectively call system(v1). Now, let's think about it for a while. system() takes one argument, expecting it to be a pointer to a string of system commands:
And we DO NOT control the pointer being passed to it (we can only chose between v1 and v2) as its only argument:
So, once our arbitrarily chosen (e.g. system()) function gets called, v2 pointer is the argument. And again, it looks like this:
So, what happens when system(0x80003100) is called? Well, it is going to try to execute \x90\x31\xe6\xb7\x02\0x00 as a string (remember, endianess). So even though we fully control short int v2.b, as well as further int, long int and long long int fields of the vector, the nullbyte padding the char v2.a field stands in our way. The string terminates - and although we fully control it, its first four bytes are strictly dictated by the value of EIP we force the program into.
We could possibly get this working if v2.a was at least two characters, instead of just one. In such case we would make them something like ;a, whereas ; is just one of the shell command separators (by the way if you're interested in command and argument separators, see this https://github.com/ewilded/SHELLING), while a is just another command. We could create a program/script named a in /tmp and add /tmp to our $PATH before calling the target program. But we can't do this on just one byte.
We could try to add /tmp to $PATH and then put our arbitrary commands (like /bin/sh or cat /home/lab8A/.pass) to a script named exactly \x90\x31\xe6\xb7\x02\, or whatever the current value of system() would be at the time of executing the target program - after having it leaked (ASLR).
I tried this approach. Did not work due to some of the bytes in this value not fitting into acceptable range of characters allowed in file names.
It became clear I have to try something else. Spoiler alert; stuff described in below Looking for ROP gadgets and stack-pivoting vectors section eventually did not work, although it allowed me to notice a beautiful (only potential as not actually attainable) ROP scenario.
What eventually did work is described in in the section after.
Looking for ROP gadgets and stack-pivoting vectors
This is our sample stack at the moment of our execution takeover:
Saved RET marked white, v2 marked red
This time we do not seem to have any control over any of the stack values - unless we want to try to stuck our payload somewhere in the input buffer argv. The problem is that we won't have a gadget that would point our ESP there.
So I thought "OK we want to make ESP point somewhere at v1/v2/faves integer fields we control and put our ROP shellcode there".
These are the registers at the moment of our execution takeover (EIP was set to system() at the time):
Looks promising, EDX points at our v2 structure (its first four bytes, printFunc, contained the address of system() when the screenshot was taken).
We want a gadget like mov edx esp; pop whatever; pop whatever; ret.
mov edx esp would set our stack to the top of v2. The two following pop instructions would take out the printFunc and v2.a+v2.b dwords, so v2.c(signed short int) would become the top of the stack. Nah that's not good either, we can't control half of that value. Fuck.
I fired up ropemeropshell.py. I ran generate /home/levels/lab8B, which generated lab8.ggt file with gadgets. I loaded it with load lab8.ggt. Ran the following search:
Fuck, VERY few (only 5 pop; ret;) gadgets. Extremely unlikely to find the one we need.
I checked them all, one by one, looking at different slightly lower starting offsets, to see the instructions above them - making sure they are still what they should be, as depending on the offset we can get different assembly, as instructions do not have fixed lengths and they simply occur one after another. Example below:
0x1676L: pop ebp ;;
Luckily, this can be done in an easier way (ropeme ropshell.py):
OK, what about libc? I bet there's plenty of gadgets there! So I repeated the steps with ropshell.py to generate gadgets from /lib/i386-linux-gnu/libc-2.19.so.
OK, more like it.
By the way, peda also offers some built-in ROP helpers itself:
So, back to our mov edx esp:
Nah, not a chance.
Neither for a suitable pop esp gadget:
Just to make sure the syntax is correct:
Now, this would pivot ESP to v2:
And it would return to itself (a recursive ROP), as printFunc happens to be the address of our gadget (initial EIP control) and would be laying on the top of the stack once ESP pointed at v2, making v2 our new stack. The second execution of the gadget would result in popping the printFunc from the stack, then putting v2.a+v2.b (which have nullbytes we can't control) into ESP. Shit, this is getting nowhere. At this point I felt stuck and decided to peek into Corb3nik's solutions (https://github.com/Corb3nik/MBE-Solutions/) - only to find out, to my surprise, that he did not make/publish the bonus version solution.
"Never use this function"
As this thing got under my skin and kept me awake at night, I came up with this while already drifting away to sleep: since v2.a and v2.b are standing in our way, let's use our EIP control and the v2 argument passed to it on the stack to deliver a new payload to v2. I thought of fgets(), only to find out it did not work - only to realize it is expecting three arguments, as I confused it with gets() - which is exactly what we need here:
So the plan is to first calculate a new sum in such a way that its printFunc is system(), add it to faves[] under the right offset (4 is perfect) and we'll be able to load it into to v2.printFunc later.
Then we enter new data into v2 in such a way that when we sum v1 and v2, we will achieve relevant consecutive fave[i].printFunc (6 is perfect, by the way) pointer to be libc gets().
Then we load it into v2. Then we ask the program to print it, so gets() is called, allowing us to overwrite the entire v2 (and everything that follows it, although we won't need it). This is why it was important to do all the calculations and load the faves before this step - we want v2 (except for its first bytes - the printFunc pointer) to stay intact from now on - which is perfectly feasible with the way loadFave() actually works, as we found out earlier.
So when gets(v2) is called, we overwrite it with something like XXXX;/bin/sh. The values of the first four bytes are irrelevant (as long as they are not messing with gets() input, so we don't want nullbytes or newlines).
We don't care about the first four bytes (e.g. XXXX), as they will overwrite the current printFunc pointer (gets() address at the time).
We don't care about them as we will overwrite them once again in the next step, by calling loadFave() on faves[6] - so v2.printFunc becomes system(), with the following bytes being ;/bin/sh\x00.
So - at this point we'll just ask the program to printv2 once again, making it call system("0xb7e63190;/bin/sh") whereas 0xb7e63190 is a sample address of system() itself. The first command will obviously fail, as it refers to a nonexistent file, the second command should succeed.
So once again, the full algorithm:
Initiate v1 the same way as so far, with values of 1.
Manipulate v2 in such a way that after calling v1+v2, v3.printFunc becomes system() (we attain system() at faves[4].printFunc (yup, i = 4), the same way we did so far with index 3 (4 is to avoid the negative signed integer hassle)).
Add v3 to faves five times (because we want i=4).
Re-enter v2 in such a way, that when summed up with v1, will make v3.g = gets().
Add v2 to faves two more times (make i=6 and faves[6].printFunc = v3.g = gets().
Load faves[6] to v2 (this will overwrite its printFunc pointer with gets()).
Ask the program to print v2, overwriting it with XXXX;/bin/sh thanks to v2.printFunc = gets().
Load faves[4] to v2 (this will overwrite its printFunc pointer with system()).
Ask the program to print v2 and get the shell without using the thisIsSecret() function - the bonus version.
One more tricky thing I spent a while debugging and wondering what was wrong: - it was crucial to use p.send("2") instead of p.sendline("2") after issuing p.sendline("3") - which tells the program to print a vector.
Once receiving our "3\n" it asks for the vector number by calling vectorSel():
The problem with this is that it is using getchar() to read the vector number. So, if we send the number followed by a newline character, the number will be read, while the newline character will be pulled from our input as input to gets(). And since gets() treats newlines as terminators, it would effectively lead to gets() writing an empty null-terminated string to our v2 buffer. So it would basically overwrite the least significant byte of v2.printFunc pointer with a nullbyte, without placing our shell command payload where we wanted it.
Windows 10 version 1903 is upon us, which gives me a good reason to go looking at what new features have been added I can find bugs in. As it's clear people seem to appreciate fluff rather than in-depth technical analysis I thought I'd provide a overview of my process I undertook to look at one new feature, the P9 file system added for the Windows Subsystem for Linux (WSL). The aim is to show my approach to analyzing a feature with the minimum amount of reverse engineering, ideally with no disassembly.
Background
When WSL was first introduced it had a pretty poor story for interoperability between the Linux instance and the host Windows environment. In the early versions the only, officially supported, way to interop was through DrvFS which allows you to mount local Windows drives into the Linux environment. This story has changed over time such as adding support to start Windows executables from Linux and better NTFS case-sensitivity support (which I blogged about already).
But one fairly large pain point remained, accessing Linux files from Windows applications. You could do it, the files are stored inside the distro's package directory (%LOCALAPPDATA%\Packages\DISTRO\LocalState\rootfs), so you could open them directly. However WSL relies on various tricks to deal with the mismatch between Windows and Unix-style filesystem semantics, such as storing the UID/GID and file permission bits in extended attributes. Modifying these files using an unenlightened Windows application could result in corruption of the file state which in the worse case could break the distro.
With the release of 1903 the WSL team (if such a thing exists) looks to be trying to solve this problem once and for all. This blog introduced the new feature, accessing Linux files via a UNC path. I felt this warranted at least a small amount of investigation to see how it works and whether there's any quick wins or low-hanging fruit.
Understanding the Feature
The first thing I needed was to setup a x64 version of 1903 in a Hyper-V VM. I then made the following changes, which I would always do regardless of what I end up using the VM for:
Disabled SecureBoot for the VM.
Enabled kernel debugging through BCDEDIT. Note that I tend to be paranoid enough to disable NICs in the VM (and my success of setting up alternative debug transports is mixed) so I resort to serial debugging over a named pipe. Note that for Gen 2 Hyper-V VMs you can't add a serial port from the UI, instead you need use the Set-VMComPort PowerShell cmdlet.
Install a distro of choice from the Windows Store. Debian is the most lightweight, but any will do for our purposes. Note that you don't need to login to the Store to get the distro, though the app will do its best to convince you otherwise. Don't listen to its lies.
With a VM in hand we can now start the investigation. The first thing I do is take any official information at face value and use that to narrow the scope. For example reading the official blog post I could determine the following:
The files are accessed via the UNC path \\WSL$\DISTRO but only when the distro is running.
The P9 server is hosted in the init process when the distro starts.
The P9 server uses UNIX sockets for communication.
Based on those observations the first thing I want to do is try and find how the UNC path is implemented. The rationale for starting at the UNC path is simple, that's the only externally observable feature described in the blog post. Everything else, such as the use of P9 or UNIX sockets could be incorrect. I'm not expecting the blog post to outright lie about the implementation, but there's sometimes more important details to get right than others. It's worth noting here that you should increase your skepticism of a feature's technical description the older the blog post is as things can and will change.
If we can find how the UNC path is implemented that should also lead us to whether P9 is used as well as what transport the feature is using. An important question is whether these files are really accessed via the UNC path, which would imply kernel support, or is it only in Explorer? This is important to allow us to track down where the implementation lies. For example it's possible that if the feature only works in Explorer it could be implemented as a shell extension, similar to how MTP/PTP is supported.
To determine whether its a kernel driver or a shell extension it's as simple as opening the UNC path using the lowest possible function, which in this case means calling a system call. Invoking a system call will also eliminate the chance the WSL UNC path is implemented using some new feature added to the Win32 APIs. As my NtObjectManager module directly calls the NtOpenFile system call we can use that to do the test. I ran the following PowerShell command to check on the result:
$f = Get-NtFile \??\UNC\wsl$\Debian\bin\bash
This command successfully opens the BASH executable file. This is a clear indication that we now need to look at the kernel to find the driver responsible for implementing the UNC path. This is commonly implemented by writing a Network Mini-Redirector which handles a lot of the setup with the Multiple UNC Provider (MUP) and the IO Manager.
At this point the assumption would be the mini-redirector would be implemented in the LXCORE system driver which implements the rest of WSL. However a quick check of the imports with the DUMPBIN tool, shows the driver doesn't import anything from RDBSS which would be crucial for the implementation of a mini-redirector.
To find the actual driver name I'll go for the simplest, brute force approach, just list all drivers which import RDBSS and see if any are obvious candidates based on name. You could achieve this in one of many ways, for example you could implement a PE file parser and check the imports, you could script DUMPBIN, or you could just GREP (well FINDSTR) for RSBSS, which is what I'll do. I ran the following:
In the FINDSTR command I just list all drivers which contain the case insensitive string RDBSS and print out the filename only (unless you enjoy terminal beeps). The result of this process is a clear candidate P9RDR. This also likely confirms the use of the P9 protocol, though of course we should never jump the gun on this.
We could throw the driver into a disassembler at this point and start RE, but I don't want to go there just yet. Instead, in the spirit of laziness I'll throw the driver into STRINGS and get out all printable debug string information, of which there's likely to be some. I typically use the SysInternals STRINGS rather than the BINUTILS one, just as I usually always have it installed on any test system and it handles Unicode and ANSI strings with no additional argument. Below is some of the output from the tool:
P9: Invalid buffer for P9RDR_ADD_CONNECTION_TARGET_INPUT.
P9: Invalid share name in P9RDR_ADD_CONNECTION_TARGET_INPUT.
P9: Invalid AF_UNIX path in P9RDR_ADD_CONNECTION_TARGET_INPUT.
P9: Invalid share name in P9RDR_REMOVE_CONNECTION_TARGET_INPUT.
...
\wsl$
We can see a few things here, firstly we can see the WSL$ prefix, this is a good indication that we're in the right place. Second we can see a device name which gives us a good indication that there's expected to be communication from user-mode to kernel mode to configure the device. And finally we can see the string "AF_UNIX" which ties in nicely with our expectation that Unix Sockets are being used.
One this which is missing from the STRINGS output is any indication of the Unix socket file name being used. Unix sockets can be used in an "abstract" fashion, however typically you access the socket through a file path on disk. It's most likely that a file is how the driver and communicates with the socket (I don't even know if Windows supports the "abstract" socket names). Therefore if it is indeed using a file it's not a fixed filename. The kernel has support for a socket library so again maybe this would be the place we could go disassembling, but instead we'll just do some dynamic analysis using PROCMON.
In order to open a socket from a file there must be some attempt to call the IO Manager to open it, this in turn would likely be detectable using PROCMON's filter driver. We can therefore make the following assumptions:
The file open can be detected in PROCMON.
The socket file will be opened in the context of the first process to open the UNC path.
The open request will have the P9RDR driver on the call stack.
The first assumption is a general problem with PROCMON. There are ways of opening files, such as inside another filter driver which cannot be detected by PROCMON as it never receives the request. However we'll assume that is can be detected, of course if we don't find it we might have to resort to disassembly or kernel debugging after all.
The second assumption is based on the fact the WSL distribution isn't always running, therefore any Unix socket file would only be opened on demand, and for reasons of laziness is likely to be in the same process that first makes the request. It could push the request to a background thread, but it seems unlikely. By making this assumption we can filter PROCMON to only show open file requests from a known process.
The final assumption is there to filter down all possible open file requests to the ones we care about. As the driver is a mini-redirector the call chain is likely to be IO Manager to MUP to RDBSS to P9RDR to UNIX SOCKET. Therefore we only care about anything which goes through the driver of interest. This assumption is more important if assumption 2 is false as it might mean that we couldn't filter to a specific process, but we'll go with it anyway on the basis that it's useful technique to learn.
Based on the assumptions we can set PROCMON's filters for a specific process (we'll use PowerShell again) and filter for all CreateFile operations. The Windows kernel doesn't specifically differentiate between open and create calls (open is a specific case of create) so PROCMON doesn't either.
What about the call stack? As far as I can tell you can't filter on the call stack directly, instead we'll do something else. But first gather a trace of a PowerShell session where you execute the Get-NtFile command show earlier in this blog post. Now we want to save the trace as an XML file. Why an XML file? First, the XML format is easy to access, unlike the native PML format. However, the real answer is shown in the following screenshot.
The screenshot shows the options for exporting to XML. It allows us to save the call stacks for all trace events. It will even resolve symbols, however as we're only interested in the module on the stack not the name we can select to include the stack trace, but not symbol resolving. With an exported trace we can now filter the calls based using a simple XPath expression. The following is a simple PowerShell script to run the XPath query.
The script is pretty simple, if you "cast" a text file to an XML object (using [xml]) PowerShell will create an XML DOM Document from the text. With the Document object we can now call SelectNodes with an appropriate XPath. In this case we just want to select all Path of all events which have a stack trace frame containing the P9RDR module. Running this script against the capture results in one hit:
DISTRO is the name of the Store package you installed the distro from, for example Debian is installed into TheDebianProject.DebianGNULinux_76v4gfsz19hv4. With a file name of fsserver it seems pretty clear what the file is for, but just to check lets open the event back in PROCMON and look at the call stack.
I've highlighted areas of interest, at the top there's the calls through the AFUNIX driver, which demonstrates that the file is being opened due a UNIX socket connection being made. At the bottom we can see a list of calls in the P9RDR driver. As symbol resolving is enabled we can use the symbol information to target specific areas of the driver for reverse engineering. Also now we know the path we can put this back into PROCMON as a filter and from that we can confirm that it's the init process which is responsible for setting up the file server.
In conclusion we can at least confirm a few things which we didn't know before.
The handling of the UNC paths is handled entirely in kernel mode via a mini-redirector. This makes the file system more interesting from a security perspective as it's parsing arbitrary user data in the kernel.
The file system uses UNIX sockets for communication, this is handled by the kernel driver and the main init process.
The socket protocol is presumably P9 based on the driver name, however we've not actually confirmed that to be true.
There's of course still things we'd want to know:
How is the UNC mappings configured? Via the device driver?
Is the protocol actually P9, if so what information is being passed across?
How well "fuzzed" are the protocol parsers.
Does this file system have any other interesting behaviors.
Some of those things will have to wait for another blog post.
This time we are having some fun with a standard null-armored stack canary, as well as an additional custom one (we will extensively cover both scenarios, as there's plenty of subject matter here), plus some peculiarities regarding scanf() and read().
Here are the compilation flags; static and no PIE - although the latter does not matter much in this case - we will leak the code segment base anyway:
Let's start with the main function:
We have two always functions called from the main function one after another, regardless to any user input; selectABook() and findSomeWords().
selectABook() looks like this:
Apart from its (and the entire app's, for that matter) general weirdness, we can see that:
the function is recurrent (line 29) when user input does not match any of the hardcoded conditions
it's vulnerable to a stack-based buffer overflow via scanf("%s",buf_secure) - line 16
it's also vulnerable to format string (line 17)
readA(), readB() and readC() are just simple methods printing out static hardcoded strings (Aristote's Metaphysics quotes), nothing useful in the context of exploitation (unless we had printf() GOT overwritten, but that is not what's going to happen here):
So at this point it already looked like I had what was needed to pwn the app; two bugs to chain together:
an overflow to overwrite the saved RET on the stack
a format string to leak the value of stack canary (and stack and code base if neessary) - so we can overwrite the stack canary with its own original value and therefore avoid the stack guard noticing we smashed the stack and therefore avoid the stack guard preventing the program from returning to our arbitrary EIP
Leaking the standard canary with format string
Let's start with identifying how the actual built-in code for handling stack canaries looks like in gcc-produced assembly:
the beginning of the main() functionthe bottom of the main() function
The same holds true for all other functions.
Now, let's see what the stack values look like between runs and how exactly stuff is aligned on the stack. As we want to leak from selectABook()'s stack - because this is where the format string resides - let's put our breakpoints there:
Let's stop at selectABook+15 - our current canary will be held in EAX.
Then at selectABook+42 - after the scanf() call - we'll fill the buf[512] with exactly 512 bytes so we don't overflow anything yet and see the original values on the stack.
So we run:
breakpoint 1 - canary value is held in EAX
OK, now let's continue. Now (we have already been prompted above - Enter Your Favorite Author's Last Name:), we just paste 512 characters:
OK, we're past the scanf() call. Let's see the stack now:
Nah, something's wrong. Maybe it's because string formats index the`$`-referred arguments starting at 1... Let's see what's under %1$p:
Nah, it's the buf_secure address itself.
How about 130?
Yeah more like it.
The value is consistent between function calls (selectABook() as well as selectABook()->selectABook() recurrent call - remember, the stack canary value is global to the entire process) and it changes between runs.
Also, in this case the saved EBP should be right next to it, at 131:
Consecutive values of saved EBP across recurrent selectABook() calls
Yup. The consecutive values are decreasing by a fixed offset, as recurrent calls of selectABook() continue.
We will need this value as well while developing the exploit for this.
As usual - the exploit failed at the first attempt...
And I was too lazy to actually debug it.
Instead, once I noticed that the saved RET was not overwritten in result of overflowing the buffer, I mistakenly assumed (self-limiting assumptions!) that the nullbyte-armoured stack canary (you probably already noticed that all the canaries so far had nullbyte as their least-significant byte) was the reason I could not - via scanf("%s",buf_secure) - write beyond the nullbyte. I just thought scanf() would stop reading after encountering 0x0 on its input, explicitly because of the %s format string. I was wrong, but this assumption was reinforced by the fact that oftentimes while figuring out solutions to MBE targets I felt like it was all fine and dandy... only to later realize some tiny little obstacle. A tiny little obstacle forcing me to double the overall effort to attain a working exploit. Thus I assumed selectABook() exploitability was too good (too easy) to be true.
To follow the selectABook() exploitation route, skip to Building the ROP chain and then to Successfully exploiting selectABook() locally and remotely sections.
Otherwise, read on to explore the remainder of the target app and my exploit dev process.
Analyzing the rest of the code
We have only read half of the source code yet (as mentioned, this is an extensive write up)!
So, to feed our curiosity, instead of getting ahead of ourselves, let's see what's going on in the second function - findSomeWords():
The stack-based buffer overflow of the 24-byte buf[24] buffer with read(STDIN, buf,2048) at line 75 is quite blatant.
The rest of the code is just super-weird. First, the unused char lolz[4], then the entire custom cookie mechanism.
Bypassing the custom canary check
So let's try to figure out what's the deal with it.
global_addr and global_addr_check are global pointers held in the data segment, declared at the top of the source code, right below the compilation flags comment:
Although their initialization expressions are quite simple, I found them far away from obvious:
So apparently global_addr is a pointer to the next value after the buf (I initially thought it's just the address of the buf buffer incremented by 1, but I was wrong).
Then global_addr_check is the global_addr (whatever it is) decremented by 2.
And then finally there's this check:
The implication is as follows: if we want to exploit the stack-based buffer overflow in findSomeWords(), we need the function to properly return, without the exit(EXIT_FAILURE) nor the standard stack guard interrupting.
So in order to make it return, we need to both:
overwrite the original stack canary stored on the stack with its own value that we leak earlier via format string in selectABook() (there is just one stack canary value for the entire program, initiated before main() is executed, used by the stack guard for all following function calls)
make the ((( globaladdr))^((globaladdrcheck))) != ((( globaladdr))^(0xdeadbeef)) condition return false so exit(EXITFAILURE) is not called
Let's simplify the custom-cookie condition.
We want this:
to evaluate false.
Which means we want this to be true:
Which means global_addr_check must equal 0xdeadbeef.
OK fair enough, does this mean that the custom cookie protection by default makes the program exit with EXIT_FAILURE error code and Whoah there! message?
Yes, it does - simply running the app and providing "A" and "HELLO" inputs, respectively, results in this:
Fair enough. Let's bypass this custom canary, forgetting about the format string and overflows for now.
Let's make this app print out Whew you made it! instead of doing exit(EXIT_FAILURE) in findSomeWords():
As my poor understanding of C kept me unsure about the mechanism, I got to the bottom of this by running gdb, disassebmling the findSomeWords()function, setting up a breakpoint after the read() call and stepping through it, instruction after instruction.
OK, breapoints:
Debugging step by step.
1) findSomeWords+80:
At this point EAX is 0xbffff700 --> 0xc43c9300 - the address of the canary on the local function's stack.
2) findSomeWords+87:
At this point EAX is still 0xbffff700 --> 0xc43c9300, EDX is 0xc43c9300 (canary from the stack). So now we have proof that the global_addr = (&buf+0x1); instruction makes the global_addr pointer point at the canary on the stack.
And now we are about to find out what's under ds:0x80edf24 (the value just gets copied to EAX).
3) findSomeWords+92:
And now EAX is 0x080481a8... weird. Let's peek the stack and see what's what:
OK, so global_addr points at the canary on the stack, while global_addr_check points at the value two dwords (-0x8) earlier. But hang on, where did this 0x080481a8 value come from?
The reason is that we did not fill the entire buf[24] buffer (I only sent 11 Bs at that time). Here's how the buf[24] overlaps with global_addr_check:
This means that:
global_addr points at the stack-stored copy of the canary
global_addr_check points at the before-last byte of the buf[24]. So the (&buf+0x1); instruction considered the buf size, making it point at the next dword on the stack (the canary), while global_addr_check = global_addr-0x2; made global_addr_check points two dwords earlier, at the four bytes at buf[15-19].
In recap: the stack-stored canary XOR-ed with 0xdeadbeef must equal stack-stored canary XOR-ed with the before-last dword of the buff. Which simply means we just want the before-last dword of buff[24] (again, bytes 15-19) to be 0xdeadbeef.
So as long as the value we provide to the read(STDIN,buf,2048) call in findSomeWords() contains 0xdeadbeef at its fifth dword (bytes 15-19), we should bypass the custom stack protection:
OK cool, now we should be able to easily exploit the overflow in findSomeWords().
Building the ROP chain
Since we don't have libc dynamically linked in here, we can't do system().
Fine, we just want to call execve syscall the usual way:
eax = 0xb
ebx = pointer to "/bin/sh" - or, for that matter, "/bin/python" or anything other than "/bin/bash" (because bash is evil and drops the euid if called from a suid binary - fucking safety features)
ecx = edx = 0
int 0x80
Let's start ROPeme ropshell.py, generate the gadgets from the target binary and search through them.
Spoiler alert: at the late stage of the exploit development process I realized that - when targeting the scanf("%s") overflow - characters 0xa (newline) and 0xd (carriage-return) have to be avoided - as opposed to 0x0 (yes, really).
Thus, some of the gadgets I initially used had to be replaced due to the fact their addresses contained either 0xa or 0xd.
Running ROPeme, generating the gadgets:
Loading the gadgets:
Searching the gadgets (let's start with xor anything anything):
OK, all the last three look good for starters, we can initiate EAX with 0.
By the way, please keep in mind I started building this one with the assumption I could not use nullbytes in the payload, so instead of just putting a pop eax address followed by a nullbyte, I kept assembling these workarounds - but it was fun and finally worked.
Just keep in mind now EAX hold whatever garbage was in EDX, so we'll have to zero it again, with one of the xor eax eax gadgets.
Oh fuck, we can't use them. They all contain 0xa.
Fair enough.
Instead, we use the gadget putting 0xffffffff to EDX followed by inc edx to overflow it to 0:
Now, we want EAX to become 0xb. It's 0 at the moment.
So why not to call inc eax twelve times.
My meticulous effort to keep the chain clean from nullbytes finally collapsed when I had to nullify ecx. Instead of pop ecx followed by a nullbyte I did this:
Which looks nicer but still does not change the fact that p32(0x1) = 0x00000001 - contains three nullbytes.
Then, EBX = address of "/bin/sh" (we will smuggle /bin/sh string to the stack in user input, then just calculate its address based on the leaked EBP value):
OK, one last thing, the int 0x80 call.
But wait, it has a nullbyte (I did not want nullbytes!).
OK, so what's the instruction right above it?
It's a NOP. Wonderful. So we can as well use 0x806f8ff.
Successfully exploiting findSomeWords() locally - read(STDIN,buf,2048) not catching up via socat
Having all the bits and pieces I assembled an exploit targeting the findSomeWords() overflow, with the following algorithm:
1) leak the canary and the saved RET via format string
2) make the selectABook() function return by providing one of the expected values ("A") to its input
3) overflow the buf[24] buffer via read(STDIN, buf, 2048), using the leaked canary as well as the 0xdeadbeef constant properly aligned in the payload, followed by four bytes of garbage to fill the saved EBP and the ROP chain beginning where saved RET was:
And it worked just fine on the target binary /levels/lab08/lab8A, getting me a shell... The problem was that my privileges were still lab8A instead of expected lab8end... So I listed the /levels/lab08 directory only to find out that this one is NOT a suid binary.
Instead I found this:
This means the target is being run from root like this:
"Well that's just as well" - I thought. And just changed the p = process(binary.path,stdin=PTY) line to p = remote("127.0.0.1", 8841) and ran the thing.
It did not work.
Debugging (this time attaching to the target PID from root, as there was no other way) revealed that the exactly same exploit code did not deliver a single byte to the buf[24] buffer.
So I thought "how come, ffs... Does it mean it completely ignores the user input?".
So I ran it manually to see that was the case:
Interacting with the socat-run target app via nc
So yes, I could only interact with the selectABook() function. Simply typed "A" and pressed enter, having no further opportunity to interact with the application.
At the moment I still do not know why - please let me know if you have a clue, I am curious.
Successfully exploiting selectABook() locally and remotely
At this point, as usual when I felt despair - I peeked into Corb3nik's solutions (https://github.com/Corb3nik/MBE-Solutions/blob/master/lab8a/solution.py) - not only to see that his exploit did not deal with findSomeWords() and its custom stack canary at all - but mostly to realize he exploited selectABook() (which meant scanf("%s") ... with nullbytes in the payload!
So I fell back on the first exploit I wrote, started debugging it again. I found out the reason it was failing was due 0xa and 0xd characters in the initial ROP chain. These turned out to be the real bad characters when it comes to scanf()! Again, as opposed to nullbyte.
Then I found out that the string I was trying to make EBX point to (/bin/python) - as I found that string on the stack in the early stage of the exploit development and thought it would be nice to use it instead of delivering /bin/sh via user input) - was not there when targeting the actual app running under socat... It must have been a side effect of spawning the process from the python script with pwntools while developing the exploit.
Then it turned out my lengthy ROP chain (overflowing the local buf_secure of the selectABook()->selectABook() call ) overwrote the /bin/sh value I delivered to the stack right after the initial format-string payload (the first call of selectABook()).
So I ended up adding additional 200 characters (H) between the format string and /bin/sh and increasing the value subtracted from the leaked EBP in the binsh_addr =EBP_value-338 expression accordingly.
1) Attacking the first selectABook() call to leak the canary and the saved EBP via format string while also stuffing /bin/sh on the stack - with 200 H-s between as this buffer will get overwritten by the ROP chain when we overflow the buffer in the second (recurrent) call selectABook()->selectABook():
2) Attacking the second call selectABook()->selectABook() by overflowing the buf_secure[512] with 512 B-s followed by the original leaked canary value, the original saved EBP value (although this value does not matter here as long as it is not a bad char) and the 0xa-free and 0xd-free ROP chain replacing the saved RET:
3) Making the third selectABook()->selectABook()->selectABook() call return (instead of continuing the recurrence) by providing one of the expected values - A:
TL;DR; This blog post describes a technique to inject a DLL into a process using only Duplicate Handle process access (caveats apply) which will also bypass Code Integrity Guard.
I've been attending Blackhat USA 2019 and watched a presentation by Amit Klein and Itzik Kotler on Windows Process Injection techniques. While I didn't learn anything new from the presentation that you couldn't from just reading Hexacorn's blog it was interesting to see them document what techniques worked against Code Integrity Guard (CIG) and what did not. CIG if you don't know, is Microsoft's term for blocking non-MS signed DLLs from being loaded into a process. If CIG is enabled on a process then you can load an arbitrary DLL not signed by Microsoft, instead you'll have to do some sort of shellcode or ROP.
During the presentation I was waiting for the punchline of a technique which bypasses CIG to load an arbitrary DLL, but it never arrived. I'm guessing the researchers don't bother to read my blog posts *sigh*, such as this one on injecting code into a Protected Processes though abusing the KnownDll mechanism. This would also work to bypass CIG if injecting from an external process not under CIG (or Device Guard). All the ways of hijacking the Known DLL loader that I've documented rely on knowing the location of Known DLL handle in NTDLL's data section. That's useful when you have little control over the target process and only an arbitrary read/write primitive. For user-mode code injection you're likely to be able to do anything to the process.
Writing a new handle value does have draw backs if you're thinking about it from a generic code injection perspective. Firstly the location of the handle can (and does) change depending on the version of NTDLL and secondly if you access and write memory of another process you might as well call your binary malware.exe. Of course writing to memory is not the only way to hijack Known DLLs, you can achieve the same thing with only Duplicate Handle access on the process, which is probably slightly less suspicious.
How can we do this without modifying the handle value? There's 3 key observations we can make that only require Duplicate Handle access:
We can find the existing handle value of the KnownDlls directory by duplicating handles from a process to another and querying for the name.
We can close a handle in another process by specifying DUPLICATE_CLOSE_SOURCE to DuplicateHandle.
The kernel's handle allocator will reuse the handle values so we can replace the original handle with a different object through brute force.
Let's go through how this works in practice. I'm going to show some snippets of PowerShell which use my NtObjectManager module. I'm not going to provide a full end-to-end proof-of-concept however for various reasons.
Step 1: Bring up a process to inject into, the Known DLLs handle is created during the initial loader process before the process entry point is called, so the process must run at least that long. Once we know the Process ID of the process to inject into we can dump all handles in the process and look for anything with the NT type of Directory. Each directory handle can then be duplicated into the current process and inspected. If the name of the directory is "\KnownDlls" we've found our target. In PowerShell we can use my Get-NtHandle cmdlet to dump the handle table, this doesn't require opening the process itself. To get the name we only need PROCESS_DUP_HANDLE access to the target. Here's a basic PS function to get the handle value:
Step 2: Create an empty object directory and insert into it a named image section object. The name of the section needs to match the name of the system32 DLL we want to hijack. The file backing the section is obviously the DLL you want loaded into the process. Again some code, assuming you've already created the directory
Step 3: Close the original Known DLLs handle. Again this only needs Duplicate Handle access. At this point you probably also want to suspend the process to ensure something doesn't execute and allocate the handle over the top of your now closed handle. Of course if you suspend the process you'll need a bit more access.
Step 4: Repeatedly duplicate the fake Known DLLs directory you created in step 2 until you get the same handle value as you identified in step 1. If the process is suspended this shouldn't take more than a few tries at worst.
Step 5: Everything is now setup. The final step is you'll need to get a new library loaded from system32 inside the process. There's a number of possible techniques for this. You could go old-skool and create a new thread in process calling LoadLibrary. Or you could identify a DLL which you know the process will load in response to a UI or RPC action. For example opening a file in Notepad will spawn the explorer open dialog which pulls in ALOT of new DLLs. Be creative, at least if you don't want to open the process with anything above Duplicate Handle access.
The question you might be asking is, "Do any AV/Host Detection tools catch this trick?". Honestly I don't know, nor do I care. However it has some things going for it:
It doesn't requiring reading or writing memory from the target process.
Inline hooks on LoadLibrary/LdrLoadDll will just see loading a system32 DLL unless they also then query for the mapped file name after the operation has completed.
It bypasses CIG, so anyone thinking that'll prevent injection will be surprised.
You could probably make it even more convert, but I'm not going to do so. As I've noted before I'm also not going to write a proof-of-concept or write a tool to do this, you can do it yourself.
Hello,
In this blogpost I'm going to share an analysis of a recent finding in yet another Antivirus, this time in Comodo AV. After reading this awesome research by Tenable, I decided to give it a look myself and play a bit with the sandbox.
I ended up finding a vulnerability by accident in the kernel-mode part of the sandbox implemented in the minifilter driver cmdguard.sys. Although the impact is just a BSOD (Blue Screen of Death), I have found the vulnerability quite interesting and worthy of a write-up.
Comodo's sandbox filters file I/O allowing contained processes to read from the volume normally but redirects all writes to '\VTRoot\HarddiskVolume#\' located at the root of the volume on which Windows is installed.
For each file or directory opened (IRP_MJ_CREATE) by a contained process, the preoperation callback allocates an internal structure where multiple fields are initialized.
The callbacks for the minifilter's data queue, a cancel-safe IRP queue, are initialized at offset 0x140 of the structure as the disassembly below shows. In addition, the queue list head is initialized at offset 0x1C0, and the first QWORD of the same struct is set to 0xB5C0B5C0B5C0B5C.
(Figure 1)
Next, a stream handle context is set for the file object and a pointer to the previously discussed internal structure is stored at offset 0x28 of the context.
Keep in mind that a stream handle context is unique per file object (user-mode handle).
(Figure 2)
The only minifilter callback which queues IRPs to the data queue is present in the IRP_MJ_DIRECTORY_CONTROL preoperation callback for the minor function IRP_MN_NOTIFY_CHANGE_DIRECTORY.
Before the IRP_MJ_DIRECTORY_CONTROL checks the minor function, it first verifies whether a stream handle context is available and whether a data queue is already present within. It checks if the pointer at offset 0x28 is valid and whether the magic value 0xB5C0B5C0B5C0B5C is present.
(Figure 3) : Click to Zoom
Before the call to FltCbdqInsertIo, the stream handle context is retrieved and a non-paged pool allocation of size 0xE0 is made of which the pointer is stored in RDI as shown below.
(Figure 4)
Later on, this structure is stored inside the FilterContext array of the FLT_CALLBACK_DATA structure for this request and is passed as a context to the insert routine.
(Figure 5)
FltCbdqInsertIo will eventually call the InsertIoCallback (seen initialized on Figure 1). Examining this routine we see that it queues the callback data structure to the data queue and then invokes FltQueueDeferredIoWorkItem to insert a work item that will be dispatched in a system thread later on.
As you can see from the disassembly below, the work item's dispatch routine (DeferredWorkItemRoutine) receives the newly allocated non-paged memory (Figure 4) as a context.
(Figure 6) : Click To Zoom
Here is a quick recap of what we saw until now :
For every file/directory open, a data queue is initialized and stored at offset 0x140 of an internal structure.
A context is allocated in which a pointer to the previous structure is stored at offset 0x28. This context is set as a stream handle context.
IRP_MJ_DIRECTORY_CONTROL checks if the minor function is IRP_MN_NOTIFY_CHANGE_DIRECTORY.
If that's the case, a non-paged pool allocation of size 0xE0 is made and initialized.
The allocation is stored inside the FLT_CALLBACK_DATA and is passed to FltCbdqInsertIo as a context.
FltCbdqInsertIo ends up calling the insert callback (InsertIoCallback) with the non-paged pool allocation as a context.
The insert callback inserts the request into the queue, queues a deferred work item with the same allocation as a context.
It is very simple for a sandboxed user-mode process to make the minifilter take this code path, it only needs to call the API FindFirstChangeNotificationA on an arbitrary directory.
Let's carry on.
So, the work item's context (non-paged pool allocation made by IRP_MJ_DIRECTORY_CONTROL for the directory change notification request) must be freed somewhere, right ? This is accomplished by IRP_MJ_CLEANUP 's preoperation routine.
As you might already know, IRP_MJ_CLEANUP is sent when the last handle of a file object is closed, so the callback must perform the janitor's work at this stage.
In this instance, The stream handle context is retrieved similarly to what we saw earlier. Next, the queue is disabled so no new requests are queued, and then the queue cleanup is done by "DoCleanup".
(Figure 8)
As shown below this sub-routine dequeues the pended requests from the data queue, retrieves the saved context structure in FLT_CALLBACK_DATA, completes the operation, and then goes on to free the context.
(Figure 9)
We can trigger what we've seen until now from a contained process by :
Calling FindFirstChangeNotificationA on an arbitrary directory e.g. "C:\" : Sends IRP_MJ_DIRECTORY_CONTROL and causes the delayed work item to be queued.
Closing the handle : Sends IRP_MJ_CLEANUP.
What can go wrong here ? The answer to that is freeing the context before the delayed work item is dispatched which would eventually receive a freed context and use it (use-after-free).
In other words, we have to make the minifilter receive an IRP_MJ_CLEANUP request before the delayed work item queued in IRP_MJ_DIRECTORY_CONTROL is dispatched for execution.
When trying to reproduce the vulnerability with a single thread, I noticed that the work item is always dispatched before IRP_MJ_CLEANUP is received. This makes sense in my opinion since the work item queue doesn't contain many items and dispatching a work item would take less time than all the work the subsequent call to CloseHandle does.
So the idea here was to create multiple threads that infinitely call : CloseHandle(FindFirstChangeNotificationA(..)) to saturate the work item queue as much as possible and delay the dispatching of work items until the contexts are freed. A crash occurs once a work item accesses a freed context's pool allocation that was corrupted by some new allocation.
Below is the proof of concept to reproduce the vulnerability :
And here is a small Windbg trace to see what happens in practice (inside parentheses is the address of the context) :
In August 2019 Microsoft announced it had patched a collection of RDP bugs, two of which were wormable. The wormable bugs, CVE-2019-1181 & CVE-2019-1182 affect
2 years ago I wrote a post running a process in the TrustedInstaller group. It was pretty well received, and as others pointed out there's many way of doing the same thing. However in my travels I came across a new way I've not seen documented before, though I'm sure someone will point out where I've missed documentation. As with the previous post, this does require admin privileges, it's not a privilege escalation. Also I tested the behavior I'm documented on Windows 10 1903. Your mileage may vary on different versions of Windows.
It revolves around the Task Scheduler (obvious by the title I guess), specifically calling the IRegisteredTask::RunEx method exposed by the Task Scheduler COM API. The prototype of RunEx is as follows:
HRESULT RunEx( VARIANT params, LONG flags, LONG sessionID, BSTR user, IRunningTask **ppRunningTask );
The thing we're going to use is the user parameter, which is documented as "The user for which the task runs." Cheers Microsoft! Through a bit of trial and error, and some reverse engineering it's clear the user parameter can take three types of string values:
A normal user account. This can be the name or a SID. The user must be logged on at the time of starting the task as far as I can tell.
The standard system accounts, i.e. SYSTEM, LocalService or NetworkService.
A service account!
Number 3 is the one we're interested in here, it allows you to specify an installed service account, such as TrustedInstaller and the task will run as SYSTEM with the service SID included. Let's try it out.
The advantage of using the user parameter is the task can be registered to run as a normal user, and we'll change it at run time to be more sneaky. In theory you could directly register the task to run as TrustedInstaller, but then it'd be more obvious if anyone went looking. First we need to create a scheduled task, run the following script in PowerShell to create a simple task which will run notepad.
Now we need to call RunEx. While PowerShell has a Start-ScheduledTask cmdlet neither it, or the schtasks.exe /Run command allows you to specify the user parameter (aside, the /U parameter for schtask does not do what you might think). Instead as the COM API is scriptable we can just run some PowerShell again and use the COM API directly.
I thought I'd blogged about this topic, however it turns out I hadn't. This blog is in response to a recent Twitter thread from Bruce Dawson on a "fake" copy of Python which Microsoft seems to have force installed on some peoples Windows 10 1903 installations. I'll go through the main observation in the thread that the Python executable is 0 bytes in size, how this works under the hood to start a process and I'll finish with a dumb TOCTOU bug which still exists in part of the implementation which _might_ be useful as part of an EOP chain.
Execution Aliases for UWP applications were introduced in Windows 10 Fall Creators Update (1709/RS3). For application developers this feature is exposed by adding an AppExecutionAlias XML element to the application's manifest. The manifest information is used by the AppX installer to drop the alias into the %LOCALAPPDATA%\Microsoft\WindowsApps folder, which is also conveniently (or not depending on your POV) added to the user PATH environment variable. This allows you to start a UWP application as if it was a command line application, including passing command line arguments. One example is shown below, which is taken from the WinDbgX manifest.
This specifies an execution alias to run DbgX.Shell.exe from the file WinDbgX.exe. If we go to the WindowsApps folder we can see that there is a file with that name, and as mentioned in the Twitter thread it is a 0 byte file. Also if you try and open the file (say using the type command) it fails.
How can an empty file result in a process being created? Executing the WinDbgX.exe file inside a shell while running Process Monitor shows some interesting results which I've highlighted below:
The first thing to highlight is the CreateFile calls which return a "REPARSE" result. This is a good indication that the file contains a reparse point. You might assume therefore that this file is a symbolic link to the real target, however a symbolic link would still be possible to open which we can't do. Another explanation is the reparse point is a custom type, not understood by the kernel. This ties in with the subsequent call to FileSystemControl with the FSCTL_GET_REPARSE_POINT code which would indicate some user-mode code is requesting information about the stored reparse point. Looking at the stack trace we can see who's requesting the reparse point data:
The stack trace shows the reparse point data is being queried from inside CreateProcess, through the exported function LoadAppExecutionAliasInfoEx. We can dig into CreateProcessInternal to see how it all works:
CreateProcessInternal will first try and execute the path directly, however as the file has an unknown reparse point the kernel fails to open the file with STATUS_IO_REPARSE_TAG_NOT_HANDLED. This status code provides a indicator to take an alternative route, the alias information is loaded from the file's reparse tag using LoadAppExecutionAliasInfoEx and an updated application path and access token are used to start new the new process.
What is the format of the reparse point data? We can easily dump the bytes and have a look in a hex editor:
The first 4 bytes is the reparse tag, in this case it's 0x8000001B which is documented in the Windows SDK as IO_REPARSE_TAG_APPEXECLINK. Unfortunately there doesn't seem to be a corresponding structure, but with a bit of reverse engineering we can work out the format is as follows:
The reason we have no structure is probably because it's a serialized format. The Version field seems to be currently set to 3, I'm not sure if there exists other versions used in earlier Windows 10 but I've not seen any. The Package ID and Entry Point is information used to identify the package, an execution alias can't be used like a shortcut for a normal application it can only resolve to an installed packaged application on the system. The Executable is the real file to executed that'll be used instead of the original 0 byte alias file. Finally Application Type is the type of application being created, while a string it's actually an integer formatted as a string. The integer seems to be zero for desktop bridge applications and non-zero for normal sandboxed UWP applications. I implemented a parser for the reparse data inside NtApiDotNet, you can view it in NtObjectManager using the Get-ExecutionAlias cmdlet.
We now know how the Executable file is specified for the new process creation but what about the access token I alluded to? I actually mentioned about this at Zer0Con 2018 when I talked about Desktop Bridge. The AppInfo service (of UAC fame) has an additional RPC service which creates an access token from a execution alias file. This is all handled inside LoadAppExecutionAliasInfoEx but operates similar to the following diagram:
The RAiGetPackageActivationToken RPC function takes a path to the execution alias and a template token (which is typically the current process token, or the explicit token if CreateProcessAsUser was called). The AppInfo service reads the reparse information from the execution alias and constructs an activation token based on that information. This token is then returned to the caller where it's used to construct the new process. It's worth noting that if the Application Type is non-zero this process doesn't actually create the AppContainer token and spawn the UWP application. This is because activation of a UWP application is considerably more complex to stuff into CreateProcess, so instead the execution alias' executable file is specified as the SystemUWPLauncher.exe file in system32 which completes activation based on the package information from the token.
What information does the activation token contain? It's basically the Security Attribute information for the package, this can't normally be modified from a user application, it requires TCB privilege. Therefore Microsoft do the token setup in a system service. An example token for the WinDbgX alias is shown below:
The rest of the activation process is not really that important. If you want to know more about the process checkout my talks on Desktop Bridge and the Windows Runtime.
I promised to finish up with a TOCTOU attack. In theory we should be able to create execution alias for any installed application package, it might not start a working process be we can use RAiGetPackageActivationToken to get a new token with explicit package security attributes which could be useful for further exploitation. For example we could try creating one for the Calculator package with the following PowerShell script (note this uses version information for calculator on 1903 x64).
If we call RAiGetPackageActivationToken this works and creates a new token, however it creates a reduced privilege UWP token (it's not an AppContainer but for example all privileges are stripped and the security attributes assumes it'll be in a sandbox). What if we wanted to create a Desktop Bridge token which isn't restricted in this way? We could change the AppType to Desktop, however if you do this you'll find RAiGetPackageActivationToken fails with an access denied error. Digging a bit deeper we find it fails in daxexec!PrepareDesktopAppXActivation, specifically when it's checking if the package contains any Centennial (now Desktop Bridge) applications.
This of course makes perfect sense, no point creating an desktop activation token for a package which doesn't have desktop applications. However, notice the if statement, if bit 1 is not set it does the check, however if set these checks are skipped entirely. Where does that bit get set? We need to go back to caller of PrepareDesktopAppXActivation, which is, unsurprisingly, RAiGetPackageActivationToken.
This code shows that the flag is set based on the result of IsTrustLabelPresentOnReparsePoint. While we could infer what that function is doing let's reverse that as well:
Basically what this code is doing is querying the file object for its Process Trust Label. The label can only be set by a Protected Process, which normally we're not. There are ways of injecting into such processes but without that we can't set the trust label. Without the trust label the service will do the additional checks which stop us creating an arbitrary desktop activation token for the Calculator package.
However notice how the check re-opens the file. This is occurring after the reparse point has been read which contains all the package details. It should be clear that here is a TOCTOU, if you can get the service to first read a execution alias with the package information, then switch that file to another which has a valid trust label we can disable the additional checks. This was an attack that my BaitAndSwitch tool was made for. If you build a copy then run the following command you can then use RAiGetPackageActivationToken with the path c:\x\x.exe and it'll bypass the checks:
BaitAndSwitch c:\x\x.exe c:\path\to\no_label_alias.exe c:\path\to\valid_label_alias.exe x
Note that the final 'x' is not a typo, this ensures the oplock is opened in exclusive mode which ensures it'll trigger when the file is initially opened to read the package information. Is there much you can really do with this? Probably not, but I thought it was interesting none the less. It'd be more interesting if this had disabled other, more important checks but it seems to only allow you to create a desktop activation token.
That about wraps it up for now. Embedding this functionality inside CreateProcess was clever, certainly over the crappy support for UAC which requires calling ShellExecute. However it also adds new and complex functionality to CreateProcess which didn't exist before, I'm sure there's probably some exploitable security bug in the code here, but I'm too lazy to find it :-)
In the windows kernel, each kernel object has a Query/SetInformation functions which can be used to
manipulate the kernel objects members from user/kernel mode. These functions receive an “INFOCLASS”
which is basically the member we want to modify/query.
Found this funny driver: The pdc.sys windows driver has a DriverUnload routine but it calls KeBugCheckEx causing a bluescreen.
Just run "sc stop pdc" and see for yourself ;)
I wonder why they registered DriverUnload if the driver does not support unload.. 🤔 pic.twitter.com/TNpKIZGvZX
— Ori Damari (@0xrepnz) October 8, 2019