Following the wake of the previous post, here is Practical Binary Analysislevel 7 CTF walkthrough.As we pay attention to the oracle’s hint, we begin to suspect that this level might be two-staged:
$ ./oracle 0fa355cbec64a05f7a5d050e836b1a1f -h Find out what I expect, then trace me for a hint If we try to open the level7 file
1.$ ./lvl7 -bash: ./lvl7: cannot execute binary file: Exec format error $ file lvl7 lvl7: gzip compressed data, last modified: Sat Dec 1 17:30:15 2018, from Unix We can see it’s a gzip format, so we need to decompress it first.
Yesterday I've read Microsoft's blog post about the new ATP kernel sensors added to log injection of user-mode APCs. That got me curious and I went to examine the changes in KeInsertQueueApc.
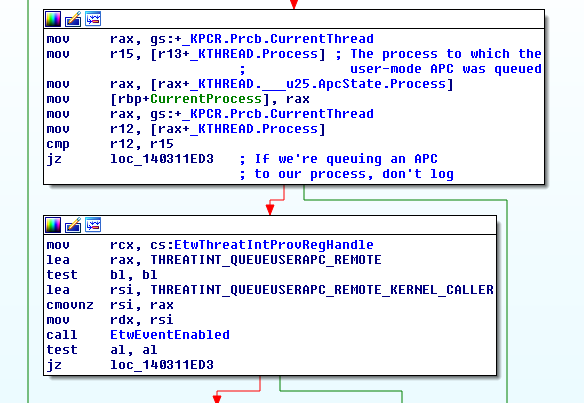
The instrumentation code invokes the function EtwTiLogQueueApcThread to log the event. The function's prototype looks like this :
EtwTiLogQueueApcThread is only called when the queued APC is a user-mode APC and if KeInsertQueueApc successfully inserted the APC into the queue (Thread->ApcQueueable && !Apc->Inserted).
EtwTiLogQueueApcThread first checks whether the user-mode APC has been queued to a remote process or not and only logs the event in the former case.
It also distinguishes between remotely queued APCs from user-mode (NtQueueApcThread(Ex)) and those queued from kernel-mode; The former is used to detect user-mode injection techniques like this one.
As shown below, two event descriptors exist and the one to log is determined using the current thread's previous mode to know whether the APC was queued by a user process or by a kernel driver.
(Click to zoom)
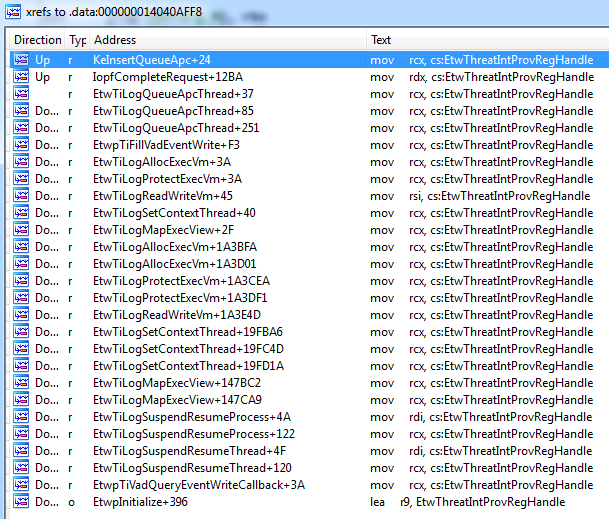
Looking at where the event provider registration handle EtwThreatIntProvRegHandle is referenced, we see that not only remote user-mode APC injection is logged but also a bunch of events that are commonly used by threats.
(Click to zoom)
Thanks for reading and until another time :)
Follow me on Twitter : here
During the last month I have been busy reading this awesome book by Dennis Andriesse, which quickly became one of my favourite reads on the subject: it does an excellent job on covering the foundation about Linux’s binary analysis and also going above and beyond by providing the reader with all the necessary techniques to be highly proficient and effective when dealing with such alchemical matter.
Chapter 5 has the purpose of illustrating all these different tools of the trade which culminates with an intriguing CTF, whose goal is to challenge the reader to put in practice all the skills&tricks gained up to this point.
This post is a continuation of my MBE (Modern Binary Exploitation) walkthrough series. In order to get some introduction, please see the previous post: https://hackingiscool.pl/mbe-lab6c-walkthrough/.
A look at the target app
So let's get right to it. The source code of the target application can be found here: https://github.com/RPISEC/MBE/blob/master/src/lab06/lab6B.c. The lab6B.readme reveales that this time we are not dealing with a suid binary. Instead, we are supposed to compromise a service running on port 6642.
Let's see if we can interact with it from our MBE VM command line:
Nice, it's working.
Running locally
Our target application is not actually capable of networking. This is covered by socat:
For the purpose of better understanding of how the target program behaves and making its exploit development easier, let's compile our own version in /tmp.
The only change required is the hardcoded /home/lab6A/.pass path - with the assumption that we are doing our development from the MBE VM, using lab6B account (as we won't have the privileges to read it):
I just replaced it with pass.txt (the file needs to exist, be nonempty and readable for the program to work properly):
The source code overview
Now, the source code. Just like in lab6C.c, we have a 'secret_backdoor()' function here as well, so all we are gonna need is execution control:
Then we have the hash_pass() function. Takes two pointers to buffers (password and username) and XORs each byte of the password buffer the corresponding byte from the username buffer. The crucial property here is that the XOR operation will keep going until a nullbyte is encountered under password[i] index:
If a nullbyte is encountered under username[i] first, the rest of the password is XOR-ed with a hardcoded value of 0x44.
Then there's the lengthy load_pass() function, which simply reads the contents of the /home/lab6A/.pass file into the buffer pointed by the pointer passed as the only argument this function takes:
Now, this is how the main() function looks like:
It loads the local user password into the sercretpw buffer and hashes it with the hardcoded "lab6A" string (the target username). Then it calls the login_prompt() function, passing the original password size and the hash to it.
Then finally we have the login_prompt() function. It reads username and password to local buffers using strncpy() to only read maximum number of bytes up to the size of the current buffer to avoid overflow. Then it calls the hash_pass() function on the buffers. Then compares (memcmp()) the result with the password hash pointed by the pointer passed in the second login_prompt() argument, also making sure that it compares the exact number of bytes as it should (pwsize):
By the way, as the original version kept complaining about input arguments, before I read the usage comment, I simply modified it to make the 'remote' variant (hardcoded remote() method of interaction with hardcoded 127.0.0.1:6642): https://github.com/ewilded/MBE-snippets/blob/master/lab6B/solution.py. Either way, it works like a charm. Now let's find out how and why.
So, after sending the first set of credentials, the exploit is parsing the output from the application (p.recvline()) as a memory leak (individual byte ranges are saved in values with names corresponding to the names of local values stored on login_prompt()'s stack), right after encountering the "Authentication failed for user" string. This made me see the light and instantly revealed the first vulnerability - which by the way also makes the second vulnerability possible to exploit, but we'll get to that in due course.
The local readbuff buffer is 128 bytes-long. Both username and password are 32 bytes-long:
Now, what happens next is that fgets() reads a string from user input, saving it in the readbuff buffer. To make the user input saved in readbuff an actual string, fgets() will terminate it with a nullbyte. This means that if we provide, let's say, 60 characters of username, fgets() will make sure byte 61 is 0, so the string is terminated:
This itself is not an issue. However, what happens next is strncpy() blindly rewriting up to 32 bytes from readbuff to username.
The same goes for password.
This means that if we provide at least 32 bytes both as username and password, both 32-byte buffers, username + password, create a continuous 64-byte block of memory without a single nullbyte. Depending on the values stored next to it (in this case attempts and result, and anything that follows, the continuous non-null memory block can be longer - and printable.
Every time after hash comparison fails, the address of the username buffer is passed to a printf() call:
Provided with a pointer to the username buffer and the %s formatting modifier, printf() will keep printing memory starting at usernameand will only stop once it encounters a nullbyte on its way. Hence the memory leak necessary for us to obtain the information required to defeat ASLR (as we must provide the current, valid address of the login() function to EIP).
Running the app
Before we proceed any further, let's get the feel how all this data is aligned on the stack.
Let's put our first breakpoint here (betweeen strncpy() and hash_pass() calls):
Which would be this place in login_prompt() (at offset 278, right after the second strncpy() call is complete):
We can set a breakpoint on an offset, without first loading the program and using a full address, like below:
OK, run:
The breakpoint is hit let's have a look at the stack and identify what's what:
To confirm whether the value we think is the saved RET is in fact the saved RET, let's simply check the address of the next instruction after the login_prompt() call:
Yup. So we know how data is aligned on the stack when hash_pass() is about to be called.
Fair enough, let's create a second breakpoint - right after the hash_pass() call - to see how affects the values on the stack : break *(login_prompt+296)):
And once it's hit, we can see that the password (originally consisting of capital 'C's) was hashed with the username (capital 'B's), as well as were the two integer values (attempts and result) and stuff that follows them:
Even the trailing 0x80002f78 was changed to 0x80002e79 in result of the XOR operation. The XOR stopped on the nullbyte in 0x80002e79, leaving the 0x80 part intact.
At this point I got really worried about my understanding of the issue. How are we supposed to leak any memory layout information like the saved RET, saved EBP or anything revealing the current address base, if we encounter a nullbyte on our way earlier? We are always going to have nullbytes on our way with saved RET containing it due to the code segment base address containing such:
Then I noticed that the code segment has in fact a non-null base (just like the other maps) when we attach to an already running process instead of starting it from gdb (if you know the reason of this behavior please let me know).
As my goal was to figure out the exploitation myself and using Corb3nik's exploit for clues as last resort, I tried to develop the rest of the code myself, starting with this skeleton taken from his code:
Setting the pwlib's context.log_level variable to debug makes gives a great additional feedback channel during exploit troubleshooting and development.
Here's a sample run of this exploit skeleton (note the entire [DEBUG] output, the script itself does not print anything explicitly except for "The pid is: ..."):
By the way, because I wanted to attach gdb to the target process before inducing the out-of-bonds read (so I proceed from this point developing the exploit), I made it print out the PID and pause, waiting for a key to be pressed:
Console 1
This way we can conveniently attach to the process from a second console:
Console 2
Again, breakpoints:
And the stack (marked red saved RET, the address of the next instruction after login_prompt() call):
The second vuln
Now let's see how the stack changed after the first hash_password() call (breakpoint 2):
First, we have our username buffer (32 bytes of 0x42 value) intact. Then we have the password buffer. It's also 32 bytes, originally of 0xff value we sent in our payload... now turned into 0xbd.
The 32 bytes of password got XOR-ed with their corresponding username bytes. 0x42 XOR 0xff = 0xbd. So far so good.
But what happens next, when i becomes 32 and keeps incrementing, because no nullbyte was encountered under neither password[i] or username[i]?:
username[32] points at password[0], username[33] points at password[1] and so on. And password[32] points at result, password[33]points at attemptsand so on. XOR keeps XOR-ing.
Let's have a look at the two signed integer values (result and attempts), previously 0xffffffff and 0xfffffffe.Now they're 0x42424242 and 0x42424243, respectively:
So, how did their bytes turn from 0xff to 0x42? Had they been XOR-ed with 0x42 (username), they would now be nullbytes (which we don't want, by the way), because any value XOR-ed with itself becomes 0.
They were originally 0xff and became ox42 because they were XOR-ed with 0xbd (to check what was the value they were XOR-ed with, we can simply XOR the current value with the old value, 0x42 XOR 0xff = 0xbd):
So, the bytes that follow the password buffer (including the two integers, saved EBP and the saved RET) got XOR-ed with the contents of the password buffer... after the password buffer was XOR-ed with the username buffer.
And this is how we attained the second vulnerability - which, as we can see, allows us to change the saved RET!
Look again, the saved RET got changed as well (marked blue):
It's original value was 0xb77cdf7e, now it's 0x0ac162c3. Again, we can run simple test to see what was the value it got XOR-ed with:
Yup, it was 0xbd (username XOR password).
So, the second vulnerability is an out-of-bond XOR in the hash_function().
A XOR with a buffer that we control. So it is effectively an out-of-bond write (a XOR-chained stack-based buffer overflow).
And funnily, it has the same root cause, which is relying on whether or not a particular consecutive byte is null instead of using a maximum size boundary for write.
Understanding the exploitation process and implementing it
In order to trigger both the out-of-bonds read and out-of-bonds XOR, we must provide 32 non-null bytes of username and then 32 non-null bytes of password.
Also, no byte at username[i] can have its corresponding byte in password[i] equal to it (that would lead to the relevant password[i] becoming a nullbyte in result of the XOR operation, cutting us out from the further bytes on the stack).
This way the following things will happen:
1) password will get XOR-ed with username
2) the bytes on the stack following the just XOR-ed password buffer ( attempts, result, login_prompt() parameters, saved EBP and saved RET) will get XOR-ed with the new contents of the password buffer - which is, again, what we provide as password then XOR-ed with what we provide as username.
3) Since this authentication attempt will fail, the printf() call will print out everything starting from the username buffer through the XOR-ed password to the rest of the values on the stack XOR-ed with the XOR-ed password up until a nullbyte is encountered.
So we use the out-of-bound printf() to actually obtain, among others, the saved RET. All these values are XOR-ed with the result of the username XOR password operation.
At this point the program is in an incorrect state. The saved RET and saved EBP do not make sense. We will now how to trigger both vulnerabilities again with another authentication attempt, crafting the username and the password payloads in such a way that when the values on the stack (attempts and saved RET) are XOR -ed with the password buffer (which at that point will be the result of XOR between the username and the password we provide), they become the arbitrary values we WANT them to be.
Yes, in addition to the saved RET becoming the current address of the login() function, we also want to control the attempts value, so the while loop can end:
The login_prompt() function will not attempt to return until the loop ends. And the return call is how we gain execution control via saved RET overwrite.
What we need to do now is:
1) use the leaked values to calculate the login() address
2) craft the second username and password 32-byte payloads in such a way, that the current values on the stack (a copy of which we already got via the leak) - especially saved RET and attempts - once XOR-ed with the password buffer, become what we want them to be. Keeping in mind that the password buffer will first get XOR-ed with the username buffer, so we'll need to consider this order while preparing the payload.
All boils down to applying correct values and correct order of XOR-ing.
Let's start from the first payload again.
This time we'll use 'C' (0x43) as username and 0x11 as password:
Now, reading the values from the leak:
We know they are XOR-ed with 0x52, because 0x43 ('C', the username) XOR-ed with 0x11 produces 0x52. Again, these values can be arbitrary as long as they meet the conditions mentions above. And once they are picked, the following decoding and encoding will depend on these values.
We know that XOR-ing anything with the same value twice produces the same value back again. So:
0x43 XOR 0x11 = 0x52
0x52 XOR 0x11 = 0x43
Knowing that the hash_pass() encoded the stack variables with 0x52, we XOR them with 0x52 to make them make sense again:
OK, time for the second payload. This time we'll use 'D' (0x44) as username, only to emphasize that it can differ here.
Obtaining the offset of the login() function:
Calculate the current ASLR-ed address of the login() function by preserving 20 most significant bits from the original saved RET and adding the fixed offset 0xaf4 to it:
Now crafting the payloads for saved RET and attempts. We want such a value, which, when XOR-ed with currently messed up saved RET on the stack, will become the new_ret address. As we know the current value of the messed up saved RET (the xored_ret variable), we XOR it the new_ret and save it in new_ret_payload. When this value gets XOR-ed with xored_ret in one stack with a hash_pass() call, two XOR-s with xored_ret will make that value equal new_ret (this is why I titled it "madness"):
Now the attempts value. We decode it with the 0x52 key from the first attempt, increment it by one (to get past the last, third iteration of the while loop instead of having to perform another dummy authentication attempt) and encode it back :
Now, one last layer of encoding. Before sending, we need to XOR everything with the username value we chose for the second attempt, so the hash_pass() call XOR-ing the password with it will reverse this process, making those values ready to be XOR-ed against the rest of the stack:
And lastly, we assemble the payload, fill it up to 32-bytes with some arbitrary character (e.g. 'E') and send it:
And here we go. Triggering the leak and the first out-of-bonds XOR:
Receiving the leak:
Sending the second authentication attempt payload:
And we're done:
The full source code with comments can be found here:
Some time ago I came across RPISEC's free Modern Binary Exploitation course (https://github.com/RPISEC/MBE) which I can't recommend enough. You get lectures, challenges and a ready out-of-the-box operational Ubuntu VM to play with. Yup, this course is Linux-focused, which made it a great extension to my recently passed OSCE (which is, or at least was at the time, Windows-only). After completing only about 16, maybe 17 challenges (there are ten chapters, 3 challenges each => 30 + 2 additional challenges with no source code provided) I can conclude I learned comparably as much as doing my OSCE, but quite different knowledge (again, different OS and also different techniques), which again is great. And finally got myself together to put some of my notes out here. If you don't feel like doing but would like to get the feel, this is a read for you.
The target program is usually a setuid binary, running with its owner's effective uid. If we can execute arbitrary code, we steal the flag which is always located in /home/<USER>/.pass (which is a clear text unix password for that user account), whereas <USER> corresponds to the current target level. E.g. lab6C is the start user for the level 6, lab6B is the target user, hence /levels/lab06/lab6C is a setuid binary owned by lab6B so we obtain the pass and therefore can advance to the next level. Please refer to RPISEC's github page to find all info, including credentials, slides, resources and so on.
This is how the program behaves when we're not trying to abuse it (it does not really send our 'tweet' anywhere, just internal buffer operations):
Now, spoiler alert, first a quick glance at the source code to see where the vulnerability is.
First, there are some self-explanatory definitions:
Then it gets more interesting:
We have a secret_backdoor() function which simply reads up to 128-byte string from the standard input and then performs the libc system() wrapper on the exec() syscall (with a fork() and sh). The function is not explicitly called anywhere from the code, so it's clear we are not going to need a shellcode here; it's all about redirecting the execution to this function.
Now, to the vulnerability. We have several functions calling each other, so let's go through them in the order of the call sequence.
First, we have a standard main() function:
And here is the handle_tweet() function:
So, a local instance of the savestate structure (which was declared in the beginning of the file) is defined here, locally, on the stack.
username and msglen fields are initialized, then there are two two calls; set_username() and set_tweet(), respectively. Both calls take a pointer to the save instance of the savestate structure (so the pointer will point at the handle_tweet() function's stack). And this is the stack we are about to overflow (we'll get to how in a minute) to redirect the execution flow, overwriting handle_tweet's saved RET pointing back to main (the next instruction after the handle_tweet() call, which is just a return EXIT_SUCCESS;.
To illustrate, this is a simplified stack layout while inside of the handle_tweet() function, after the local struct was defined, but before the two set_username() and set_tweet() calls:
We will overwrite the save.tweet buffer outside its 140 bytes and write down over the username, msglen and then the saved RET.
Once the handle_tweet() function call returns, instead of going back to the last instruction of main(), the execution flow will go to our secret_backdoor() function.
So, the overflow must be possible in one of the two set_username(), set_tweet() functions. They both take a pointer to that buffer, so they can operate on it.
Let's see the set_username() function then:
Looks OK at the first glance. The devil's in the details (line 75):
for(i = 0; i <= 40 && readbuf[i]; i++) // this is where the problem starts
    save->username[i] = readbuf[i]; //write
The <= conditionaloperator (instead of just <) is the culprit here. Instead of being able to write up to 40 bytes of the username, we can write 41. One byte more - which is enough to overwrite the previously initialized value of 140.
So once the set_username() call returns, the username is set, while the msglen is set to an arbitrary value that we will smuggle in the additional 41-th byte provided as the username.
This is how the second function, set_tweet(), looks like:
So the function has a quite big (1024 bytes, even too big for our needs) local buffer. To keep the big picture clear, this is how the stack will look like inside the set_tweet() function call, after calling fgets(), but before calling strncpy():
And this is where the buffer overflow that will allow us to overwrite the bottom saved RET occurs (lab6C.c:59):
strncpy(save->tweet, readbuf, save->msglen);
If we provide an arbitrary one-byte integer value higher than 140 in the 41-st byte of the username, we'll then be able to write more than 140 bytes from the 1024-byte local buffer, starting at the savestate.tweet address, up until the saved RET to overwrite with the address of the secret_backdoor() function.
Controlling the message length
Let's start simple and crash the program.
As at the time I started this I did not know a better way to provide arbitrary (non-printable) input using standard input/output without actual coding, here is how I was doing it (using two console windows simultaneously):
1) in one console window, I touched a file to use as an input buffer: /tmp/input6C
2) in the second window, I ran the following to have the program read all the input from that file as it appears:
gdb /levels/lab06/lab6C
[... once gdb loaded ....]
run < `tail -f /tmp/input6C`
In the first window I could then play with the printf command, putting arbitrary bytes into the /tmp/input6C, so they would go to the standard input of the target process.
We know we would need at least 140 + 40 + 8 bytes to overwrite the saved RET. Should actually be more, considering saved EBPs (stack frames) and function arguments. Something around 200. To find out how many bytes exactly do I need to overwrite to control the EIP, I used pattern_create output (some folks prefer to use the one provided with metasploit, I use one of the python implementations that can be found on github).
Already knowing that the 41-st byte of the first input line is the integer controlling the message length, I knew the username should look like this:
AAAAAAAAAAAAAAAAAAAAAAAAAAAAAAAAAAAAAAAA\0xff
We set the new message length to maximum value possible 0xff (255), to make sure we overwrite the saved RET without caring what else do we overwrite.
The next line should be the pattern_create output, so here goes (this is actually pattern_create 400 output):
So yeah, the saved RET was overwritten, as set_tweet() read whole 400 bytes of the pattern written to the readbuf, while msglen set to 255 made strncpy() copy 255 bytes from it to the save.tweet buffer, overwriting everything the entire save structure and the saved RET below it as illustrated on the diagram above.
0x67413567 in ?? () means this is what we wrote to the saved RET, and, in consequence, what went to the EIP register. The program crashed (segmentation fault), as this is not a valid address in its virtual address space). It's a unique 4-character sequence from the 400-byte pattern string we used.
To see what is the exact number of bytes between the beginning of our controlled buffer and the saved RET we run the pattern_offset tool (comes along with pattern_create) with it as argument, so it calculates this for us:
For starters, to make this process simpler, we are going to develop this exploit with ASLR disabled. Once we think the exploit's ready, we turn ASLR back on (use the gameadmin:gameadmin credentials to get sudo su on the VM):
OK, let's peek where the secret_backdoor() function is (from attached gdb):
gdb-peda$ p secret_backdoor $1 = {<text variable, no debug info>} 0x8000072b <secret_backdoor>
So, after our 196 bytes of garbage, we should put 0x8000072b into our buffer to move the execution to the secret_backdoor() function (and then the last thing would be to provide a command to execute).
We can already say using this address won't work because it contains a nullbyte (doesn't go well with string-operating functions like fgets()).
Also, we know this address will be randomized with ASLR on, so using a fixed address won't do. Without leaking the memory layout somehow and calculating the address based on known offsets, we could either bruteforce (just keep running the exploit until our hardcoded address happens to be the correct one... this is just a 4-byte address as we're dealing with 32-bits, which is bad enough, while with x64 the likelihood is practically never)... Or perhaps perform so called partial overwrite instead.
Partial overwrites
ASLR only partially randomizes virtual addresses - which means only some of the bytes (the more significant ones, 'on the left') are hard to predict, while the least significant bytes (the ones 'on the right') - which are just the offsets within the code segment and are known to us as long as we can read the binary - stay untouched.
For example, 0x8000072b under ASLR becomes 0xbf76072b.
So, the OS does partial ASLR on the more significant bytes, leaving the least significant bytes alone. Thus, to keep things fair, we do a partial overwrite too, but on the least significant bytes (so we only overwrite one or two bytes instead of all 4), while leaving the two more significant bytes alone, because they already have the proper valid values set by the OS and we don't need to know them at all to attain a valid ASLR-ed address (as long as we're redirecting the execution to an instruction in the same text segment).
Of course partial overwrites are not always possible. In this case, we can use 196 bytes of garbage + 2 bytes of arbitrary offset within the code segment to change the saved RET to the address of secret_backdoor().
Moving on with the exploit
So, our exploit is (we're still playing without ASLR yet):
Legend: code, data, rodata, value Stopped reason: SIGSEGV 0x000a072b in ?? ()
Interestingly, the newline character got copied in. Also, for some reason, the next character was nullified, just like the entire string was copied instead of just 198 bytes we wanted.
Oh right. This is because we're still overwriting the msglen with the maximum possible value of 255 (0xff). Instead, we should use 0xc6 (198).
Ironically, before I realized this little mistake, a managed to search for existing solutions to peek from in case I got stuck and found this amazing repository:
So I looked at the lab6C solution only to discover that it is using pwnlib (true awesomeness, making exploit dev much easier and allowing me to ditch the retarded tail -f thing :D).
After carefully analysing the code I decided to just give it a go, but from the very beginning I knew something wasn't right (line 12):
The payload sent to the program as the 'tweet' content consists of 196 bytes (49 dwords) + a dword -> 200 dwords. So, the last dword 0xb775d72b does not seem to be a partial overwrite, but a full overwrite with a fixed address instead.
The only explanation I thought of was that the author left the PoC with a fixed value of secret_backdoor() function from the non-ASLR version of the exploit - or extracted the information about the memory layout from somewhere else and calculated the address with ASLR on. Anyway, I knew it would not work on my VM and guess what - it in fact didn't :D
So I decided to take corb3nik's solution code as a template and modify it so I could attach to the running process with gdb once its PID is known and then see exactly what's going on:
Setting the context.log_level variable to = 'debug' showed the real awesomeness of pwnlib, displaying all the input/output exchanged with the app in hex, revealing all the non-printable characters along with how many bytes were received/sent. Very, very helpful.
And did not want to work once I switched ASLR back on.
So I ran the debugger again, only to see that the text segment addresses changed from non-ASLR 0x80000XXX to ASLR-ed 0xb77YYXXX (whereas XXX is the Relative Virtual Address - the fixed offset within the segment, while YY is the only really randomized part).
For example, secret_backdoor() had, depending on the instance, values like:
`0xb775e72b` `0xb773a72b` `0xb77dd72b`
So e != a (the '7' halfbyte remains unaffected) and we can't do partial half-byte writes... Which in this case can be simply and non-elegantly solved with a small bruteforce. Just stick to any fixed second least-significant byte value you see in gdb, in my case such as 'a7', 'e7', '17' and so on. Statistically one in 16 attempts should work, in my case the result was more like one in 8), which in this case (a local console app) is acceptable - it just has to be kept in mind this exploit is not 100% reliable (https://github.com/ewilded/MBE-snippets/blob/master/lab6C/ex_attempt2_aslr.py).
The purpose of writing this up was only to present a little trick I came up with while playing with vulnserver's (http://www.thegreycorner.com/2010/12/introducing-vulnserver.html) KSTET command (one of many protocol commands vulnerable to some sort of memory corruption bug). In spite of the hardcoded addresses, 32-bitness and general lazyness, this technique should as well work in more modern conditions.
After hijacking EIP it turned out there was too little space, both above and below the overwritten saved RET, to store an actual windows shellcode (at least 250 bytes or more) that could run a reverse shell, create a user or run an executable from a publicly accessible SMB share.
Also, it did not seem to be possible to split the exploitation into two phases and first deliver the shellcode somewhere else into memory and then only use an egghunter (70 bytes to store the payload, enough for a 31-byte egghunter, not enough for the second-stage shellcode)... so I got inspired by a xpn's solution to the ROP primer level 0 (https://blog.xpnsec.com/rop-primer-level-0/) where the final shellcode was read onto the stack from stdin by calling read().
Having only about 70 bytes of space, I decided to locate the current server socket descriptor and call recv on it, reading the final stage shellcode onto the stack and then execute it. This write up describes this process in detail.
Controlling the execution
Below is the initial skeleton of a typical exploit for such an overflow. We control 70 bytes above the saved RET, then the saved RET itself ("AAAA"). Then we stuff 500 bytes of trash, where in the final version we'd like to put our shellcode, so we could easily jump to it by overwriting the saved RET with an address of a "JMP ESP" instruction (or something along these lines):
Once the crash occurs, we can see that we only control first 20 bytes after the saved RET, the rest of the payload is ignored:
So, we're going to use the first 20 bytes below the saved RET as our first stage shellcode, only to jump to the 70 bytes above the saved RET, which will be our second stage. The second stage, in turn, will download the final (third) stage shellcode and execute it.
First, we search for a "JMP ESP" instruction so we can jump to the first stage.
A convenient way to do so is to use mona, searching for the JMP ESP opcode:
!mona find -s "\xff\xe4"
We pick an address that does not contain NULL characters, preferably from a module that is using the least number of safety features as possible (essfunc.dll is a perfect candidate):
The addresses will most likely differ on your system.
0x625011af will be used for the rest of this proof of concept.
We toggle a breakpoint at it, so we can easily proceed from here in developing the further stages of the shellcode:
Now our PoC looks as follows (we used 20 NOPs as a holder for the first stage):
We run the PoC and hit the breakpoint:
Once we do a step (F7), we can see the execution flow is redirected to the 20-byte NOP space, where our first stage will be located (so far, so good).
At the top we can see the second stage buffer, at bottom we can see the first stage buffer. In between there is the overwritten RET pointer, currently pointing to the JMP ESP instruction that lead us here:
First stage shellcode
We want our first stage shellcode to jump to the start of the second stage shellcode (there is not much more we can do at this point on the only 20 bytes we control).
As we know EIP is equal to our ESP, as we just did a JMP ESP, we don't need to retrieve the current EIP in order to change it. Instead, we simply copy our current ESP to a register of choice, subtract 70 bytes from it and perform a JMP to it:
PUSH ESP ; we PUSH the stack pointer to the stack POP EDX ; we pop it back from the stack to EDX SUB EDX,46 ; we subtract 70 from it, pointing at the beginning of the buffer for the second stage shellcode JMP EDX ; we JMP to it
OllyDbg/Immunity Debugger allow assembling instructions inline while debugging (just hit space to edit), which is very handy in converting our assembly to opcode without the need of using additional tools like nasmshell or nasm itself:
So, our second stage is simply
\x54\x5A\x83\xEA\x46\xFF\xE2
Also, for the time of development, for our convenience, we can prepend it with an inline breakpoint \xCC instruction, as Immunity loses the breakpoint set on the initial JMP ESP with every restart. Just remember to remove the \xCC/replace it with a NOP in the final exploit, otherwise it will cause an unhandled exception leading to a crash!
At this stage, our POC looks as follows (NOPs in the first stage were only added for visibility, they won't ever get executed). Also, the holder for the second stage was filled with NOPs as well:
As we can see, the first stage does its job, moving the execution flow to the second stage:
Second stage shellcode
Now, this is where the fun begins. As mentioned before, we want to use the existing server application's socket descriptor and call WS2_32.recv on it, so we can read as much data from it as we want, writing it to a location we want and then jump to it - or even better, write it to a suitable location so the execution flow slides to it naturally.
First, we find the place in code where the original WS2_32.recv is issued, so we can see how that takes place (e.g. what is its address and how arguments are passed, where to find them and so on).
Luckily, the section is not far away from the executable's entry point (the first instruction program executes, also the first instruction we are at once we start it in the debugger):
As we scroll down we can see we are getting somewhere:
And here we go:
We toggle a breakpoint, restart the application, make a new client connection and send something to the server. The breakpoint is hit and we can see the stack:
Also (an Immunity/OllyDbg tip); if we hit space on the actual CALL instruction where our current breakpoint is, we can see the actual address of the instruction called (we will need this later):
Now we can compare the current stack pointer at the time of our execution hijack with the one recorded while the orignal WS2_32.recv was done. We are hoping to estimate the offset between the current stack pointer and the location of the socket descriptor, so we culd use it again in our third stage.
As it turns out, the stack we are currently using points to the same location, which means the copy of the socket descriptor identifier used by the original recv() has been overwritten with further stack operations and the overflow itself:
Hoping to find a copy of it, we search the stack for its current value.
Right click on the CPU window - which represents the stack at the moment -> search for -> binary string -> 00 00 00 58 (the identifier of the socket at the time of developing, but we don't want to hardcode it as it would normally differ between systems and instances, hence the hassle to retrieve it dynamically).
We find another copy on the stack (00F2F969):
We calculate the offset between the location of the socket descriptor id copy and the current stack pointer at the time our second stage shellcode starts (119 DEC). This way we'll be able to dynamically retrieve the ID in our second stage shellcode.
Also, there is one more problem we need to solve. Once we start executing our second stage, our EIP is slightly lower than the current ESP.
As the execution proceeds, the EIP will keep going towards upper values, while the ESP is expected to keep going towards lower values (here comes the Paint):
Also, we want to write the final stage shellcode on the stack, right below the second stage, so the execution goes directly to it, without the need to jump, as illustrated below:
Hence, once we have all the info needed to call WS2_32.recv(), we'll need to move the stack pointer above the current area of operation (by subtracting from it) to avoid any interference with the shellcode stage instructions:
So, the shellcode goes like this:
PUSH ESP POP ECX ; we simply copy ESP to ECX, so we can make the calculation needed to fetch the socket descriptor id SUB CL,74 ; SUB 119 (DEC) from CL - now ECX points at the socket descriptor ID, which is what we need to pass to WS2_32.recv SUB ESP,50 ; We have to move the current stack pointer above the second stage shellcode (above the current EIP), otherwise we would make it cripple itself with any stack operations performed by WS2_32.recv we are going to call, also this way we will avoid any collision with the buffer we are going to use for our final stage shellcode. From this point we don't have to worry about it anymore. XOR EDX,EDX ; zero EDX (the flags argument for recv), PUSH EDX ; we push our first argument to the stack, as arguments are passed via stack here ADD DH,2 ; now we we turn EDX into 512 by adding 2 to DH PUSH EDX ; we push it to the stack (BufSize, the second argument)
; retrieve the current value of ESP to EBX PUSH ESP POP EBX
; increment it by 0x50 (this value was adjusted manually after experimentig a bit), so it points slightly below our current EIP ADD EBX,50 ; this is the beginning of the buffer where the third stage will be written PUSH EBX ; push the pointer to the buffer on the stack (third argument)
; now, the last argument - the socket descriptor - we push the value pointed by ECX to the stack: PUSH DWORD PTR DS:[ECX]
So, we are almost done.
Now we have to call the WS2_32.recv() function the same way the original server logic does. We take the address used by the original CALL instruction (0040252C - as it was emphasized we would need it later).
The problem we need to deal with is the fact the address starts with a NULL byte - which we cannot use in our shellcode.
So, to get round this, we are going to use a slightly modified version of it, e.g. 40252C11, and then perform a shift 8 bits to the right. This way the least significant byte will vanish, while a null byte becomes the new most significant byte (SHR(40252C11) => 0040252C):
MOV EAX,40252C11 SHR EAX,8 CALL EAX
Our full PoC looks as follows:
The stack during the execution of the second stage right before the third stage is delivered:
The stack right after the return from WS2_32.recv():
Yup, full of garbage we control:
Now we can replace the 500 "\xCC" with our favorite shellcode.
Today during RSA Conference, the National Security Agency release their much hyped Ghidra reverse engineering toolkit. Described as “A software reverse engineering (SRE) suite of
More than a year ago, I developed a local privilege escalation exploit for a product (that I cannot disclose unfortunately) in which I had to bypass ASLR.
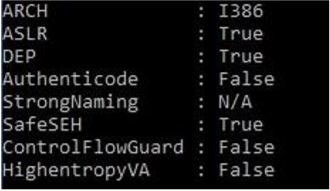
For the record, these are the protections enabled in the targeted service's binary, it is a 32-bit executable running under Wow64 on 64-bit systems.
Basically, I was able to communicate through IPC with the system service and tell it to execute a function in its address space by pointer (it's a bit more tricky than this but you get the point). Actually, this would have been impossible if CFG was enabled.
Within the main module, I have located a function that invokes "system()" with an argument that I control. At this point, it was just a matter of bypassing ASLR in order to get that function's address and elevate privileges on the machine. However, I couldn't trigger any leaks through the IPC channel to get or deduce the main module's base.
But as luck would have it, the service exposed some other functionalities through IPC and one of them was the ability to call VirtualProtectEx and letting us supply a PID, the address, the size, and the new protection. The service was also kind enough to return the old protection of the region to our process via IPC.
Bypassing ASLR should be obvious by now knowing these two crucial points :
The function that we want to invoke resides in the main module.
On Windows the main executable's module of a process is the first module, with the lowest address in the user address space.
It is now only a matter of writing code to communicate with the service and to brute-force the location of the main module; we do that by looking for the first executable page in the address space and then calculating the main module's base : generally by subtracting 0x1000 from that page since the .text section is the first section.
The pseudo-code below shows an example of how this was done :
Launching a new process with SYSTEM privileges was easy at this point.
As I am spending slices of my time refreshing some Malware Analysis theory, I thought was valuable (at least to my future amnesiac self) writing down a simple ‘custom base64 alphabet translator.’ This can/should be extended to support CLI/WebApp i ntegration. So, here is the skeleton:
UPDATE: added interactive mode below and also found this great tool which is already doing what I aimed for and much more.
import string import base64 # custom encoding function def EncodeCustomBase64(stringToBeEncoded,custom_b64): standard_b64 = 'ABCDEFGHIJKLMNOPQRSTUVWXYZabcdefghijklmnopqrstuvwxyz0123456789+/=' encoded = base64.
Hide and Seek (HNS) is a malicious worm which mainly infects Linux based IoT devices and routers. The malware spreads via bruteforcing SSH/Telnet credentials, as
Hot on the heels of the latest post, I have decided to port to linux another lab example from Intermediate x86 class.
This time I will talk about the RedPill paper by Joanna Rutkowska.
This test is expected to work on single-core CPUs only
The main purpose of this test code is to call the SIDT instruction and save its return value inside an array: this value will tell us whether we are running it inside a vm or not.
I was about to finish the Intermediate x86 class from OpenSecTraining, when I thought was worthwhile porting to Linux this interesting exercise about software breakpoints.
Whenever we send a software breakpoint on GDB or any other debugger, the debugger swaps the first instruction byte with the double C (0xCC) instruction and keeps track of each and every breakpoint/replaced-instruction via the breakpoint table and thus, leaving the code section of the executable altered.
Something that once was done with heavy and expensive serial cables, can now be achieved in a matter of seconds through virtual machines. I am of course speaking about kernel debugging, what else? Recently I have been following the exceptionally great Intermediate x86 training lead by Xeno Kovah where, in order to keep up with the labs, I had to setup a WinXP-to-WinXP kernel debugging setup. So after a few moments of bewilderment I reached a full working environment with the following steps.
Flare-on was a blast this year ! All challenges were great but I enjoyed solving the last one the most, although it was somewhat frustrating.
Due to my tight schedule, I won't go over all the details involved in solving the challenge. But I'll do my best to paint a complete picture of what's going on and how I approached the problem.
We start we a floppy disk image that you can download from here (PW : infected) :
When we boot the floppy using bochs, we see that it automatically executes infohelp.exe that asks us for a password.
Entering an arbitrary password, the message "Welcome to FLARE..." prints slowly on the screen and the password checks are performed.
What I did after this, is I mounted the floppy on my Ubuntu virtual machine and extracted the files in bold.
Both key.dat and message.dat contain nothing interesting. However, TMP.DAT appeared to contain the welcome message we see after typing the password and some funny strings like : "NICK RULES" and "BE SURE TO DRINK YOUR OVALTINE".
What I did next is I threw infohelp.exe into IDA to examine its behavior. To my surprise, I found that it does nothing but writes the supplied password to key.dat and then reads the contents of message.dat and prints them to the screen.
Here I thought that there should be some hooks involved that redirect execution to somewhere else when message.dat is opened or read. To confirm my suspicions, I executed the "type" command on message.dat; Lo and behold, the password check is performed.
Next, I opened TMP.DAT in IDA and found that it contains some code that seems to be our hook. So I attached IDA to bochs and started debugging.
To locate the hook within memory, I took advantage of the fact that the message is printed in a slow fashion so what I did is pause execution while stuff was still printing. I found myself in a loop implementing the subleq VM.
The caller supplies a pointer to the bytecode, its size, and the offset to the instruction where execution should start.
Each instruction is 6 bytes and has the following format :
struct inst {
WORD src_index;
WORD dest_index;
WORD branch_index;
};
The type of the subleq bytecode array is WORD*, so the VM views that its instruction size is 3 while it is 6 actually. This realization comes in handy when building an IDA processor module for the subleq.
As I did with last year's binary, I re-implemented the subleq VM with C to output each executed instruction to a file. However, I had an impossible-to-analyze file with over 1 GB. So what I did, is only print the subleq for the instructions that perform the password checks; That way I had a 30 MB-ish file that I could examine looking for patterns.
The way I had the emulated instructions printed was the following :
IP : sub [dest_index], [src_index] ; subtraction = result
The only thing that was visible on the fly is that the subleq starts by doing some initialization in the beginning and then enters a loop that keeps executing until the end. Here where suspicions of a second VM started to arise in my mind (OMG !).
I tried to locate the password characters inside the subleq and tried to figure out what operations were done on them but it was not clear at all.
I also did some text diffing between iterations and saw that the code was modifying itself. In these instances, the self-modification was done in order to dereference VM pointers and use their values as indexes in subsequent operations.
So, what I decided to do here is write a very minimal processor module that would allow me to view the subleq in a neat graph.
The file I extracted contains bytecode starting from IP : 0x5. So here's how you load it into IDA :
- Choose the subleq bytecode processor module and make sure to disable auto-analysis. It ruins everything when enabled.
- Change the ROM start address to 0xA and the input file loading address to the same : 0x5 * sizeof(WORD) == 0xA.
The bytecode will be loaded without being analyzed.
- Press 'P' at 0xA to convert into code and automatically into a function. You should have a beautiful graph as a result.
Well, it is not quite as beautiful as you might think, since we still have to deal with self-modifying code (knowing what exactly is modified) and also understanding the code as a whole.
It is quite hard to understand what subleq does by only reading "subleq" instructions, so the next thing that came to mind is to convert the subleq to MOV and ADD instructions without wasting too much time.
IDAPYTHON TO THE RESCUE !
I wrote a minimal script that looks for ADD and MOV patterns in the subleq and comments these instructions. First of all, the script intentionally skips the instructions that will be self-modified and doesn't comment the SUB since it's already there.
And the result was this :
More understandable ... still, not so much.
So what I did next is decompile this manually into C and then simplify the code.
So it is indeed another VM interpreted by the subleq. The nature of the VM was unknown to me until later when someone told me that it was RSSB. But I was able, however, to solve the challenge without needing that information.
Now, this RSSB VM executes bytecode that starts at offset 0xFEC from the start of the subleq or at offset 0x1250 of the TMP.DAT file.
If you dumped the bytecode from memory as I did, you'd find that the password you typed was written inside the RSSB VM at offset 0x21C (circled in red).
So far so good. I copied the whole RSSB bytecode and added it as an array and modified the C emulator code to print the "sub" instructions while executing the VM; the same way I did with the subleq.
The result looked like this :
IP : p[dest_index], ACCUM ; operation
Reading the code, I found out that a sum is calculated for the characters in the password. In addition to that, the number of characters in the password must be 64. I knew that by examining a variable that gets decremented from 64 at each iteration of the sum calculation.
For information, the sum is stored at : p[0b47].
So I patched the memory to store a 64 byte string and then I looked up where the first character of the input was read apart from where the sum was calculated. I performed a search for [010e] ( 0x21C / 2 == 0x010E).
65 in dec == 0x41 in hex
Long story short, the algorithm works in a loop, in each iteration two characters of the password are used to calculate a value. The sum of all characters is then added to that value as shown in the figure below (sum : in red, value : in green).
A few instructions later, a hardcoded value at [0a79] is subtracted from the resulting value of the previous operation.
We can see that the resulting value of the next two characters for example is compared against the next hardcoded value at [0a7a] and so on until the 30th character.
So, we have a password of 64 bytes but from which only the first 30 bytes are checked !
Let's leave that aside for now and ask : what makes a check correct ? Maybe the result of the subtraction must be zero ?
I quickly added a check onto my C emulator that did the following :
res = ptr[op_addr] - ptr[1];
if ( ptr[0] == 0x203d ) //IP of the check, see figure above { res = 0; }
This will simply patch the result to zero in the check at 0x203d. I ran the program and it showed that the password was correct, so I knew I was on the right path.
I also observed (based on a single test case) that in each iteration the calculated value depends on the position of the two characters. So even if we have the same two characters at different places the calculated value will be different.
Solution : Here I am going to describe how I solved the challenge during the CTF. Surely this is not the best solution out there, but I'd like to show my line of thought and how I came to solve this level.
We know that the same sum is used in all the operations, and that there can be only one sum (or a handful as we'll get to see later) that will satisfy all the checks.
We can run a bruteforce attack where we let the VM calculate the value for two given characters (by patching the characters at run-time) then run the check on all possible sums (by patching the sum at run-time too). The first check will give us a lot of sums that we'll use to bruteforce the second check. In its turn, this check will filter out invalid sums that we'll eliminate from the third check and so on until we do all 15 of them. (30 characters / 2 characters per check == 15 checks).
At the end, we'll get the valid sums from which we can easily deduce the characters that generated them in each check.
The problem I had with this approach was performance. For each combination of two characters, and for each sum, I was running the VM all over again which, if I left like that, would take a huge amount of time : printing the welcome message, calculating the sum for junk characters ... over and over again each time !
What I ended up doing is "snapshotting" the VM in multiple states.
Snapshot 1 : Where the first character of the two is read (depending on the iteration we're in).
Snapshot 2 : For each two characters, take a snapshot after the value that depends on both of them is calculated and right at the address where the sum is read and added to the calculated value (IP == 0x1ff7).
The optimization here is that we execute what we only need to execute and nothing more. We patch the two characters by the ones we're currently bruteforcing at Snapshot 1 and then after the value is calculated for those two we take Snapshot 2 and we only get to patch the sum. When each iteration is over, we re-initialize the snapshots to their original states.
Here's the overall algorithm involved in pseudo-code (this is not C nor anything close) :
sums [xxx] = {...};
new_sums [yyy] = {0};
for ( i = 0; i < 15; i++)
{
memcpy(initial_state_tmp, initial_state);
snapshot_1 = take_snapshot_1(initial_state_tmp, i); //i is passed to go to the corresponding check
//Execute the subtraction check and return a boolean if ( execute_check(snapshot_2_tmp) )
{
append(new_sums, sum); //valid sum, append it
}
}
}
}
sums = new_sums;
new_sums = [0];
}
print sums;
At the end we'll get the valid sums that resulted in the check being equal to 0.
Here's the full C script implementing this (a bit messy) :
After the 15 checks are done, the script gives us files containing the valid sums that passed each of the checks. We're only interested in the last file (4KB in size) highlighted below :
Contents of array_14
I actually forgot to include the characters that generated the sum for each check. And I had to do it separately.
This requires some modifications of the code above : we initialize the sums array with the contents of array_14 and for each sum bruteforce the two characters that pass each check. To optimize, I listed the first four characters (two first checks) for each one of these sums.
And one of them was particularly interesting. The sum 0xd15e resulted in these four characters "Av0c".
Running the same script for this single sum while bruteforcing all of the characters gives us the flag :
Flag : [email protected] Well in the end, this one really deserved being the 12th, it was time consuming, frustrating and above all FUN ! Thanks for bearing with me and until another time guys - take care :)
In this challenge we're given an x64 ELF binary. The program acts as a userspace host for KVM virtualization. Among other things, it sets up the VM's address space, initializes the necessary VM registers, copies the code from the ".payload" section to it, then finally runs it.
Additionally, the userspace host expects the VM to trap when executing the three illegal instructions : IN, OUT, and HLT as shown below. The host will do some processing and then fix the VM's state so it can graciously continue executing.
And here is an instance of a HLT instruction within the VM's code.
Let's now describe the behavior of the host for each illegal instruction.
IN (port 0xE9) : Reads a single character from STDIN and returns it to the VM (The first thing that the VM does is read user input from STDIN).
OUT (port 0xE9) : Outputs a single character to STDOUT.
HLT : Before the VM executes a HLT instruction, it moves a special value into EAX. After it traps, our host reads this value and uses it as a key in an array. Each key corresponds to a handler routine within the VM's address space.
What the host does then is set VM's RIP register to the corresponding handler.
And by examining the handlers, we see that they invoke each other using the HLT instruction.
Now, let's try to examine what the VM does and figure out what these handlers are used for.
Briefly, 0x2800 bytes are read from STDIN and for each of these bytes sub_1E0 is called. The first time it's called, this function takes the user-supplied character and the address 0x1300 which points to some data.
sub_1E0 initializes local variables and then branches to the handler at 0x32c.
This one examines the dereferenced value, if it is 0xFF it branches to the handler at 0x347, if not it branches to a handler that compares the dereferenced value with the user-supplied character.
Now, examining the handler at 0x347 and the handlers it invokes (see the screenshot below : renamed sub_1E0 to traverse_tree), we see that the address 0x1300 is a root node of a binary tree.
In the tree at 0x1300, parent nodes have 0xFF as a value and contain two pointers for the left & right children. A leaf node, contains an ASCII character as a value which we suspect constitutes our flag. Recall that when a leaf is encountered a comparison is made with the user-supplied character and a boolean value is returned (RET instruction).
In the screenshot below, we see that the tree is recursively traversed and when a leaf is encountered and the comparison is successful sub_172 is called as we return from the functions recursively called.
When we traverse a left node, sub_172 is called with 0 whereas when we traverse a right node 1 is passed.
What this function does is build an array of bits starting at 0x1320 in the following manner :
BYTE* bits = 0x1320; BYTE count = 0;
void sub_172( BYTE bit ) { *bits |= bit << count++; if ( count == 8 ) { count = 0; bits++; } } This way, the bit array will represent the path traversed from the leaves to the root for all characters.
When this is done for all input characters, the resulting bit array is compared against the bit array for the correct input at 0x580. So, what we have to do is this :
Extract the correct bit array from 0x580 as bytes.
Reverse the order of the bytes and then convert them to binary representation. We reverse the order because we want to traverse the tree from root to leaf, doing the opposite would be impossible since all bits are concatenated. Also, when doing this, we'll start by extracting the last character and so on until we reach the first.
Below is the IDA Python script that you should run on the extracted ".payload" section to get the flag :
As a result, we get the flag and we see that the VM was expecting a tar file as input:
flag.txt0000664000175000017500000000007113346340766011602 0ustar toshitoshiflag{who would win? 100 ctf teams or 1 obfuscat3d boi?}
Thank you for reading :)
You can follow me on Twitter : here
The purpose of this post is to highlight many of the frustrations I’ve had with Device Guard (rebranded as Windows Defender Application Control) and to discuss why I think it is not an ideal solution for most enterprise scenarios at scale. I’ve spent several years now at this point promoting its use, making it as approachable as possible for people to adopt but from my perspective, I’m not seeing it being openly embraced either within the greater community or by Microsoft (from a public evangelism perspective). Why is that? Hopefully, by calling out the negative experiences I’ve had with it, we might be able to shed a light on what improvements can be made, whether or not further investments should be made in Device Guard, or if application whitelisting is even really feasible in Windows (in its current architecture) for the majority of customer use cases.
In an attempt to prove that I’m not just here to complain for the sake of complaining, here is a non-exhaustive list of blog posts and conference presentations I’ve given promoting Device Guard as a solution:
For me, the appeal of Device Guard (and application whitelisting in general) was and remains as follows: Every… single… malware report I read whether its vanilla crimeware, red team/pentester tools, or nation-state malware has at least one component of their attack chain that would have been blocked and subsequently logged with a robust application whitelisting policy enforced. The idea that a technology could not only prevent, but also supply indications and warnings of well-funded nation-state attacks is extremely enticing. In practice however, at scale (and even on single systems to a lesser extent), both the implementation of Device Guard and the overall ability of the OS to enforce code integrity (particularly in user mode) begin to fall apart.
The Airing of Grievances
Based on my extensive experience working with Device Guard (which includes regularly subverting it), here is what I see as its shortcomings:
An application whitelisting solution that does not supply the ability to create temporary exemptions is unlikely to be a viable solution in the enterprise. This point becomes clear when you consider the following scenario: A new, prospective or current client asks you to join their teleconferencing solution with 30 minutes notice. Telling them that you cannot join because your enforced security solution won’t permit it is simply an unacceptable answer. Some 3rd party whitelisting solutions do permit temporary, quick exceptions to policy and audit accordingly. As a Device Guard expert myself, even if every component of a software package is consistently signed using the same code signing certificate (which is extremely rare), even I wouldn’t be able to build signer rules, update an existing policy, and deploy it in time for the client conference call.
Device Guard is not designed to be placed into audit mode for the purposes of supplementing your existing detections. I recently completed a draft blog post where I was going to highlight the benefits of using Device Guard as an extremely simple and effective means to supplement existing detections. After writing the post however, I discovered that it will only log the loading of an image that would have otherwise been blocked once per boot. This is unacceptable from a threat detection perspective because it would introduce a huge visibility gap. I can only assume that Device Guard in audit mode was only ever designed to facilitate the creation of an enforcement policy.
The only interface to the creation and maintenance of Device Guard code integrity policies is the ConfigCI PowerShell module which only works on Windows 10 Enterprise. As not only a PowerShell MVP and a Device Guard expert, I shamefully still struggle with using this very poorly designed module. If I still struggle with using the module, this doesn’t bode well for non-PowerShell and Device Guard experts.
Feel free to highlight precisely why I’m wrong with supporting evidence but I sense I’m one of the few people outside of Microsoft or even inside Microsoft who have supplied documentation on practical use cases for configuring and deploying Device Guard. The utter absence of others within Microsoft or the community embracing Device Guard at least supplies me with indirect evidence that it not a realistic preventative solution at scale. I’ll further note that I don’t feel that Device Guard was ever designed from the beginning as an enterprise security solution. It has the feel that it simply evolved as an extension of Secure Boot policy from the Windows RT era.
While the servicing efforts for PowerShell constrained language mode have been mostly phenomenal, the servicing of other Device Guard bypasses has been inconsistent at best. For example, this generic bypass still has yet to be fixed. There is an undocumented “Enabled:Dynamic Code Security” policy rule option that is designed to address that bypass (which is great that it's finally being address) but it suffers from a bug that prevents it from working as of Win 10 1803 (it fails to validate the trust of the emitted binary because it forgets to actually mark it as trusted). Additionally, Casey Smith’s “SquiblyTwo” bypass was never serviced, opening the door for additional XSL-based bypasses (which I can confirm exist but I can’t talk about at the time of this writing). Rather, it is just recommended that you blacklist wmic.exe. There is also no robust method to block script-based bypasses.
The strategy with maintaining AppLocker moving forward remains ambiguous. AppLocker still benefits to this day by its ability to apply rulesets to user and groups, unlike Device Guard. It also has a slightly better PowerShell module and a GUI.
Any new features in Device Guard are consistently not documented aside from me occasionally diffing code integrity policy schemas across Windows builds. For example, one of the biggest recent feature additions is the “Enabled:Intelligent Security Graph Authorization” policy rule option which is the feature that actually transformed Device Guard from a pure whitelisting solution to that of an application control solution, yet, it has only a single line mentioning the feature in the documentation.
As far as application whitelisting on Windows is concerned, from a user-mode enforcement perspective, staying on top of blocking new, non-PE based code execution vectors remains an intractable problem. Whether it’s the introduction of code execution vectors (e.g. Windows Subsystem for Linux) or old code execution techniques being rediscovered (e.g. the fact that you can embed arbitrary WSH scripts in XSL docs). People like myself, Casey Smith, Matt Nelson, and many others in the industry recognize the inability of vendors and those implementing application whitelisting solutions to keep pace with blocking/detecting signed applications that permit the execution of arbitrary, unsigned code which fundamentally subvert user mode code integrity (UMCI). This is precisely what motivates us to continue our research in identifying those target applications/scripts.
So what is Device Guard good for then?
What I still love about Device Guard is that it’s the only solution that allows you to apply policy to kernel images (even in the very early boot phase). Regardless of the application whitelisting solution, user mode policy configuration, deployment, and maintenance is really difficult. The appeal of driver enforcement is that Windows requires that all drivers be signed, meaning, the creation of signer rules is relatively straightforward and the set of required drivers is far smaller than the set of required user mode code.
Aside from that, I honestly see very little benefit in using Device Guard for user-mode enforcement or detection aside from using it on systems with extremely consistent hardware and software configurations - e.g. point of sale, ATMs, medical devices, etc.
For the record, I still use Device Guard to enforce kernel and user mode rules on my personal computers. I still cringe, however, any time I have to make updates to my policy, particularly, for software that isn’t signed or is inconsistently signed.
Are you admitting that you wasted the past few years dedicating much of your research time to Device Guard?
Absolutely not!!! I try my best to invest in new security technologies as a motivation to research new abuse and subversion opportunities and Device Guard was no exception. It motivated me to take a deep dive into code signing and signature enforcement which resulted in me learning about and abusing all the internals of subject interface packages and trust providers. It also motivated me to identify and report countless Device Guard and PowerShell Constrained Language Mode bypasses all of which not only bypass application whitelisting solutions but represent attacker tradecraft that subvert many AV/EDR solutions.
I also personally have a hard time blindly accepting the opinions of others (even those who are established, respected experts in their respective domains) without personally assessing the efficacy and limitations of a security solution myself. As a result of all my Device Guard research, I now have a very good sense of what does work and what doesn’t work in an application whitelisting solution. I am very grateful for the opportunity that Device Guard presented to motivate me to learn so much more about code signing validation.
What I’m hopeful for in the future
While I don’t see a lot of investment behind Device Guard compared to other security technologies (like Defender and Advanced Threat Protection), I sense that Microsoft is throwing a lot of their weight behind Windows Defender System Guard runtime attestation, some of the details of which are slowly starting to surface which I’m really excited about assuming the attestation rule engine is extended to 3rd parties. This tweet from Dave Weston I can only assume highlights System Guard in action blocking semi-legitimate signed drivers whereas a relatively simple Device Guard policy would have implicitly blocked those drivers.
Conclusion
My intent is certainly not to dissuade people from assessing the feasibility of Device Guard in your respective environment. Rather, I want to be as open and transparent about the issues I’ve encountered over the years working with it. My hope is to ignite an open and honest conversation about how application whitelisting in Windows can be improved or if it’s even a worthwhile investment in the first place.
As a final note, I want to encourage everyone to dive as deep as you can into technology you’re interested in. There are a lot (I can’t emphasize “a lot” enough) of curmudgeons and detractors who will tell you that you’re wasting your time. Don’t listen to them. Only you (and trusted mentors) should dictate the path of your curiosity! I may no longer be the zealous proponent of application whitelisting that I used to be but I could not be more grateful for the incredible technology Microsoft gave me the opportunity to dive into, upon which, I was able to draw my own conclusions.
A statement in the System Programming Guide of the Intel 64 and IA-32 Architectures Software Developer's Manual (SDM) was mishandled in the development of some or all operating-system kernels, resulting in unexpected behavior for #DB exceptions that are deferred by MOV SS or POP SS, as demonstrated by (for example) privilege escalation in Windows, macOS, some Xen configurations, or FreeBSD, or a Linux kernel crash. The MOV SS and POP SS instructions inhibit interrupts (including NMIs), data breakpoints, and single step trap exceptions until the instruction boundary following the next instruction (SDM Vol. 3A; section 6.8.3). Note that debug exceptions are not inhibited by the interrupt enable (EFLAGS.IF) system flag (SDM Vol. 3A; section 2.3). If the instruction following the MOV SS or POP SS instruction is an instruction like SYSCALL, SYSENTER, INT 3, etc. that transfers control to the operating system at CPL < 3, the debug exception is delivered after the transfer to CPL < 3 is complete. OS kernels may not expect this order of events and may therefore experience unexpected behavior when it occurs.
A detailed white paper describes this behavior here.
Sample code is provided on Github for the Windows Operating System to test if you're vulnerable to CVE-2018-8897. You are free to port it to any other operating systems. A precompiled binary (executable) is provided here for accessibility purposes.
One of the most common questions I’m asked is “what programming language(s) should I learn to get into malware analysis/reverse engineering”, to answer this question I’m going to write about the top 3 languages which I’ve personally found most useful. I’ll focus on native malware (malware which does not require …
In this blog post, I’ll be describing
two bugs I found inside the MalwareFox AntiMalware drivers (zam32.sys/zam64.sys)
that allow a non-privileged process to “authenticate” itself with the driver and issue special IOCTLs leading to privilege
escalation.
This process of registration or authentication is used by the driver to know
which processes to trust when receiving a device control request.Normally, these processes should be the
antimalware’s own processes.
A process that is authenticated by the driver can send special IOCTLs
that cannot be sent by other non-authenticated processes. These special IOCTLs can be used to:
-Enable/Disable real-time protection
-Read/Write to raw disk
-Create full access user-mode process handles
-…etc
Registered processes are stored in an array located in the data section
of the driver. In zam64.sys, each element of the array has 0x980 bytes and the
maximum number of elements is 100. An element contains information on the process
such as its PID, its session id and the name of the image file name from the
EPROCESS structure.
During the run-time of the anti-virus only a single process is
registered with the driver, and that is MalwareFox’s own process ZAM.exe, which runs within session
1. There’s also a ZAM.exe process running as
a Windows service but it doesn’t seem to be
registered.
Figure 1 – MalwareFox’s entry in the
registration array
So, by registering our process with the driver, we enable the god-mode
capability to send special IOCTLs and basically make use of them to escalate privileges
on the system.
I have found two ways to do so.
CVE-2018-6593: Register the process
by connecting to the mini-filter communication port:
As shown in the figure below, a default security descriptor is built for
the mini-filter communication port allowing access only to SYSTEM and the
administrators. But right after that, RtlSetDaclSecurityDescriptor
is called with a NULL DACL pointer. This leads to the DACL pointer, that was
setup by FltBuildDefaultSecurityDescriptor,
being overwritten with NULL. As a result, everyone has access to the object.
In addition, the maximum number of connections allowed to the port are
100 even though only a single connection appears to be needed by the
Antimalware.
Figure 2
And here’s what it looks like under Windbg.
Figure 3
The interesting thing here is that when a process connects to the port,
the driver automatically registers it as a trusted process in the array we saw
above. The figure below displays the first and second entries in the array when our process (exploit.exe) is connected to the port.
Figure 4
Our process is now registered and can send special IOCTLs as it pleases.
It turns out, the developers zeroed to DACL pointer of the port’s security descriptor because their own process (ZAM.exe) doesn’t run with administrator privileges and turns at medium IL. This of
course isn’t an excuse to disable all access
checks and from everything we saw until now this is probably an anti-virus you
don’t want on your machine; and this is not all!
CVE-2018-6606: Registering the process
by sending IOCTL 0x80002010
It turns out there’s a straightforward
way to register a process as trusted. Send IOCTL 0x80002010 with a process id
of your choice and voilà the process with
the PID you supplied is now registered and fully trusted by the driver!!!
What the driver fails to do here is check if the requestor process itself
is a registered process. It does check for this when a process sends a special
IOCTL, but it fails to do so if the process wants to register another process
as trusted; rendering all other checks useless.
Thus, all we need to do to register our process is send IOCTL 0x80002010
with our process’s PID.
Figure 5
We can now send any special IOCTLs we want, and we’ll be using IOCTL 0x8000204C to elevate privileges.
Getting SYSTEM
MalwareFox seems to need user-mode full access handles to processes. And
since we saw how its usermode process lacks the necessary privileges, it delegates this task of opening handles to its driver.
IOCTL 0x8000204C is a special IOCTL that must be sent by a registered
process to the driver. The requestor simply provides a PID as an input and gets
a full access handle as an output from kernel-mode; how cool is that for us ?
We use this opportunity to open a full access handle to winlogon.exe,
inject a cmd.exe shellcode and then create a remote thread.
Figure 6
CVE-2018-6593:
CVE-2018-6606:
A video demonstrating the first bug
(CVE-2018-6593):
After executing the binary it prints : "Input Key:" and waits for us to enter the flag. The routine printing the "Input Key:" message is executed at initialization alongside a sub-routine implementing the ptrace anti-debugging trick. Since we're going to debug the binary, I patched the anti-debugging sub-routine's address with nullsub_1.
After setting up remote debugging under IDA and supplying some random input to the binary we see a call to some code that was stored in executable memory.
IDA sometimes has trouble displaying memory under its debugger, so let's setup a manual memory region and set it as an executable 64-bit segment.
Now we should be able to view the entirety of the bytes copied to memory.
In the figure below, the code that is executed starts by checking if the 4th bit of input[0xC] is set. If it's not set, the message ":(" is printed and the process exits.
However, if the bit is set the code proceeds to decrypt the next block and also XOR the subsequent blocks that are still encrypted. (see figure below)
There's also a second test, implemented in some blocks, which involves the NOT instruction (figure below). This means that the 3rd bit of input[0x11] must not be set.
The amount of code executed is huge and doing this manually is impossible. So, we have two options :
1. Either dump the encrypted data, decrypt it statically and then build the flag by automatically reading the disassembly.
2. Automate the IDA debugger to save the index plus the bits that must be set and guarantee that everything will be executed by continually patching ECX in order not to take the JECXZ jump.
Even if the 2nd attempt would take longer to complete, I chose to implement it. If I ever do the first one, I'll be sharing it here too :)
So, what the script below does is create a dictionary where the key is the character's position and the value is an array of bits that must be set. I simply ignore the NOT case, since we only care about the bits that must be set.
For example if the character at index 2 needs to have bits : 0, 4 and 7 set, the dictionary entry would look like this : {2: [1, 16, 80]}
After the process terminates, we proceed to OR the numbers of each array which gives us the flag in the end.
Here's the script that must be executed under IDA to get the flag.
dont_panic - 100 pts + 15 bonus pts ( 19 solves ):
The file is a GO binary. After locating the main function, by stepping in the debugger, I found that the binary expects a command line argument of 42 characters.
For each character it calls a sub-routine sub_47B760 that returns a calculated byte corresponding to the one supplied. This byte is then compared to the one it corresponds to in a hardcoded array of bytes, which clearly represents the encrypted flag.
I didn't really look into how the values are calculated since GO binaries tend to be messy and I didn't really have to do it in order to solve the challenge. The thing is, the program branches to the block that displays the fail message ("Nope") as soon as it finds that one character is wrong. This opens room for brute-forcing since we can brute-force the flag character by character dynamically.
I used python with GDB to do so. Here's the solution script :
full script : here
Fibonacci - 100 pts + 6 bonus pts ( 45 solves ):
This binary is supposed to print the flag directly into the screen. However, it will take a very very long time to print the whole flag since the output is based on the calculation of fibonacci numbers recursively.
For each bit of the encoded flag (length = 33 stored at 00000000004007E0), the fibonacci number of that bit's position is calculated : this means that it will calculate fibonacci values for numbers from 0 to 263.
This is not all. Since the flag needs to be decoded, each call to the fibonacci sub-routine expects a pointer to a bit value which is XORed with a calculated bit from the resulting fibonacci number. Keep in mind that the fibonacci implementation is recursive, and thus we expects this boolean value to be XORed multiple times for greater numbers.
When the fibonacci sub-routine returns to the main function, the corresponding bit of the encrypted flag is XORed with the calculated bit value.
The solution that came in mind is to modify the fibonacci implementation so as to save both the calculated bit value and the resulting fibonacci number for a given number. So instead of recursing and re-calculating the fibonacci number of a previously calculated one (in a previous call for a previous bit of the flag), we simply load the result of the calculation and XOR the current output bit with the one we already saved.
The solution is implemented in the script below. All modifications done to the original function are commented.
Full script : here
We immediately get the flag when we run the program.
Although the majority of botnets still use a basic client-server model, with most relying on HTTP servers to receive commands, many prominent threats now use more advanced infrastructure to evade endpoint blacklisting and be resilient to take-down. In this article I will go through and explain my process of identifying …
As as a seventh and last assignment of the 32-bit Securitytube Linux Assembly Expert, I have been tasked to create a custom shellcode crypter.
The idea behind a crypter, is to encode the shellcode beforehand and decode it at runtime. This process will make the shellcode looks like random values, and thus aiming to bypass AV and IDS detection.
When it comes to cryptography, it is a well-known wise approach to not try to reinvent the wheel and instead use what is available and well tested: this is done to prevent any new weakness or bug to be introduced in a a freshly written crypto-algorithm.
As a sixth assignment of the 32-bit Securitytube Linux Assembly Expert, I had to create three different polymorphic version of shellcodes taken from ShellStorm.
Here is my selection:
Linux x86 execve(“/bin/sh”) - 28 bytes.
Linux x86 iptables flush - 43 bytes.
Linux x86 ASLR deactivation - 83 bytes.
Polymorphism means that we can mutate shellcode, so while keeping the same functionality the signature is different.
If you'd like to follow along, I'll be using system files from Windows x64 10.0.15063 (Creator's Update). All pseudo-source and disassembly is reconstructed from that specific release.
Don't have a kernel debugging environment set up? Don't fret. You can follow our tutorial on how to setup basic kernel debugging using WinDbg and VMware here.
Without further ado, let's begin.
What do these callbacks do?
These callbacks can be used by driver developers to gain notifications when certain events happen. For example, the basic process creation callback, nt!PsSetCreateProcessNotifyRoutine, registers a user-defined function pointer ("NotifyRoutine") that will be invoked by Windows each time a process is created or deleted. As part of the event notification, the supplied handler gets a wealth of information. In our example, this will include the parent process' (if one exists) PID, the actual process' PID, and a boolean value that will let us know if the process is being created or if it's terminating.
Security software leverages these callbacks to be able to carefully inspect code running on the machine.
Divin' deep
The documented APIs
Our investigation has to begin somewhere. What better place than at the start of a documented function? We turn to nt!PsSetCreateProcessNotifyRoutine. MSDN claims that this routine has been around since Windows 2000. Even our friends at ReactOS seem to have implemented this functionality a long time ago. We'll see exactly how (if at all) things have changed in the 17 years from Windows 2000 until now.
The only difference is in the second parameter being passed to nt!PspSetCreateProcessNotifyRoutine. These are effectively flags. In the base case (nt!PsSetCreateProcessNotifyRoutine), these flags can either be 1 or 0 depending on the state of the "Remove" parameter. If "Remove" is TRUE, Flags=1. If "Remove" is FALSE, Flags=0. In the extended case (nt!PsSetCreateProcessNotifyRoutineEx), the flags can take on the value 2 or 3:
Finally, for nt!PsSetCreateProcessNotifyRoutineEx2, these flags will take on the value 6 or 7:
Therefore, one can imply that the flags passed to nt!PspSetCreateProcessNotifyRoutine have this definition:
The undocumented world
nt!PspSetCreateProcessNotifyRoutine is slightly complicated. I've defined it below, but I strongly recommend opening it in another window and following the text to ease understanding.
Luckily for us, a lot of the internal data structures related to callback routines haven't changed since Windows 2000. The trailblazers at ReactOS have been spot-on with their structure definitions so we'll use them, when possible, to avoid duplicating work.
For each callback, there's a global array that can contain up to 64 entries. In our case, the start of this array for process creation callbacks is located at nt!PspCreateProcessNotifyRoutine. Each entry in this array is of type _EX_CALLBACK:
To avoid synchronization problems, nt!ExReferenceCallBackBlock is used which will safely acquire a reference to the underlying callback object, _EX_CALLBACK_ROUTINE_BLOCK (documented below). We can effectively reproduce the same behavior in a non-thread safe way via:
If we're deleting a callback object ("Remove" is TRUE), we need to make sure that we can find the appropriate _EX_CALLBACK_ROUTINE_BLOCK in the array. This is done by checking first if the target "NotifyRoutine" matches that of the current _EX_CALLBACK_ROUTINE with nt!ExGetCallBackBlockRoutine:
Then, we check to see if it's the right type (created with the correct version of (nt!PsSetCreateProcessNotifyRoutine/Ex/Ex2), by using nt!ExGetCallBackBlockContext:
At this point, we've found the entry in the array. We will erase it by setting the _EX_CALLBACK value to NULL via nt!ExCompareExchangeCallback, decrementing the appropriate global counter (nt!PspCreateProcessNotifyRoutineExCount or nt!PspCreateProcessNotifyRoutineCount), dereferencing the _EX_CALLBACK_ROUTINE_BLOCK with nt!ExDereferenceCallBackBlock, waiting for any other code using the _EX_CALLBACK (nt!ExWaitForCallBacks), and finally freeing memory (nt!ExFreePoolWithTag). As you can see, great care is taken by Microsoft to not free a callback object that is in use.
If we can't find the entry to remove in the nt!PspCreateProcessNotifyRoutine array after exhausting all 64 possibilities, the STATUS_PROCEDURE_NOT_FOUND error message is returned.
On the other hand, if we're adding a new entry into the callback array, things are a little easier. A sanity check is performed by nt!MmVerifyCallbackFunctionCheckFlags to ensure that the "NotifyRoutine" is present in a loaded module. This helps avoid unlinked drivers (or shellcode) from receiving callback events:
After we pass the sanity check, an _EX_CALLBACK_ROUTINE_BLOCK is allocated via nt!ExAllocateCallBack. This routine confirms the size and layout of the _EX_CALLBACK_ROUTINE_BLOCK structure:
To wrap up, the newly allocated _EX_CALLBACK_ROUTINE_BLOCK is added to a free (NULL) location in the nt!PspCreateProcessNotifyRoutine array using nt!ExCompareExchangeCallBack (ensuring that it doesn't overflow the 64 limit maximum). Finally, the appropriate global counter is incremented and a global flag is set in nt!PspNotifyEnableMask denoting that there are callbacks of the user-specified type registered on the system.
The other callbacks
Thankfully, thread and image creation callbacks are very similar to process callbacks. They utilize the same underlying data structures. The only difference is that thread creation/termination callbacks are stored in the nt!PspCreateThreadNotifyRoutine array and that image load notification callbacks are stored in nt!PspLoadImageNotifyRoutine.
The script
It's finally time to put what we know to good use. Using WinDbg, we can create a simple script to automagically enumerate process, thread, and image callback routines.
Instead of leveraging WinDbg's built-in scripting engine, I've elected to use something a little less disgusting. There's a great 3rd party extension for WinDbg called PyKd that enables Python scripting in WinDbg. Installing it is very straightforward. You'll need a copy of the appropriate bitness (e.g. 64-bit for 64-bit install of WinDbg) of Python for this to work.
The script should be easy to follow. I tried to document it as best I could. It should also be compatible, at a minimum, with all forms of Windows from XP and up (both 32-bit and 64-bit flavors).
After running the script using the "!py" command, you should see output similar to this:
Final thoughts
Knowing how the callback system functions in Windows allows us to do very interesting things. As seen above, we're able to programmatically iterate through each callback array and discover all registered callbacks. This is very useful for forensic purposes.
Furthermore, these underlying array lists aren't under the protection of PatchGuard. Since registering callbacks is more-or-less a requirement for anti-virus products in order to develop a useful driver that plays nicely with PatchGuard on x64 systems, malware could dynamically disable (or replace) these registered callbacks to thwart security protection solutions. The possibilities are endless.
Special thanks to the folks at ReactOS for their meticulous documentation. In particular, most of the structures I used were identified by Alex Ionescu for ReactOS a long time ago. Additionally, kudos to the folks that make PyKd. It's a much better alternative to the native scripting interface for WinDbg, in my opinion!
As always, if y'all have any questions or comments, please feel free to comment below. Suggestions are greatly appreciated too!
This blog post will go over an assumption made over a decade ago by Microsoft when dealing with software breakpoints that can be used to reveal the presence of most (all publicly available?) usermode and kernelmode debuggers.
The x86 architecture can potentially encode a particular assembly instruction in multiple ways. For example, adding two registers, eax and ebx, and storing the result in eax takes the following mnemonic form: add eax, ebx. This can be encoded as the byte sequence 0x03 0xC3or 0x01 0xD8. Fundamentally, the machine code represents the same assembly operation.
If you're just interested in the anti-debug trick (without any context on why it works the way it does), scroll to the bottom of this post. For the rest of you brave enough to read this article in its entirety... buckle up.
The "long form" of int 3
An int 3 can be encoded as either a single-byte 0xCC or via the more unconventional way as the multi-byte sequence 0xCD 0x03:
So, what happens when Windows encounters a multi-byte int 3? We create a simple C++ program to find out:
After you run this application, you should see output similar to this:
A single-byte int 3 (0xCC) works as expected. The start of the stub is located at 0x000001BE94B90000. When the stub is executed, the exception handler fires and we see that both the _EXCEPTION_RECORD.ExceptionAddress and _CONTEXT.Rip are located at 0x000001BE94B90000. This is the start of the int 3 instruction. Excellent!
The multi-byte int 3 (0xCD 0x03) is located at address 0x000001BE94B90002. When this stub executes, the exception handler proclaims that the _EXCEPTION_RECORD.ExceptionAddress and _CONTEXT.Rip are located at 0x000001BE94B90003. This is in the middle of the int 3 instruction. Why? What went wrong?
The assumption
NOTE: From this point on, all disassembly and pseudo-source is reconstructed from system files that are provided with Windows x64 10.0.15063 (Creator's Update). If you'd like to follow along, make sure you use the same version I'm using!
Microsoft assumes that all int 3's result from the single-byte variant.
This assumption occurs very early during interrupt processing. Namely, when any interrupt occurs, such as when an int 3 is executed by the processor, control is redirected by the CPU to a handler registered in the appropriate position of the IDT (Interrupt Descriptor Table). In Windows, the handler for software breakpoints can be found at the symbol nt!KiBreakpointTrap:
The first thing nt!KiBreakpointTrap does is generate a trap frame (_KTRAP_FRAME) on the stack that it passes to subsequent routines. A definition of this structure can be found below:
Parts of this structure are automatically filled by the CPU when the interrupt fires, in particular, the range from +0x160 (_KTRAP_FRAME.ErrorCode) to +0x188 (_KTRAP_FRAME.SegSs):
The _KTRAP_FRAME is essentially an extension of the elements saved on the stack by the CPU. It's purpose is to provide a place to store volatile registers which can be clobbered when calling into functions that are compiled in C.
A very important thing to note is that the instruction pointer (EIP) saved by the CPU on the stack (_KTRAP_FRAME.Rip) will be set to the instruction immediately following the one that caused entry into the handler. In our scenario, this means that the _KTRAP_FRAME.Rip member will be the instruction following our int 3, which will be ret (0xC3) in the example code above.
After the volatile registers have been saved off, nt!KiBreakpointTrap performs a quick check to see whether the interrupt fired from usermode (ring3) or kernelmode code (ring0). If execution is coming from ring3, a swapgs needs to occur as well as some other bookkeeping with debug registers.
Eventually, control flow will reconvene and the volatile floating point registers will also be stored off into the _KTRAP_FRAME. Before entering into more exception handling logic, the instruction pointer will be extracted from _KTRAP_FRAME.Rip (saved by the CPU upon entering nt!KiBreakpointTrap), decremented by one, and passed as an argument to nt!KiExceptionDispatch. Additionally, the exception code, EXCEPTION_BREAKPOINT (0x80000003), will also be passed in. The prototype for nt!KiExceptionDispatch:
It's important to note that nt!KiExceptionDispatch (like nt!KiBreakpointTrap) is written in hand-ASM. It assumes that ecx contains the exception code, edx is the number of exception parameters (up to 3), r8 contains the address of the exception, r9 is the first exception parameter (if one exists), r10 is the second exception parameter (if one exists), r11 is the third exception parameter (if one exists), and rbp points to a segment in the _KTRAP_FRAME structure (at offset +0x80).
Upon entry of nt!KiExceptionDispatch, the first thing that occurs is the generation of a _KEXCEPTION_FRAME. Whereas the _KTRAP_FRAME was used to store volatile registers, the _KEXCEPTION_FRAME provides a place to save all nonvolatile registers:
nt!KiExceptionDispatch also creates an _EXCEPTION_RECORD structure on the stack. If you've done any error handling in Windows (in either usermode or kernelmode), you'll be familiar with this data structure as it is contained as a child within the _EXCEPTION_POINTERS data structure. We use both of these structures in our example above.
Furthermore, this explains the first part of our mystery, namely, why the _EXCEPTION_RECORD.ExceptionAddress is incorrect. Recall that the _EXCEPTION_RECORD.ExceptionAddress is populated by the 3rd (r8) argument to nt!KiExceptionDispatch. This was passed in from nt!KiBreakpointTrap. This argument is a copy of the _KTRAP_FRAME.Rip member decremented by one.
To figure out where the _CONTEXT.Rip member is populated, we need to go deeper down the rabbit hole.
nt!KiExceptionDispatch will call into nt!KiDispatchException (yes, the ordering of the words are intentionally flipped) passing in the recently created _EXCEPTION_RECORD and _KEXCEPTION_FRAME:
This function will build a _CONTEXT out of the _KTRAP_FRAME and _KEXCEPTION_FRAME by invoking the helper routine KeContextFromKFrame. After the _CONTEXT is created, a check is made against the _EXCEPTION_RECORD.ExceptionCode (received as an argument from nt!KiExceptionDispatch) for STATUS_BREAKPOINT (0x80000003). If it's true, the _CONTEXT.Rip member will be decremented:
This solves the last part of the mystery and causes the value in _CONTEXT.Rip to be tainted.
The anti-debug trick
Knowing what we know about how Windows handles the different types of int 3s, is it possible to leverage this discrepancy in a useful way? The answer is yes.
Debuggers display the state of the program at the time of an exception. Since Windows will incorrectly assume that our int 3 exception was generated from the single-byte variant, it is possible to confuse the debugger into reading "extra" memory. We leverage this inconsistency to trip a "guard page" of sorts.
As we saw in our first example (at the start of the article), when a multi-byte int 3 occurs, the _EXCEPTION_RECORD.ExceptionAddress and _CONTEXT.Rip values will lie in the middle of our multi-byte instruction instead of at the start. This means that the debugger will incorrectly determine that the instruction which threw the software breakpoint begins with the opcode 0x03. Referring to the trusty Intel manual, we can see that this opcode represents a 2-byte add instruction:
What would happen if we positioned our multi-byte int 3 near the end of a page of memory?
When the operating system notifies our attached debugger of the breakpoint exception, the instruction pointer will point to memory that will be misinterpreted as the start of an add (0x03) instruction. This will cause the debugger to disassemble data on the adjacent page (since this instruction is 2 bytes long), and effectively read one byte past our "valid" memory range.
Our trick relies on the fact that Windows, as an optimization, will not commit virtual memory to physical RAM unless it absolutely needs it. That is to say that most memory, especially in usermode, is paged. When memory needs to be made available for use that is not currently in physical RAM, a page fault occurs. To learn more about memory management, check out the following articles on our site: Introduction to IA-32e hardware paging and Exploring Windows virtual memory management.
So, we can detect the memory read on this adjacent page by inspecting the corresponding PTE (Page Table Entry) using the QueryWorkingSetEx API. If the page is resident in our process' working set (e.g. mapped into our process by the debugger), the Valid bit in the _PSAPI_WORKING_SET_EX_BLOCK will be set.
PoC||GTFO
A full example can be found below:
As always, if you have any questions or comments, please feel free to send us a message below. Happy hacking 😎.
Constrained language mode is an extremely effective method of preventing arbitrary unsigned code execution in PowerShell. It’s most realistic enforcement scenarios are when Device Guard or AppLocker are in enforcement mode because any script or module that is not approved per policy will be placed in constrained language mode, severely limiting an attackers ability to execute unsigned code. Among the restrictions imposed by constrained language mode is the inability to call Add-Type. Restricting Add-Type makes sense considering it compiles and loads arbitrary C# code into your runspace. PowerShell code that is approved per policy, however, runs in “full language” mode and execution of Add-Type is permitted. It turns out that Microsoft-signed PowerShell code calls Add-Type quite regularly. Don’t believe me? Find out for yourself by running the following command:
Now, imagine if the following PowerShell module code (pretend it’s called “VulnModule”) were signed by Microsoft:
$Global:Source=@'
public class Test {
public static string PrintString(string inputString) {
return inputString;
}
}
'@
Add-Type-TypeDefinition$Global:Source
Any ideas on how you might influence the input to Add-Type from constrained language mode? Take a minute to think about it before reading on.
Alright, let’s think the process through together:
Add-Type is passed a global variable as its type definition. Because it’s global, its scope is accessible by anyone, including us, the attacker.
The issue though is that the signed code defines the global variable immediately prior to calling to Add-Type so even if we supplied our own malicious C# code, it would just be overwritten by the legitimate code.
Did you know that you can set read-only variables using the Set-Variable cmdlet? Do you know what I’m thinking now?
Weaponization
Okay, so to inject code into Add-Type from constrained language mode, an attacker needs to define their malicious code as a read-only variable, denying the signed code from setting the global “Source” variable. Here’s a weaponized proof of concept:
public static string ToString(string inputString) {
return inputString;
}
}
'@
Import-ModuleVulnModule
[Injected]::ToString('Injected!!!')
A quick note about weaponization strategies for Add-Type injection flaws. One of the restrictions of constrained language mode is that you cannot call .NET methods on non-whitelisted classes with two exceptions: properties (which is just a special “getter” method) and the ToString method. In the above weaponized PoC, I chose to implement a static ToString method because ToString permits me to pass arguments (a property getter does not). I also made my class static because the .NET class whitelist only applies when instantiating objects with New-Object.
So did the above vulnerable example sound contrived and unrealistic? You would think so but actually Microsoft.PowerShell.ODataAdapter.ps1 within the Microsoft.PowerShell.ODataUtils module was vulnerable to this exact issue. Microsoft fixed this issue in either CVE-2017-0215, CVE-2017-0216, or CVE-2017-0219. I can’t remember, to be honest. Matt Nelson and I reported a bunch of these injection bugs that were serviced by the awesome PowerShell team.
Prevention
The easiest way to prevent this class of injection attack is to supply a single-quoted here-string directly to -TypeDefinition in Add-Type. Single quoted string will not expand any embedded variables or expressions. Of course, this scenario assumes that you are compiling static code. If you must supply dynamically generated code to Add-Type, be exceptionally mindful of how an attacker might influence its input. To get a sense of a subset of ways to influence code execution in PowerShell watch my “Defensive Coding Strategies for a High-Security Environment” talk that I gave at PSConf.EU.
Mitigation
While Microsoft will certainly service these vulnerabilities moving forward, what is to prevent an attacker from bringing the vulnerable version along with them?
A surprisingly effective blacklist rule for UMCI bypass binaries is the FileName rule which will block execution based on the filename present in the OriginalFilename field within the “Version Info” resource in a PE. A PowerShell script is obviously not a PE file though - it’s a text file so the FileName rule won’t apply. Instead, you are forced to block the vulnerable script by its file hash using a Hash rule. Okay… what if there is more than a single vulnerable version of the same script? You’ve only blocked a single hash thus far. Are you starting to see the problem? In order to effectively block all previous vulnerable versions of the script, you must know all hashes of all vulnerable versions. Microsoft certainly recognizes that problem and has made a best effort (considering they are the ones with the resources) to scan all previous Windows releases for vulnerable scripts and collect the hashes and incorporate them into a blacklist here. Considering the challenges involved in blocking all versions of all vulnerable scripts by their hash, it is certainly possible that some might fall through the cracks. This is why it is still imperative to only permit execution of PowerShell version 5 and to enable scriptblock logging. Lee Holmes has an excellent post on how to effectively block older versions of PowerShell in his blog post here.
Another way in which a defender might get lucky regarding vulnerable PowerShell script blocking is due to the fact that most scripts and binaries on the system are catalog signed versus Authenticode signed. Catalog signed means that rather than the script having an embedded Authenticode signature, its hash is stored in a catalog file that is signed by Microsoft. So when Microsoft ships updates, eventually, hashes for old versions will fall out and no longer remain “signed.” Now, an attacker could presumably also bring an old, signed catalog file with them and insert it into the catalog store. You would have to be elevated to perform that action though and by that point, there are a multitude of other ways to bypass Device Guard UMCI. As a researcher seeking out such vulnerable scripts, it is ideal to first seek out potentially vulnerable scripts that have an embedded Authenticode signature as indicated by the presence of the following string - “SIG # Begin signature block”. Such bypass scripts exist. Just ask Matt Nelson.
Reporting
If you find a bypass, report it to [email protected] and earn yourself a CVE. The PowerShell team actively addresses injection flaws, but they are also taking making proactive steps to mitigate many of the primitives used to influence code execution in these classes of bug.
Conclusion
While constrained language mode remains an extremely effective means of preventing unsigned code execution, PowerShell and it’s library of signed modules/scripts remain to be a large attack surface. I encourage everyone to seek out more injection vulns, report them, earn credit via formal MSRC acknowledgements, and make the PowerShell ecosystem a more secure place. And hopefully, as a writer of PowerShell code, you’ll find yourself thinking more often about how an attacker might be able to influence the execution of your code.
Now, everything that I just explained is great but it turns out that any call to Add-Type remains vulnerable to injection due to a design issue that permits exploiting a race condition. I really hope that continuing to shed light on these issues, Microsoft will considering addressing this fundamental issue.